Abstract
Background:
Hepatocellular carcinoma (HCC) remains the third leader cancer-associated cause of death globally, but the etiological basis for this complex disease remains poorly clarified. The present study was thus conceptualized to define a prognostic immune-related gene (IRG) signature capable of predicting immunotherapy responsiveness and overall survival (OS) in patients with HCC.
Methods:
Five differentially expressed IRG associated with HCC were established the immune-related risk model through univariate Cox regression and least absolute shrinkage and selection operator (LASSO) regression analyses. Patients were separated at random into training and testing cohorts, after which the association between the identified IRG signature and OS was evaluated using the “survival” R package. In addition, maftools was leveraged to assess mutational data, with tumor mutation burden (TMB) scores being calculated as follows: (total mutations/total bases) × 106. Immune-related risk term abundance was quantified via “ssGSEA” algorithm using the “gsva” R package.
Results:
HCC patients were successfully stratified into low-risk and high-risk groups based upon a signature composed of 5 differentially expressed IRGs, with overall survival being significantly different between these 2 groups in training cohort, testing cohort and overall patient cohort (P = 1.745e-06, P = 1.888e-02, P = 4.281e-07). No association was observed between TMB and this IRG risk score in the overall patient cohort (P = 0.461). Notably, 19 out of 29 immune-related risk terms differed substantially in the overall patient dataset. These risk terms mainly included checkpoints, human leukocyte antigens, natural killer cells, dendritic cells, and major histocompatibility complex class I.
Conclusion:
In summary, an immune-related prognostic gene signature was successfully developed and used to predict survival outcomes and immune system status in patients with HCC. This signature has the potential to help guide immunotherapeutic treatment planning for patients affected by this deadly cancer.
Keywords: hepatocellular carcinoma, immune-related genes, prognostic signature, immune landscape, tumor mutation burden
Introduction
Liver cancer remains the second most prevalent form of cancer-associated death globally,1 and the prognosis of patients with advanced or metastatic hepatocellular carcinoma (HCC) is very poor.2 HCC is the most common liver cancer subtype,3 and is associated with many risk factors including chronic hepatitis B viral infection, chronic hepatitis C viral infection, smoking, alcohol consumption, obesity, diabetes mellitus, and a range of other metabolic and autoimmune diseases.4 Different treatments are selected for HCC patients including resection, ablation, hepatic transplantation, transarterial chemoembolization or transarterial radioembolization, systemic treatment, or palliative care as per the Barcelona Clinic Liver Cancer.5,6 As it can eliminate any underlying disease while maintaining organ function, hepatic transplantation is the optimal treatment for HCC patients.7,8 However, the number of livers available for transplantation is limited, and this treatment can be expensive and associated with risks of immune-mediated transplant rejection. Important, such transplantation often fails to improve patient quality of life or to prolong survival.9,10 The development of novel immunotherapeutic treatment modalities for HCC has, in contrast, offered a promising clinical approach to enhancing patient prognosis.11,12 There is some evidence to suggest that antitumor immune responses are generally inhibited in HCC patients as the liver typically provides a tolerogenic and immunosuppressive microenvironement.13 As such, immunotherapeutic interventions represent an attractive approach to treating HCC, with immune checkpoint inhibitors specific for PD-1/PD-L1 and CTLA4 being the most promising such approaches.12 Other researchers have also proposed the adoptive transfer of in vitro-expanded neoantigen-specific T cells or the application of neoantigen-specific tumor vaccines as alternative strategies well-suited to preventing or treating HCC.14,15 However, as HCC is a complex disease, the specific molecular mechanisms governing its onset and progression remain poorly understood.16
The present study was conceptualized with the goal of identifying a signature of differentially expressed (DE) immune-related genes (IRGs) associated with HCC patient prognosis in order to reliably gauge patient outcomes and to guide patient treatment. After developing this IRG risk signature, we then compared its relationship with key clinical characteristics (age, sex, grade, stage, TNM classification) and patient overall, disease-free, and progression-free survival (OS, DFS, and PFS, respectively). We also assess the relationship between this IRG signature and immune cell infiltration, immune signaling activity, and tumor mutational burden (TMB) in HCC. Together, we believe that our IRG risk signature may represent a valuable and comprehensive approach to guiding precision immunotherapy treatment for patients with this deadly form of liver cancer.
Materials and Methods
Data Collection
HCC patient clinical information, mutation profiles, and mRNA expression data were downloaded from The Cancer Genome Atlas (TCGA; https://portal.gdc.cancer.gov/). IRGs were identified using the Immunology Database and Analysis Portal (ImmPort) database (https://immport.niaid.nih.gov), enabling us to identify genes associated with key immunological processes.17
Differentially Expressed IRG Identification
Key HCC-related DE genes were identified by using the edgeR package to compare gene expression profiles in 374 tumor and 50 healthy control samples.18 DE genes were identified using the following criteria: false discovery rate (FDR) < 0.05, |log2 (fold change [FC])| > 1.19 DE IRGs were then identified by assessing the overlap between this DE gene list and the abovementioned list of IRGs.
Functional Enrichment Analyses
To explore the mechanisms whereby the 353 identified DE IRGs may influence HCC patient outcomes, Gene Ontology (GO) and Kyoto Encyclopedia of Genes and Genomes (KEGG) functional enrichment analyses were conducted with the “cluterprofile” R package.20 The top 15, 10, and 15 biological process (BP), cellular component (CC), and molecular function (MF) GO terms, respectively, and the top 30 KEGG pathways with an FDR < 0.05 were identified as being significant using the “ggplot2” R package.21
Immune-Related Risk Signature Construction and Validation
In order to construct and validate a reliable immune-related model for the evaluation of HCC patient prognosis, the “caret” R package was used to randomize patients into a training cohort (n = 169) and a testing cohort (n = 168). Data pertaining to 37 of the patients were omitted from these analyses due to an absence of clinical data (n = 3), a lack of survival data (n = 1), a survival time of 0 (n = 5), a lack of tumor grade information (n = 5), a lack of stage information (n = 21), a lack of T stage information (n = 1), or a lack of N stage information (n = 1). Our immune-related risk signature was first developed by assessing the relationship between DE IRGs and patient OS in the training cohort,22 after which the prognostic value of this model was confirmed in the testing cohort. A univariate Cox proportional hazard regression analysis was employed to evaluate associations between individual DE IRGs and patient OS in the training cohort. Those DE IRGs which were significant in this initial analysis (P < 0.05) were then incorporated into a least absolute shrinkage and selection operator (LASSO)-penalized Cox proportional hazards regression model to identify an optimal risk signature model without the risk of overfitting using the “glmnet” R package.23 Risk signature scores were defined as follows: Risk score = expression of Gene 1 × coefficient + expression of Gene 2 × coefficient +…expression of Gene n × coefficient.24 These scores were individually calculated in the training, testing, and overall cohorts, with samples being separated into high- and low-risk groups using the median risk score in the training cohort as a cut-off value. The “timeROC” R package was used to validate the prognostic utility of this immune-related risk signature by assessing the area under the curve (AUC).25 In addition, Kaplan-Meier curves were used to compare the OS of high- and low-risk patients stratified as above using the “survival” R package.26
Evaluation of the Association Between Immune-Related Risk Signatures and HCC Patient Prognosis
To validate the association between the developed IRG risk score and HCC patient prognosis, Kaplan-Meier survival curves were used to compare the PFS and DFS of low- and high-risk patients in the overall cohorts. In addition, correlations between patient age, sex, grade, stage, TNM status, and immune-related risk scores were assessed in the overall patient cohort.
Mutation Analysis
HCC patient somatic variant data stored in the mutation annotation format (MAF) were downloaded from TCGA and analyzed using maftools.27 TMB scores were calculated for each patient as follows: (total mutation/total covered bases) × 106.28
ssGSEA Analysis
The associations between immune cell infiltration, immune pathway activity, immune functionality, and immune-related risk signatures were assessed with the ssGSEA program to establish immune-related term enrichment scores. The ssGSEA function in the “gsva” R package was used to quantify immune cell infiltration.29 Both innate and adaptive immune cell types were included in these analyses of ssGSEA gene signatures.30 Scores corresponding to 29 different immune-related terms were determined for all HCC patients. HLA and immune checkpoint gene expression levels were assessed in high- and low-risk patient groups. The “vioplot” R package was also used to visualize differences in the distributions of immune-related terms in the low- and high-risk patient groups from the overall cohort.
Statistical Analysis
All statistical analyses were conducted using Rstudio (v.3.6.1). Continuous data are given as medians or as means ± SE. Receiver operating characteristic (ROC) curves were used to assess the prognostic accuracy of developed immune-related risk signatures in HCC patients. The area under the ROC curve (AUC) was calculated with the “timeROC” R package, while patient survival outcomes were analyzed using Kaplan-Meier curves and log-rank tests with the “survival” R package. Data were compared using χ2 test, with a 2-sided P < 0.05 as the significance threshold.
Results
DE IRG Identification
We began by downloading HCC patient clinical and gene expression data from TCGA (374 tumor samples, 50 control samples). HCC patients were then randomized into training and testing cohorts, with no significant differences in measured clinical variables being observed between these 2 cohorts (P > 0.05; Table 1).
Table 1.
Clinical Variables in the Training and Testing Sets.
| Variables | Group | Total set (n = 337) | Training set (n = 169) | Testing set (n = 168) | Method | P value |
|---|---|---|---|---|---|---|
| Survival time(days) | 792.37 ± 40.118* | 767.83 ± 56.463 | 817.05 ± 57.115 | t-test | 0.540 | |
| Vital status | dead | 110(32.6%) | 55(32.5%) | 55(32.7%) | Chi-Square test | 0.970 |
| Alive | 227(67.3%) | 114(67.5%) | 113(67.3%) | |||
| pathologic grade | G1 | 45(13.3%) | 21(12.4%) | 24(14.3) | Chi-Square test | 0.874 |
| G2 | 166(49.3%) | 84(49.7%) | 82(48.8%) | |||
| G3 | 114(33.8%) | 59(34.9%) | 55(32.7%) | |||
| G4 | 12(3.6%) | 5(3%) | 7(4.1%) | |||
| Clinical stage | I | 168(49.8%) | 82(48.5%) | 86(51.1%) | Chi-Square test | 0.942 |
| II | 82(24.3%) | 41(24.2%) | 41(24.4%) | |||
| III | 83(24.6%) | 44(26%) | 39(23.2%) | |||
| IV | 4(1.1%) | 2(1.2%) | 2(1.2%) | |||
| T stage | T1 | 170(50.4%) | 82(48.5%) | 88(52.4%) | Chi-Square test | 0.303 |
| T2 | 83(24.6%) | 42(24.9%) | 41(24.4%) | |||
| T3 | 74(21.9%) | 37(21.9%) | 37(22%) | |||
| T4 | 10(3%) | 8(4.7%) | 2(1.2%) | |||
| N stage | N0 | 247(73.3%) | 120(71%) | 127(75.6%) | Chi-Square test | 0.249 |
| N1 | 4(1.1%) | 1(0.6%) | 3(1.8%) | |||
| NX | 86(25.5%) | 48(28.4%) | 38(22.6%) | |||
| M stage | M0 | 258(76.5%) | 124(73.3%) | 134(79.7%) | Chi-Square test | 0.411 |
| M1 | 3(0.9%) | 2(1.2%) | 1(0.6%) | |||
| MX | 76(22.6%) | 43(25.4%) | 33(19.6%) | |||
| Age | <65 | 207(61.4%) | 103(60.9%) | 104(61.9%) | Chi-Square test | 0.857 |
| ≥65 | 130(38.6%) | 66(39%) | 64(38%) | |||
| Gender | Male | 230(68.2%) | 110(65%) | 120(71.4%) | Chi-Square test | 0.211 |
| Female | 107(31.8%) | 59(34.9%) | 48(28.5%) |
* The data are presented as mean ± SE. MX: unknown M stage, NX: unknown N stage.
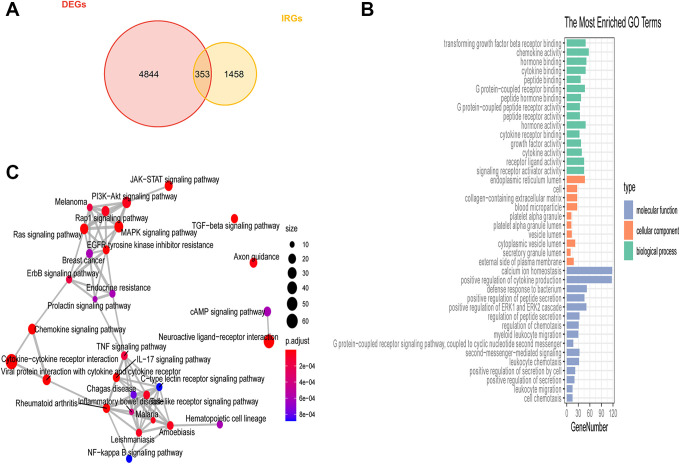
DE genes (P < 0.05, |log2 [fold change]| > 1) associated with HCC were next identified using the edgeR package, leading to the identification of 5197 total DE genes of which 3968 and 1229 were up- and down-regulated in HCC patient samples, respectively. Furthermore, we identified 1881 IRGs based upon a gene list obtained from ImmPort. By comparing these 2 gene lists, we ultimately identified 353 DE IRGs that were represented on both of these gene lists (Figure 1A). Enrichment analyses of these DE IRGs were next performed (Figure 1B), with the top immune-related functions enriched for these genes including the following: “signaling receptor activator activity,” “cytokine activity,” “growth factor activity,” “cytokine receptor binding,” “transforming growth factor-beta receptor binding.” The top KEGG pathways mainly enriched for these DE IRGs included “JAK-STAT signaling pathway,” “TNF signaling pathway,” “Cytokine-cytokine receptor interaction,” “NF-kappa B signaling pathway.” “Toll-like receptor signaling pathway,” and “EGFR tyrosine kinase inhibitor resistance” (Figure 1C).
Figure 1.
Differentially expressed immune-related gene identification. (A) DE IRGs associated with liver cancer were identified using a Venn diagram to analyze the intersection between the DE gene and IRG datasets. (B) GO analysis results. (C) The top 6 most significantly enriched KEGG pathways.
Construction and Validation of a Prognostic Immune-Related Gene Signature
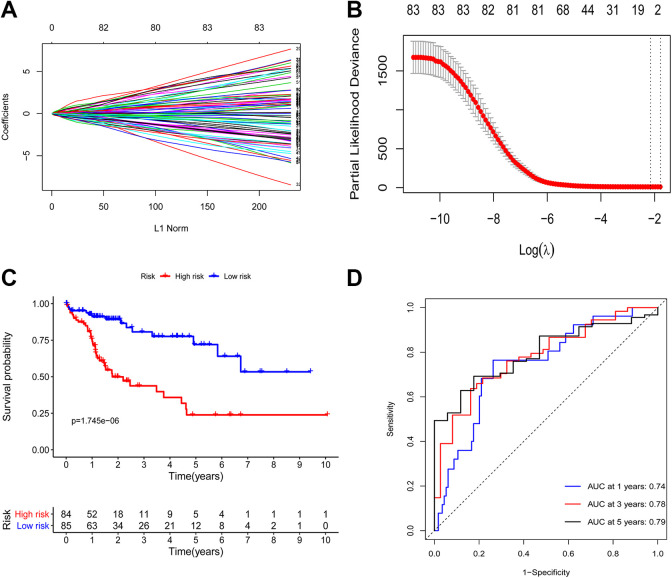
A univariate Cox regression analysis was next conducted in order to identify DE IRGs that were significantly associated with HCC patient OS in the training cohort. In total, 83 of these DE IRGs were ultimately found to be significantly associated with the survival of these patients (P < 0.05). A LASSO regression analysis of these 83 genes was next conducted to lower the risk of model overfitting, ultimately leading to the identification of 5 key survival-related DE IRGs (Figure 2A and B). These IRGs and their corresponding regression coefficient values were then used to establish the following prognostic model score: Risk score = (0.04407 × NR0B1) + (–0.06788 × NR3C2) + (0.03542 × SPP1) + (–0.04658 × ANGPTL1) + (–0.00847 × PGLYRP2). Two of these 5 DE IRGs were associated with elevated risk (NR0B1, SPP1; Coef > 0), whereas 3 were protective genes associated with decreased risk (NR3C2, ANGPTL1, PGLYRP2; Coef <0).
Figure 2.
Development of a prognostic immune-related risk signature associated with HCC patient outcomes. (A-B) Using LASSO regression analyses, 5 genes associated with HCC patient OS were identified, and 10-round cross-validation was conducted to avoid overfitting. (C) High- and low-risk HCC patient OS was evaluated using Kaplan–Meier curves. (D) Time-dependent ROC analyses of the identified immune-related risk signature in the training cohort.
This risk scoring methodology was used to score all samples. Median risk score values in the training cohort were used to separate patients into low-risk (n = 85) and high-risk (n = 84) patient cohorts. This same cutoff value was used to separate patients in the testing cohort into low-risk (n = 94) and high-risk (n = 74) groups. In the training cohort, the OS of patients in the low-risk group was significantly longer than that of patients in the high-risk group (P = 1.745e-06; Figure 2C) with 1-, 3-, and 5-year AUC values of 0.74, 0.78, and 0.79, respectively (Figure 2D).
Assessment of the Prognostic Utility of This Immune-Related Risk Signature
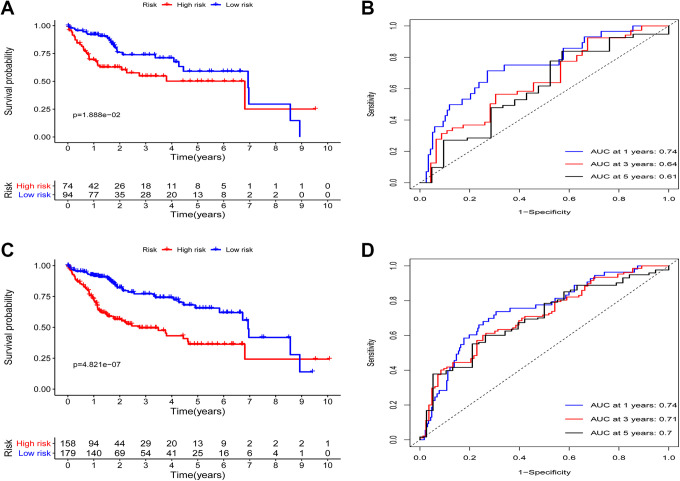
We next used the developed immune-related prognostic model to analyze the testing and total patient cohorts in order to validate the predictive value of this model. The OS of patients in the low-risk group was significantly longer than that of patients in the high-risk group (P = 1.888e−02; Figure 3A), with 1-, 3-, and 5-year OS AUC values of 0.74, 0.64, and 0.61, respectively (Figure 3B). Using the same cut-off score, similarly found that high-risk patients in the overall patient cohort exhibited a significantly shorter OS relative to low-risk patients in this cohort (P = 4.821e-07; Figure 3C), with 1-, 3-, and 5-year AUC values of 0.74, 0.71, and 0.7, respectively (Figure 3D).
Figure 3.
Immune-related risk signature validation. (A) High- and low-risk liver cancer patient OS was evaluated in the testing cohort. (B) A time-dependent ROC analysis of the immune-related risk signature in the testing cohort. (C) The OS of high- and low-risk liver cancer patients was assessed via Kaplan–Meier curve analyses in the overall cohort. (D) A time-dependent ROC analysis of the immune-related risk signature in the overall cohort.
The Relationship between Immune-Related Risk Scores and Patient Prognosis
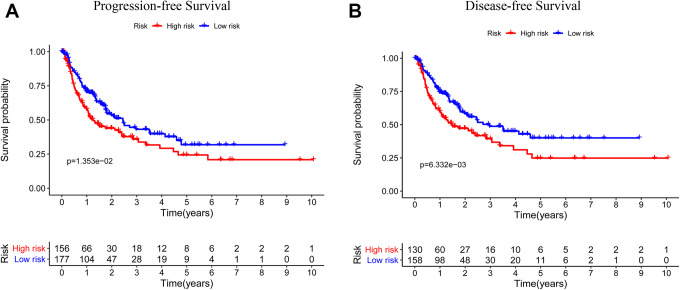
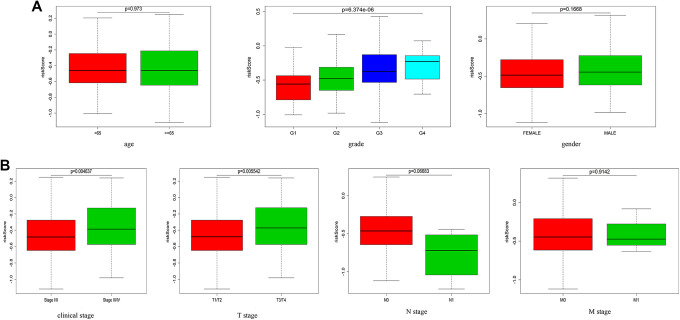
We next assessed the relationship between these immune-related risk scores and HCC patient age, sex, pathologic stage, TNM status, DFS, and PFS in this TCGA dataset. In the overall patient cohort, we found that PFS and DFS different significantly between low- and high-risk patients in the overall cohort (P = 1.353e-02, P = 6.332e-03; Figure 4A and B). These findings suggested that high-risk patients were more likely to suffer from tumor progression and to exhibit reduced DFS relative to low-risk patients. We also examined the differences in patient age, gender, pathologic stage, and TNM status between low- and high-risk patient groups. The grade, clinical stage and T stage were significantly differences in high-risk cohort relative to low-risk cohort. (P = 6.374e-06, P = 0.004637, P = 0.005542; Figure 5A and B).
Figure 4.
Correlations between immune-related risk signatures and liver cancer patient PFS and DFS. (A) The PFS of high- and low-risk liver cancer patients in the overall patient cohort was assessed using Kaplan-Meier curves. (B) The DFS of high- and low-risk liver cancer patients in the overall patient cohort was assessed using Kaplan-Meier curves.
Figure 5.
The association between immune-related risk signatures and HCC patient clinical characteristics. (A, B) Differences in risk scores as a function of patient age, sex, clinical stage, T stage, N stage, and M stage were assessed.
The Association Between Immune-Related Risk Scores and HCC Patient TMB
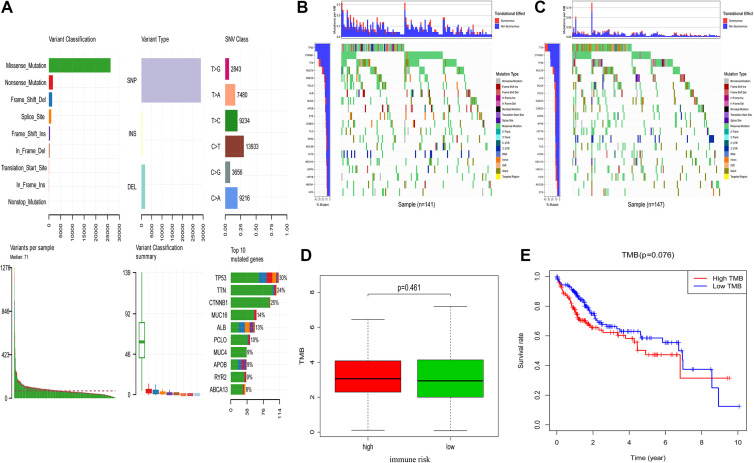
Mutational data corresponding to 327 HCC patients within the present sample cohort was next analyzed and used to calculate TMB scores (Figure 6A). Risk scores were used to stratify these patients into high-risk (n = 154) and low-risk (n = 173) groups as above. Mutations and mutation frequencies in the top 20 genes were then assessed in the training cohort (Figure 6B) and the testing cohort (Figure 6C). However, no significant relationship was observed between these immune-related risk score values and patient TMB scores (P = 0.461; Figure 6D). These 327 patients were additionally stratified into high-TMB score (n = 164) and low-TMB score (n = 163) groups based upon median TMB score values. However, OS did not differ significantly between these 2 groups (P = 0.076; Figure 6E). These data thus suggested that immune-related risk signature scores were unrelated to TMB in HCC patients.
Figure 6.
High- and low-risk HCC patient mutation profiles and TMB values. (A) Summarized mutational data from 327 patients. (B, C) Mutational frequencies in the top 20 genes in the training and testing cohorts. (D) The relationship between immune-related risk scores and TMB. (E) The OS of high- and low-risk TMB liver cancer patient groups was assessed using Kaplan-Meier curves.
The Association Between Immune-Related Risk Scores, Immune Cell Infiltration, and Immune Pathway Activation
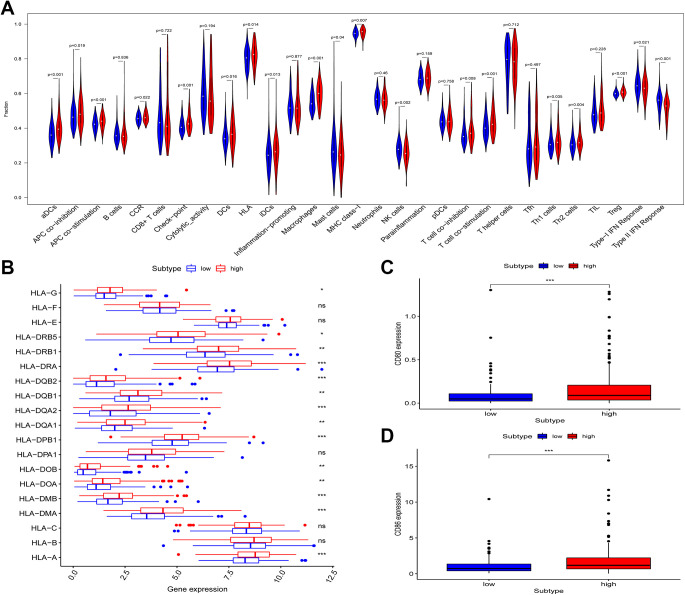
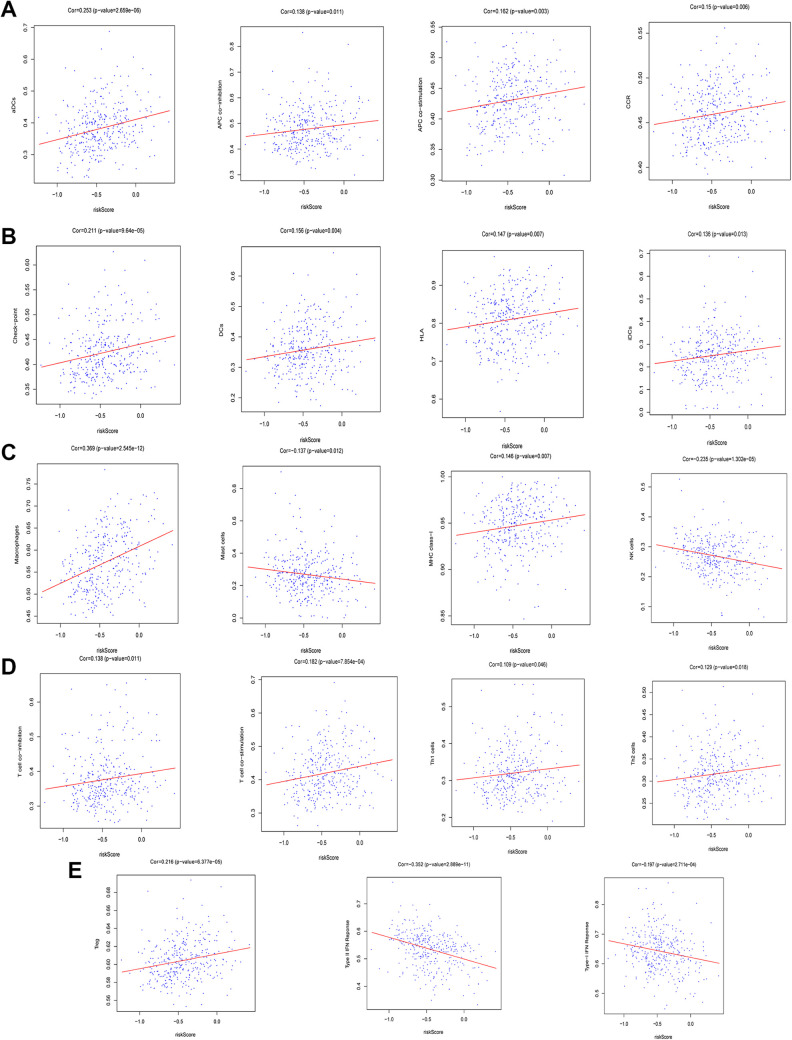
Lastly, we explored the association between the developed immune-related risk signature and immune-related cell infiltration, immune-related pathway activity, and immune functionality in HCC patients via ssGSEA analyses of HCC patient transcriptomic data. Immune cells that infiltrate the HCC tumor microenvironment (TME) play diverse roles in modulating anti-tumor immune responses.30 In total, 29 different immune-related terms were incorporated into this analysis in order to evaluate immune cell infiltration in these HCC patients in a comprehensive fashion. In total, 19 of these 29 terms differed significantly between the high- and low-risk groups in the overall patient cohort (Figure 7A). Notably, the expression of HLA family genes, CD80, and CD86 were significantly increased in high-risk HCC patients relative to low-risk HCC patients (Figure 7B-D). In addition, immune-related risk scores were significantly positively correlated with many immune-related terms and cell types, including checkpoints, natural killer (NK) cells, HLA, and mast cells (Figure 8A-E). These findings may thus offer insight into the predictive utility of our immune risk model.
Figure 7.
The relationship between immune-related risk signatures, immune cell infiltration, and immune functionality in liver cancer patients. (A) The relative enrichment of 29 immune-related risk terms in high- and low-risk liver cancer patients. (B) HLA family gene expression in high- and low-risk liver cancer patients. (C-D) CD80 and CD86 expression levels in low- and high-risk liver cancer patients.
Figure 8.
The association between immune-related risk scores and 19 differentially expressed immune-related terms.
Discussion
Herein, we developed and validated a novel immune-related risk signature that could be effectively used to gauge HCC patient prognosis. This signature may also offer prognostic value as a means of predicting the treatment responses of patients. In this study, we aimed to evaluate the relationship between immune cell infiltration and a prognostic IRG signature in HCC patients.
HCC remains a leading cause of cancer-associated death, and patients with advanced-stage disease cannot be effectively treated via traditional or combination chemotherapy approaches.31 The tumor immune microenvironment (TIME), however, has recently been found to be a key determinant of HCC progression,32-34 and immunotherapeutic agents have increasingly been used to treat advanced-stage HCC patients.35,36 Immunotherapy, however, only achieves long-turn durable anti-tumor efficacy in a limited subset of HCC patients.37 As the immunological mechanisms governing HCC onset and progression are still incompletely understood, optimal treatment modalities are not administered to many patients due to a lack of robust patient stratification techniques.35,38 It is thus essential that immune-related biomarkers capable of predicting HCC patient survival and treatment outcomes be identified to guide appropriate patient care.
In the present study, we began by identifying 5 key survival-associated IRGs in a randomly selected HCC patient training cohort via univariate Cox and LASSO regression analyses. These 5 DE IRGs were then used to develop an immune-related risk score model that was successfully used to separate HCC patients into high- and low-risk groups with statistically significant differences in OS outcomes in both the training, testing and overall cohorts. This prognostic signature was also significantly associated with T stage, clinical stage, and grade. Consistent with these associations, we also found that clinical stage (I, II/III, IV), T stage (T1, T2/T3, T4), and tumor grade (G1/G2/G3/G4) all exhibited significant prognostic utility in these HCC patients. Many studies to date have identified immune-related biomarkers associated with cancer patient prognosis, but few such studies have specifically focused on IRGs capable of predicting HCC patient OS. As such, the immune-related risk scoring model established in this study offers value as a novel tool for the prediction of HCC patient outcomes.
We conducted GO and KEGG functional enrichment analyses of these 353 identified DE IRGs. Top KEGG pathways enriched for these DE IRGs, included the JAK-STAT, TNF, cytokine-cytokine receptor, NF-κB, Toll-like receptor, and EGFR tyrosine kinase inhibitor resistance signaling pathways. As all of these pathways were associated with a poor HCC patient prognosis, they may offer insight into the molecular basis for the predictive value of this risk score model.
Mutation analyses were also conducted as a means of exploring the molecular basis for this prognostic risk signature. However, no differences in tumor mutation status were observed between HCC patients with low and high immune-related risk scores. TMB has previously been reported to impact tumor immune cell infiltration and to predict immunotherapeutic responses. In the present patient cohort, no significant differences in TMB values were observed when comparing the low-risk and high-risk patient groups. Furthermore, no significant differences were observed when comparing the OS of patients with low TMB scores to those with high TMB scores. As such, our data do not support the existence of any relationship between our immune-related risk score model and HCC patient TMB.
Individual genes can regulate the interplay between tumors and immune cells, leading to microenvironmental changes that enable tumors to evade immune detection.39,40 As such, we employed a ssGSEA analytical approach to evaluate the relationship between our immune-related risk score model and 29 key immunity-related terms. Of these terms, 19 were found to differ significantly between low- and high-risk patients. Of these terms, those related to immune checkpoints, HLA expression, and NK cells were of particular interest.
Many research efforts have sought to leverage the intrinsic anti-tumor activity of NK cells in order to treat cancer. Indeed, preclinical studies have found that NK cells and T cells are able to kill HCC tumor cells in vitro, and there are many factors in HCC microenvironments contribute to reduced intratumoral NK cell function.41-43 We found that high-risk HCC patients exhibited significantly reduced NK cell infiltration relative to low-risk patients (P = 0.002). This reduced NK cell infiltration likely contributes to the immune evasion and progression of this cancer type, potentially explaining the differences in survival outcomes between these 2 risk groups.
HLA-I and HLA-II molecules are used by the immune system to present endogenous and exogenous antigens, respectively. HLA-I expression is observed on all nucleated cells, but these expression levels or presentation profiles can be disrupted in pathological settings. When the peptides presented by these HLA proteins are altered as a consequence of disease or mutation, they can serve as autoantigens that target cells for immune rejection.44-47 We found that the enrichment frection of HLA was significantly increased in high-risk HCC patients relative to low-risk patients (P = 0.014). In addition, it shown that expression of most HLA family genes was notably increased in high-risk HCC patients than low-risk patients in Figure 7A. As such, the increased expression of these HLA molecules on tumor cell surfaces may impair their recognition by the immune system, thus preventing their rejection and thereby explaining the differences in survival outcomes between these patient groups.
Immune checkpoint inhibitors are among the most promising immunotherapies developed to date,48 as they have been leveraged to effectively treat many cancers including melanoma as well as lung, liver, renal, and head and neck cancers.49-51 Immune checkpoint molecules normally serve to restrain immune responses in normal physiological and pathological contexts.52,53 However, abnormal immune checkpoint marker expression can drive the onset or progression of many diseases.54 When these checkpoint molecules are overexpression, immune functionality may be suppressed. In contrast, insufficient expression of these checkpoint inhibitors can lead to unrestrained and deleterious immune reactivity.55-58 We observed significant increases in the expression of CD80 and CD86 in high-risk HCC patients in the present TCGA cohort relative to low-risk patients (P < 0.001). Both CD80 and CD86 proteins on HCC cells can interact with CTLA-4 on the surface of tumor-infiltrating T cells, suppressing T cell responses and allowing tumors to evade immune-mediated elimination. Given these findings, future studies assessing the relationship between our immune-related risk score model and patient responses to checkpoint inhibitor therapy may be of significant clinical value.
There are many limitations to the present analysis. For one all data used in this study were obtained from TCGA. While patients were randomized into training and testing cohorts, this internal validation approach is of only limited value. Future external validation will be essential in order to confirm and expand upon these findings as a means of developing clinically valuable prognostic risk score models. Furthermore, the HCC cohort used in the present study did not include any comparisons of patients that underwent immunotherapy and patients that underwent traditional therapies. We were thus unable to assess the relationship between our immune-related gene signature and patient immunotherapy responses. In addition, our evaluations of the correlations between immune-related gene expression and HCC patient clinical characteristics were not exhaustive. As such, future studies of the association between this IRG risk signature and criteria such as Barcelona Clinic Liver Cancer staging and Child-Pugh grading will be essential. In light of these limitations, the DE IRG signature developed in the present study is of only limited clinical utility at present and requires extensive validation.
Conclusions
In summary, in the present study we developed a novel prognostic immune-related risk score that can reliably be used to gauge HCC patient prognosis and to guide the immunotherapeutic treatment of these patients. Our data suggest that the 5 DE IRGs identified in this study may serve as valuable biomarkers of HCC patient outcomes.
Footnotes
Authors’ Note: There are no human subjects in this article and informed consent is not applicable.
Declaration of Conflicting Interests: The author(s) declared no potential conflicts of interest with respect to the research, authorship, and/or publication of this article.
Funding: The author(s) disclosed receipt of the following financial support for the research, authorship, and/or publication of this article: This study was supported by the Anhui Province Science Foundation for Youths (1808085QH288), the University Top-Notch Talent Cultivation Project (gxbjZD28).
ORCID iD: Zheng Lu, PhD  https://orcid.org/0000-0002-9090-0875
References
- 1.Torre LA, Bray F, Siegel RL, Ferlay J, Lortet-Tieulent J, Jemal A. Global cancer statistics. CA Cancer J Clin. 2012;65(2):87–108. doi:10.3322/caac.21262 [DOI] [PubMed] [Google Scholar]
- 2.Roderburg C, Wree A, Demir M, Schmelzle M, Tacke F. The role of the innate immune system in the development and treatment of hepatocellular carcinoma. Hepat Oncol. 2020;7(1):HEP17. doi:10.2217/hep-2019-0007 [DOI] [PMC free article] [PubMed] [Google Scholar]
- 3.Nault J-C, Villanueva A. Biomarkers for hepatobiliary cancers. Hepatology. 2020. doi:10.1002/hep.31175 [DOI] [PubMed] [Google Scholar]
- 4.Vecchia CL, Zhang Z-F. Worldwide incidence of hepatocellular carcinoma cases attributable to major risk factors. Eur J Cancer Prev. 2018;27:205–212. doi:10.1097/cej.0000000000000428 [DOI] [PMC free article] [PubMed] [Google Scholar]
- 5.Amorim J, França M, Perez-Girbes A, Torregrosa A, Martí-Bonmatí L. Critical review of HCC imaging in the multidisciplinary setting: treatment allocation and evaluation of response. Abdom Radiol (NY). 2020;45(10):3119–3128. doi:10.1007/s00261-020-02470 -1 [DOI] [PubMed] [Google Scholar]
- 6.Tsui Y-M, Chan L-K, Ng IO-L. Cancer stemness in hepatocellular carcinoma: mechanisms and translational potential. Br J Cancer. 2020;122(10):1428–1440. doi:10.1038/s41416-020-0823-9 [DOI] [PMC free article] [PubMed] [Google Scholar]
- 7.Lingiah VA, Niazi M, Olivo R, Paterno F, Guarrera JV, Pyrsopoulos NT. Liver transplantation beyond Milan criteria. J Clin Transl Hepatol. 2020;8(1):69–75. doi:10.14218/jcth.2019.00050 [DOI] [PMC free article] [PubMed] [Google Scholar]
- 8.Dreher C, Linde P, Boda-Heggemann J, Baessler B. Radiomics for liver tumours. Strahlenther Onkol. 2020;196(10):888–899. doi:10.1007/s00066-020-01615-x [DOI] [PMC free article] [PubMed] [Google Scholar]
- 9.Ghafouri-Fard S, Esmaeili M, Taheri M, Samsami M.Highly upregulated in liver cancer (HULC): an update on its role in carcinogenesis. J Cell Physiol. 2020;235(12):9071–9079. doi:10.1002/jcp.29765 [DOI] [PubMed] [Google Scholar]
- 10.Wang G, Wang Q, Liang N, et al. Oncogenic driver genes and tumor microenvironment determine the type of liver cancer. Cell Death Dis. 2020;11(5):313, doi:10.1038/s41419-020-2509-x [DOI] [PMC free article] [PubMed] [Google Scholar]
- 11.Sällberg M, Pasetto A. Liver, tumor and viral hepatitis: key players in the complex balance between tolerance and immune activation. Front Immunol. 2020;11:552. doi:10.3389/fimmu.2020.00552 [DOI] [PMC free article] [PubMed] [Google Scholar]
- 12.Nakano S, Eso Y, Okada H, Takai A, Takahashi K, Seno H. Recent advances in immunotherapy for hepatocellular carcinoma. Cancers (Basel). 2020;12(4):775. doi:10.3390/cancers12040775 [DOI] [PMC free article] [PubMed] [Google Scholar]
- 13.Dong L-Q, Peng L-H, Ma L-J, et al. Heterogeneous immunogenomic features and distinct escape mechanisms in multifocal hepatocellular carcinoma. J Hepatol. 2020;72(5):896–908. doi:10.1016/j.jhep.2019.12.014 [DOI] [PubMed] [Google Scholar]
- 14.Lu L, Jiang J, Zhan M, et al. Targeting neoantigens in hepatocellular carcinoma for immunotherapy: a futile strategy? Hepatology. 2020. doi:10.1002/hep.31279 [DOI] [PubMed] [Google Scholar]
- 15.Malmberg K-J, Carlsten M, Björklund A, Sohlberg E, Bryceson YT, Ljunggren H-G. Natural killer cell-mediated immunosurveillance of human cancer. Semin Immunol. 2017;31:20–29. doi:10.1016/j.smim.2017.08.002 [DOI] [PubMed] [Google Scholar]
- 16.Sindhi R, Rohan V, Bukowinski A, et al. Liver transplantation for pediatric liver cancer. Cancers (Basel). 2020;12(3):720. doi:10.3390/cancers12030720 [DOI] [PMC free article] [PubMed] [Google Scholar]
- 17.Bhattacharya S, Andorf S, Gomes L, et al. ImmPort: disseminating data to the public for the future of immunology. Immunol Res. 2014;58(2-3):234–239. doi:10.1007/s12026-014-8516 -1 [DOI] [PubMed] [Google Scholar]
- 18.Robinson MD, McCarthy DJ, Smyth GK. edgeR: a bioconductor package for differential expression analysis of digital gene expression data. Bioinformatics. 2010;26(1):139–140. doi:10.1093/bioinformatics/btp616 [DOI] [PMC free article] [PubMed] [Google Scholar]
- 19.Ju M, Qi A, Bi J, et al. A five-mRNA signature associated with post-translational modifications can better predict recurrence and survival in cervical cancer. J Cell Mol Med. 2020;24(11):6283–6297. doi:10.1111/jcmm.15270 [DOI] [PMC free article] [PubMed] [Google Scholar]
- 20.Shi Z, Xiao Z, Hu L, et al. The genetic association between type 2 diabetic and hepatocellular carcinomas. Ann Transl Med. 2020;8(6):380. doi:10.21037/atm.2020.02.13 [DOI] [PMC free article] [PubMed] [Google Scholar]
- 21.Ito K, Murphy D. Application of ggplot2 to pharmacometric graphics. CPT Pharmacometrics Syst Pharmacol. 2013;2(10):e79. doi:10.1038/psp.2013.56 [DOI] [PMC free article] [PubMed] [Google Scholar]
- 22.Wang Z, Song Q, Yang Z, Chen J, Shang J, Ju W. Construction of immune-related risk signature for renal papillary cell carcinoma. Cancer Med. 2019;8(1):289–304. doi:10.1002/cam4.1905 [DOI] [PMC free article] [PubMed] [Google Scholar]
- 23.Yang S, Wu Y, Deng Y, et al. Identification of a prognostic immune signature for cervical cancer to predict survival and response to immune checkpoint inhibitors. Oncoimmunology. 2019;8(12):e1659094. doi:10.1080/2162402x.2019.1659094 [DOI] [PMC free article] [PubMed] [Google Scholar]
- 24.Allera-Moreau C, Rouquette I, Lepage B, et al. DNA replication stress response involving PLK1, CDC6, POLQ, RAD51 and CLASPIN upregulation prognoses the outcome of early/mid-stage non-small cell lung cancer patients. Oncogenesis. 2012;1(10):e30. doi:10.1038/oncsis.2012.29 [DOI] [PMC free article] [PubMed] [Google Scholar]
- 25.Lorent M, Giral M, Foucher Y. Net time-dependent ROC curves: a solution for evaluating the accuracy of a marker to predict disease-related mortality. Stat Med. 2014;33(14):2379–2389. doi:10.1002/sim.6079 [DOI] [PubMed] [Google Scholar]
- 26.Holleczek B, Brenner H. Model based period analysis of absolute and relative survival with R: data preparation, model fitting and derivation of survival estimates. Comput Methods Programs Biomed. 2013;110(2):192–202. doi:10.1016/j.cmpb.2012.10.004 [DOI] [PubMed] [Google Scholar]
- 27.Mayakonda A, Lin D-C, Assenov Y, Plass C, Koeffler HP. Maftools: efficient and comprehensive analysis of somatic variants in cancer. Genome Res. 2018;28(11):1747–1756. doi:10.1101/gr.239244.118 [DOI] [PMC free article] [PubMed] [Google Scholar]
- 28.Robinson DR, Wu Y-M, Lonigro RJ, et al. Integrative clinical genomics of metastatic cancer. Nature. 2017;548(7667):297–303. doi:10.1038/nature23306 [DOI] [PMC free article] [PubMed] [Google Scholar]
- 29.Hänzelmann S, Castelo R, Guinney J. GSVA: gene set variation analysis for microarray and RNA-seq data. BMC Bioinformatics. 2013;14:7. doi:10.1186/1471-2105-14-7 [DOI] [PMC free article] [PubMed] [Google Scholar]
- 30.Bao X, Shi R, Zhang K, et al. Immune landscape of invasive ductal carcinoma tumor microenvironment identifies a prognostic and immunotherapeutically relevant gene signature. Front Oncol. 2019;9:903. doi:10.3389/fonc.2019.00903 [DOI] [PMC free article] [PubMed] [Google Scholar]
- 31.Bruix J, Sherman M. Management of hepatocellular carcinoma: an update. Hepatology. 2011;53(3):1020–1022. doi:10.1002/hep.24199 [DOI] [PMC free article] [PubMed] [Google Scholar]
- 32.Hoshida Y, Villanueva A, Kobayashi M, et al. Gene expression in fixed tissues and outcome in hepatocellular carcinoma. N Engl J Med. 2008;359(19):1995–2004. doi:10.1056/NEJMoa0804525 [DOI] [PMC free article] [PubMed] [Google Scholar]
- 33.Pikarsky E, Porat RM, Stein I, et al. NF-kappaB functions as a tumour promoter in inflammation-associated cancer. Nature. 2004;431(7007):461–466. doi:10.1038/nature02924 [DOI] [PubMed] [Google Scholar]
- 34.Weis SM, Cheresh DA. Tumor angiogenesis: molecular pathways and therapeutic targets. Nat Med. 2011;17(11):1359–1370. doi:10.1038/nm.2537 [DOI] [PubMed] [Google Scholar]
- 35.Llovet JM, Montal R, Sia D, Finn RS. Molecular therapies and precision medicine for hepatocellular carcinoma. Nat Rev Clin Oncol. 2018;15(10):599–616. doi:10.1038/s41571-018-0073-4 [DOI] [PubMed] [Google Scholar]
- 36.Sia D, Jiao Y, Martinez-Quetglas I, et al. Identification of an immune-specific class of hepatocellular carcinoma, based on molecular features. Gastroenterology. 2017;153(3):812–826. doi:10.1053/j.gastro.2017.06.007 [DOI] [PubMed] [Google Scholar]
- 37.Fukumura D, Kloepper J, Amoozgar Z, Duda DG, Jain RK. Enhancing cancer immunotherapy using antiangiogenics: opportunities and challenges. Nat Rev Clin Oncol. 2018;15(5):325–340. doi:10.1038/nrclinonc.2018.29 [DOI] [PMC free article] [PubMed] [Google Scholar]
- 38.Khan KA, Kerbel RS. Improving immunotherapy outcomes with anti-angiogenic treatments and vice versa. Nat Rev Clin Oncol. 2018;15(5):310–324. doi:10.1038/nrclinonc.2018.9 [DOI] [PubMed] [Google Scholar]
- 39.Wu Q, Wang L, Wei H, et al. Integration of multiple key molecules in lung adenocarcinoma identifies prognostic and immunotherapeutic relevant gene signatures. Int Immunopharmacol. 2020;83:106477. doi:10.1016/j.intimp.2020.106477 [DOI] [PubMed] [Google Scholar]
- 40.Prete AD, Sozio F, Schioppa T, et al. The atypical receptor CCRL2 is essential for lung cancer immune surveillance. Cancer Immunol Res. 2019;7(11):1775–1788. doi:10.1158/2326-6066.Cir-19-0168 [DOI] [PMC free article] [PubMed] [Google Scholar]
- 41.Mantovani S, Oliviero B, Varchetta S, Mele D, Mondelli MU. Natural killer cell responses in hepatocellular carcinoma: implications for novel immunotherapeutic approaches. Cancers (Basel). 2020;12(4):926. doi:10.3390/cancers12040926 [DOI] [PMC free article] [PubMed] [Google Scholar]
- 42.Ashiru O, Boutet P, Fernández-Messina L, et al. Natural killer cell cytotoxicity is suppressed by exposure to the human NKG2D ligand MICA*008 that is shed by tumor cells in exosomes. Cancer Res. 2010;70(2):481–489. doi:10.1158/0008-5472.Can-09-1688 [DOI] [PMC free article] [PubMed] [Google Scholar]
- 43.Piñeiro Fernández J, Luddy KA, Harmon C, O’Farrelly C. Hepatic tumor microenvironments and effects on NK cell phenotype and function. Int J Mol Sci. 2019;20(17):4131. doi:10.3390/ijms20174131 [DOI] [PMC free article] [PubMed] [Google Scholar]
- 44.Percik R, Shoenfeld Y.Check point inhibitors and autoimmunity: why endocrinopathies and who is prone to? Best Pract Res Clin Endocrinol Metab. 2020;34(1):101411. doi:10.1016/j.beem.2020.101411 [DOI] [PubMed] [Google Scholar]
- 45.Hurley CK. Naming HLA diversity: a review of HLA nomenclature. Hum Immunol. 2020. doi:10.1016/j.humimm.2020.03.005 [DOI] [PubMed] [Google Scholar]
- 46.Wysocki T, Olesińska M, Paradowska-Gorycka A. Current understanding of an emerging role of HLA-DRB1 gene in rheumatoid arthritis-from research to clinical practice. Cells. 2020;9(5):1127. doi:10.3390/cells9051127 [DOI] [PMC free article] [PubMed] [Google Scholar]
- 47.Xu H, Yin J. HLA risk alleles and gut microbiome in ankylosing spondylitis and rheumatoid arthritis. Best Pract Res Clin Rheumatol. 2020;33(6):101499. doi:10.1016/j.berh.2020.101499 [DOI] [PubMed] [Google Scholar]
- 48.Crusz SM, Miller RE. Targeted therapies in gynaecological cancers. Histopathology. 2020;76(1):157–170. doi:10.1111/his.14009 [DOI] [PubMed] [Google Scholar]
- 49.Larkin J, Chiarion-Sileni V, Gonzalez R, et al. Five-year survival with combined nivolumab and ipilimumab in advanced melanoma. N Engl J Med. 2019;381(16):1535–1546. doi:10.1056/NEJMoa1910836 [DOI] [PubMed] [Google Scholar]
- 50.Ferris RL, Blumenschein G, Jr, Fayette J, et al. Nivolumab for recurrent squamous-cell carcinoma of the head and neck. N Engl J Med. 2016;375(19):1856–1867. doi:10.1056/NEJMoa1602252 [DOI] [PMC free article] [PubMed] [Google Scholar]
- 51.Kumar S, Joga S, Biswas B, et al. Immune checkpoint inhibitors in advanced non-small cell lung cancer: a metacentric experience from India. Curr Probl Cancer. 2020;44(3):100549. doi:10.1016/j.currproblcancer.2020.100549 [DOI] [PubMed] [Google Scholar]
- 52.Wakeley ME, Gray CC, Monaghan SF, Heffernan DS, Ayala A. Check point inhibitors and their role in immunosuppression in sepsis. Crit Care Clin. 2020;36(1):69–88. doi:10.1016/j.ccc.2019.08.006 [DOI] [PMC free article] [PubMed] [Google Scholar]
- 53.Das UN. Can bioactive lipids augment anti-cancer action of immunotherapy and prevent cytokine storm? Arch Med Res. 2019;50(6):342–349. doi:10.1016/j.arcmed.2019.10.004 [DOI] [PubMed] [Google Scholar]
- 54.Albarel F, Castinetti F, Brue T.Management of endocrine disease: immune check point inhibitors-induced hypophysitis. Eur J Endocrinol. 2019;181(3):R107–R118. doi:10.1530/eje-19-0169 [DOI] [PubMed] [Google Scholar]
- 55.Giannini EG, Aglitti A, Borzio M, et al. Overview of immune checkpoint inhibitors therapy for hepatocellular carcinoma, and the ITA.LI.CA cohort derived estimate of amenability rate to immune checkpoint inhibitors in clinical practice. Cancers (Basel). 2019;11. doi:10.3390/cancers11111689 [DOI] [PMC free article] [PubMed] [Google Scholar]
- 56.Giacomo AMD, Valente M, Cerase A, et al. Immunotherapy of brain metastases: breaking a “dogma”. J Exp Clin Cancer Res. 2019;38(1):419. doi:10.1186/s13046-019-1426-2 [DOI] [PMC free article] [PubMed] [Google Scholar]
- 57.Tang R, Rangachari M, Kuchroo VK. Tim-3: a co-receptor with diverse roles in T cell exhaustion and tolerance. Semin Immunol. 2019;42:101302. doi:10.1016/j.smim.2019.101302 [DOI] [PubMed] [Google Scholar]
- 58.Sharma A, Johnson A., Exosome DNA: Critical regulator of tumor immunity and a diagnostic biomarker. J Cell Physiol. 2020;235(1):1921–1932. doi:10.1002/jcp.29153 [DOI] [PubMed] [Google Scholar]


