Abstract
Background:
Assessing intravascular hypovolemia due to hemorrhage remains a clinical challenge. Central venous pressure (CVP) remains a commonly used monitor in surgical and intensive care settings for evaluating blood loss, despite well-described pitfalls of static pressure measurements. The authors investigated an alternative to CVP, intravenous waveform analysis (IVA) as a method for detecting blood loss and examined its correlation with echocardiography.
Methods:
Seven anesthetized, spontaneously breathing male Sprague Dawley (SD) rats with right internal jugular central venous and femoral arterial catheters underwent hemorrhage. Mean arterial pressure (MAP), heart rate (HR), CVP, and IVA were assessed and recorded. Hemorrhage was performed until each rat had 25% estimated blood volume removed. IVA was obtained using fast Fourier transform and the amplitude of the fundamental frequency (f1) was measured. Transthoracic echocardiography (TTE) was performed utilizing a parasternal short axis image of the left ventricle during hemorrhage. MAP, CVP, and IVA were compared to blood removed and correlated with left ventricular end diastolic area (LVEDA).
Results:
All seven rats underwent successful hemorrhage. MAP and f1 peak amplitude obtained by IVA showed significant changes with hemorrhage. MAP and f1 peak amplitude also significantly correlated with LVEDA during hemorrhage (R = 0.82 and 0.77, respectively). CVP did not significantly change with hemorrhage, and there was no significant correlation between CVP and LVEDA.
Conclusions:
In this study, f1 peak amplitude obtained by IVA was superior to CVP for detecting acute, massive hemorrhage. In addition, f1 peak amplitude correlated well with LVEDA on echocardiography. Translated clinically, IVA might provide a viable alternative to CVP for detecting hemorrhage.
Keywords: Central venous pressure, Fourier transform, hemodynamic monitoring, hypotension, vascular
Introduction:
Acute hemorrhage remains a common cause of morbidity and mortality in perioperative surgical patients1,2. Early detection and treatment of hemorrhage has been shown to improve outcomes; however, early detection remains a diagnostic challenge3. Continuous measurements, such as arterial blood pressure, heart rate, and central venous pressure (CVP) often remain unchanged early in hemorrhage, requiring large volume blood loss before showing clinically significant changes4. Moreover, these measurements are not specific to hypovolemia. Particularly in the perioperative patient, there are numerous factors that can cause changes in heart rate and arterial blood pressure such as changes in anesthetic depth and surgical stimulation. For these reasons, these continuous measurements are limited in their ability to assist the clinician in making an early diagnosis of hypovolemia due to acute hemorrhage. Echocardiography has been described as an alternative method of detecting acute hypovolemia5. While static measurements of ventricular size such as left ventricular end diastolic area (LVEDA) are limited in their ability to predict volume responsiveness6, changes in LVEDA over time correlate linearly with blood loss7. This makes echocardiography useful in detecting acute hemorrhage, however it is limited in that it is not routinely used as a continuous monitor for non-cardiac surgery. Given how quickly hemorrhage can occur, and the benefits of early detection and treatment, an intermittent monitor such as echocardiography may not be the ideal tool to assist in clinical decision making.
Intravenous waveform analysis (IVA) has been used as a novel marker to detect changes in intravascular volume. This approach utilizes spectral analysis of a venous waveform for continuous beat-to-beat monitoring of intravascular volume status. In a pig model of acute hemorrhage, IVA was shown to be superior to CVP in detecting acute hemorrhage8. Similar results were seen in humans using the volume status changes of dialysis and retrograde autologous priming for cardiac surgery as models of hypovolemia9,10. The suspected mechanism of this technique is an exploitation of the non-linear pressure-volume relationship of the heart and vascular system. None of these prior studies compared the results of IVA with echocardiographic ventricular size during hemorrhage.
We hypothesized that IVA obtained from a central venous catheter will detect acute hemorrhage and will correlate with echocardiographic evidence of hypovolemia. The objectives of this study were to determine the utility of IVA to detect hypovolemia and to compare this data with echocardiography in a rat model of hemorrhagic shock.
Materials and Methods:
This study was approved by the Institutional Animal Care and Use Committee at Vanderbilt University Medical Center, Nashville, Tennessee and was carried out and reported in accordance with the ARRIVE guidelines for animal research11. Seven male Sprague Dawley (SD) rats (Charles River, Waltham, MA, USA, 473±83 g) were housed under a 12h/12h light dark cycle with food and water ad libidum. On the day of the experiment, rats were anesthetized with intraperitoneal (IP) pentobarbital injection (45 mg/kg, Diamondback Drugs, Scottsdale, AZ, USA) and laryngoscopic intubation was performed with a 14G IV cannula (BD Insyte Autogard BD, Sandy, Utah, USA)12. During spontaneous breathing (FiO2 0.25, 1 l/min), end-tidal CO2 (EtCO2) and respiratory rate (RR) were measured by an infrared CO2-Sensor (Capnogard, Novametrix, CT, USA). A rectal temperature probe was placed, and core temperature maintained between 36.5°C and 37.5°C. The level of anesthesia was regularly assessed and maintained with repeated doses of pentobarbital (10 mg/kg, IP).
Vascular access was established via surgical cutdown of the left femoral vein and artery (25 cm PE tubing [PE25 Instech, Plymouth Meeting, PA, USA] connected to a 25G blunt needle [Air-Tite, Va. Beach, VA, USA]) for blood removal and blood pressure measurements. A Millar® pressure catheter (3.5F SPR 825, Millar® Instruments, Houston, Texas, USA) was placed in the right atrium via cannulation of the right jugular vein to measure CVP and IVA. A TruWave pressure transducer (Edwards Lifesciences, Irvine, CA, USA) was connected to the arterial line. Electrocardiogram by subcutaneous ECG needles, rectal temperature, arterial blood pressure, and venous waveforms were recorded using Powerlab Series 16/30 and LabChart Version 8.1.13 (AD Instruments, Dunedin, New Zealand).
Transthoracic echocardiography (TTE) was performed using an Affiniti 50C ultrasound (Philips Healthcare, Andover, MA) with an S12–4 (12–4 MHz frequency range) transducer. An experienced echocardiographer recorded a parasternal mid-papillary short axis view of the left ventricle at baseline and at time-stamped intervals. The image was frozen at end diastole and left ventricular end diastolic area (LVEDA) was measured utilizing the area measurement tool built into the echocardiography machine software by manually tracing the endocardial border. This measurement was performed at baseline and after each level of hemorrhage.
After approximately 60 min of surgical preparation, warmed 4 mL/kg Plasmalyte (Baxter International, Deerfield, IL) with 400 IU/kg heparin (Fresenius Kabi USA, LLC, Lake Zurich, IL) was infused over a 30 min stabilization period. Baseline measurements including venous pressure waveform, mean arterial pressure (MAP), LVEDA, heart rate (HR) and CVP were recorded at baseline. Hemorrhagic shock was induced in accordance with the Guarini’s et al. modified method13. This method involved removing 2 mL of blood every 6 minutes (~6% estimated blood volume) for a total blood removal of 8 mL (~25% estimated blood volume). All measurements were repeated after each 2 mL of blood removed.
Venous pressure waveform was analyzed using a fast Fourier transform (FFT) with an 8K sampling window with no window overlap. Data was recorded at a sampling rate of 1 kHz necessitating 8 sec of continuous time-domain signal to perform the 8K-FFT spectral analysis. The FFT converts the time domain waveform into a frequency domain output with distinct peaks at a variety of frequencies. These peaks correspond to various physiologic parameters that influence the waveform such as respiratory rate and heart rate. The amplitude of each frequency peak was calculated in LabChart. The peak amplitude at a frequency corresponding with the HR was labeled f1 (the fundamental frequency). A representative example of the raw waveform and corresponding FFT output with associated peaks can be seen in Figure 1. Data was captured in triplicate for each point used in analysis. To analyze the data, GraphPad Prism (Version 8.3.0, GraphPad Software, La Jolla, CA) was used. To ensure normal distribution, a Kolmogorov-Smirnov normality test was run. Normally distributed data was then analyzed using one-way ANOVA, followed by a Tukey Multiple Comparison Test. For alpha = 0.05 and a power of 80%, we calculated a sample size of at least five animals to demonstrate a decrease in the f1 amplitude by 50%, assuming a standard deviation of 0.2 based on previous data evaluating f1 amplitude measurements8. To evaluate the correlation between LVEDA and each of f1 amplitude, MAP, and CVP, a Pearson’s correlation was performed. Correlation was considered weak if R was below 0.5, moderate if R was 0.5–0.7, and strong if R was greater than 0.7.
Figure 1: Central venous f1 amplitude decreases with hemorrhage.
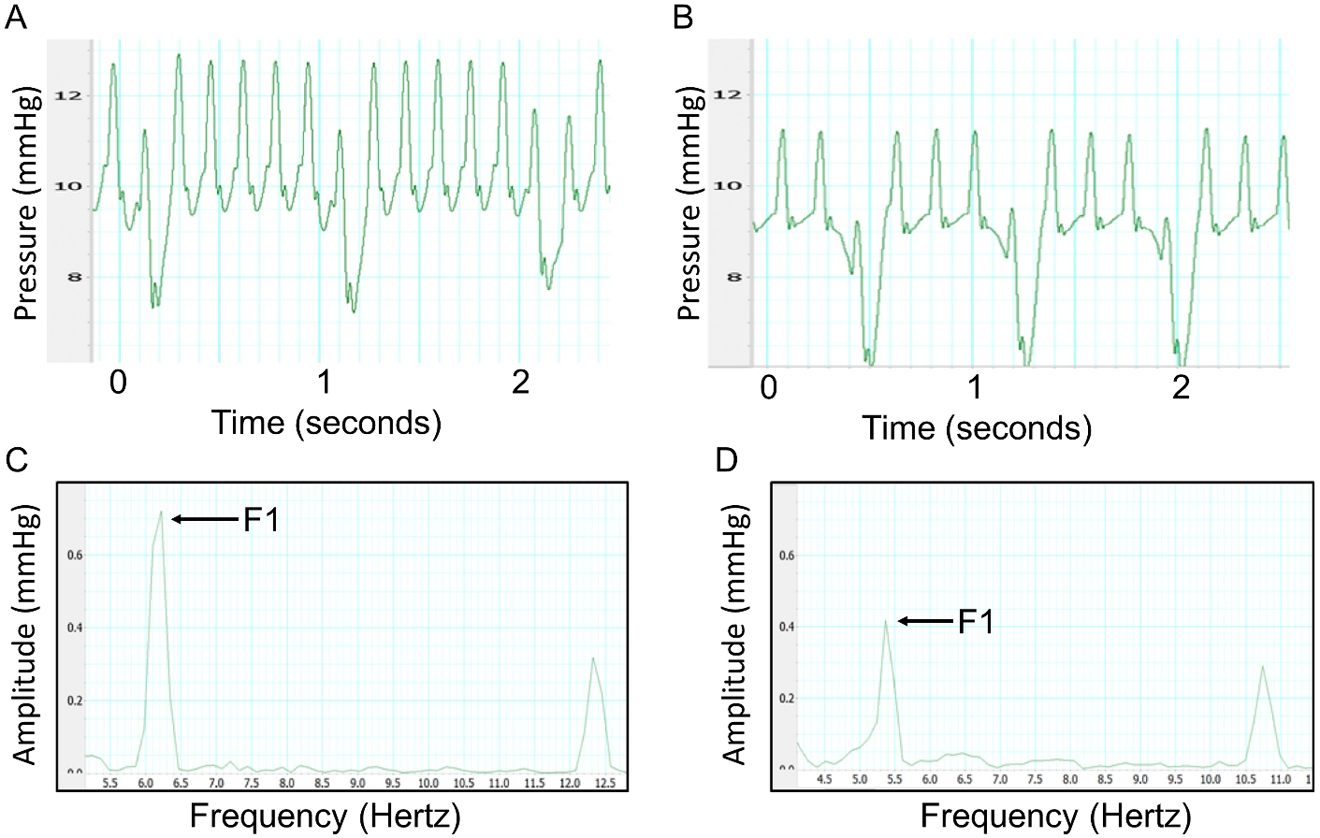
Central venous waveform obtained at baseline (A) and after 8 mL of hemorrhage (B) in a rat model. Corresponding fast Fourier transform at baseline (C) and after 8 mL of hemorrhage (D). The first peak represents the amplitude of the venous signal at the heart rate of the animal. The f1 peak significantly decreases following hemorrhage (P < 0.01).
Results:
All seven SD rats were successfully studied. All rats remained in normal sinus rhythm with oxygen saturations >95% throughout the experiment. Satisfactory echocardiographic images were obtained on all rats demonstrating normal biventricular systolic function throughout the experiment. Venous waveforms were converted from the time domain to the frequency domain, with the amplitude of the f1 peak measured. Representative venous waveforms and corresponding FFT results are shown in Figures 1a–1d. Representative pre-hemorrhage and post-hemorrhage echocardiographic images are shown in Figures 2a and 2b, respectively. The f1 amplitude in mmHg and corresponding 95% confidence interval at baseline and for each subsequent hemorrhage level respectively was 0.80 (0.59–1.0), 0.52 (0.34–0.71), 0.36 (0.09–0.63), 0.34 (0.09–0.59), 0.19 (0.11–0.27). Figure 3a shows this data with the f1 amplitude versus blood removed during the hemorrhage period. There was a significant non-zero slope of −0.0743 with P-value < 0.0001. There was a significant change in f1 amplitude after 2 mL (P = 0.014), 4 mL (P < 0.01), 6 mL (P < 0.001), and 8 mL (P < 0.001) of blood were removed from baseline. There was also a significant change between 2 mL and 8 mL (P = 0.017). Figure 3b shows the correlation between f1 amplitude and normalized LVEDA (R = 0.77). The MAP in mmHg and corresponding 95% confidence interval at baseline and with each subsequent hemorrhage level respectively was 120.3 (111.2–129.3), 92.2 (77.9–106.5), 59.1 (48.0–70.2), 55.7 (25.8–85.6), 51.3 (5.6–97.1). Figures 4a and 4b show that these changes in MAP were statistically significant with 2 mL (P < 0.01), 4 mL (P < 0.001), 6 mL (P < 0.001) and 8 mL (P < 0.001) of blood removal. MAP also correlated with normalized LVEDA (R = 0.82). CVP in mmHg and corresponding 95% confidence interval at baseline and with each subsequent hemorrhage level respectively was 4.1 (1.1–7.0), 3.7 (0.7–6.7), 3.6 (0.6–6.5), 4.4 (1.5–7.3), 4.3 (−1.1–9.8). Figure 5a shows this data and was not significant at any level of hemorrhage (P = 0.92 for 8 mL removed), and Figure 5b shows that there was no significant correlation between CVP and normalized LVEDA (R = 0.14).
Figure 2: LVEDA decreases with hemorrhage.
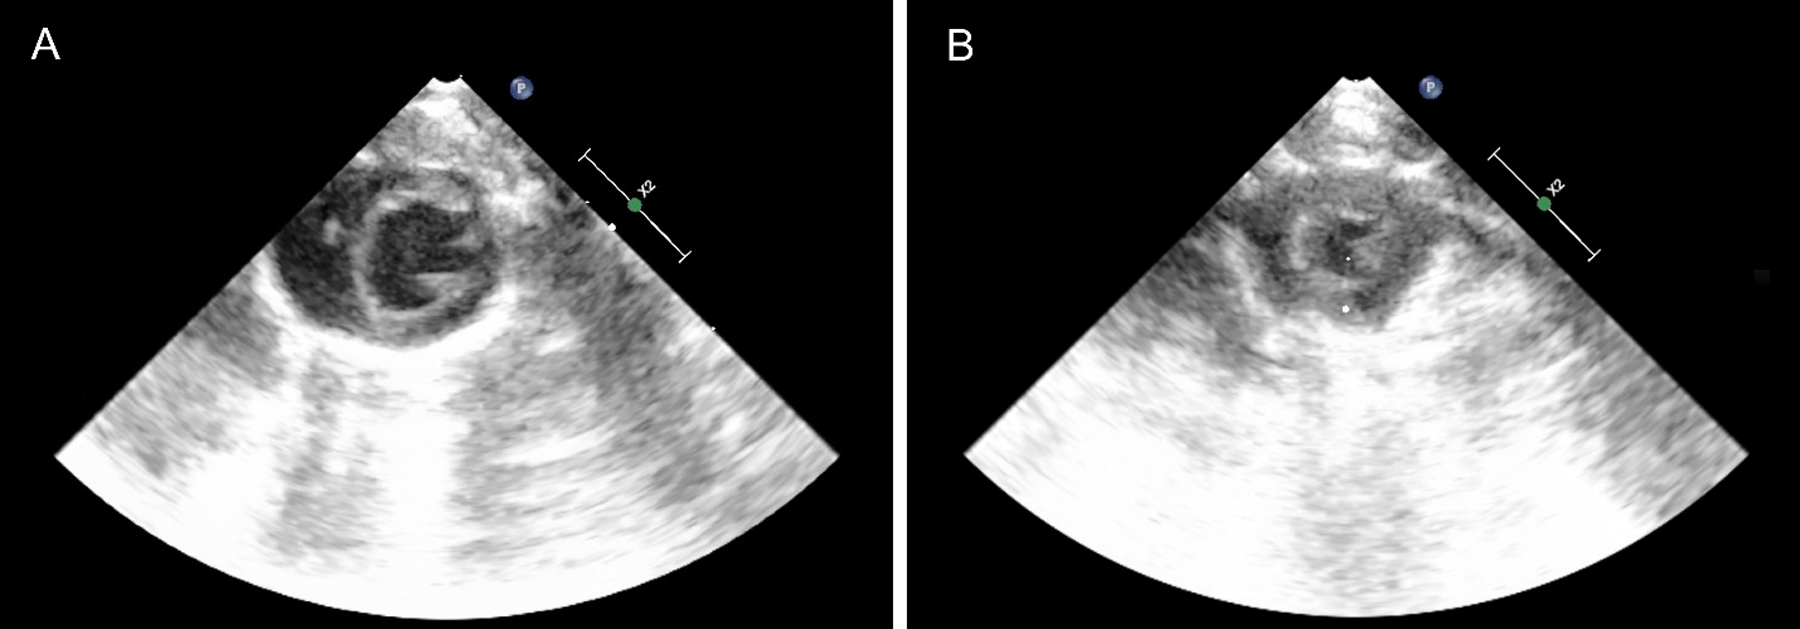
(A) Shows representative baseline parasternal short axis view of the left ventricle during diastole prior to hemorrhage. (B) Shows a similar view after 8 mL of blood was removed revealing reduced left ventricular size.
Figure 3: f1 amplitude detects hemorrhage and correlates significantly with LVEDA.
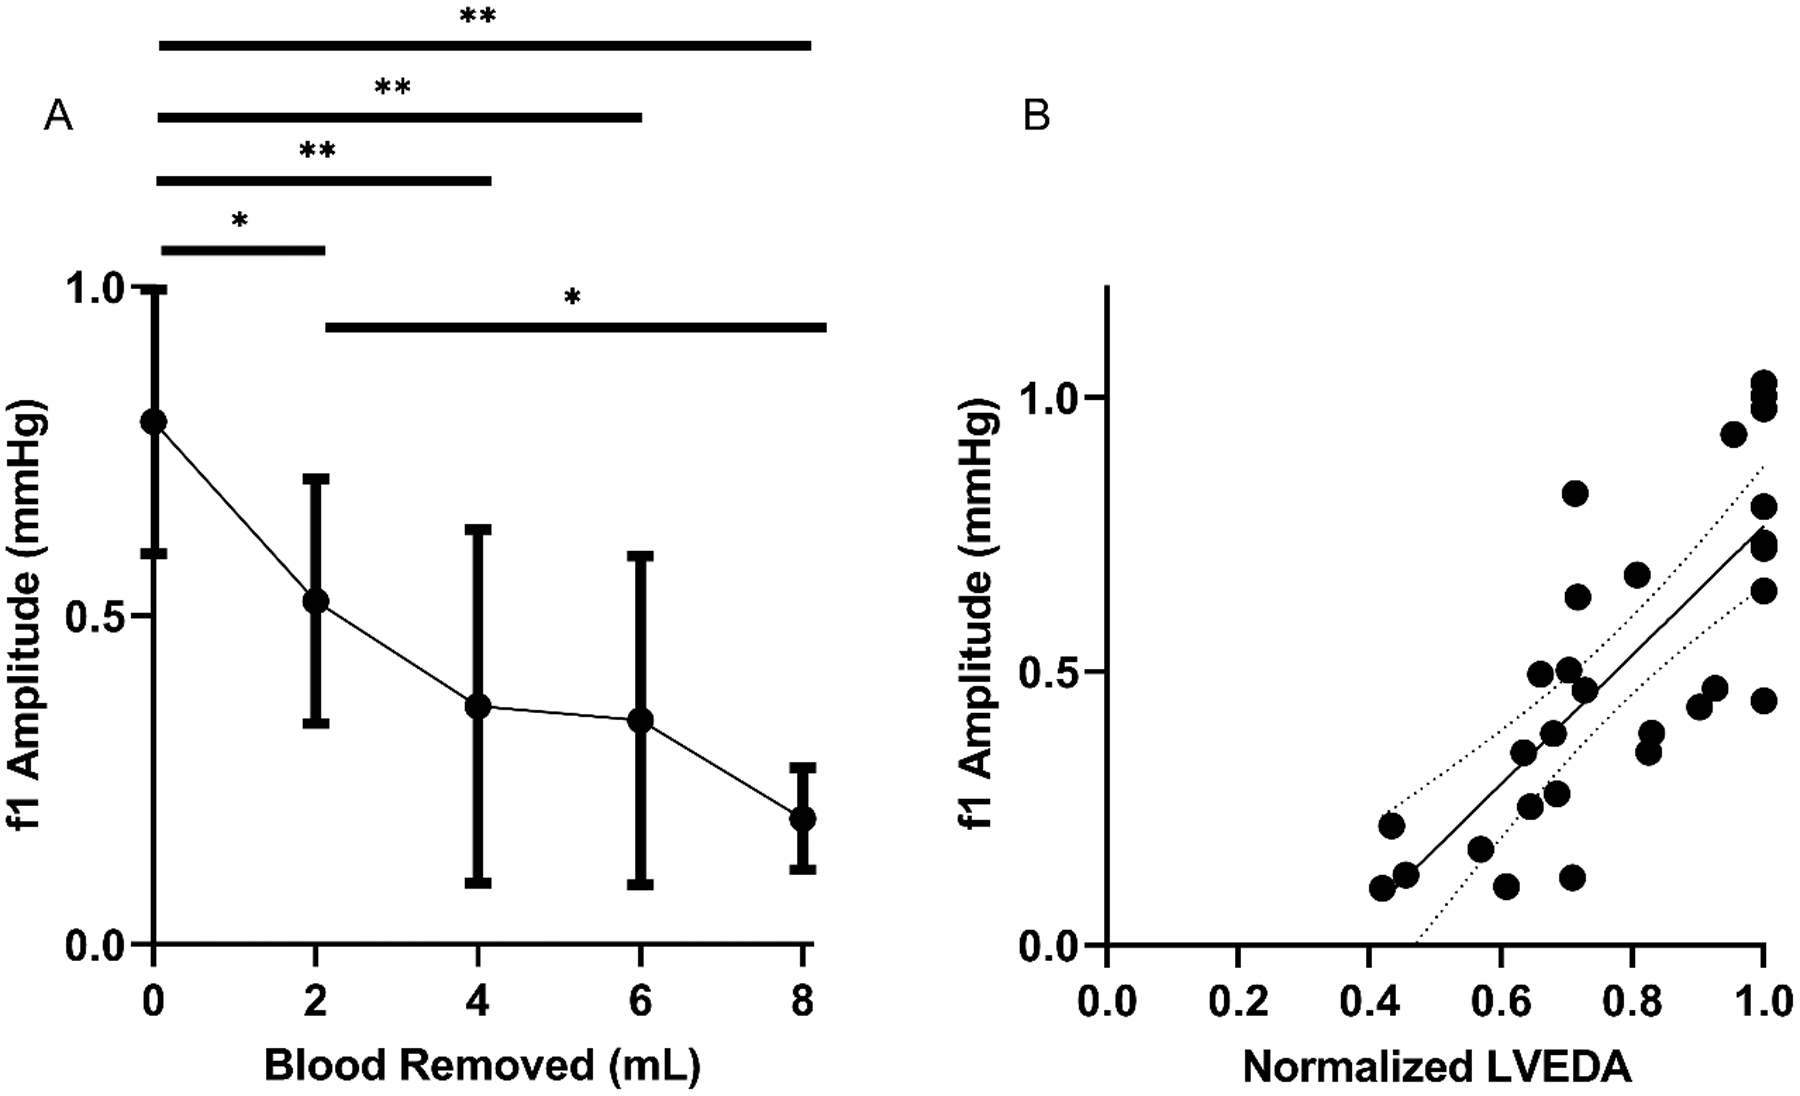
(A) Depicts f1 amplitude during hemorrhage of 2, 4, 6, and 8 mL. Error bars indicate 95% Confidence Interval. * indicates significant difference of P < 0.05, ** indicates P < 0.01. (B) shows the correlation between f1 amplitude and LVEDA during this hemorrhage (R=0.77) with best fit equation of Y = (1.179 +/− 0.1861) * X – (0.4137 +/− 0.149). Dotted lines indicate 95% Confidence Interval.
Figure 4: MAP detects hemorrhage and correlates significantly with LVEDA.
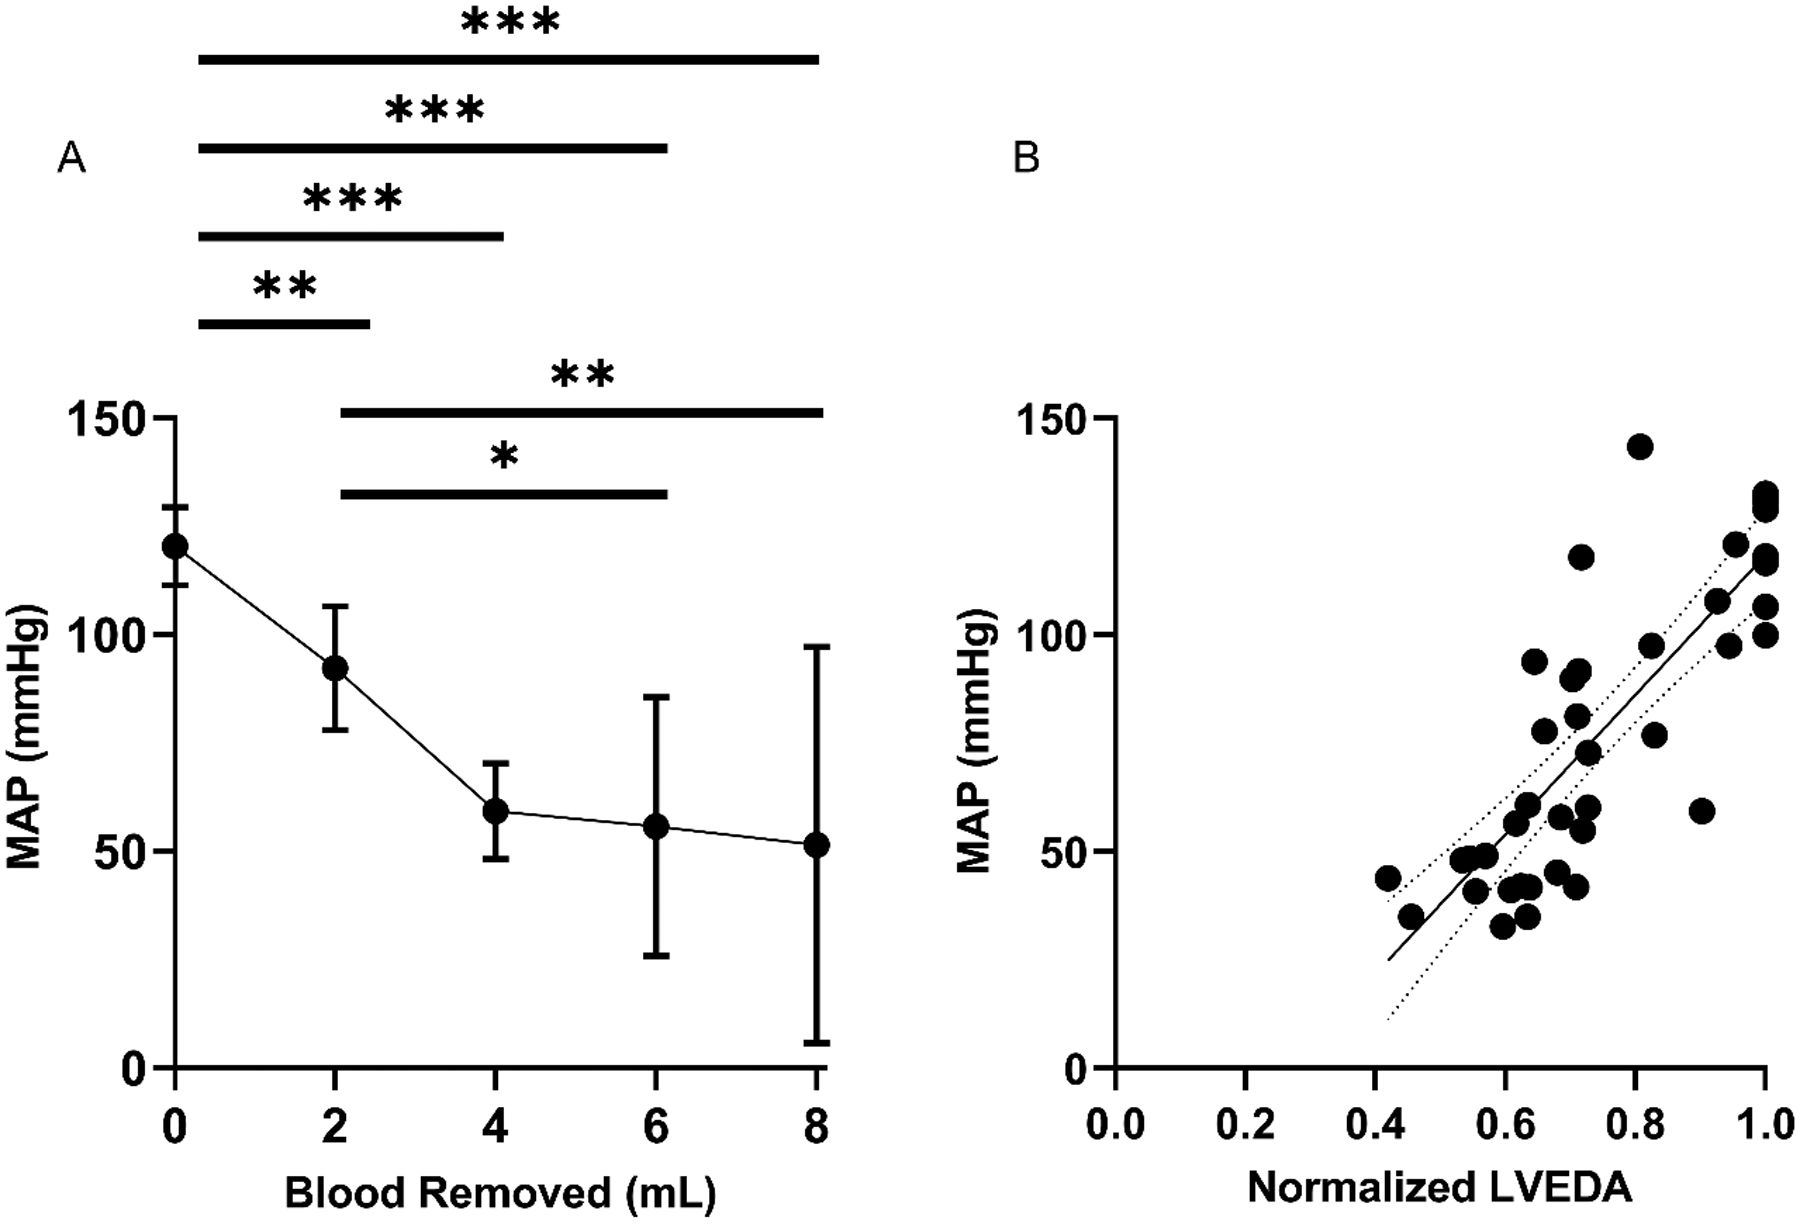
(A) Depicts MAP during hemorrhage of 2, 4, 6, and 8 mL. Error bars indicate 95% Confidence Interval. * indicates significant difference of P < 0.05, ** indicates P < 0.01, *** indicates P < 0.001. (B) Shows the correlation between MAP and LVEDA during this hemorrhage (R=0.82) with best fit equation of Y = (161.1 +/− 17.78) * X – (42.67 +/− 13.79). Dotted lines indicate 95% Confidence Interval.
Figure 5: CVP does not detect hemorrhage or correlate with LVEDA.
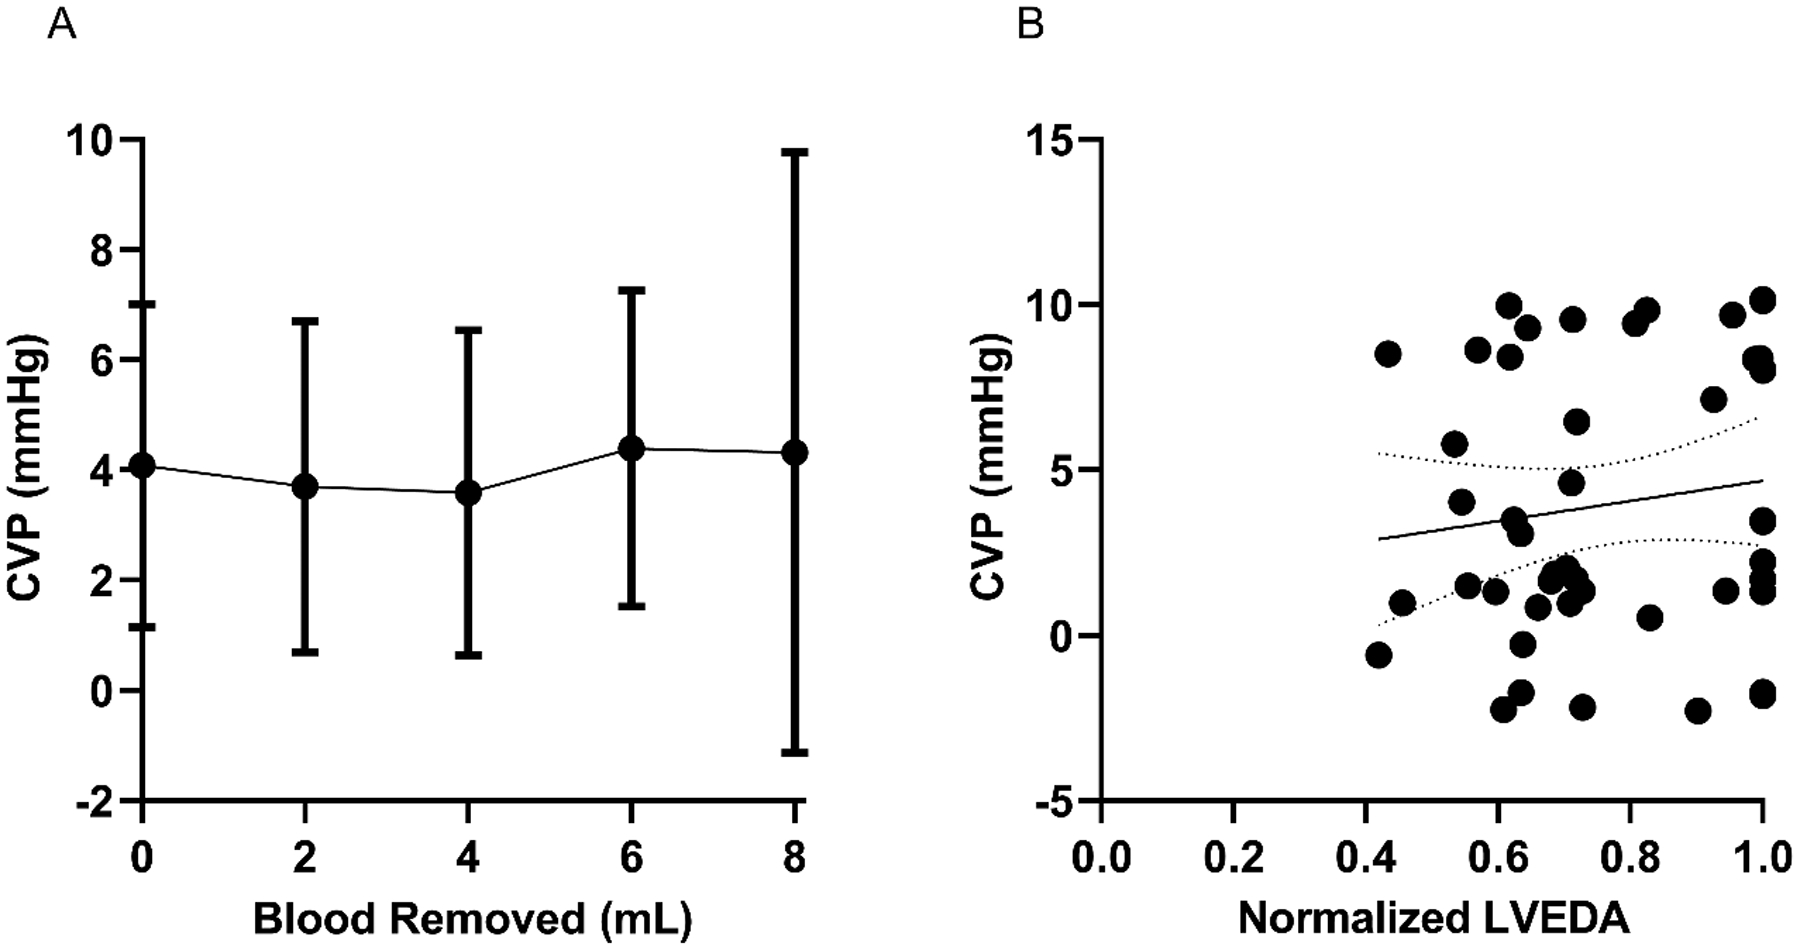
(A) Depicts CVP during hemorrhage of 2, 4, 6, and 8 mL showing no significant change. Error bars indicate 95% Confidence Interval. (B) shows no significant correlation between CVP and LVEDA during this hemorrhage (R=0.14) with best fit equation of Y = (3.044 +/− 3.285) * X + (1.62 +/− 2.59). Dotted lines indicate 95% Confidence Interval.
Figure 6 shows the receiver operator characteristic (ROC) curves for detection of hemorrhage of 2 mL for IVA, MAP, and CVP. IVA generated an area under the curve (AUC) of 0.90 (0.78–1.0). This was similar to MAP, which generated an AUC of 0.93 (0.85–1.0). Both IVA and MAP were superior to CVP which had an AUC of 0.54 (0.34–0.73).
Figure 6: MAP and f1 show superior sensitivity and specificity compared to CVP for detecting hemorrhage.
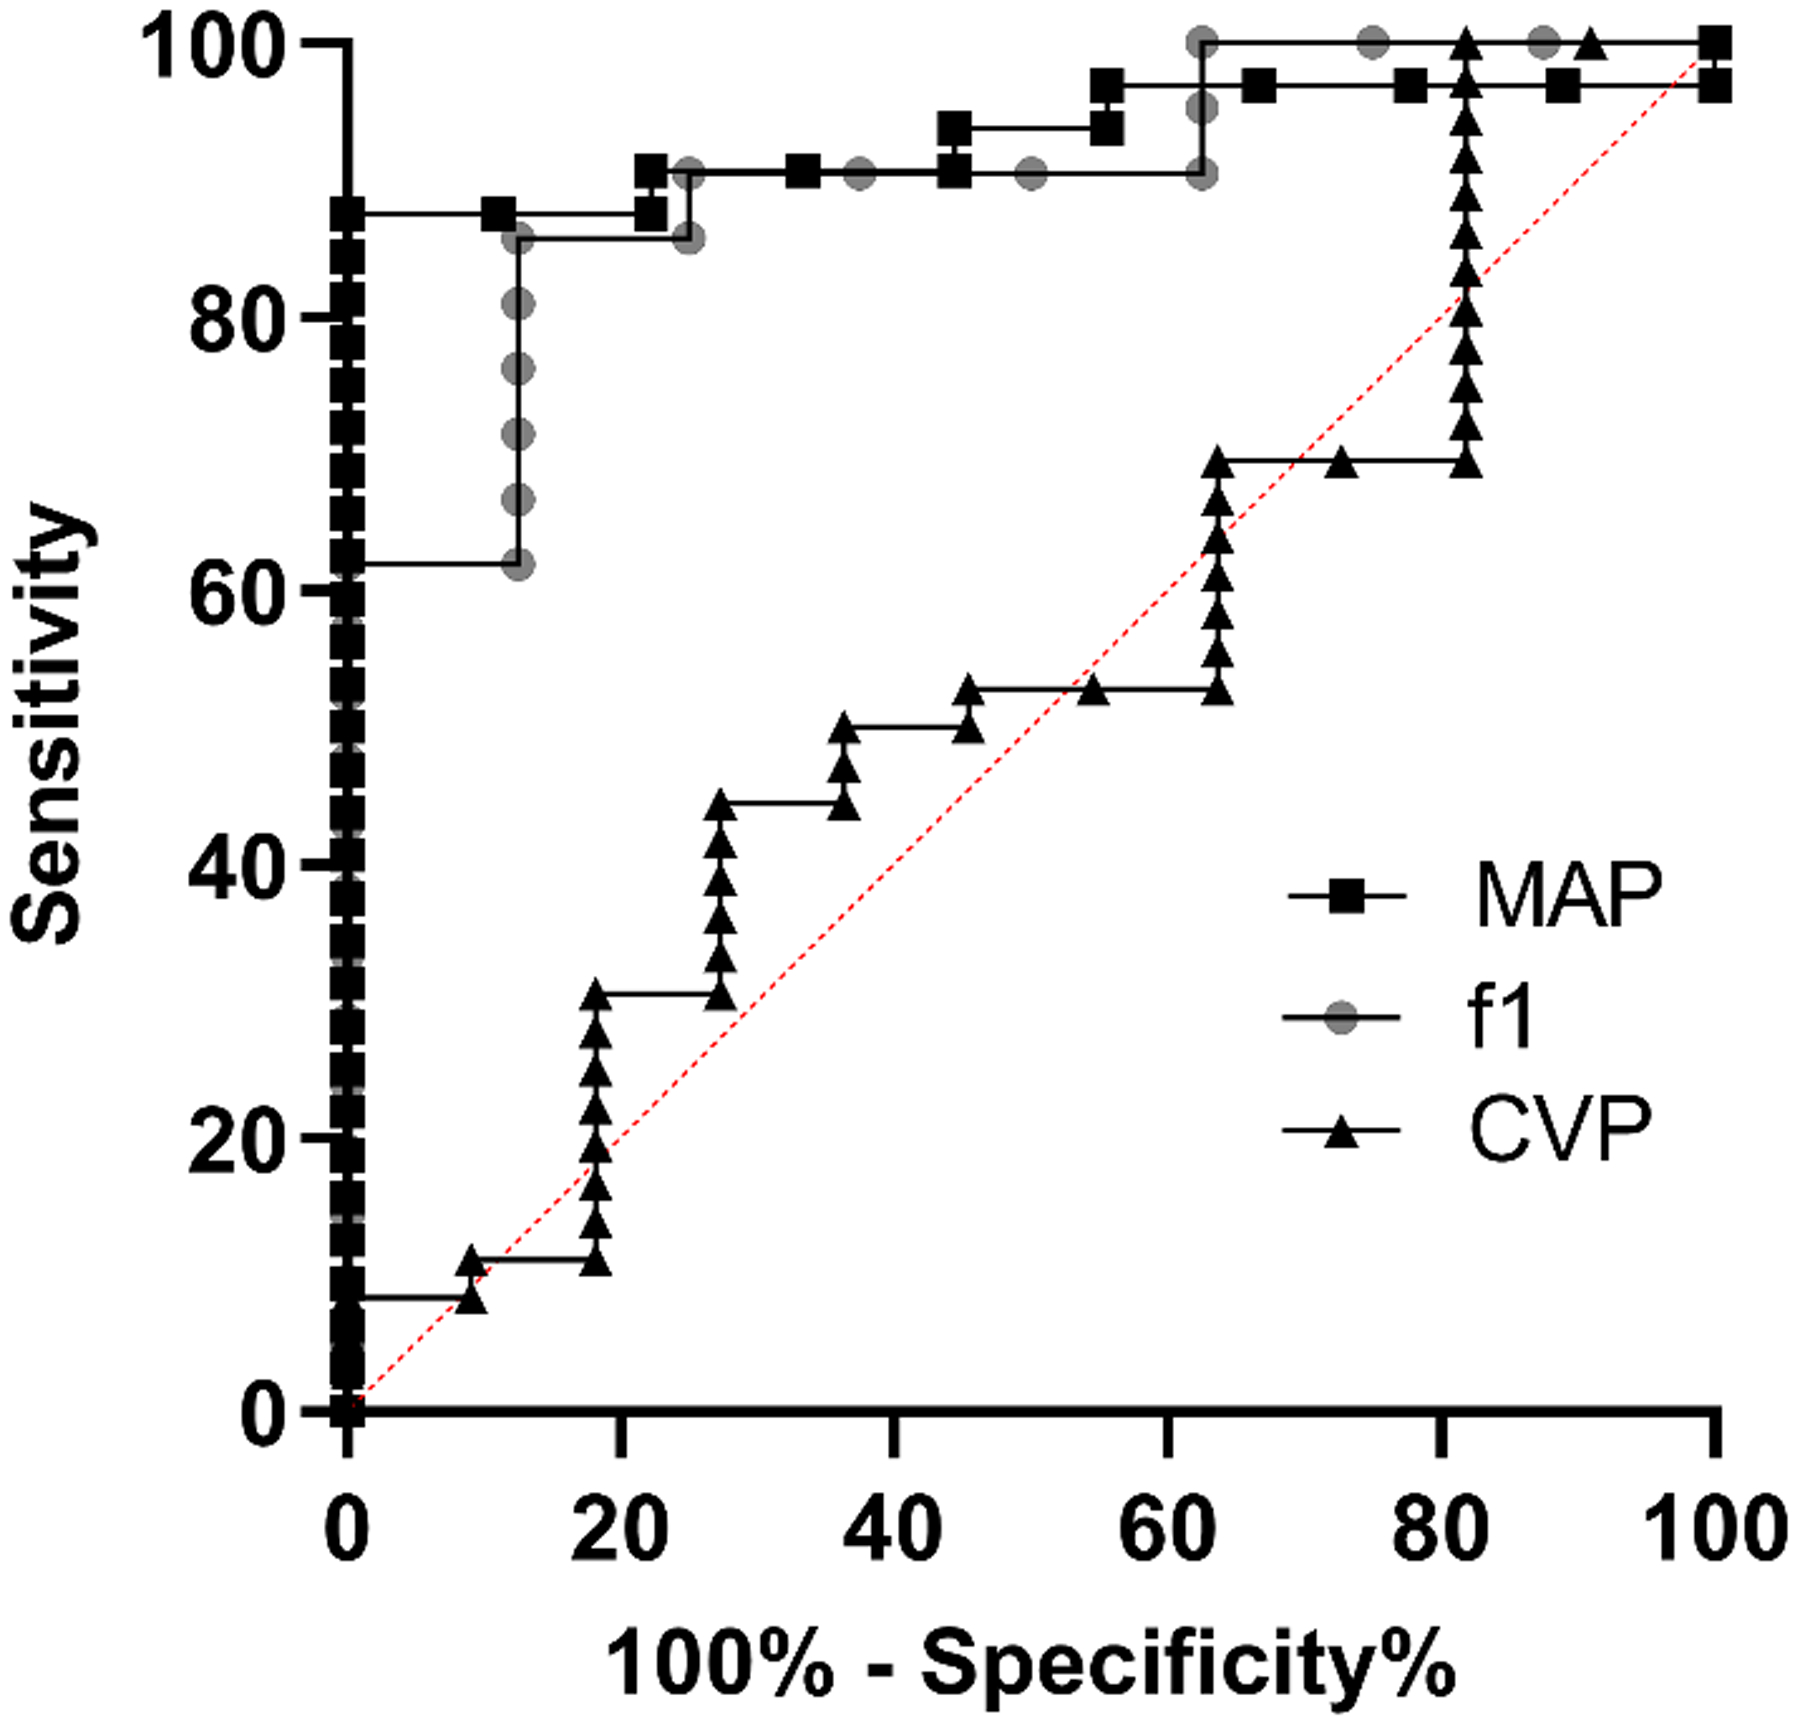
ROC curve showing the response of MAP (AUC 0.93 [0.85–1.0]), f1 (AUC 0.90 [0.78–1.0]), and CVP (AUC 0.54 [0.34–0.73]).
Discussion:
In this feasibility study, we investigated the ability of f1 peak amplitude measured by IVA to detect acute hypovolemia caused by hemorrhage and correlated these results with echocardiographic evidence of hypovolemia. This study is consistent with prior studies showing that IVA is a sensitive method for detecting hemorrhage8,9. Importantly, this is the first study that confirms a significant correlation between IVA f1 amplitude and LVEDA using transthoracic echocardiography.
Clinically, these results are encouraging that IVA may be a useful continuous monitor to allow detection of hemorrhage, and that these results correlate well with echocardiographic evidence of hypovolemia. The correlation with LVEDA is important because, while IVA has shown to be sensitive to changes in volume status, the exact mechanism has not been well established. It is suspected that the decrease in amplitude of the f1 signal is due to the non-linear relationship of the pressure-volume relationship of the heart and vascular system. While this study does not fully define this relationship, it is the first study to show a correlation between IVA and diastolic left ventricular size.
In contrast to previous studies in humans and porcine models, IVA was not superior to MAP for detecting hemorrhage. Hemorrhagic studies in rats show an early and rapid reduction in MAP consistent with this study14,15. Future studies will compare IVA to echocardiography in larger species where hypotension occurs at a later stage of hemorrhagic shock4. Second, this is the first study to assess IVA from a central venous catheter. Prior IVA studies have been performed using peripheral veins in pigs and humans8,9. Future studies utilizing peripheral venous signals are needed to ensure the correlation with echocardiography remains, as not all patients at risk of hemorrhage have central venous access. The central venous waveform in this study was obtained from the right atrium. It is not known if the location of the central venous line influences the results. Further studies of larger species will allow the comparison of venous waveform analysis from both peripheral and central venous waveforms from various central line cannulation locations simultaneously to fully understand the changes in waveforms throughout the venous system.
Nevertheless, this study highlights that in contrast to IVA, there is no significant change in CVP, even in the presence of decompensated hemorrhagic shock. Further, CVP did not correlate with LVEDA during hemorrhage. This is consistent with several studies that have demonstrated the poor utility of CVP for estimating intravascular volume and guiding resuscitation16–18. Despite compelling data against its use, CVP monitoring remains in clinical practice for hemorrhage detection and fluid management in operative and critical care settings. IVA has the potential to provide clinicians with a robust alternative to CVP. Demonstration of excellent sensitivity/specificity for IVA to detect hemorrhage in a small animal model shows promise for translation into the pediatric arena, particularly in cardiac surgery patients where CVP monitoring is standard practice for managing neonates and infants in the operating room and post-operative critical care settings.
IVA has previously been shown to have a significant reduction in f1 amplitude when utilizing lower body negative pressure to simulate hypovolemia during spontaneous respirations19. Our data confirms that IVA does not depend on positive pressure-induced changes in intrathoracic pressure to estimate intravascular volume. This is an important distinction from other dynamic parameters, such as pulse pressure variation, that require ≥8 mL/kg tidal volume to detect hypovolemia20. This unique characteristic of IVA may be advantageous for monitoring extubated, spontaneously breathing subjects in the postoperative setting. While the utility of IVA during spontaneous ventilation may be an advantage over other dynamic parameters, IVA has also been shown to correlate with hypovolemia in mechanically ventilated pigs and humans8,10. Given that IVA does not depend on respiratory changes, it may be an effective monitor for both spontaneous and mechanical ventilation.
Our study needs to be interpreted within its natural constraints. Though sufficiently powered, this is an animal study with a small sample size, intended to be a feasibility investigation in utilizing IVA in rat hemorrhage model with echocardiography. All rats in this study were male, which have been shown to decompensate more than female rats in response to trauma and hemorrhage21. Future large studies will include both male and female animals to ensure consistent results. While we were able to show a strong correlation between IVA and change in LVEDA in this rat model, further larger animal and human studies are warranted to validate this correlation in a heterogeneous patient population with multiple comorbidities.
Although detection of hemorrhage is important, perhaps a more valuable clinical monitor would be the ability to predict which patients will benefit from intravascular fluid resuscitation. While this preliminary study only looked at hemorrhage, future studies are planned to also include resuscitation in order to determine if IVA can predict fluid responsiveness.
All rats received pentobarbital for maintenance of anesthesia. Pentobarbital has been associated with hemodynamic changes such as a decrease in HR and MAP; however, it is not known what effect, if any, these changes have on IVA waveforms. Further studies are needed with a variety of anesthetic agents to determine their effects on IVA waveforms. Also, further studies are warranted to ensure the correlation between IVA and changes in LVEDA persists when hemorrhage occurs more slowly, and when blood pressure is normalized with vasoconstrictive medications, as is often the case in clinical practice.
In summary, with further validation, IVA may prove to be a valuable, objective indicator of hemorrhage and hypovolemia. It may be particularly useful when monitoring with echocardiography is not feasible or not available, and in situations where other dynamic indices that depend on changes of intrathoracic pressure such as pulse pressure variation are invalid. Based on this data, we plan to continue investigating IVA as a potential robust monitor for detecting hemorrhage.
All sources of support (Funding, conflict of interests)
Dr. Balzer was funded by the Deutsche Forschungsgemeinschaft (DFG, German Research Foundation) - Project number 397561247. Additional support provided by institutional funds, NIH grant (5R01 HL123227), and a Merit Review Award (I01 BX003482) from the U.S. Department of Veterans Affairs Biomedical Laboratory R&D Service awarded to Dr. Riess.
References
- 1.Carson JL, Noveck H, Berlin JA, Gould SA. Mortality and morbidity in patients with very low postoperative Hb levels who decline blood transfusion. Transfusion. 2002;42(7):812–818. [DOI] [PubMed] [Google Scholar]
- 2.Lier H, Krep H, Schroeder S, Stuber F. Preconditions of hemostasis in trauma: a review. The influence of acidosis, hypocalcemia, anemia, and hypothermia on functional hemostasis in trauma. J Trauma. 2008;65(4):951–960. [DOI] [PubMed] [Google Scholar]
- 3.Wilson M, Davis DP, Coimbra R. Diagnosis and monitoring of hemorrhagic shock during the initial resuscitation of multiple trauma patients: a review. J Emerg Med. 2003;24(4):413–422. [DOI] [PubMed] [Google Scholar]
- 4.Shen T, Baker K. Venous return and clinical hemodynamics: how the body works during acute hemorrhage. Adv Physiol Educ. 2015;39(4):267–271. [DOI] [PubMed] [Google Scholar]
- 5.Mok KL. Make it SIMPLE: enhanced shock management by focused cardiac ultrasound. J Intensive Care. 2016;4:51. [DOI] [PMC free article] [PubMed] [Google Scholar]
- 6.Mackenzie DC, Noble VE. Assessing volume status and fluid responsiveness in the emergency department. Clin Exp Emerg Med. 2014;1(2):67–77. [DOI] [PMC free article] [PubMed] [Google Scholar]
- 7.Cheung AT, Savino JS, Weiss SJ, Aukburg SJ, Berlin JA. Echocardiographic and hemodynamic indexes of left ventricular preload in patients with normal and abnormal ventricular function. Anesthesiology. 1994;81(2):376–387. [DOI] [PubMed] [Google Scholar]
- 8.Hocking KM, Sileshi B, Baudenbacher FJ, et al. Peripheral Venous Waveform Analysis for Detecting Hemorrhage and Iatrogenic Volume Overload in a Porcine Model. Shock. 2016;46(4):447–452. [DOI] [PubMed] [Google Scholar]
- 9.Hocking KM, Alvis BD, Baudenbacher F, et al. Peripheral i.v. analysis (PIVA) of venous waveforms for volume assessment in patients undergoing haemodialysis. Br J Anaesth. 2017;119(6):1135–1140. [DOI] [PubMed] [Google Scholar]
- 10.Sileshi B, Hocking KM, Boyer RB, et al. Peripheral venous waveform analysis for detecting early hemorrhage: a pilot study. Intensive Care Med. 2015;41(6):1147–1148. [DOI] [PubMed] [Google Scholar]
- 11.Reynolds P, Wall P, van Griensven M, McConnell K, Lang C, Buchman T. Shock supports the use of animal research reporting guidelines. Shock. 2012;38(1):1–3. [DOI] [PubMed] [Google Scholar]
- 12.Balzer C, Cleveland WJ, Jinka TR, Riess ML. Video laryngoscopic oral intubation in rats: a simple and effective method. Am J Physiol Lung Cell Mol Physiol. 2020;318(5):L1032–l1035. [DOI] [PMC free article] [PubMed] [Google Scholar]
- 13.Guarini S, Tagliavini S, Bazzani C, Pasini M, Bertolini A. Brain M3 muscarinic receptors are involved in the ACTH-induced reversal of hemorrhagic shock. Naunyn-Schmiedeberg’s Arch Pharmacol. 1990;342(1):36–39. [DOI] [PubMed] [Google Scholar]
- 14.Ronn T, Lendemans S, de Groot H, Petrat F. A new model of severe hemorrhagic shock in rats. Comp Med. 2011;61(5):419–426. [PMC free article] [PubMed] [Google Scholar]
- 15.Rohrig R, Rönn T, Lendemans S, Feldkamp T, de Groot H, Petrat F. Adverse Effects of Resuscitation With Lactated Ringer Compared With Ringer Solution After Severe Hemorrhagic Shock in Rats. Shock. 2012;38(2):137–145. [DOI] [PubMed] [Google Scholar]
- 16.Bendjelid K, Romand J-A. Fluid responsiveness in mechanically ventilated patients: a review of indices used in intensive care. Intensive Care Med. 2003;29(3):352–360. [DOI] [PubMed] [Google Scholar]
- 17.Eskesen TG, Wetterslev M, Perner A. Systematic review including re-analyses of 1148 individual data sets of central venous pressure as a predictor of fluid responsiveness. Intensive Care Med. 2016;42(3):324–332. [DOI] [PubMed] [Google Scholar]
- 18.Marik PE, Baram M, Vahid B. Does central venous pressure predict fluid responsiveness? A systematic review of the literature and the tale of seven mares. Chest. 2008;134(1):172–178. [DOI] [PubMed] [Google Scholar]
- 19.Alian A, Galante N, Stachenfeld N, Silveman D, Shelley K. Impact of lower body negative pressure induced hypovolemia on peripheral venous pressure waveform parameters in healthy volunteers. Physiol Meas. 2014;35:1509. [DOI] [PubMed] [Google Scholar]
- 20.De Backer D, Heenen S, Piagnerelli M, Koch M, Vincent J-L. Pulse pressure variations to predict fluid responsiveness: influence of tidal volume. Intensive Care Med. 2005;31(4):517–523. [DOI] [PubMed] [Google Scholar]
- 21.Choudhry MA, Schwacha MG, Hubbard WJ, et al. Gender differences in acute response to trauma-hemorrhage. Shock. 2005;24:101–106. [DOI] [PubMed] [Google Scholar]


