Abstract
PURPOSE
We aimed to evaluate the use of the COVID-19 reporting and data system (CO-RADS) among radiologists and the diagnostic performance of this system.
METHODS
Four radiologists retrospectively evaluated the chest CT examinations of 178 patients. The study included 143 patients with positive reverse transcriptase-polymerase chain reaction (RT-PCR) test results and 35 patients whose RT-PCR tests were negative but whose clinical and/or radiological findings were consistent with COVID-19. Fleiss’ kappa (κ) values were calculated, and individual observers’ scores were compared. To investigate diagnostic efficiency, receiver operating characteristic (ROC) curves were calculated for each interpreter.
RESULTS
The interpreters were in full agreement on 574 of 712 (80.6%) evaluations. The common Fleiss’ κ value of all the radiologists combined was 0.712 (95% confidence interval [CI] 0.692–0.769). A reliable prediction on the basis of RT-PCR and clinical findings indicated the mean area under the curve (AUC) of Fleiss’ κ value as 0.89 (95% CI 0.708–0.990). General interpreter agreement was found to range from moderate to good.
CONCLUSION
The interpreter agreement for CO-RADS categories 1 and 5 was reasonably good. We conclude that this scoring system will make a valuable contribution to efforts in COVID-19 diagnosis. CO-RADS can also be of significant value for the diagnosis and treatment of the disease in cases with false-negative PCR results.
The coronavirus disease 2019 (COVID-19) outbreak originated in Wuhan Province of China, in December 2019. The disease is caused by the severe acute respiratory syndrome coronavirus-2 (SARS-CoV-2) (1). COVID-19 is a rapidly spreading viral disease. Clinically, the disease can be asymptomatic or present as an upper respiratory tract infection; it can lead to extremely serious conditions such as pneumonia, encephalitis, pulmonary or systemic emboli formation, acute respiratory distress syndrome, respiratory failure, systemic inflammatory response, and sepsis (2–4). The definitive diagnosis of COVID-19 is made by the reverse transcription polymerase chain reaction (RT-PCR) test (5). However, this test lacks high sensitivity and specificity, and the results come rather late, after several hours and sometimes even days (6, 7). In addition, the RT-PCR test can give false-negative results during the early phases of the disease and in cases with a low viral load. In such conditions, computed tomography (CT) findings of the lungs may still indicate a COVID-19 infiltration (8, 9). On the other hand, CT findings of pulmonary involvement are not specific for COVID-19, so a COVID-19 diagnosis based solely on CT scan is not always practical. This is why The Radiological Society of North America and the Dutch Radiological Society have developed diagnostic systems with the sole purpose of evaluating the chest CT findings of patients with suspected COVID-19 infections. The American system is called the Expert Consensus Statement on Reporting Chest CT Findings Related to COVID-19, and the Dutch system is called COVID-19 Reporting and Data System (CO-RADS) (10, 11). The literature lacks a sufficient number of studies to properly audit and evaluate the utility of either diagnostic system at this point. The aim of this study was to evaluate the diagnostic accuracy and interrater agreement rates of the Dutch CO-RADS system on the basis of developing a common language for the definition of chest CT findings in patients suspected of having COVID-19 infection.
Methods
COVID-19 reporting and data system
The CO-RADS system defines a level of suspicion ranging from 1 to 5 to explain the CT findings of lung involvement in COVID-19 infections. Apart from this numerical assessment, the CO-RADS scoring system also has definition extensions such as CO-RADS category 0 for technically inadequate imaging and CO-RADS category 6 for the proven presence of disease through RT-PCR testing (11). The CO-RADS categories and definitions are shown in Table 1 (10, 11). There are a few important details to note. CO-RADS 3 also contains small ground-glass opacities that are not centrilobular (called CO-RADS 2) or that are not located near the visceral pleura (called CO-RADS 4). The findings of CO-RADS 4 are similar to CO-RADS 5, but the most important distinguishing feature is that it is unilateral.
Table 1.
Definitions of CO-RADS categories (The Dutch Radiological Society and RSNA consensus)
| Category | The Dutch Radiological Society |
|---|---|
| CO-RADS 0 | Technically insufficient imaging |
| CO-RADS 1 | Very low suspicion. Normal CT or some findings such as emphysema, perifissural nodule, tumor, and fibrosis |
| CO-RADS 2 | Low suspicion. Typical CT findings specific to infectious etiology that are not considered to be compatible with COVID-19. Bronchitis, infectious bronchiolitis, bronchopneumonia, lobar pneumonia, pulmonary abscess, cavitation |
| CO-RADS 3 | Suspicious. Findings for pulmonary involvement of COVID-19 based on CT characteristics, which can also be found in other viral pneumonias or non-infectious etiologies. Conditions such as GGOs with diffuse homogeneous, interlobular septal thickening with or without pleural effusion. CO-RADS 3 also contains small GGOs that are not centrilobular (otherwise called CO-RADS 2) or are not found near the visceral pleura (otherwise called CO-RADS 4) |
| CO-RADS 4 | High suspicion. Typical for COVID-19 but may have some overlap with other (especially viral) pneumonias. Findings can be defined as unilateral GGOs that are not in contact with the visceral pleura and show a predominant peribronchovascular distribution. Findings are similar to CO-RADS 5 but being unilateral is the most important differentiating feature |
| CO-RADS 5 | Very high suspicion. Typical CT findings. The main findings are bilateral, multifocal, GGOs close to visceral surfaces, with or without consolidation. Besides these, other findings may include reverse halo sign, large subpleural consolidations, air bronchograms, subpleural curvilinear bands, arching pattern with small connections to the pleura |
| CO-RADS 6 | Proven presence of COVID-19 by means of RT-PCR |
CO-RADS, COVID-19 Reporting and Data System; RSNA, Radiological Society of North America; CT, computed tomography; COVID-19, coronavirus disease 2019; GGOs, ground-glass opacities; RT-PCR, reverse transcriptase polymerase chain reaction.
Patient election and CT examination
Patients who presented at our hospital with suspicion of COVID-19 infection and underwent an RT-PCR test with non-contrast chest CT scan between March 11 and May 11, 2020, were screened for the study. COVID-19 is based on the presence of at least one of the symptoms of respiratory tract infection: high fever (>37.5°C); cough and clinically relevant shortness of breath, with or without a history suggesting exposure to SARS-CoV-2; and confirmed close association with a positive person, high prevalence of disease, or contact with persons with fever or respiratory symptoms from these areas within 14 days prior to the CT scan. The exclusion criteria were RT-PCR deficiency test results, time interval greater than one day between CT scan and RT-PCR and uninterpretable CT scans due to movement disorders or incomplete scanning. All patient data and RT-PCR results such as age, sex, multidisciplinary clinical diagnosis and follow-up were obtained from digital hospital records. The patients’ clinical information such as fever, cough, shortness of breath and need for oxygen at the time of admission to the emergency department was obtained from electronic information cards. The study group consisted of 143 patients with positive RT-PCR tests and 35 patients whose RT-PCR tests were negative but whose clinical and radiological findings were compatible with COVID-19. Patient selection was made by the clinician to avoid selection bias. Ethics committee and Turkish Ministry of Health approvals were obtained for the study (2020/877). The requirement for informed consent from the patients was waived due to the retrospective nature of the study.
CT studies were performed by a 128 multidetector CT (MDCT) system (Ingenuity 128, Philips). The technical parameters used during the CT examinations were as follows: 120 kvP, 75–400 mAs, rotation time 0.4 s, pitch 1.49 and slice thickness 1 mm. All raters performed their evaluations using separate individual Intellispace Service Healthcare (IPS) workstations.
Evaluation of images
All CT examinations were retrospectively evaluated by four general radiologists. The radiologists had not previously seen the CT images. Interpreters 1, 2, 3 and 4 had 10, 7, 6 and 4 years of experience, respectively. The interpreters were blinded against all patient data except age and sex. These raters were asked to conduct a CO-RADS scoring for each patient. The radiologists were additionally blinded against all information about the cohort, medical histories and the prevalence of COVID-19 cases under clinical follow-up.
Statistical analysis
The SPSS 23.0 software package (IBM Corp.) was used for the statistical analysis of the data. The categorical variables were stipulated as numbers and percentages, and the continuous variables were defined as mean, standard deviation and minimum and maximum values. Pearson’s chi-squared test was used to compare the categorical variables. A 5×5 confusion matrix was structured for each rater, and the CO-RADS score of each rater was plotted against the median CO-RADS score of the other three raters. A similar matrix was created by means of using the sum of the 5×5 matrix tables. The reference standard was determined as the score agreed on by all readers for each patient. Fleiss’ kappa (κ) was used in order to determine the agreement level among raters, and the κ values were obtained by comparing the CO-RADS scores of every individual interpreter with the median score of the other three interpreters. The interrater agreement levels were graded on the basis of the Fleiss’ κ values as follows: 0.01–0.20, nonsignificant; 0.21–0.40, weak; 0.41–0.60, moderate; 0.61–0.80, good; and 0.81–1.00, very good (12). The receiver operating characteristics (ROC) curve was structured for each interpreter, and the area under the curve (AUC) model was used to evaluate the CO-RADS performances according to the reference standards set for the diagnosis of COVID-19. A reference guide was established combining the PCR (+)ve and PCR (−)ve/Clinic (+)ve COVID-19 diagnoses. AUCs were calculated by using the method developed by Delong et al. (13). For each reader, the highest Youden index (J = sensitivity + specificity − 1) was calculated to select the optimal threshold to discriminate between CO-RADS 1, 2 or 3 and CO-RADS 4 or 5 participants, and the corresponding sensitivity, specificity, positive predictive value (PPV) and negative predictive value (NPV) were computed. The mean AUC and 95% confidence interval (CI) values among the interpreters were calculated. In addition, the mean percentages of cases appointed to each of the CO-RADS categories on the basis of the 95% CI segmentations were determined for each patient group.
Results
A total of 178 patients (female/male, 76/102, 42.7%/57.3%) were included in the study. The mean age of the patients was 47.1±16.3 years (min–max, 14–86 years). All patients were assigned to one of two groups: group 1 included patients with CO-RADS scores of 1, 2 or 3 and group 2 those with CO-RADS scores of 4 or 5. Relationships with age, sex, fever, cough, dyspnea and oxygen support among the two groups were evaluated. Cough and dyspnea were more common in group 2 compared with group 1 (p < 0.001 and p = 0.017, respectively). Similarly, patients in group 2 needed more oxygen support than those in group 1 (p < 0.001) (Table 2). As to RT-PCR positivity, 120 patients tested positive at initial diagnosis, while 23 patients tested positive on their second and third RT-PCR tests. Thus, a total of 143 patients demonstrated RT-PCR test positivity. The remaining 35 patients tested negative on two successive RT-PCR tests. However, these patients were hospitalized in spite of test negativity because their clinical and CT findings were consistent with COVID-19.
Table 2.
Demographic data and symptoms of patients
| Characteristics | All participants (n=178 ) | CO-RADS 1,2,3 (n=71) | CO-RADS 4,5 (n=107) | p |
|---|---|---|---|---|
| n (%) | n (%) | n (%) | ||
| Sex | 0.60 | |||
| Male | 102 (57.3) | 39 (55.0) | 63 (59.0) | |
| Female | 76 (42.7) | 32 (45.0) | 44 (41.0) | |
|
| ||||
| Age, years * | 47±16 (14–86) | 43±18 (18–85) | 49±16 (14–86) | 0.041 |
|
| ||||
| Symptoms | ||||
| Fever | 105 (58.9) | 47 (66.2) | 58 (54.2) | 0.12 |
| Cough | 140 (78.6) | 40 (56.3) | 100 (58.5) | <0.001 |
| Dyspnea | 53 (29.8) | 14 (19.7) | 39 (36.5) | 0.017 |
| Oxygen support | 31 (17.4) | 3 (4.2 ) | 28 (26.1) | <0.001 |
CO-RADS, COVID-19 Reporting and Data System.
Age is presented as mean±standard deviation and range.
There was full agreement among 574 (80.6%) of the 712 observations. Individually, the agreement rates based on CO-RADS categorizations were as follows: CO-RADS 1 (153/712, 21.4%), CO-RADS 2 (36/712, 5%), CO-RADS 3 (36/712, 5%), CO-RADS 4 (75/712, 10.5%) and CO-RADS 5 (274/712, 38.8%). The highest agreement rates were found in CO-RADS 1 and 5. Four of the CO-RADS 1 cases were categorized as CO-RADS 5, whereas only 1 CO-RADS 5 case was evaluated as CO-RADS 1. All findings are listed in detail in Table 3, and sample cases of CO-RADS categories 2 through 5 are shown in Figs. 1–4.
Table 3.
5×5 table of CO-RADS scores of all observers
| Medians of observers | ||||||
|---|---|---|---|---|---|---|
| CO-RADS 1 | CO-RADS 2 | CO-RADS 3 | CO-RADS 4 | CO-RADS 5 | ||
| Sums of all individual observers | CO-RADS 1 n=175 (24.6%) |
153 (21.4) | 12 (1.6) | 4 (0.5) | 2 (0.2) | 4 (0.5) |
| CO-RADS 2 n=59 (8.3%) |
5 (0.7) | 36 (5) | 12 (1.5) | 5 (0.7) | 1 (0.3) | |
| CO-RADS 3 n=68 (9.6%) |
0 (0) | 11 (1.5) | 36 (5) | 19 (2.6) | 2 (0.2) | |
| CO-RADS 4 n=127 (17.8%) |
1 (0.1) | 1 (0.1) | 11 (1.5) | 75(10.5) | 39 ( 5.4) | |
| CO-RADS 5 n=283 (40.1%) |
1 (0.1) | 0 (0) | 7 (0.9) | 7 (0.9) | 274 (38.4) | |
Data are presented as n (%).
CO-RADS, COVID-19 Reporting and Data System.
Figure 1.
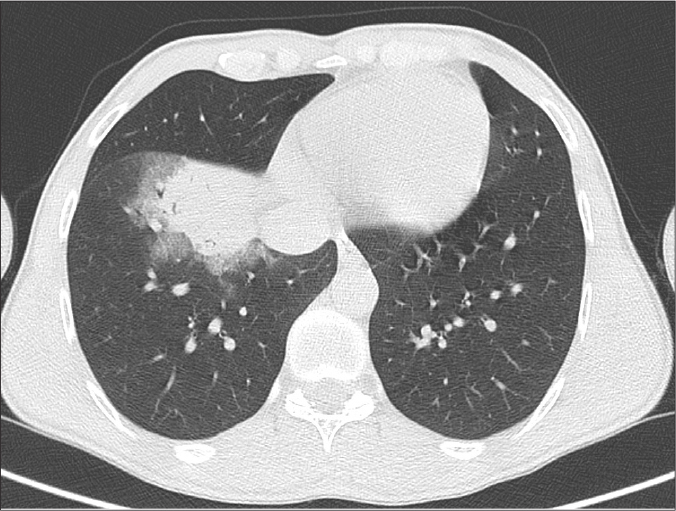
CO-RADS 2. A 29-year-old woman presenting with a 5-day history of cough and fever. Axial CT image at parenchymal window shows a lobar consolidated area in the middle lobe of the right lung. The patient’s RT-PCR test was positive.
Figure 2.
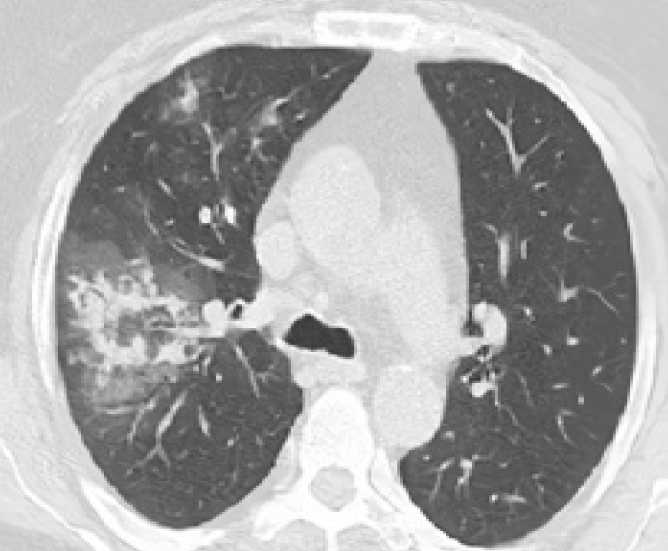
CO-RADS 3. A 33-year-old woman with a history of 5 days of cough, fever, and dyspnea. Axial chest CT shows ground-glass opacities (GGOs) with superimposed consolidations in a centrilobular pattern in the right lung. The patient’s RT-PCR test was positive.
Figure 3.
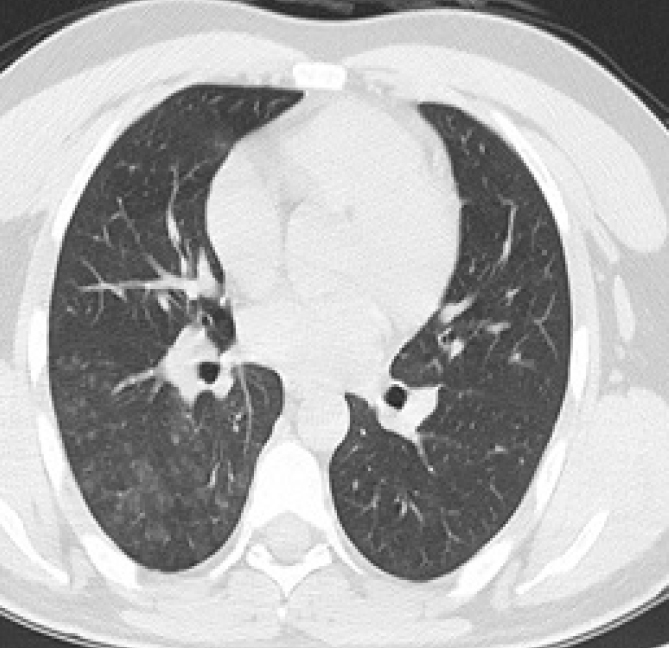
CO-RADS 4. A 28-year-old man presenting with a clinical history of cough and fever in the last 4 days. Axial chest CT image shows GGOs with unilateral centrilobular dissemination in the right lung. The patient’s RT-PCR test was positive.
Figure 4.
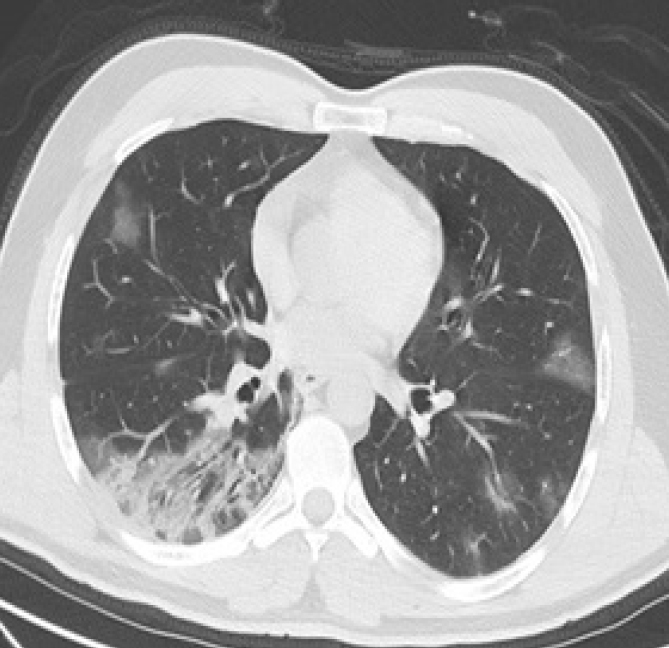
CO-RADS 5. A 40-year-old man presenting with fever and cough that had been going on for a week. Axial chest CT image demonstrates bilateral multifocal subpleural GGOs and consolidations. The patient tested negative on RT-PCR test.
The Fleiss’ κ values of each interpreter were compared with the median Fleiss’ κ value of the other three raters. The common Fleiss’ κ value of all interpreters combined was 0.732 (0.692–0.769). The AUCs and CIs for each patient group are presented in Table 4. The interpreter agreement level was perfect between interpreters 2 and 4 and moderate between interpreters 2 and 3.
Table 4.
CO-RADS interobserver comparison and performance
| κ (95% CI) | AUC vs. RT-PCR diagnosis | |
|---|---|---|
| Interpreter 1 | 0.872 (0.813–0.927) | 0.983 (0.961–0.997) |
| Interpreter 2 | 0.843 (0.775–0.904) | 0.860 (0.809–0.91) |
| Interpreter 3 | 0.550 (0.464–0.637) | 0.955 (0.921–0.983) |
| Interpreter 4 | 0.676 (0.588–0.752) | 0.775 (0.708–0.837) |
| Overall | 0.732 (0.692–0.769)* | 0.893 (0.708–0.997) |
The interobserver performance comparisons are demonstrated in this table. For each interpreter, the κ scores are compared with the AUC values, which are plotted against the reference standards defined by RT-PCR and clinical diagnoses.
CO-RADS, COVID-19 Reporting and Data System; CI, confidence interval; AUC, area under the curve; RT-PCR, reverse transcriptase polymerase chain reaction.
Fleiss κ.
When mixing all data sets from each radiologist, an optimal diagnostic threshold of CO-RADS ≥ 4 was obtained. Individual results were as follows: interpreter 1 had 98% sensitivity and 94% specificity (AUC 0.962, 95% CI 0.923–0.985); interpreter 2 had 89% sensitivity and 98% specificity (AUC 0.942, 95% CI 0.896–0.971); interpreter 3 had 93% sensitivity and 94% specificity (AUC 0.939, 95% CI 0.893–0.969) and interpreter 4 had 87% sensitivity and 91% specificity (AUC 0.897, 95% CI 0.843–0.937). Diagnostic accuracy values for all interpreters are presented in Table 5. The ROC curve for all interpreters estimating pulmonary involvement with COVID-19 using the CO-RADS scoring system is shown in Fig. 5.
Table 5.
Interpreter diagnostic performance for lung involvement by COVID-19 when CO-RADS ≥ 4 is used as a positive threshold
| Interpreter | Sensitivity (%) | Specificity (%) | PPV (%) | NPV (%) | AUC |
|---|---|---|---|---|---|
| Interpreter 1 | 98.1 (93.4–99.8) | 94.3 (86.2–98.4) | 96.3 (91–98.6) | 97.1 (89.4–99.3) | 0.962 (0.923–0.985) |
| Interpreter 2 | 89.7 (82.3–94.8) | 98.6 (92.4–100) | 99 (93.2–99.9) | 86.4 (78.4–91.8) | 0.942 (0.896–0.971) |
| Interpreter 3 | 93.4 (87–97.3) | 94.3 (86.2–98.4) | 96.2 (90.6–98.5) | 90.5 (82.4–95.2) | 0.939 (0.893–0.969) |
| Interpreter 4 | 87.8 (80.1–93.4) | 91.5 (82.5–96.8) | 94 (87.9–97.1) | 83.3 (74.9–89.3) | 0.897 (0.843–0.937) |
Data in parentheses are numerators and denominators, with 95% confidence intervals in brackets.
COVID-19, coronavirus disease-2019; CO-RADS, COVID-19 Reporting and Data System; PPV, positive predictive value; NPV, negative predictive value; AUC, area under the ROC.
Figure 5.
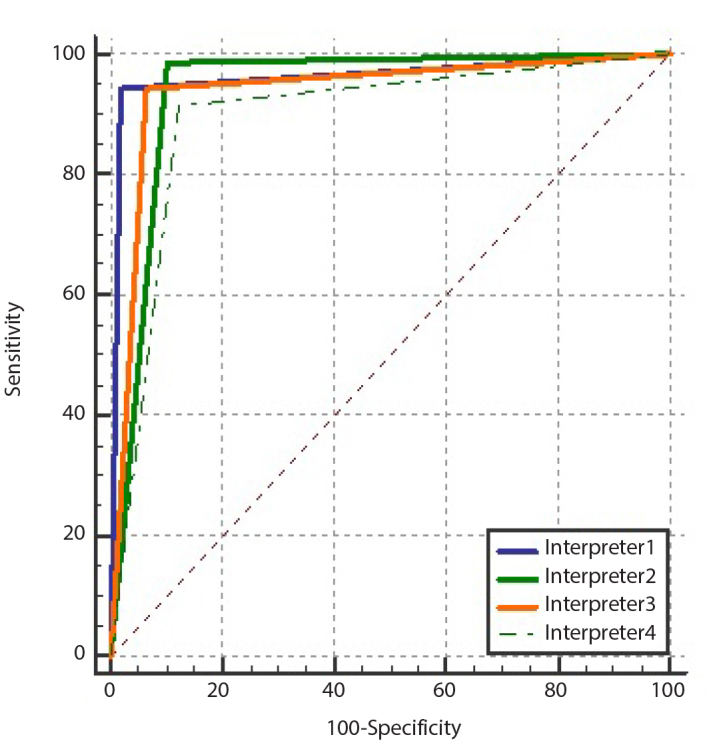
Receiver operating characteristic curves of all interpreters predicting lung involvement in COVID-19 using the COVID-19 Reporting and Data System (CO-RADS).
Discussion
COVID-19 may be asymptomatic in some individuals, while it may lead to severe conditions including devastating lung disease in others (2–4). The CO-RADS classification is a categorical system developed for the standardized evaluation of chest CT findings in patients suspected of having COVID-19. This scoring scale was created to use a common diagnostic language among radiologists and clinicians, which is of utmost importance because the world may face further waves of COVID-19 pandemic, and a rapid and common response to such a development will be crucial (11).
The interpreters showed agreement in 80.4% of the ratings, with the highest scores in CO-RADS categories 1 and 5. No serious disagreement was seen in cases with characteristic chest CT findings, but in patients with atypical findings the level of agreement dropped to a moderate level. In our study, the diagnostic performance of all interpreters was notably high when a CO-RADS ≥4 threshold was set (Table 4). A consensus of 68.2% was found in a study where 105 patients were evaluated by 8 interpreters (11). In that study, as in ours, the highest agreements were obtained in CO-RADS categories 1 and 5. Another important outcome of our study was the placement of 39 of the CO-RADS category 4 patients into CO-RADS category 5 during the 5×5 table evaluations. Based on this finding, it may be concluded that CO-RADS category 4 patients can be defined as COVID-19 positive cases in the presence of a high clinical likelihood. It must be kept in mind that there may not be a pulmonary finding in the early phases of mild cases of the disease designated as CO-RADS 1 and 2 (14). CO-RADS 3, on the other hand, is the category that harbors atypical findings, and this group is rather difficult to evaluate by CT findings alone (10). Evaluating patients with CO-RADS category 3 scores in the light of clinical information may increase diagnostic accuracy.
The common Fleiss’ κ value of the entire group of raters was 0.732, indicating a good congruence among the raters. The agreement coefficient should increase as the system becomes more widespread and is better understood by practitioners. The AUC value was 0.89 when the CO-RADS performance score, RT-PCR result, and clinical findings were evaluated in combination. Both the CO-RADS performance score and the interpreter agreement demonstrate the utility and reliability of the CO-RADS system. Based on interrater congruences, the least experienced interpreter had a mild degree of agreement with the other interpreters, while the other three interpreters demonstrated a notably high degree of mutual agreement.
Our study has certain limitations. First, it is a single-center retrospective study, and the patient population was not large. Prospective, multicenter studies are needed to evaluate and perhaps refine our results. In addition, the sample was made up of patients admitted to the hospital’s emergency department in the acute phase of COVID-19 who were hospitalized based on clinical findings and do not include asymptomatic patients. We think that this may have biased patient selection against participants with a more severe disease spectrum and thus affect the CO-RADS accuracy estimate. Another limitation was that the RT-PCR tests were not positive in all cases. PCR tests of 35 evaluated patients were negative despite at least two repetitions. Although this raises concerns about the reliability of the reference standard in this subset of participants, significant rates of false-negative RT-PCR tests have been reported at baseline (7, 15, 16). The duration of onset and extent of symptoms are unknown, which is also a limitation of our study. It is known that pulmonary findings vary according to the stage of the disease (17). Since the signs and symptoms will change over time according to the stage of the disease, CO-RADS scores will also change. This problem may be overcome by keeping a highly detailed account of clinical histories and the use of intensity scales. Other limitations of the CO-RADS system are lack of information about any underlying lung disease and the inability to evaluate possible vascular pathologies. However, it should be emphasized that if a vascular pathology is suspected, a contrast-enhanced CT study can be performed, thus helping to confirm or refute the suspicion. Finally, a definitive diagnosis was lacking for patients with false-positive CT findings. Therefore, we were unable to evaluate the prevalence of comorbidities or other respiratory infections whose imaging findings could coincide with those typically observed in COVID-19. Additional studies addressing this issue are recommended to further refine the CO-RADS algorithm, as its performance is affected by the prevalence of other conditions with overlapping CT findings.
In conclusion, the number of COVID-19 cases worldwide are declining, but there is still a global concern that the pandemic will recur. At present, the number of COVID-19 cases worldwide appears to be out of control in some parts of the world and substantially under control in other parts (18). An accurate and rapid approach is crucial to the diagnosis and treatment of the disease. CO-RADS is a very practical and reliable system in diagnosing COVID-19. The results of our study revealed good agreement among interpreters, especially in CO-RADS categories 1 and 5. However, we believe that future multicenter studies with larger populations could add a great deal of value to the CO-RADS system.
Main points.
COVID-19 Reporting and Data System (CO-RADS) demonstrated good diagnostic accuracy for lung involvement by COVID-19 with an average AUC of 0.893 (95% CI 0.708–0.997).
Agreement between radiologists was moderate using the CO-RADS classification.
While CO-RADS 3 is the most frequently misinterpreted score, CO-RADS 1 and 5 are the most likely scores to be agreed upon.
Footnotes
Conflict of interest disclosure
The authors declared no conflicts of interest.
References
- 1.Zu ZY, Jiang MD, Xu PP, et al. Coronavirus Disease 2019 (COVID-19): a perspective from China. Radiology. 2020;296:15–25. doi: 10.1148/radiol.2020200490. [DOI] [PMC free article] [PubMed] [Google Scholar]
- 2.Zhu N, Zhang D, Wang W, et al. A novel coronavirus from patients with pneumonia in China, 2019. N Engl J Med. 2020;382:727–733. doi: 10.1056/NEJMoa2001017. [DOI] [PMC free article] [PubMed] [Google Scholar]
- 3.Xu Z, Shi L, Wang Y, et al. Pathological findings of COVID-19 associated with acute respiratory distress syndrome. Lancet Respir Med. 2020;8:420–422. doi: 10.1016/S2213-2600(20)30076-X. [DOI] [PMC free article] [PubMed] [Google Scholar]
- 4.Zhou F, Yu T, Du R, et al. Clinical course and risk factors for mortality of adult in patients with COVID-19 in Wuhan, China: a retrospective cohort study. Lancet. 2020;395:1054–1062. doi: 10.1016/S0140-6736(20)30566-3. [DOI] [PMC free article] [PubMed] [Google Scholar]
- 5.Corman VM, Landt O, Kaiser M, et al. Detection of 2019 novel coronavirus (2019-nCoV) by real-time RT-PCR. Euro Surveill. 2020;25:2000045. doi: 10.2807/1560-7917.ES.2020.25.3.2000045. [DOI] [PMC free article] [PubMed] [Google Scholar]
- 6.Ai T, Yang Z, Hou H, et al. Correlation of chest CT and RT-PCR testing in coronavirus disease 2019 (COVID-19) in China: a report of 1014 cases. Radiology. 2020;296:32–40. doi: 10.1148/radiol.2020200642. [DOI] [PMC free article] [PubMed] [Google Scholar]
- 7.Fang Y, Zhang H, Xie J, et al. Sensitivity of chest CT for COVID-19: comparison to RT-PCR. Radiology. 2020;296:115–117. doi: 10.1148/radiol.2020200432. [DOI] [PMC free article] [PubMed] [Google Scholar]
- 8.Wu J, Wu X, Zeng W, et al. Chest CT findings in patients with coronavirus disease 2019 and its relationship with clinical features. Invest Radiol. 2020;55:257–261. doi: 10.1097/RLI.0000000000000670. [DOI] [PMC free article] [PubMed] [Google Scholar]
- 9.Long C, Xu H, Shen Q, et al. Diagnosis of the coronavirus disease (COVID-19): rRT-PCR or CT? Eur J Radiol. 2020;126:108961. doi: 10.1016/j.ejrad.2020.108961. [Online ahead of print] [DOI] [PMC free article] [PubMed] [Google Scholar]
- 10.Simpson S, Kay FU, Abbara S, et al. Radiological Society of North America Expert Consensus Statement on reporting chest CT findings related to COVID-19. Radiol Cardiothorac Imaging. 2020:e200152. doi: 10.1148/ryct.2020200152. [DOI] [PMC free article] [PubMed] [Google Scholar]
- 11.Prokop M, van Everdingen W, van Rees Vellinga T, et al. CO-RADS: a categorical CT assessment scheme for patients with suspected COVID-19: definition and evaluation. Radiology. 2020;296:97–104. doi: 10.1148/radiol.2020201473. [DOI] [PMC free article] [PubMed] [Google Scholar]
- 12.Fleiss JL, Cohen J. The equivalence of weighted kappa and the intraclass correlation coefficient as measures of reliability. Educ Psychol Meas. 1973;33:613–619. doi: 10.1177/001316447303300309. [DOI] [Google Scholar]
- 13.DeLong ER, DeLong DM, Clarke-Pearson DL. Comparing the areas under two or more correlated receiver operating characteristic curves: a nonparametric approach. Biometrics. 1988;44:837–845. doi: 10.2307/2531595. [DOI] [PubMed] [Google Scholar]
- 14.Li K, Fang Y, Li W, et al. CT image visual quantitative evaluation and clinical classification of coronavirus disease (COVID-19) Eur Radiol. 2020;30:4407–4416. doi: 10.1007/s00330-020-06817-6. [DOI] [PMC free article] [PubMed] [Google Scholar]
- 15.Xu B, Xing Y, Peng J, et al. Chest CT for detecting COVID19: a systematic review and meta-analysis of diagnostic accuracy. Eur Radiol. 2020;30:5720–5727. doi: 10.1007/s00330-020-06934-2. [DOI] [PMC free article] [PubMed] [Google Scholar]
- 16.Xie X, Zhong Z, Zhao W, et al. Chest CT for typical 2019-nCoV pneumonia: relationship to negative RTPCR testing. Radiology. 2020;296:E41–E45. doi: 10.1148/radiol.2020200343. [DOI] [PMC free article] [PubMed] [Google Scholar]
- 17.Pan F, Ye T, Sun P, et al. Time course of lung changes at chest CT during recovery from Coronavirus Disease 2019 (COVID-19) Radiology. 2020;295:715–721. doi: 10.1148/radiol.2020200370. [DOI] [PMC free article] [PubMed] [Google Scholar]
- 18.WHO coronavirus disease (COVID-19) dashboard. [Accessed on Jan 2021]. Available at: https://covid19.who.int.


