Vaccines currently are the primary mitigation strategy to combat COVID-19 around the world. For instance, the narrative related to the ongoing surge of new cases in the United States (US) is argued to be driven by areas with low vaccination rates [1]. A similar narrative also has been observed in countries, such as Germany and the United Kingdom [2]. At the same time, Israel that was hailed for its swift and high rates of vaccination has also seen a substantial resurgence in COVID-19 cases [3]. We investigate the relationship between the percentage of population fully vaccinated and new COVID-19 cases across 68 countries and across 2947 counties in the US.
Methods
We used COVID-19 data provided by the Our World in Data for cross-country analysis, available as of September 3, 2021 (Supplementary Table 1) [4]. We included 68 countries that met the following criteria: had second dose vaccine data available; had COVID-19 case data available; had population data available; and the last update of data was within 3 days prior to or on September 3, 2021. For the 7 days preceding September 3, 2021 we computed the COVID-19 cases per 1 million people for each country as well as the percentage of population that is fully vaccinated.
For the county-level analysis in the US, we utilized the White House COVID-19 Team data [5], available as of September 2, 2021 (Supplementary Table 2). We excluded counties that did not report fully vaccinated population percentage data yielding 2947 counties for the analysis. We computed the number and percentages of counties that experienced an increase in COVID-19 cases by levels of the percentage of people fully vaccinated in each county. The percentage increase in COVID-19 cases was calculated based on the difference in cases from the last 7 days and the 7 days preceding them. For example, Los Angeles county in California had 18,171 cases in the last 7 days (August 26 to September 1) and 31,616 cases in the previous 7 days (August 19–25), so this county did not experience an increase of cases in our dataset. We provide a dashboard of the metrics used in this analysis that is updated automatically as new data is made available by the White House COVID-19 Team (https://tiny.cc/USDashboard).
Findings
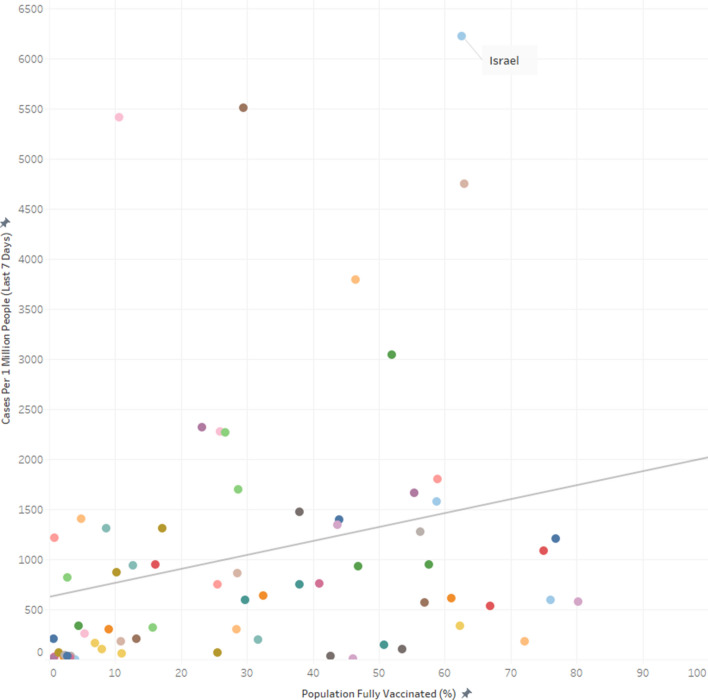
At the country-level, there appears to be no discernable relationship between percentage of population fully vaccinated and new COVID-19 cases in the last 7 days (Fig. 1). In fact, the trend line suggests a marginally positive association such that countries with higher percentage of population fully vaccinated have higher COVID-19 cases per 1 million people. Notably, Israel with over 60% of their population fully vaccinated had the highest COVID-19 cases per 1 million people in the last 7 days. The lack of a meaningful association between percentage population fully vaccinated and new COVID-19 cases is further exemplified, for instance, by comparison of Iceland and Portugal. Both countries have over 75% of their population fully vaccinated and have more COVID-19 cases per 1 million people than countries such as Vietnam and South Africa that have around 10% of their population fully vaccinated.
Fig. 1.
Relationship between cases per 1 million people (last 7 days) and percentage of population fully vaccinated across 68 countries as of September 3, 2021 (See Table S1 for the underlying data)
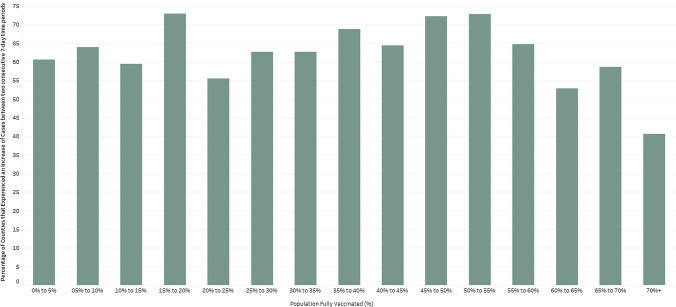
Across the US counties too, the median new COVID-19 cases per 100,000 people in the last 7 days is largely similar across the categories of percent population fully vaccinated (Fig. 2). Notably there is also substantial county variation in new COVID-19 cases within categories of percentage population fully vaccinated. There also appears to be no significant signaling of COVID-19 cases decreasing with higher percentages of population fully vaccinated (Fig. 3).
Fig. 2.
Median, interquartile range and variation in cases per 100,000 people in the last 7 days across percentage of population fully vaccinated as of September 2, 2021
Fig. 3.
Percentage of counties that experienced an increase of cases between two consecutive 7-day time periods by percentage of population fully vaccinated across 2947 counties as of September 2, 2021
Of the top 5 counties that have the highest percentage of population fully vaccinated (99.9–84.3%), the US Centers for Disease Control and Prevention (CDC) identifies 4 of them as “High” Transmission counties. Chattahoochee (Georgia), McKinley (New Mexico), and Arecibo (Puerto Rico) counties have above 90% of their population fully vaccinated with all three being classified as “High” transmission. Conversely, of the 57 counties that have been classified as “low” transmission counties by the CDC, 26.3% (15) have percentage of population fully vaccinated below 20%.
Since full immunity from the vaccine is believed to take about 2 weeks after the second dose, we conducted sensitivity analyses by using a 1-month lag on the percentage population fully vaccinated for countries and US counties. The above findings of no discernable association between COVID-19 cases and levels of fully vaccinated was also observed when we considered a 1-month lag on the levels of fully vaccinated (Supplementary Figure 1, Supplementary Figure 2).
We should note that the COVID-19 case data is of confirmed cases, which is a function of both supply (e.g., variation in testing capacities or reporting practices) and demand-side (e.g., variation in people’s decision on when to get tested) factors.
Interpretation
The sole reliance on vaccination as a primary strategy to mitigate COVID-19 and its adverse consequences needs to be re-examined, especially considering the Delta (B.1.617.2) variant and the likelihood of future variants. Other pharmacological and non-pharmacological interventions may need to be put in place alongside increasing vaccination rates. Such course correction, especially with regards to the policy narrative, becomes paramount with emerging scientific evidence on real world effectiveness of the vaccines.
For instance, in a report released from the Ministry of Health in Israel, the effectiveness of 2 doses of the BNT162b2 (Pfizer-BioNTech) vaccine against preventing COVID-19 infection was reported to be 39% [6], substantially lower than the trial efficacy of 96% [7]. It is also emerging that immunity derived from the Pfizer-BioNTech vaccine may not be as strong as immunity acquired through recovery from the COVID-19 virus [8]. A substantial decline in immunity from mRNA vaccines 6-months post immunization has also been reported [9]. Even though vaccinations offers protection to individuals against severe hospitalization and death, the CDC reported an increase from 0.01 to 9% and 0 to 15.1% (between January to May 2021) in the rates of hospitalizations and deaths, respectively, amongst the fully vaccinated [10].
In summary, even as efforts should be made to encourage populations to get vaccinated it should be done so with humility and respect. Stigmatizing populations can do more harm than good. Importantly, other non-pharmacological prevention efforts (e.g., the importance of basic public health hygiene with regards to maintaining safe distance or handwashing, promoting better frequent and cheaper forms of testing) needs to be renewed in order to strike the balance of learning to live with COVID-19 in the same manner we continue to live a 100 years later with various seasonal alterations of the 1918 Influenza virus.
Supplementary Information
Below is the link to the electronic supplementary material.
Footnotes
Publisher's Note
Springer Nature remains neutral with regard to jurisdictional claims in published maps and institutional affiliations.
Change history
10/27/2021
The title of the Supplementary Table S1 has been corrected.
References
- 1.Vaccinations CDC. CDC COVID data tracker. Centers for Disease Control and Prevention. 2021. https://covid.cdc.gov/covid-data-tracker/#vaccinations.
- 2.Nicolas E. Germany mulls restrictions for unvaccinated as cases soar. EUobserver; 2021. https://euobserver.com/coronavirus/152534.
- 3.Estrin D. Highly vaccinated Israel is seeing a dramatic surge in New COVID cases. Here's why. NPR; 2021. https://www.npr.org/sections/goatsandsoda/2021/08/20/1029628471/highly-vaccinated-israel-is-seeing-a-dramatic-surge-in-new-covid-cases-heres-why.
- 4.Ritchie H, Ortiz-Ospina E, Beltekian D, Mathieu E, Hasell J, Macdonald B, Giattino C, Appel C, Rodés-Guirao L, Roser M. Coronavirus pandemic (COVID-19). 2020. Published online at OurWorldInData.org. Retrieved from: https://ourworldindata.org/coronavirus.
- 5.White House COVID-19 Team. COVID-19 community profile report. 2020. HealthData.gov. https://healthdata.gov/Health/COVID-19-Community-Profile-Report/gqxm-d9w9.
- 6.Ministry of Health Israel. Two-dose vaccination data. Government of Israel; 2021. https://www.gov.il/BlobFolder/reports/vaccine-efficacy-safety-follow-up-committee/he/files_publications_corona_two-dose-vaccination-data.pdf.
- 7.Thomas SJ, Moreira ED, Kitchin N, Absalon J, Gurtman A, Lockhart S, Perez JL, et al. Six Month safety and efficacy of the BNT162b2 Mrna Covid-19 vaccine. MedRxiv. 2021 doi: 10.1101/2021.07.28.21261159. [DOI] [PMC free article] [PubMed] [Google Scholar]
- 8.Gazit S, Shlezinger R, Perez G, Lotan R, Peretz A, Ben-Tov A, Cohen D, Muhsen K, Chodick G, Patalon T. Comparing sars-cov-2 natural immunity to vaccine-induced immunity: reinfections versus breakthrough infections. MedRxiv. 2021 doi: 10.1101/2021.08.24.21262415. [DOI] [PMC free article] [PubMed] [Google Scholar]
- 9.Canaday DH, Oyebanji OA, Keresztesy D, Payne M, Wilk D, Carias L, Aung H, Denis KS, Lam EC, Rowley CF, Berry SD, Cameron CM, Cameron MJ, Wilson B, Balazs AB, King CL, Gravenstein S. Significant reduction in humoral Immunity among healthcare workers and nursing home residents 6 months AFTER COVID-19 BNT162b2 mRNA vaccination. MedRxiv. 2021 doi: 10.1101/2021.08.15.21262067. [DOI] [Google Scholar]
- 10.McMorrow M. (rep.). Improving communications around vaccine breakthrough and vaccine effectiveness. 2021. Retrieved from https://context-cdn.washingtonpost.com/notes/prod/default/documents/8a726408-07bd-46bd-a945-3af0ae2f3c37/note/57c98604-3b54-44f0-8b44-b148d8f75165.
Associated Data
This section collects any data citations, data availability statements, or supplementary materials included in this article.


