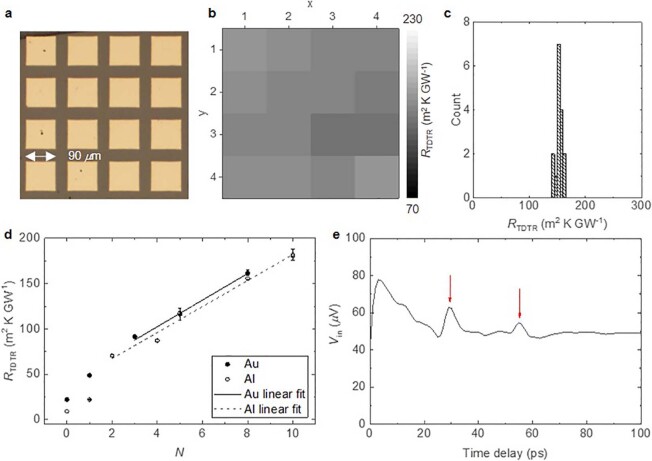
Extended Data Fig. 3. Additional TDTR measurements and details.
a, Microscope image of an N = 10 r-MoS2 film coated with a square grid of Al pads. b, 4 × 4 TDTR map of RTDTR of an N = 10 r-MoS2 film. c, Histogram of RTDTR array measurements. d, TDTR measurements of N ≤ 10 r-TMD films coated with Au or Al. The error bars denote s.d.; number of TDTR measurements per film sample, n = 3 for Au samples; n = 3–5 for the Al samples. e, Picosecond acoustics of a MoS2 monolayer on thick sapphire substrate, coated with an Al transducer layer. The y axis Vin is the in-phase signal of the lock-in amplifier. The red arrows indicate the acoustic waves reflected at the Al/MoS2 interface.

