

Abstract
Osteoarthritis development after ACL reconstruction (ACLR) is not well understood. Investigators have examined associations between knee biomechanical alterations and quantitative MRI (qMRI) variables, reflective of cartilage health, 12–60 months following ACLR; however, none have done so early after surgery. As part of an exploratory study, forty-five individuals (age: 23 ± 7 years) underwent motion analysis during walking and qMRI three months after ACLR. For each limb, peak knee adduction moment (pKAM) and peak knee flexion moment (pKFM) were determined using inverse dynamics and peak medial compartment force (pMCF) was calculated using a neuromusculoskeletal model. T2 relaxation times in the medial compartment and linear regressions were used to determine the associations between gait variables and deep and superficial cartilage T2 relaxation times in six regions. pKAM was positively associated with deep layer T2 relaxation times within the femoral central and posterior regions when examined in the involved limb and from an interlimb difference perspective (involved limb – uninvolved limb). After adjusting for age, the association between interlimb difference of pKAM and interlimb difference of deep layer T2 relaxation times in the tibial central region became significant (p = 0.043). Interlimb difference of pKFM was negatively associated with interlimb difference of deep layer T2 relaxation times within the femoral central and posterior regions. These associations suggest that degenerative pathways leading to osteoarthritis may be detectable as early as three months after reconstruction.
Key Terms –: ACL, Reconstruction, Osteoarthritis-Post Traumatic, Biomechanics, Knee, Kinematics and Kinetics, T2 Mapping
Introduction
Anterior cruciate ligament (ACL) tears are one of the most common and devastating knee injuries1,2. Common among young, otherwise healthy, individuals, this injury can result in joint instability and leave other structures susceptible to further damage3. While some elect to focus on rehabilitation to regain knee stability without an ACL, others elect to undergo ACL reconstructive surgery (ACLR)4,5. Although ACLR restores stability within the afflicted limb it does little to prevent the development of post-traumatic osteoarthritis (OA)5,6. Twenty-seven% of individuals develop radiographic tibiofemoral OA within five years of surgery and upwards of 50–90% do so within 10–20 years, primarily within the medial compartment6–9. Those who develop OA after ACLR typically do so 15–20 years earlier than those without a history of traumatic knee injury, resulting in a “young patient with an old knee”8,10,11. Thus, there is a critical need to understand the mechanisms associated with OA development so that preventative measures can be designed and implemented to delay disease progression.
One mechanism associated with the development of OA after ACLR is altered knee gait mechanics in the early months after surgery12,13. Several reviews and meta-analyses have summarized recent literature in this area of study13–15. Altered biomechanical variables typically include peak knee flexion angle, peak knee flexion moment (pKFM), and peak knee adduction moment (pKAM) in the involved limb (vs. uninvolved limb and healthy controls); alterations in the uninvolved limb, compared to healthy controls, may also exist13–15. Previous work has associated alterations in knee gait mechanics to the development of idiopathic OA. Knee adduction moment, considered a surrogate measure for medial-lateral tibiofemoral compartment force distribution16,17, has been associated with OA severity, pain, and rate of OA progression17–21. Knee flexion moment, reflective of agonist and antagonist muscle forces and thus compartmental load magnitude22, has been associated with changes in knee cartilage thickness as well as pain in those with OA17,21. Those who develop radiographic OA five years after ACLR demonstrate lower peak medial compartment forces (pMCF) in the early months after surgery (6–12 months) compared to those who do not develop OA12. Thus, there is great potential to use these variables to gain insight into OA development after ACLR.
Investigators are increasingly turning to magnetic resonance imaging (MRI) to detect and monitor early signs of OA. Quantitative MRI (qMRI) is a useful tool to evaluate subtle biochemical changes in knee cartilage that occur prior to irreversible morphometric degradation23,24. T2 mapping, one qMRI technique, provides insights into the integrity of the collagen matrix and water content within cartilage24–26. A prolonged T2 relaxation time is indicative of collagen matrix degradation and higher water content; biochemical changes seen during the initiation of OA25. T2 relaxation times are sensitive to the laminar differences in collagen structure seen within the deep and superficial layers of cartilage and hence those layers are typically analyzed separately24.
Damage to cartilage sustained at the time of ACL rupture may influence the susceptibility of cartilage to alterations in knee gait mechanics. The twisting motion at the time of injury2 may induce excessive shearing forces in the deeper layers of cartilage not designed to handle such loads27. This may leave the deeper layers of cartilage structurally compromised and more sensitive to mechanical stimulus compared to the superficial layers of cartilage.
Individually, gait mechanics and qMRI following ACLR provide insights into mechanisms leading to OA development. However, OA is a complex, multifactorial disease dependent on the intricate relationships between biomechanical, biochemical, and structural factors28,29. Gaining insight into these relationships may provide a better understanding of the mechanisms responsible for eventual disease development. Some investigators have examined associations between these variables; however, most have done so in the later months after surgery when cartilage alterations may be too advanced for interventions to be effective30–32. Understanding these associations early after surgery may provide insight into OA’s pathogenesis and may reveal mechanical targets to address via interventions early in the recovery process.
The purpose of this study was to examine the relationship between biomechanical variables associated with OA development and progression (pKAM, pKFM, and pMCF) and T2 relaxation times in both the deep and superficial layers of knee cartilage three months after ACLR. These relationships were investigated in the medial tibiofemoral compartment from both an involved limb perspective and from an interlimb difference (involved limb value – uninvolved limb value) perspective. We hypothesized that these key biomechanical variables would be associated with deep, but not superficial, layer T2 relaxation times, whether looking at the involved limb or interlimb difference.
Methods
Participants
Forty-five individuals (Table 1) from an ongoing, cohort study (R01-HD087459) were included in this study. Participants met the following inclusion criteria: between 16–45 years old, unilateral ACLR with no prior ACL injury/repair and no history of major lower leg injury/surgery, no other concomitant grade III ligament tears, no repairable meniscus injury, and no contraindications for MRI.
Table 1.
Participant Demographic Characteristics (n = 45)
| Variable | Mean ± Standard Deviation or Number (%) |
|---|---|
| Age | 23 ± 7 years |
| Sex | 20 women (44%), 25 men (56%) |
| Height | 1.7 ± 0.1 meters |
| Weight | 78.2 ± 14.7 kilograms |
| BMI | 24.8 ± 3.5 kilograms/meter2 |
| Graft Type | 8 soft-tissue allograft (18%), 15 hamstring autograft (33%), 22 bone-patellar tendon-bone autograft (49%) |
| Meniscal Status | 11 partial lateral meniscectomy (24%), 11 partial medial meniscectomy (24%), 2 partial medial and lateral meniscectomy (5%), 21 no meniscectomy (47%) |
| Walking Speed | 1.6 ± 0.2 meters/second |
All data collections were performed at one institution after approval from an Institutional Review Board. Enrollment began in April 2016 and is ongoing. Prior to participation in the study, all participants gave informed consent. For individuals under the age of 18, both minor assent and parental consent were obtained before enrollment.
Motion Analysis
Each participant underwent motion analysis testing during over-ground walking three months (3.1 ± 0.5) after ACLR. During the experiment, participants walked along a 6-meter pathway at a self-selected speed that was maintained throughout (within ±5%). Motion data during walking were recorded using retroreflective markers and an 8-camera infrared Vicon setup (Oxford Metrics Limited, London, UK) at a sampling rate of 120 Hz. Markers were placed bilaterally on bony landmarks and rigid multi-marker shell groupings were attached to the pelvis, thighs, and shanks7. Ground reaction forces during walking were recorded using a single embedded force plate (600 × 900 mm2, Bertec Corporation, Worthington, OH) at a sampling rate of 1080 Hz. All kinematic and kinetic variables were calculated via inverse dynamics in Visual3D (C-Motion, Germantown, MD). Kinematic and kinetic data were low pass filtered at 6 Hz and 25 Hz, respectively. All moments were normalized to % body weight × height (%BW*HT)7. pKAM and pKFM were both external moments; a larger positive value represents a larger external pKAM and pKFM, respectively.
In addition to kinematic and kinetic data, electromyography (EMG) data were collected during each walking trial. EMG electrodes (MA-300 EMG System, Motion Lab Systems, Baton Rouge, LA) were placed over seven muscles crossing the knee joint, after shaving and cleaning the areas over each muscle belly. These seven muscles included both flexors (semimembranosus, long head of the biceps femoris, medial and lateral gastrocnemii) and extensors (rectus femoris, medial and lateral vastii)7. After electrode placement, each participant completed maximal volitional isometric contractions (MVICs) for each muscle group (hamstrings, gastrocnemii, and quadriceps). Respective highest MVIC values were used to normalize the EMG data obtained during walking12. EMG data were collected and sampled at 1080 Hz and were high-pass filtered (2nd order Butterworth filter at 30 Hz), rectified, low-pass filtered (at 6 Hz) and then normalized, to create linear envelopes33,34. These normalized linear envelopes were then transformed into muscle activations, using processes outlined by Buchanan et. al.33, and used as inputs into a validated, subject-specific musculoskeletal model, scaled to the anatomical dimensions of each participant33,34. Muscle forces were then determined using a calibration process described previously33,34. Using a combination of muscle forces and frontal plane moment arms (derived from the anatomical scaling of the model to each participant), a frontal plane moment balance was performed at each time point during the gait cycle to determine medial compartment load34,35. All joint loads were normalized to body weight (BW).
The biomechanical variables of interest in this study included pKAM, pKFM, and pMCF. These were assessed for the involved limb and also from an interlimb difference perspective (involved limb value – uninvolved limb value).
Imaging
Images of the involved and uninvolved limbs were acquired via a supine bilateral knee MRI using a 3 Tesla magnet (Siemens, Washington, D.C.) and a 15-channel transmit/receive knee coil (Siemens, Washington, D.C.). All participants underwent a sagittal 2-dimensional T2 mapping sequence using one of four parameters (Table 2, adjustments were made to produce higher quality images for segmentation purposes; dynamic range of echo times were kept similar to minimize impact on T2 calculations).
Table 2.
T2 Mapping Sequence Parameters
| Parameter | Participants 1 –11 | Participants 12 & 14 | Participant 13 | Participants 15 – 45 |
|---|---|---|---|---|
| Field of View | 160 mm | 140 mm | 150 mm | |
| Slice Thickness | 2 mm | 3 mm | 2 mm | 3 mm |
| Repetition Time | 4480 ms | 3090 ms | 2590 ms | 3090 ms |
| Echo Times [TE] | 12.5, 25, 37.5, 50, 62.5, 75 ms | 13.8, 27.6, 41.4, 55.2, 69.0, 82.8. 96.6 ms | 10, 20, 30, 40, 50, 60, 70 ms | |
All images were analyzed using the 3D Slicer software (https://www.slicer.org/)36. T2 maps were calculated via a mono-exponential fit to a two parameter model with the first echo in each sequence skipped to reduce stimulated echo artifacts37. Prior to slice selection and image segmentation, the involved limb was registered to the uninvolved limb. For each leg, three slices corresponding to the center of the medial compartment (defined as the load bearing region, i.e., where maximal medial compartment force is distributed) were used for analysis. All segmentations were performed by one author (JRW) on the first echo of the T2 mapping sequence. Each slice was segmented into six regions of interest (ROI) based around the meniscus (Figure 1). These ROI were then further subdivided into deep and superficial layers by dividing each ROI in half, with the deep layer being the layer closer to bone. Care was taken to avoid segmenting the tidemark. The T2 relaxation time in that ROI was then averaged across all three slices to provide an average T2 relaxation time for that ROI within the medial compartment. During segmentation, voxels with a T2 relaxation time greater than 100 ms were excluded to reduce potential artifacts associated with synovial fluid38.
Figure 1.
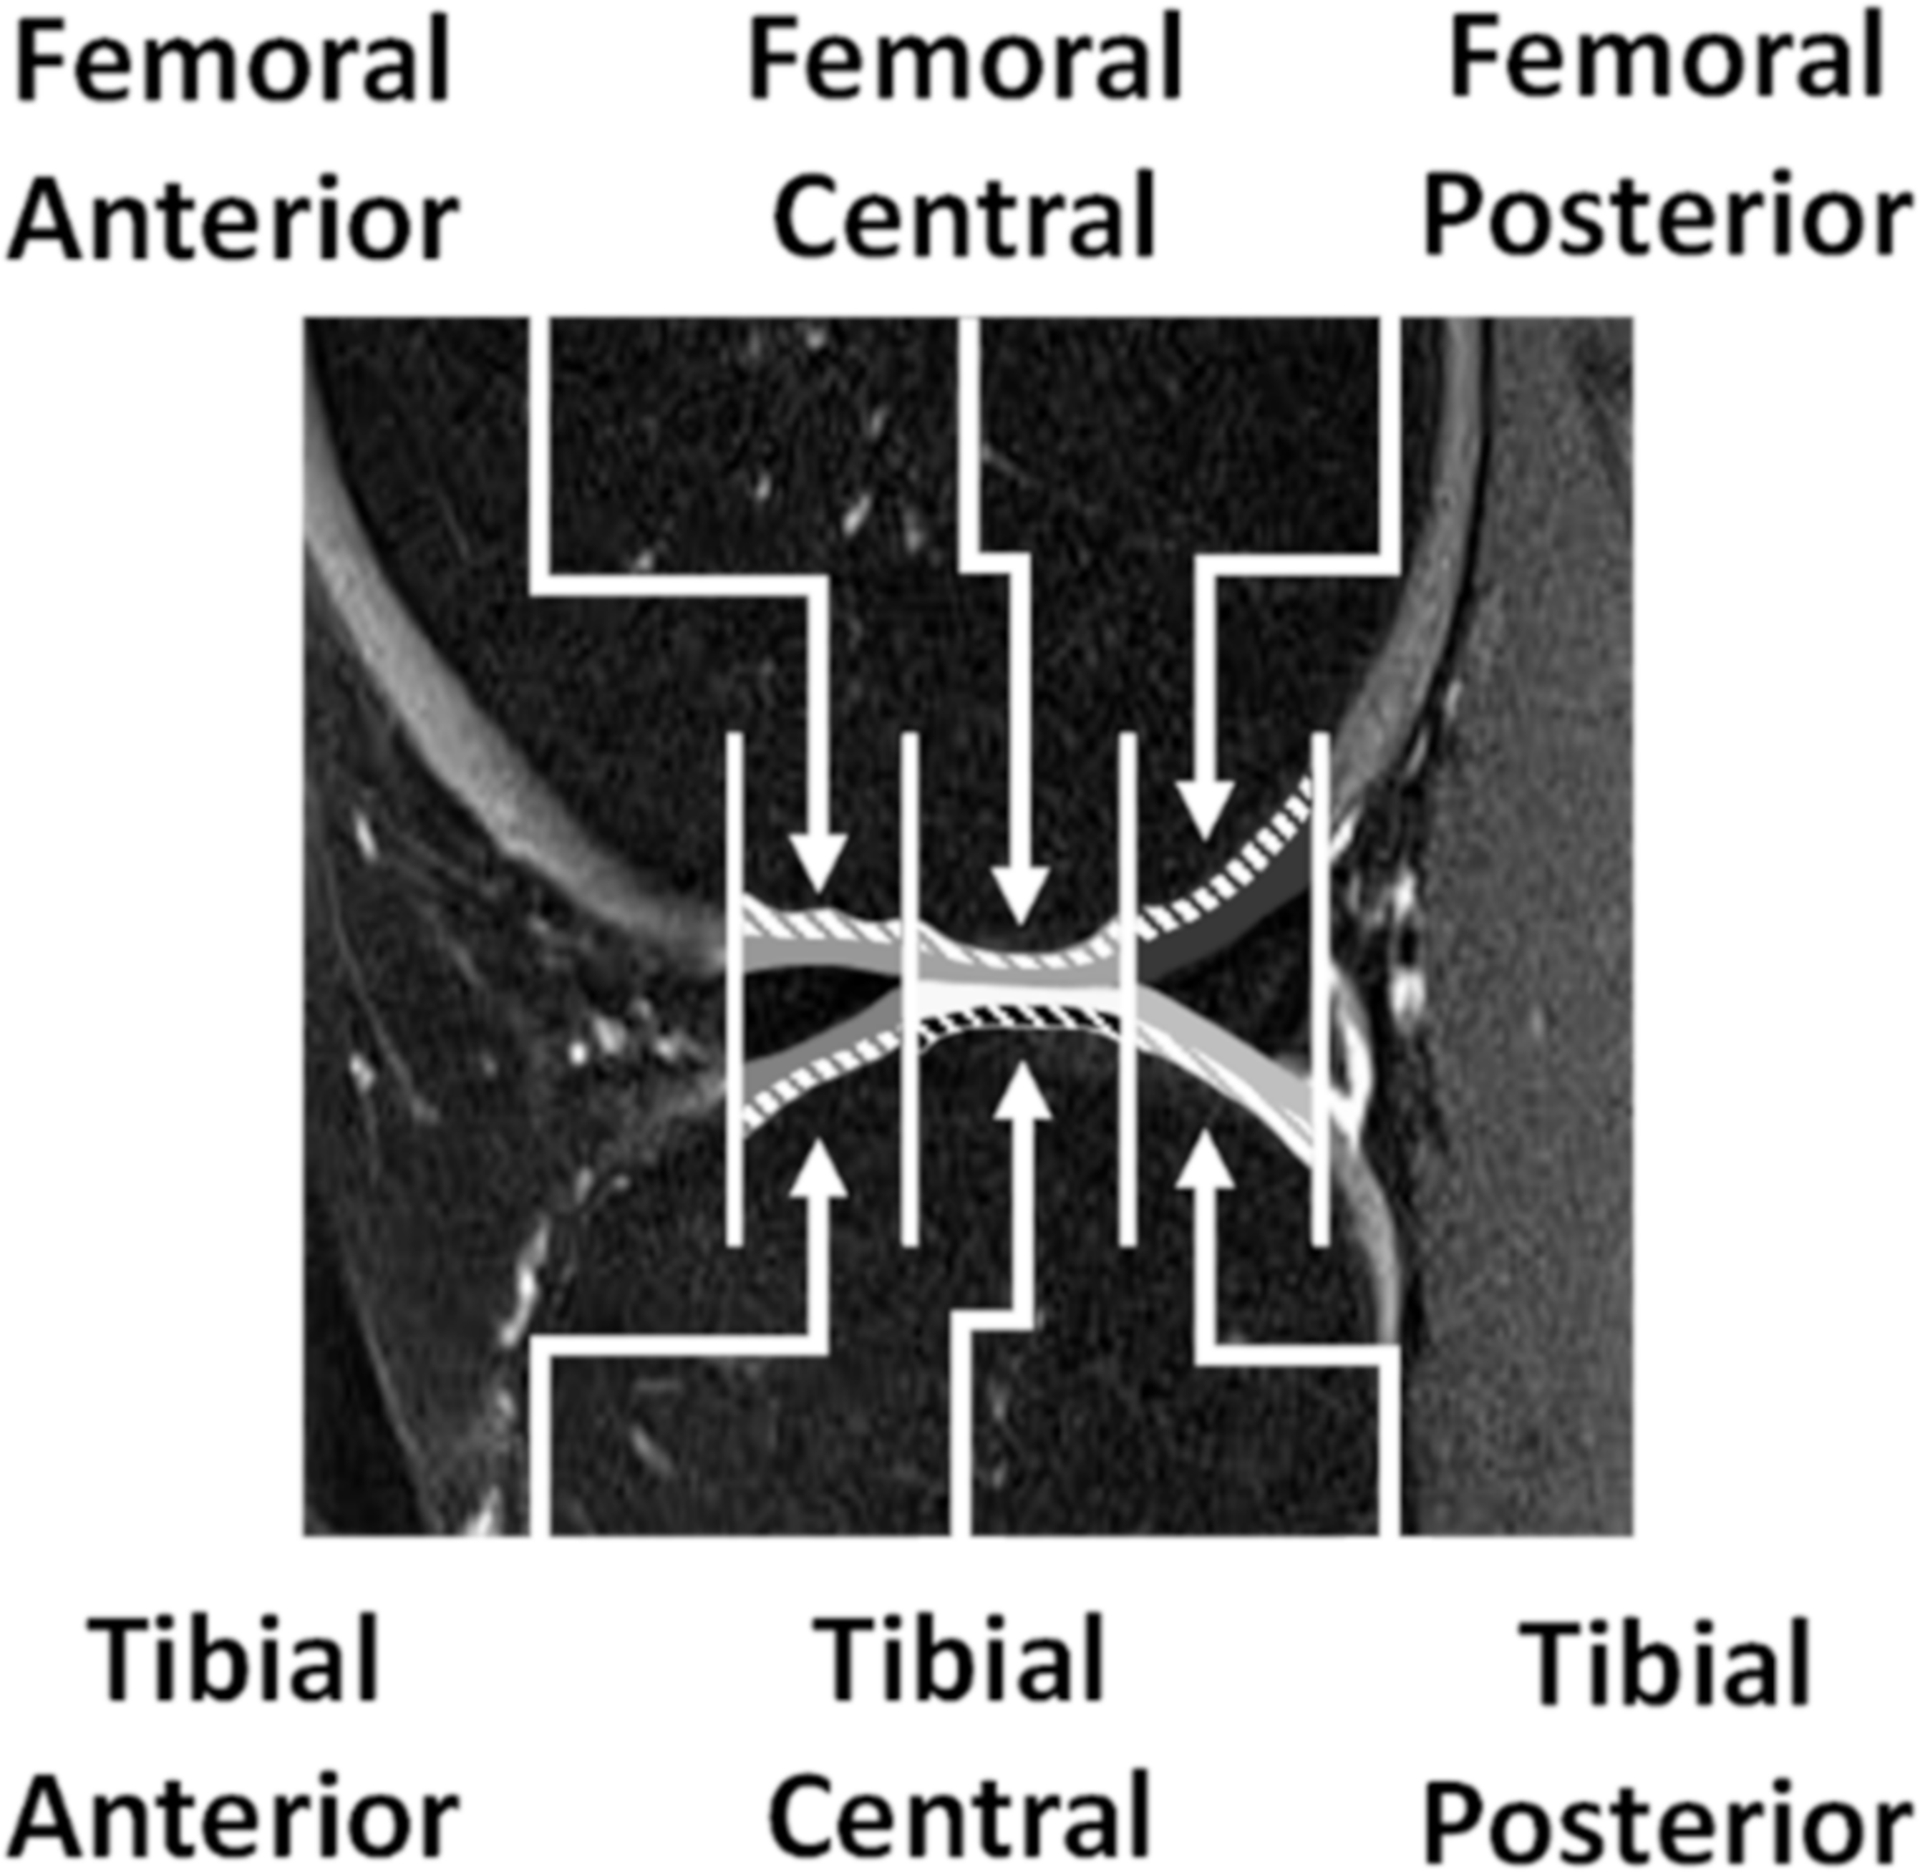
Sagittal knee scan depicting regions of interest, based on the meniscus boundaries. There were three on the femoral side: femoral anterior, femoral central, and femoral posterior and three on the tibial side: tibial anterior, tibial central, and tibial posterior. Each region of interest was further subdivided into deep (dashed lines) and superficial regions.
Statistical Analysis
Statistical analyses were performed using JMP (SAS, Cary, NC). For all analyses, alpha was set to 0.05. As this was an exploratory study, statistical adjustments to account for multiple comparisons were not made. Univariate linear regressions were used to assess the association between each biomechanical variable of interest (pKAM, pKFM, and pMCF) and the deep and superficial layer T2 relaxation time of each ROI in the medial tibiofemoral compartment. This was done for the involved limb (e.g., pKAM vs deep layer femoral central T2 relaxation time for the involved limb) and for the interlimb difference (e.g., interlimb difference in pKAM vs interlimb difference in deep layer femoral central T2 relaxation time). Multivariate regressions were used to examine the effects of age, BMI, and meniscal status on these associations. Similar to Titchenal et. al., each potential confounder was examined in the model by itself, rather than all at once, to avoid overfitting the model30.
Results
Knee Adduction Moment – Involved Limb
pKAM in the involved limb had a moderate, positive association with deep layer T2 relaxation times in the femoral central (Figure 2) and femoral posterior regions (Table 3). No statistically significant associations were seen in any other region, nor in the superficial layer. The association between pKAM and deep layer T2 relaxation times remained statistically significant after adjusting for age, BMI, and meniscal status. After adjusting for meniscal status, the association between pKAM and deep layer T2 relaxation times in the tibial posterior region became statistically significant (p = 0.036).
Figure 2.
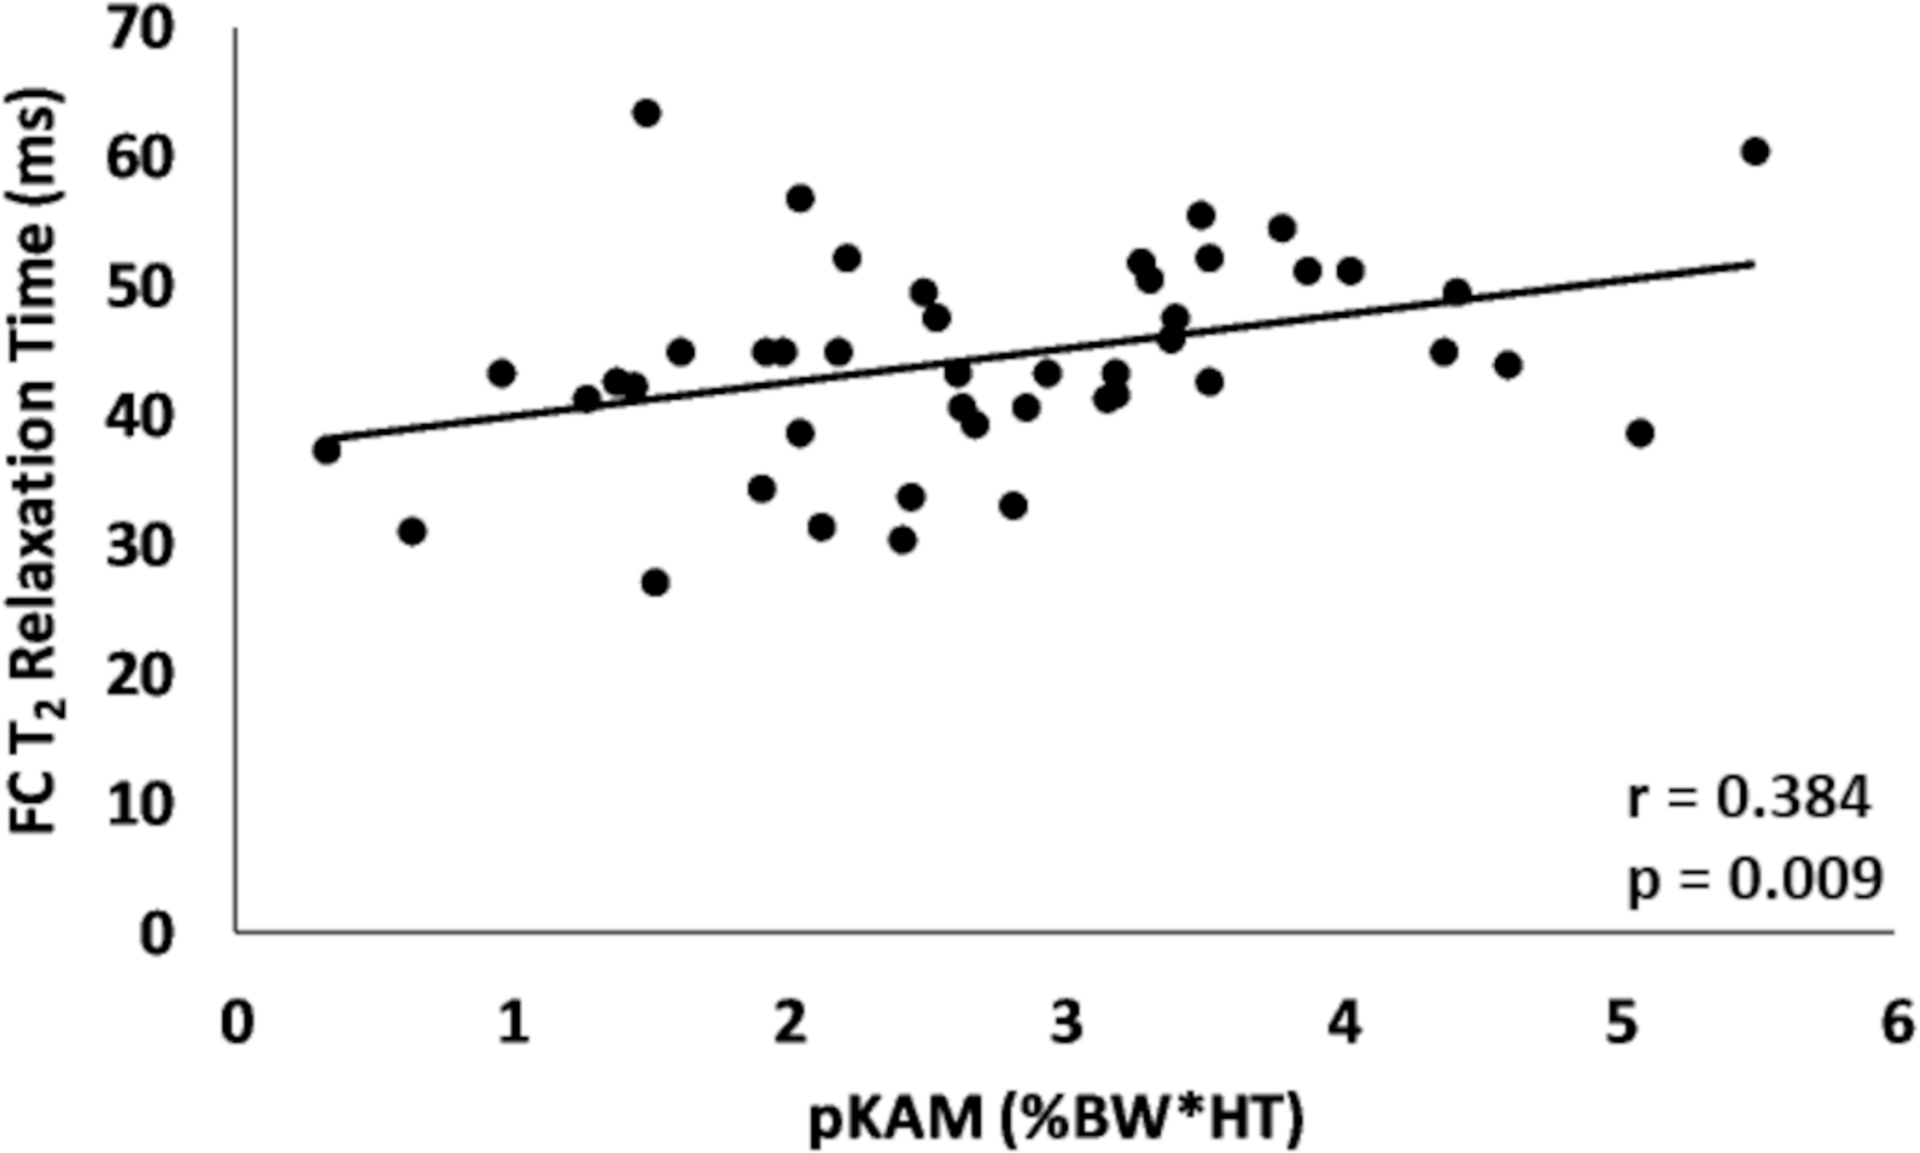
Association between pKAM and the deep layer T2 relaxation time within the femoral central (FC) region of the involved limb.
Table 3.
Deep layer T2 relaxation times vs. gait biomechanical variables – involved limb. A positive association between pKAM and T2 relaxation times indicates that a larger external pKAM is associated with prolonged T2 relaxation times. A negative association between pKFM and T2 relaxation times indicates that a smaller external pKFM is associated with prolonged T2 relaxation times. A positive association between pMCF and T2 relaxation times indicates that a larger pMCF is associated with prolonged T2 relaxation times.
| Region of Interest | Gait Variable | r | p-value |
|---|---|---|---|
| Femoral Anterior | pKAM | 0.152 | 0.320 |
| pKFM | −0.040 | 0.796 | |
| pMCF | 0.141 | 0.356 | |
| Femoral Central | pKAM | 0.384 | 0.009 |
| pKFM | −0.245 | 0.105 | |
| pMCF | 0.174 | 0.254 | |
| Femoral Posterior | pKAM | 0.419 | 0.004 |
| pKFM | −0.200 | 0.188 | |
| pMCF | 0.108 | 0.478 | |
| Tibial Anterior | pKAM | 0.053 | 0.726 |
| pKFM | −0.122 | 0.426 | |
| pMCF | 0.024 | 0.875 | |
| Tibial Central | pKAM | 0.163 | 0.285 |
| pKFM | −0.282 | 0.061 | |
| pMCF | 0.192 | 0.207 | |
| Tibial Posterior | pKAM | 0.258 | 0.087 |
| pKFM | −0.226 | 0.136 | |
| pMCF | 0.262 | 0.082 |
Knee Adduction Moment – Interlimb Difference
Interlimb difference of pKAM had a moderate, positive association with the interlimb difference of deep layer T2 relaxation times in the femoral central and femoral posterior regions (Table 4). No statistically significant associations were seen in any other region, nor in the superficial layer. pKAM remained a significant predictor after adjusting for age, BMI, and meniscal status. After adjusting for age, the association between the interlimb difference of pKAM and the interlimb difference of deep layer T2 relaxation times in the tibial central region became statistically significant (p = 0.043).
Table 4.
Deep layer T2 relaxation times vs. gait biomechanical variables – interlimb difference.
| Region of Interest | Gait Variable | r | p-value |
|---|---|---|---|
| Femoral Anterior | pKAM | 0.046 | 0.763 |
| pKFM | −0.122 | 0.426 | |
| pMCF | −0.100 | 0.513 | |
| Femoral Central | pKAM | 0.430 | 0.003 |
| pKFM | −0.363 | 0.014 | |
| pMCF | 0.075 | 0.626 | |
| Femoral Posterior | pKAM | 0.501 | 0.001 |
| pKFM | −0.308 | 0.040 | |
| pMCF | 0.075 | 0.626 | |
| Tibial Anterior | pKAM | 0.217 | 0.152 |
| pKFM | −0.272 | 0.071 | |
| pMCF | −0.126 | 0.409 | |
| Tibial Central | pKAM | 0.275 | 0.067 |
| pKFM | −0.062 | 0.684 | |
| pMCF | 0.241 | 0.110 | |
| Tibial Posterior | pKAM | 0.205 | 0.177 |
| pKFM | −0.098 | 0.522 | |
| pMCF | 0.065 | 0.670 |
Knee Flexion Moment – Involved Limb
There were no statistically significant associations between the involved limb’s pKFM and T2 relaxation times regardless of ROI or layer of cartilage (Table 3), even after adjusting for age, BMI, and meniscal status.
Knee Flexion Moment – Interlimb Difference
Interlimb difference of pKFM had a moderate, negative association with the interlimb difference of deep layer T2 relaxation times in the femoral central and femoral posterior regions (Table 4). These associations remained statistically significant after adjusting for age and BMI. The association in the femoral posterior region lost statistical significance after adjusting for meniscal status (p=0.071). No statistically significant associations were seen in any other region nor in the superficial layer.
Medial Compartment Force – Involved Limb
There were no statistically significant associations between the involved limb’s peak medial compartment force and T2 relaxation times regardless of ROI or layer of cartilage (Table 3). However, after adjusting for meniscal status, the association between pMCF and the deep layer T2 relaxation time in the tibial posterior region became statistically significant (p = 0.020)
Medial Compartment Force – Interlimb Difference
There were no statistically significant associations between the interlimb difference of pMCF and the interlimb difference of T2 relaxation times regardless of ROI or layer of cartilage (Table 4), even after adjusting for age, BMI, and meniscal status.
Discussion
The purpose of this study was to examine the relationships between known biomechanical risk factors for knee OA (pKAM, pKFM, and pMCF) and biochemical markers reflective of cartilage health three months after ACLR. Our hypothesis that these biomechanical gait variables would be associated with deep, but not superficial, layer T2 relaxation times was partially supported. Associations between deep layer T2 relaxation times and some gait variables of interest (pKAM, pKFM) were found within select ROI three months after ACLR. These associations existed when assessed from both an involved limb perspective and from an interlimb difference perspective. There were no associations between the gait variables of interest and superficial layer T2 relaxation times.
To the best of our knowledge, this is the first study to examine associations between gait mechanics and biochemical signs of knee cartilage degradation this early after ACLR. Additionally, it is one of the first to examine these relationships from an interlimb difference perspective. Our finding that T2 relaxation times were associated with biomechanical gait variables linked to OA development and progression align well with what has been reported at later time points after surgery30,32. In particular, the associations between the involved limb’s pKAM and T2 relaxation times seen here closely mirror the findings Titchenal et. al. reported 2 years after reconstruction30. In that study, the first peak of KAM (along with the second peak of KAM and mechanical alignment) was positively associated with deep layer UTE-T2* relaxation times (capable of assessing collagen matrix degradation within the deepest layers of cartilage39) in the weight bearing regions of cartilage (femoral central, femoral posterior, and tibial central ROIs). While the purpose of that study was primarily to verify the viability of UTE-T2* as a method to detecting pre-morphological cartilage alterations, it is interesting that similar associations were seen in the same regions as those seen here. This suggests that these regions may be particularly susceptible to changes in gait mechanics and at high risk of cartilage alterations. As these were both cross-sectional studies with different samples, no conclusions can be drawn about how the association between pKAM and knee cartilage biochemistry evolves over time. Nonetheless, the results seen here, that higher pKAM is associated with cartilage matrix degradation, align well with reports that elevated pKAM is linked with idiopathic OA severity, pain, and rate of progression and further supports theories regarding the interactions between the mechanical and biochemical systems of the knee17–21,28,29. The fact that this association is seen as early as three months after reconstruction may imply that interventions need to occur early after surgery to prevent initial cartilage deterioration. Additionally, the consistency of this association across multiple studies may suggest pKAM is a viable target to begin with when exploring interventions to prevent cartilage degradation. Future work should examine how pKAM early after surgery is associated with T2 relaxation times at later timepoints.
Interestingly, pKFM and pMCF were not associated with T2 relaxation times in the involved limb. Wellsandt et. al. found that those who develop OA five years after ACLR had lower pMCF six months after reconstruction compared to those who did not develop OA12. Previous work has shown that pMCF is a function of both pKAM and pKFM40; thus, the pKFMs seen here may explain the lack of association between pMCF and T2 relaxation times despite the existence of associations between pKAM and T2 relaxation times. As both pKFM and pMCF are reflective of load magnitude, it may be that loading at the early time point examined here is not variable enough on a subject-to-subject basis to establish an association with cartilage biochemical health17,40,41. Future work should examine how pKFM and pMCF early after surgery are related to long term cartilage health and examine associations at later time points when loading may be more variable on a subject-to-subject basis.
While magnitude of biomechanical and biochemical variables within the same limb can provide useful information about the mechanisms leading to disease development, they do not provide a concrete patient-specific target to address during therapeutic interventions. It is well established that OA rates within the involved limb after ACLR are much higher than those within the uninvolved limb9. Thus, while some have demonstrated differences in gait mechanics and qMRI variables between the uninvolved limb and healthy controls13, the uninvolved limb may be a viable subject-specific control for the involved limb. In this study, we examined the associations between interlimb difference of knee gait biomechanical variables and interlimb difference of T2 relaxation times to gain insight into these associations, after adjusting for a relative control.
As hypothesized, associations between the interlimb difference in gait mechanics and T2 relaxation times were found only in the deep layers of cartilage. Interlimb difference of pKAM had a significant positive association with the interlimb difference of T2 relaxation times within the femoral central and femoral posterior regions. Thus, a relatively higher involved limb pKAM (vs. uninvolved) was associated with prolonged T2 relaxation times within the involved limb compared to the uninvolved limb. The opposite association was found when examining pKFM; interlimb difference of pKFM had a significant negative association with the interlimb difference of T2 relaxation times in the deep layer of the femoral central and femoral posterior regions. That is, a relatively lower pKFM in the involved limb (vs. uninvolved) was associated with prolonged T2 relaxation times in the involved limb when compared to the uninvolved limb. As extensor weakness is prevalent after ACLR, it is not surprising to see associations between pKFM and T2 relaxation times when accounting for the uninvolved limb as opposed to examining the involved limb only. There was no association between the interlimb difference of pMCF and interlimb difference of T2 relaxation times. It remains to be seen if/how asymmetries in T2 relaxation times resolve with time and whether or not they resolve differently based on the type of asymmetry seen in gait mechanics. Overall, these data suggest that relative symmetry between limbs may be a good subject-specific target when attempting to design interventions aimed at delaying or preventing the development of post-traumatic OA.
Several limitations should be considered when interpreting the results of this study. Differing scan parameters were used among the first 14 individuals of this study compared to the remaining 31 (adjustments were made to produce higher quality images for segmentation purposes). Using differing parameters between sequences may influence the calculation of T2 maps42. However, adjustments were made with this in consideration; the dynamic range of the echos were kept similar, only minor changes were made to the in-plane and through-plane resolution, and the MRI unit, knee coil, and post-processing algorithms were all kept the same across subjects. Thus, the overall impact of the differing scan parameters on T2 relaxation time calculations were minimal. Another limitation of this study was that it was not able to explain why only the deep layer of cartilage experienced associations with gait biomechanical variables linked to OA. One possible explanation is that the initial injury mechanism (aka the ACL tear) may have damaged the deep and superficial layers of cartilage differently and thus may have left one layer more susceptible to alterations in load experienced after ACLR. Another possible explanation is that the manner in which loads are distributed through cartilage differs based on the layer of cartilage. That is, the deep region could be experiencing higher shear forces (as is typically seen near the bone-cartilage interface) compared to more compressive forces in the superficial layers of cartilage43. Shearing forces have previously been linked to accelerated cartilage degradation27. Future work using more sophisticated modeling techniques, such as the finite element method, should examine the relationship between complex loading patterns and how they influence differing layers of cartilage after ACLR.
This study did not include individuals who required meniscal repairs as individuals undergoing this procedure typically have an extended period of non-weight bearing which would substantially influence both mechanics and T2 relaxation times early after surgery. Those with meniscectomies were included in this study (as this is a commonly performed procedure in conjunction with ACLR and there are no weight bearing precautions); multiple regression revealed there was little effect of meniscectomies on the associations observed. Participants were recruited from multiple clinics from the surrounding area. Controlling for post-op rehabilitation, while ideal, is not feasible across the entire ACLR population and thus not translatable to the average person recovering from this procedure. Future work should examine the effect of differing rehabilitation approaches on the associations between gait mechanics and T2 relaxation times. There was no correlation between pKAM and pMCF with graft type. There was a significant correlation between pKFM and graft type (r = 0.439, p = 0.011) with the BPTB grafts having lower pKFMs compared to the hamstring grafts. This is not surprising as extensor weakness is prevalent early after ACLR in those with BPTB grafts, which will affect KFM. Graft type is not a factor associated with the development of osteoarthritis and hence was not included as a potential confounding variable9,44,45. Future work should examine the influence of graft type on these associations. T2 mapping is a commonly used qMRI method; however, a dual approach of T2 and UTE-T2* (which can better image the deepest layers of cartilage) may be more suitable to adequately determine relaxation times in both the superficial and deep layers. Longitudinal follow-up and examining multiple peaks of gait variables (e.g., first and second peaks of KAM) would enhance future studies and help gain further insight into the mechanisms related to eventual disease development. As this was an exploratory study, recommendations to specific changes in clinical treatment cannot be made. Further studies are needed to explore the relationship between mechanics and knee cartilage health this early after ACLR and to explore potential modifications to these variables and their effectiveness at preserving cartilage health. Finally, it is impossible to establish cause and effect with these associations; it may be that alterations in knee cartilage biochemistry are leading to changes in mechanics rather than the often-hypothesized change in mechanics leading to cartilage damage. Future work is needed to assess this question.
In conclusion, our findings suggest that pKAM and pKFM are associated with deep layer T2 relaxation times three months after ACLR within weight-bearing regions of medial tibiofemoral cartilage. Associations between these biomechanical variables and biochemical indicators were present when assessed from an involved limb perspective (pKAM only) and from an interlimb difference perspective. Overall, these results imply that degenerative pathways leading to early OA may begin as early as three months after reconstruction. The design and implementation of preventative therapeutic techniques thus may need to be employed early in the rehabilitation process to prevent initial cartilage degradation.
Statement of Clinical Significance:
Preventative therapeutic techniques may need to be employed early in the rehabilitation process to prevent cartilage degradation.
Acknowledgement
Funding was provided by the Eunice Kennedy Shriver National Institute of Child Health and Human Development: R01-HD087459. The content is solely the responsibility of the authors and does not necessarily represent the official views of the National Institutes of Health. Thank you to Martha Callahan, Jennifer Marmon and the Delaware Rehabilitation Institute Research Core for assistance with subject recruitment and retention; Ryan Pohlig for statistical consulting; and Bryn Bonner and Megan Leibowitz for their assistance with data processing.
References
- 1.Hewett TE, Di Stasi SL, Myer GD. 2013. Current Concepts for Injury prevention in Athletes After Anterior Cruciate Ligament Reconstruction. Am J Sport. Med 41(1):216–224. [DOI] [PMC free article] [PubMed] [Google Scholar]
- 2.Kiapour AM, Murray MM. 2014. Basic science of anterior cruciate ligament injury and repair. Bone Jt. Res 3(2):20–31. [DOI] [PMC free article] [PubMed] [Google Scholar]
- 3.Beynnon BD, Johnson RJ, Abate JA, et al. 2005. Treatment of anterior cruciate ligament injuries, part I. Am. J. Sports Med 33(10):1579–1602. [DOI] [PubMed] [Google Scholar]
- 4.Paschos NK, Howell SM. 2016. Anterior cruciate ligament reconstruction: Principles of treatment. EFORT Open Rev. 1(11):398–408. [DOI] [PMC free article] [PubMed] [Google Scholar]
- 5.Friel NA, Chu CR. 2013. The Role of ACL Injury in the Development of Posttraumatic Knee Osteoarthritis. Clin Sport. Med 32(1):1–12. [DOI] [PMC free article] [PubMed] [Google Scholar]
- 6.Simon D, Mascarenhas R, Saltzman BM, et al. 2015. The Relationship between Anterior Cruciate Ligament Injury and Osteoarthritis of the Knee. Adv. Orthop 2015:1–11. [DOI] [PMC free article] [PubMed] [Google Scholar]
- 7.Khandha A, Manal K, Wellsandt E, et al. 2017. Gait mechanics in those with/without medial compartment knee osteoarthritis 5 years after anterior cruciate ligament reconstruction. J. Orthop. Res 35(3):625–633. [DOI] [PMC free article] [PubMed] [Google Scholar]
- 8.Lohmander LS, Englund PM, Dahl LL, Roos EM. 2007. The long-term consequence of anterior cruciate ligament and meniscus injuries: Osteoarthritis. Am. J. Sports Med 35(10):1756–1769. [DOI] [PubMed] [Google Scholar]
- 9.Barenius B, Ponzer S, Shalabi A, et al. 2014. Increased risk of osteoarthritis after anterior cruciate ligament reconstruction: A 14-year follow-up study of a randomized controlled trial. Am. J. Sports Med 42(5):1049–1057. [DOI] [PubMed] [Google Scholar]
- 10.Li X, Kuo D, Theologis A, et al. 2011. Cartilage in Anterior Cruciate Ligament–Reconstructed Knees: MR Imaging T1 ρ and T2—Initial Experience with 1-year Follow-up. Radiology 258(2):505–514. [DOI] [PMC free article] [PubMed] [Google Scholar]
- 11.Roos H, Adalberth T, Dahlberg L, Lohmander LS. 1995. Osteoarthritis of the knee after injury to the anterior cruciate ligament or meniscus: the influence of time and age. Osteoarthr. Cartil 3(4):261–267. [DOI] [PubMed] [Google Scholar]
- 12.Wellsandt E, Gardinier ES, Manal K, et al. 2016. Decreased knee joint loading associated with early knee osteoarthritis after anterior cruciate ligament injury. Am. J. Sport. Med 44(1):143–151. [DOI] [PMC free article] [PubMed] [Google Scholar]
- 13.Slater LV., Hart JM, Kelly AR, Kuenze CM. 2017. Progressive Changes in Walking Kinematics and Kinetics After Anterior Cruciate Ligament Injury and Reconstruction: A Review and Meta-Analysis. J. Athl. Train 52(9):847–860. [DOI] [PMC free article] [PubMed] [Google Scholar]
- 14.Hart HF, Culvenor AG, Collins NJ, et al. 2016. Knee kinematics and joint moments during gait following anterior cruciate ligament econstruction: A systematic review and meta-analysis. Br. J. Sports Med 50(10):597–612. [DOI] [PubMed] [Google Scholar]
- 15.Kaur M, Ribeiro DC, Theis JC, et al. 2016. Movement Patterns of the Knee During Gait Following ACL Reconstruction: A Systematic Review and Meta-Analysis. Sport. Med 46(12):1869–1895. [DOI] [PubMed] [Google Scholar]
- 16.Andriacchi TP. 2013. Valgus alignment and lateral compartment knee osteoarthritis: A biomechanical paradox or new insight into knee osteoarthritis? Arthritis Rheum. 65(2):310–313. [DOI] [PMC free article] [PubMed] [Google Scholar]
- 17.Chehab EF, Favre J, Erhart-hledik JC, Andriacchi TP. 2014. Baseline Knee Adduction and Flexion Moments During Walking Are Both Associated With 5 Year Cartilage Changes in Patients with Medial Knee Osteoarthritis. Osteoarthr. Cartil 22(11):1833–1839. [DOI] [PMC free article] [PubMed] [Google Scholar]
- 18.Mündermann A, Dyrby CO, Hurwitz DE, et al. 2004. Potential Strategies to Reduce Medial Compartment Loading in Patients With Knee Osteoarthritis of Varying Severity: Reduced Walking Speed. Arthritis Rheum. 50(4):1172–1178. [DOI] [PubMed] [Google Scholar]
- 19.Thorp LE, Sumner DR, Wimmer MA, Block JA. 2007. Relationship between pain and medial knee joint loading in mild radiographic knee osteoarthritis. Arthritis Rheum. 57(7):1254–1260. [DOI] [PubMed] [Google Scholar]
- 20.Miyazaki T, Wada M, Kawahara H, et al. 2002. Dynamic load at baseline can predict radiographic disease progression in medial compartment knee osteoarthritis. Ann. Rheum. Dis 61(7):617–622. [DOI] [PMC free article] [PubMed] [Google Scholar]
- 21.Favre J, Jolles BM. 2016. Gait analysis of patients with knee osteoarthritis highlights a pathological mechanical pathway and provides a basis for therapeutic interventions. EFORT Open Rev. 1(10):368–374. [DOI] [PMC free article] [PubMed] [Google Scholar]
- 22.Schmitz RJ, Harrison D, Wang HM, Shultz SJ. 2017. Sagittal-plane knee moment during gait and knee cartilage thickness. J. Athl. Train 52(6):560–566. [DOI] [PMC free article] [PubMed] [Google Scholar]
- 23.Matzat SJ, van Tiel J, Gold GE, Oei EHG. 2013. Quantitative MRI techniques of cartilage composition. Quant. Imaging Med. Surg 3(3):162–174. [DOI] [PMC free article] [PubMed] [Google Scholar]
- 24.Argentieri EC, Burge AJ, Potter HG. 2018. Magnetic Resonance Imaging of Articular Cartilage within the Knee. J. Knee Surg 31(2):155–165. [DOI] [PubMed] [Google Scholar]
- 25.Mosher TJ, Dardzinski BJ. 2004. Cartilage MRI T2 relaxation time mapping: Overview and applications. Semin. Musculoskelet. Radiol 8(4):355–368. [DOI] [PubMed] [Google Scholar]
- 26.David-Vaudey E, Ghosh S, Ries M, Majumdar S. 2004. T2relaxation time measurements in osteoarthritis. Magn. Reson. Imaging 22(5):673–682. [DOI] [PubMed] [Google Scholar]
- 27.Van Rossom S, Smith CR, Zevenbergen L, et al. 2017. Knee cartilage thickness, T1ρ and T2 relaxation time are related to articular cartilage loading in healthy adults. PLoS One 12(1):1–16. [DOI] [PMC free article] [PubMed] [Google Scholar]
- 28.Andriacchi TP, Favre J, Erhart-Hledik JC, Chu CR. 2015. A Systems View of Risk Factors for Knee Osteoarthritis Reveals Insights into the Pathogenesis of the Disease. Ann. Biomed. Eng 43(2):376–387. [DOI] [PMC free article] [PubMed] [Google Scholar]
- 29.Chu CR, Andriacchi TP. 2015. Dance Between Biology, Mechanics, and Structure: A Systems-Based Approach to Developing Osteoarthritis Prevention Strategies. J. Orthop. Res 33(7):939–947. [DOI] [PMC free article] [PubMed] [Google Scholar]
- 30.Titchenal MR, Williams AA, Chehab EF, et al. 2018. Cartilage Subsurface Changes to Magnetic Resonance Imaging UTE-T2* 2 Years After Anterior Cruciate Ligament Reconstruction Correlate With Walking Mechanics Associated With Knee Osteoarthritis. Am. J. Sports Med 46(3):565–572. [DOI] [PMC free article] [PubMed] [Google Scholar]
- 31.Kumar D, Kothari A, Souza RB, et al. 2014. Frontal plane knee mechanics and medial cartilage MR relaxation times in individuals with ACL reconstruction: A pilot study. Knee 21(5):881–885. [DOI] [PMC free article] [PubMed] [Google Scholar]
- 32.Teng HL, Wu D, Su F, et al. 2017. Gait Characteristics Associated With a Greater Increase in Medial Knee Cartilage T1ρ and T2 Relaxation Times in Patients Undergoing Anterior Cruciate Ligament Reconstruction. Am. J. Sports Med 45(14):3262–3271. [DOI] [PubMed] [Google Scholar]
- 33.Buchanan TS, Lloyd DG, Manal K, Besier TF. 2004. Neuromusculoskeletal Modeling : Estimation of Muscle Forces and Joint Moments and Movements From Measurements of Neural Command. J. Appl. Biomech 20(4):367–395. [DOI] [PMC free article] [PubMed] [Google Scholar]
- 34.Manal K, Buchanan TS. 2013. An Electromyogram-Driven Musculoskeletal Model of the Knee to Predict in Vivo Joint Contact Forces During Normal and Novel Gait Patterns. J. Biomech. Eng 135(2):021014. [DOI] [PMC free article] [PubMed] [Google Scholar]
- 35.Winby CR, Lloyd DG, Besier TF, Kirk TB. 2009. Muscle and external load contribution to knee joint contact loads during normal gait. J. Biomech 42(14):2294–2300. [DOI] [PubMed] [Google Scholar]
- 36.Fedorov A, Beichel R, Kalpathy-Cramer J, et al. 2012. 3D Slicer as an image computing platform for the Quantitative Imaging Network. Magn. Reson. Imaging 30(9):1323–1341. [DOI] [PMC free article] [PubMed] [Google Scholar]
- 37.Smith HE, Mosher TJ, Dardzinski BJ, et al. 2001. Spatial variation in cartilage T2 of the knee. J. Magn. Reson. Imaging 14(1):50–55. [DOI] [PubMed] [Google Scholar]
- 38.Su F, Hilton JF, Nardo L, et al. 2013. Cartilage morphology and T1ρ and T2 quantification in ACL-reconstructed knees: A 2-year follow-up. Osteoarthr. Cartil 21(8):1058–1067. [DOI] [PMC free article] [PubMed] [Google Scholar]
- 39.Chu CR, Williams AA, West RV., et al. 2014. Quantitative Magnetic Resonance Imaging UTE-T2* Mapping of Cartilage and Meniscus Healing After Anatomic Anterior Cruciate Ligament Reconstruction. Am. J. Sports Med 42(8):1847–1856. [DOI] [PMC free article] [PubMed] [Google Scholar]
- 40.Manal K, Gardinier E, Buchanan TS, Snyder-Mackler L. 2015. A More Informed Evaluation of Medial Compartment Loading: The Combined Use of the Knee Adduction and Flexor Moments. Osteoarthr. Cartil 23(7):1107–1111. [DOI] [PMC free article] [PubMed] [Google Scholar]
- 41.Kaufman KR, Hughes C, Morrey BF, et al. 2001. Gait characteristics of patients with knee osteoarthritis. J. Biomech 34(7):907–915. [DOI] [PubMed] [Google Scholar]
- 42.Matzat SJ, McWalter EJ, Kogan F, et al. 2015. T2 Relaxation time quantitation differs between pulse sequences in articular cartilage. J. Magn. Reson. Imaging 42(1):105–113. [DOI] [PMC free article] [PubMed] [Google Scholar]
- 43.Cohen NP, Foster RJ, Mow VC. 1998. Composition and dynamics of articular cartilage: Structure, function, and maintaining healthy state. J. Orthop. Sports Phys. Ther 28(4):203–215. [DOI] [PubMed] [Google Scholar]
- 44.Holm I, Øiestad BE, Risberg MA, Aune AK. 2010. No Difference in Knee Function or Prevalence of Osteoarthritis after Reconstruction of the Anterior Cruciate Ligament with 4-Strand Hamstring Autograft Versus Patellar Tendon-Bone Autograft. Am. J. Sports Med 38(3):448–454. [DOI] [PubMed] [Google Scholar]
- 45.Lecoq FA, Parienti JJ, Murison J, et al. 2018. Graft Choice and the Incidence of Osteoarthritis After Anterior Cruciate Ligament Reconstruction: A Causal Analysis From a Cohort of 541 Patients. Am. J. Sports Med 46(12):2842–2850. [DOI] [PubMed] [Google Scholar]