

Abstract
In recent years, the use of bacteriophages (or 'phages') against multidrug-resistant (MDR) bacteria including Pseudomonas aeruginosa has drawn considerable attention, globally. In this work, we report the isolation and detailed characterization of a highly lytic Pseudomonasphage DRL-P1 isolated from wastewater. Under TEM, DRL-P1 appeared as a member of the phage family Myoviridae. DRL-P1 featured rapid adsorption (~ 5 min), short-latency (~ 30 min), and large burst size (~ 100 PFU per infected cell). DRL-P1 can withstand a wide temperature range (4 °C to 40 °C) and pH (5.0 to 10.0) conditions. The 66,243 bp DRL-P1 genome (MN564818) encodes at least 93 ORFs, of which 36 were functionally annotated based on homology with similar phage proteins available in the databases. Comparative analyses of related genomes suggest an independent evolutionary history and discrete taxonomic position of DRL-P1 within genus Pbunavirus. No toxin or antibiotic resistance genes was identified. DRL-P1 is tolerant to lyophilization and encapsulation techniques and retained lytic activity even after 18 months of storage. We also demonstrated decontaminating potentials of DRL-P1 in vitro, on an artificially contaminated cover-slip model. To the best of our knowledge, this is the first Pbunavirus to be reported from India. Our study suggests DRL-P1 as a potential candidate for various applications.
Subject terms: Microbiology, Bacteriophages, Biotechnology, Environmental biotechnology, Sequencing
Introduction
For several decades, antibiotics have played an important role as therapeutic and prophylactic in healthcare clinics, veterinary, agriculture, food processing industries, etc. However, indiscriminate use of antibiotics has led to the evolution of various escape mechanisms in the bacteria, rendering them resistant to most of the available antibiotics1,2. Additionally, the decline in research and development of new antibiotics has left us with a very limited choice of weapons against pathogenic bacteria1. It is predicted that, by 2050, antibiotic resistance will result in 10 million deaths, each year3. Patients with chronic illnesses are more likely to develop antibiotic-resistant infections, therefore; the treatment risk associated with immune-compromised individuals is much higher than the normal patients.
In recent years, increasing morbidity and mortality due to infections with multidrug-resistant ESKAPE pathogens (Enterococcus faecium, Staphylococcus aureus, Klebsiella pneumoniae, Acinetobacter baumannii, Pseudomonas aeruginosa, and Enterobacter species) have become a serious concern, globally4. Among the ESKAPE pathogens, carbapenem-resistant A. baumannii, P. aeruginosa, and Enterobacteriaceae have been classified by the WHO as ‘Priority 1 critical pathogens’ for which R&D in new antibacterials is urgently required5. Because of the rapidly increasing cases of antimicrobial resistance, India too has recently declared K. pneumoniae, E. coli, A. baumannii, and P. aeruginosa as the ‘critical priority’ pathogens6. Nevertheless, the recent success of phage therapy in cases of difficult-to-treat ESKAPE infection, through administration of lytic bacteriophages has proved beyond doubt, the enormous potentials of bacteriophages in the war against this pathogens7–13.
Among the ESKAPE pathogens, P. aeruginosa is a gram-negative opportunistic pathogen, predominantly found in hospitals, animal farms, slaughterhouses, soil, aquatic environment, and sewage water. P. aeruginosa is notorious for being the major cause of death by nosocomial infections, especially in patients with severe wounds, causing sepsis in immunosuppressed patients, chronic lung infections in patients with cystic fibrosis, and chronic obstructive lung disease, bladder-catheter associated chronic infections in the urinary tract and ventilator-associated serious pneumonia14,15. In most cases, treatment of P. aeruginosa is very challenging owing to its multiple mechanisms to resist antibiotics and ability to form antibiotic-resistant biofilms14,15. The presence of flagella and type IV pili in P. aeruginosa allows motility on solid or semi-solid surfaces, resulting in cross-contamination of surfaces and tools, especially in clinical settings16,17.
In the scenario of rising antibiotic resistance among serious pathogens, the re-emergence of phage therapy has brought hope and a paradigm shift in the development of a new class of antibacterial. Harnessing the lytic activity of phages against specific bacteria has shown to be an effective approach, albeit with certain limitations. Phages are considered safer to humans and environment-friendly, as compared to the conventional chemical-based antibacterial agents. Although bacteriophages are ubiquitous in our ecosystem, sewage water receiving human fecal matter is considered as an excellent reservoir of phages against various pathogenic bacteria, prevalent in a given population18. Recently, researchers have demonstrated the potential application of phages isolated from sewage and other sources in the treatment of certain superbug infections including P. aeruginosa infection, that were otherwise untreatable using conventional antibiotics7–10.
In comparison to the world literature, only a few studies are available on Pseudomonasphages isolated from India19–25. Despite demonstrating the lytic capabilities of the isolated phages, most of these studies lacked essential characterization of the phage, which is critical for ascertaining the suitability of the phages for therapeutic and other applications26. In this manuscript, we describe the results of phenotypic and genotypic characterization of the novel P. aeruginosa phage DRL-P1 that we isolated from a wastewater source in northeastern India and demonstrate its lytic efficiency against MDR P. aeruginosa.
Results
Plaque and phage morphology of DRL-P1
Isolated phage was initially screened against P. aeruginosa through spot tests. A clear zone over a bacterial lawn was observed due to the lytic activity of the phage (Fig. 1a). This phage was named ‘DRL-P1’. On double-layer agar (DLA) plates, DRL-P1 produced small but clear plaques of approximately 2 ± 0.23 mm diameter (n = 56) of similar morphology (Fig. 1b). For subsequent characterization, bacteriophage enrichment was performed by repeated plaque purification method and a stock of 109 PFU mL−1 was prepared (Fig. 1c). Purified phage particles were examined under a transmission electron microscope (TEM) and following International Committee on Taxonomy of Viruses (ICTV) guidelines, classified as a member of the bacteriophage family Myoviridae, signified by a head, neck, contractile tail, base plate, tail fiber geometry (Fig. 2). The average (n = 9) particle length (head to the base plate), head diameter, head length, tail length, tail diameter, and base-plate diameter was measured to be 197.47 ± 1.72, 68.89 ± 2.37, 93.03 ± 2.85, 94.54 ± 2.52, 16.82 ± 1.80, and 27.92 ± 3.03 nm, respectively.
Figure 1.

Plaques of Pseudomonasphage DRL-P1 on P. aeruginosa lawn. (a) A clear zone of lysis was observed in spot-test. (b) Clear plaques were observed after double layer agar plating of enriched phages (c) ‘Web-pattern’ plates for preparation of high titer phage lysate for different studies.
Figure 2.

Transmission Electron micrographs of negatively stained phage particles from different areas on a grid. (a,b) Shows intact Myoviridae phage particles with uncontracted tail (black arrow) and base plate (arrowhead), broken tail (white arrow). (c) Phage particles with contracted tail sheath (black arrow) and protrusion of tail tubes (arrowhead). Purified phage particles were negatively stained using 2% (w/v) uranyl acetate and visualized using a TEM operating at a voltage of 100 kV.
Antibiotic sensitivity and host range
The antibiotic response pattern of the bacterial isolate used in this study is tabulated as supplementary data (Table S1). The isolate showed resistance against Ceftazidime (CAZ), Nitrofurantoin (NIT), Nalidixic acid (NA), Ampicillin (AMP), Co-Trimoxazole (COT). However, it was found to be sensitive to Ciprofloxacin (CIP), Amikacin (AK), Amoxyclav (AMC), Cefotaxime (CTX), and Gentamicin (GEN), while intermediate sensitivity was noted against Netillin (NET), Tobramycin (TOB).
The host range of the phage DRL-P1 was examined against various standard bacterial cultures, obtained from the Microbial Type Culture Collection and Gene Bank (MTCC, Institute of Microbial Technology, Chandigarh, India). Phage DRL-P1 did not show any lytic activity against Escherichia coli (MTCC 443), Vibrio cholera (MTCC 3904), Bacillus megaterium (MTCC 428), Shigella flexneri (MTCC 1457), Bacillus subtilis (MTCC 1305), Salmonella enterica Typhimurium (MTCC 1251, MTCC 1252), Streptococcus pyogenes (MTCC 442) and Klebsiella pneumoniae (MTCC 8911). However, DRL-P1 showed clear lytic activity against P. aeruginosa (MTCC 1688) and also against nine other P. aeruginosa isolates (IS1-IS9), field-collected from the soil of Arunachal Pradesh, a northeastern state of India (Supplementary data, Table S2).
Features of the DRL-P1 genome
Next-Generation Sequencing of the phage DNA resulted in the generation of a total of 1,295,948 raw reads (read length 150) amounting to 194.4 Mb bases. After sequence QC, a total of 1,221,536 reads (178.93 Mb bases) were used to assemble a terminally redundant genome of 66,243 nts having GC content of 54.9%, consisting of 22.75% A, 22.31% T, 27.52% G, and 27.40% C. The genome sequence was predicted to be ‘intact’ (completeness score 120) in the PHASTER analysis. In Blastn (Megablast) search, the DRL-P1 genome sequence was found to be significantly similar (up to 97.77% nucleotide identity over 99% query coverage) to Pseudomonasphage genome sequences belonging to the genus Pbunavirus (Order Caudovirales; Family Myoviridae), with top 10 hits namely being isolates- ‘DL52’ (KR054028), ‘misfit’ (MT119367), ‘zikora’ (MW557846), ‘R26’ (NC_048663), ‘datas’ (NC_050143), ‘Epa 14’ (NC_050144), ‘billy’ (MT133563), ‘elmo’ (MT119364), ‘kraken’ (KT372692), ‘Jollyroger’ (KT372691).
A total of 93 phage-hit ORFs were identified in the genome, of which 36 were functionally annotated based on homology with similar phage proteins available in the databases, while 57 were annotated as phage hypothetical proteins. Predicted ORFs were found to encode proteins ranging from 31 to 1035 aa in length, the largest being the DNA polymerase (Table 1). Identified ORFs included genetic regions, responsible for encoding proteins related to virion structure, genome replication, assembly & packaging, DNA synthesis & repair, regulation of gene expression, host identification & infection, host lysis, and recombination that are essential for the phage cycle. Among the 93 ORFs, 54 (58%) and 39 (42%) ORFs were encoded on each of the strands of the dsDNA, respectively. The strand with most of the ORFs was considered as the plus strand in further analyses. A genome map showing predicted ORFs (with definite phage-related proteins) is presented in (Fig. 3). Together, all the ORFs were encoded within 65,495 bps (from nts 634 to 66,128), resulting in an extremely high coding density of 98.87%. Notably, the start codon of 25 ORFs (26.88%) overlapped with the stop codon of the previous gene, suggesting transcriptional interactions among these neighboring genes. No putative tRNA encoding gene was identified in the genome. A total of 83 promoter regions and 27 Rho-independent terminators across the genome were predicted (Supplementary data, Tables S3 and S4). No toxin or antimicrobial resistance-related gene was predicted in the genome. Despite in-silico prediction as a temperate phage (averaged probability ± SD, 0.534 ± 0.03), DRL-P1 always presented highly lytic activity in in vitro assays.
Table 1.
Predicted ORFs, their positions on the DRL-P1 genome, size, annotations and probable role in phage life cycle.
| REGIONs/ORFs | Span | Strand | Length | GenBankannotation | Role/function in phage life cycle | ||
|---|---|---|---|---|---|---|---|
| Start | Stop | ORF | aa | ||||
| REGION 1 | 1 | 353 | + | 353 | Terminal repeat | Genome replication & packaging | |
| ORF1 | 634 | 3216 | − | 2583 | 860 | Phage internal (Core) protein | Virion Structure |
| ORF2 | 3220 | 3648 | − | 429 | 142 | Phage exonuclease | Genome replication |
| ORF3 | 3658 | 4251 | − | 594 | 197 | Phage tail fiber protein | Host infection |
| ORF4 | 4260 | 4799 | − | 540 | 179 | Hypothetical protein | |
| ORF5 | 4799 | 5302 | − | 504 | 167 | Phage tail fiber protein | Host infection |
| ORF6 | 5312 | 5740 | − | 429 | 142 | Hypothetical protein | |
| ORF7 | 5742 | 6092 | − | 351 | 116 | Phage exonuclease | Replication |
| ORF8 | 6089 | 6412 | − | 324 | 107 | Hypothetical protein | |
| ORF9 | 6412 | 6864 | − | 453 | 150 | Phage tail fiber Protein | Host infection |
| ORF10 | 6922 | 8436 | − | 1515 | 504 | Putative transcriptional regulator | Gene expression |
| ORF11 | 8453 | 9034 | − | 582 | 193 | Hypothetical protein | |
| ORF12 | 9031 | 9582 | − | 552 | 183 | Hypothetical protein | |
| ORF13 | 9590 | 9988 | − | 399 | 132 | Hypothetical protein | |
| ORF14 | 9985 | 10,452 | − | 468 | 155 | Hypothetical protein | |
| ORF15 | 10,467 | 10,904 | − | 438 | 145 | Hypothetical protein | |
| ORF16 | 11,006 | 12,154 | − | 1149 | 382 | Phage capsid and scaffold Protein | Virion assembly |
| ORF17 | 12,164 | 12,799 | − | 636 | 211 | Hypothetical protein | |
| ORF18 | 12,803 | 14,230 | − | 1428 | 475 | Phage capsid and Scaffold protein | Virion assembly |
| ORF19 | 14,743 | 14,883 | − | 141 | 46 | Hypothetical protein | |
| ORF20 | 14,880 | 15,086 | − | 207 | 68 | Hypothetical protein | |
| ORF21 | 15,106 | 15,942 | − | 837 | 278 | Phage minor capsid protein | Virion Structure & assembly |
| ORF22 | 15,942 | 18,239 | − | 2298 | 765 | putative minor head protein | Virion Structure |
| ORF23 | 18,419 | 18,820 | + | 402 | 133 | Hypothetical protein | |
| ORF24 | 18,852 | 19,175 | + | 324 | 107 | Hypothetical protein | |
| ORF25 | 19,172 | 19,375 | + | 204 | 67 | Hypothetical protein | |
| ORF26 | 19,381 | 19,692 | + | 312 | 103 | Hypothetical protein | |
| ORF27 | 19,776 | 20,288 | + | 513 | 170 | Hypothetical protein | |
| ORF28 | 20,392 | 21,324 | + | 933 | 310 | Hypothetical protein | |
| ORF29 | 21,321 | 21,416 | + | 96 | 31 | Hypothetical protein | |
| ORF30 | 21,426 | 22,019 | + | 594 | 197 | Hypothetical protein | |
| ORF31 | 22,036 | 22,473 | + | 438 | 145 | Hypothetical protein | |
| ORF32 | 22,559 | 23,338 | + | 780 | 259 | Hypothetical protein | |
| ORF33 | 23,341 | 23,775 | + | 435 | 144 | Hypothetical protein | |
| ORF34 | 23,820 | 24,170 | + | 351 | 116 | Hypothetical protein | |
| ORF35 | 24,170 | 24,388 | + | 219 | 72 | Hypothetical protein | |
| ORF36 | 24,385 | 24,768 | + | 384 | 127 | Hypothetical protein | |
| ORF37 | 24,805 | 26,187 | − | 1383 | 460 | Phage terminase, large subunit | DNA translocation and packaging termination |
| ORF38 | 26,387 | 26,575 | + | 189 | 62 | Hypothetical protein | |
| ORF39 | 26,695 | 26,841 | + | 147 | 48 | Hypothetical protein | |
| ORF40 | 26,852 | 27,154 | + | 303 | 100 | Hypothetical protein | |
| ORF41 | 27,201 | 28,118 | + | 918 | 305 | Phage tail length tape-measure protein | Genome injection |
| ORF42 | 28,121 | 28,309 | + | 189 | 62 | Hypothetical protein | |
| ORF43 | 28,389 | 28,574 | + | 186 | 61 | Hypothetical protein | |
| ORF44 | 28,699 | 28,899 | + | 201 | 66 | Hypothetical protein | |
| ORF45 | 28,896 | 29,111 | + | 216 | 71 | Hypothetical protein | |
| ORF46 | 29,108 | 29,299 | + | 192 | 63 | Hypothetical protein | |
| ORF47 | 29,296 | 29,508 | + | 213 | 70 | Hypothetical protein | |
| ORF48 | 29,536 | 30,183 | + | 648 | 215 | Hypothetical protein | |
| ORF49 | 30,180 | 30,506 | + | 327 | 108 | Putative single-stranded DNA binding protein | Genome replication |
| ORF50 | 30,572 | 30,796 | + | 225 | 74 | Hypothetical protein | |
| ORF51 | 30,850 | 31,077 | + | 228 | 75 | Phage dihydrofolate reductase | DNA synthesis |
| ORF52 | 31,087 | 31,308 | + | 222 | 73 | Hypothetical protein | |
| ORF53 | 31,356 | 31,673 | + | 318 | 105 | Phage single-stranded-DNA-specific exonuclease | Genome replication |
| ORF54 | 31,683 | 32,309 | + | 627 | 208 | Phage putative head protein | Virion Structure |
| ORF55 | 32,502 | 33,116 | + | 615 | 204 | Hypothetical protein | |
| ORF56 | 33,279 | 33,857 | − | 579 | 192 | Hypothetical protein | |
| ORF57 | 34,388 | 34,618 | − | 231 | 76 | Hypothetical protein | |
| ORF58 | 34,817 | 36,547 | − | 1731 | 576 | Phage-associated DNA primase | Genome replication |
| ORF59 | 36,695 | 36,880 | − | 186 | 61 | Hypothetical protein | |
| ORF60 | 36,886 | 37,962 | − | 1077 | 358 | Hypothetical protein | |
| ORF61 | 37,959 | 38,408 | − | 450 | 149 | Hypothetical protein | |
| ORF62 | 38,408 | 39,250 | − | 843 | 280 | Hypothetical protein | |
| ORF63 | 39,381 | 40,166 | − | 786 | 261 | Hypothetical protein | |
| ORF64 | 40,334 | 40,756 | + | 423 | 140 | Hypothetical protein | |
| ORF65 | 40,743 | 41,930 | + | 1188 | 395 | Capsid decoration protein | Virion Structure |
| ORF66 | 42,092 | 42,982 | + | 891 | 296 | Hypothetical protein | |
| ORF67 | 43,087 | 44,088 | + | 1002 | 333 | Hypothetical protein | |
| ORF68 | 44,178 | 44,408 | + | 231 | 76 | Hypothetical protein | |
| ORF69 | 44,408 | 44,626 | + | 219 | 72 | Hypothetical protein | |
| ORF70 | 44,610 | 44,828 | + | 219 | 72 | Phage tail assembly protein | Virion Structure |
| ORF71 | 44,828 | 45,094 | + | 267 | 88 | Hypothetical protein | |
| ORF72 | 45,106 | 45,312 | + | 207 | 68 | Phage minor tail protein | Virion Structure |
| ORF73 | 45,312 | 46,229 | + | 918 | 305 | Thymidylate synthase | DNA synthesis |
| ORF74 | 46,231 | 46,422 | + | 192 | 63 | Phage tail assembly protein | Virion Structure |
| ORF75 | 46,425 | 47,465 | + | 1041 | 346 | 5'Polynucleotide kinase-3'phosphatase | DNA damage repair |
| ORF76 | 47,541 | 48,095 | + | 555 | 184 | Hypothetical protein | |
| ORF77 | 48,095 | 51,202 | + | 3108 | 1035 | Phage DNA polymerase III alpha subunit | Genome replication |
| ORF78 | 51,195 | 51,605 | + | 411 | 136 | Phage Recombination protein | General recombination |
| ORF79 | 51,602 | 53,161 | + | 1560 | 519 | Phage DNA Helicase | Genome replication |
| ORF80 | 53,256 | 53,876 | + | 621 | 206 | Phage tail fiber protein | Virion Structure / Host infection |
| ORF81 | 53,965 | 54,861 | + | 897 | 298 | Hypothetical protein | |
| ORF82 | 54,917 | 55,522 | + | 606 | 201 | Hypothetical protein | |
| ORF83 | 55,519 | 56,073 | + | 555 | 184 | Phage DNA Binding protein | Genome replication |
| ORF84 | 56,127 | 57,038 | + | 912 | 303 | Phage DNA Ligase | Genome replication |
| ORF85 | 57,318 | 57,569 | + | 252 | 83 | Hypothetical protein | |
| ORF86 | 57,594 | 58,256 | − | 663 | 220 | Phage endolysin | Host cell Lysis |
| ORF87 | 58,256 | 58,684 | − | 429 | 142 | Phage tail fiber component | Virion Structure |
| ORF88 | 58,687 | 61,581 | − | 2895 | 964 | Phage tail fiber protein | Virion Structure |
| ORF89 | 61,586 | 63,100 | − | 1515 | 504 | Hypothetical protein | |
| ORF90 | 63,097 | 64,350 | − | 1254 | 417 | Phage tail assembly protein | Virion Structure |
| ORF91 | 64,407 | 65,072 | − | 666 | 221 | Baseplate protein | Virion Structure |
| ORF92 | 65,128 | 65,661 | − | 534 | 177 | Hypothetical protein | |
| ORF93 | 65,661 | 66,128 | − | 468 | 155 | Phage minor tail protein | Virion Structure |
| REGION2 | 65,891 | 66,243 | + | 353 | Terminal Repeat | Genome replication & packaging | |
Figure 3.

Complete genome map of 66,243 bp DRL-P1 dsDNA, visualized by SnapGene tool trial version (https://www.snapgene.com/). ORFs annotated by GeneMarkS and PHASTER servers are represented as arrows, where the arrowheads denote orientation of the respective ORFs. ORFs encoding structural, functional, lytic and hypothetical genes are shown by blue-, green-, red-, and maroon-colored arrows, respectively. The two terminal repeats are shown by lavender boxes. Details of the ORFs are presented in the annotation Table 1.
Neighbor-Joining (NJ) phylogenetic trees were reconstructed for terminase and DNA polymerase III genetic sequences with top 100 BLAST hit sequences (including RefSeq sequences). In the terminase sequence phylogeny (Fig. 4), DRL-P1 clustered most closely with a Pbunavirus RefSeq sequence ‘DL60’ (NC_028745), and an unclassified Pbunavirus sequence 'zikora' (MW557846), having a divergence of 0.0124 base substitutions per site with both the sequences. Conversely, in the DNA polymerase III sequence phylogeny (Fig. 5), DRL-P1 clustered most closely with two unclassified Pbunaviruses, ‘zikora’ and ‘elmo’ (MT119364), both showing the divergence of 0.001 base substitutions per site, followed by close affiliation to RefSeq Pbunavirus 'datas’ (NC_050143) and ‘DL52’ (KR054028) having divergences of 0.0068 and 0.0133 base substitutions per site, respectively. Similar to the DNA polymerase III gene sequence phylogeny, in the complete genome phylogeny, DRL-P1 clustered with Pbunavirus isolates 'zikora', ‘DL52’, ‘datas’, ‘steven’ (MT119370), and 'elmo’, supported by high bootstrap values (Fig. 6).
Figure 4.
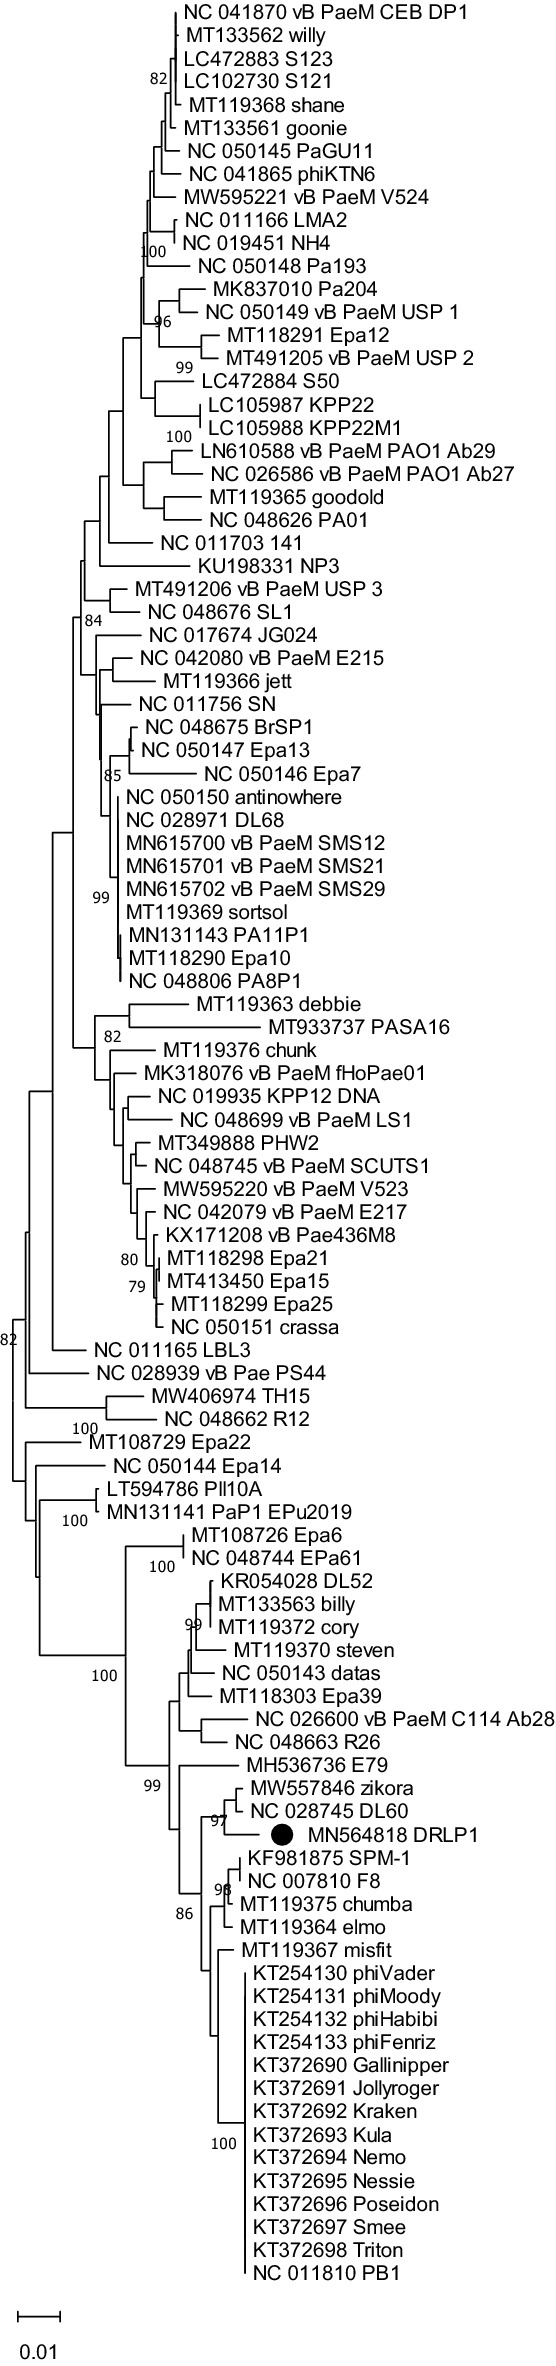
Neighbor-Joining phylogenetic tree based on the large terminase gene sequences from DRL-P1 and related 98 GenBank sequences. Multiple sequences were aligned using the MAFFT online server. Evolutionary distances were calculated using the Maximum Composite Likelihood method implemented in MEGA X computer program. Numbers below the branches represent percentage of replicate trees, where the associated taxa clustered together during the bootstrap test (1000 replicates). The optimal tree is drawn to scale with branch lengths signifying the evolutionary distances used to infer the tree. A total of 1383 positions were available in the final dataset for evolutionary analyses. Ambiguous positions were excluded from analysis. Graphical presentation of the phylogeny was generated using the MEGA X computer program, version 10.2.4 (https://www.megasoftware.net/).
Figure 5.
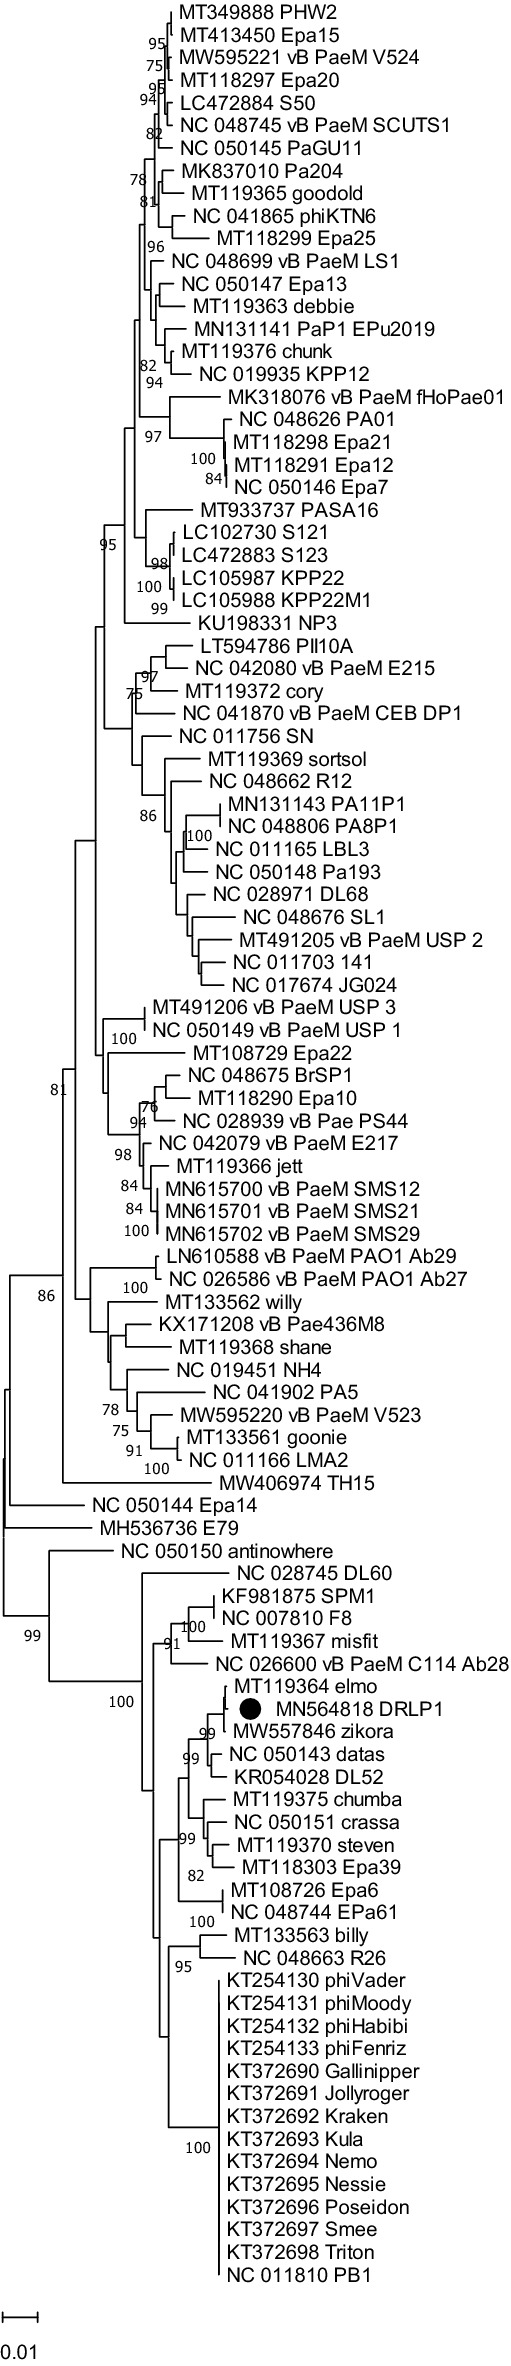
Neighbor-Joining phylogenetic tree based on the DNA pol III sequences from DRL-P1 and related 100 GenBank sequences. Multiple sequences were aligned using the MAFFT online server. Evolutionary distances were calculated using the Maximum Composite Likelihood method implemented in MEGA X computer program. Numbers below the branches represent percentage of replicate trees, where the associated taxa clustered together during the bootstrap test (1000 replicates). The optimal tree is drawn to scale with branch lengths signifying the evolutionary distances used to infer the tree. A total of 3111 positions were available in the final dataset for evolutionary analyses. Ambiguous positions were excluded from analysis. Graphical presentation of the phylogeny was generated using the MEGA X computer program, version 10.2.4 (https://www.megasoftware.net/).
Figure 6.
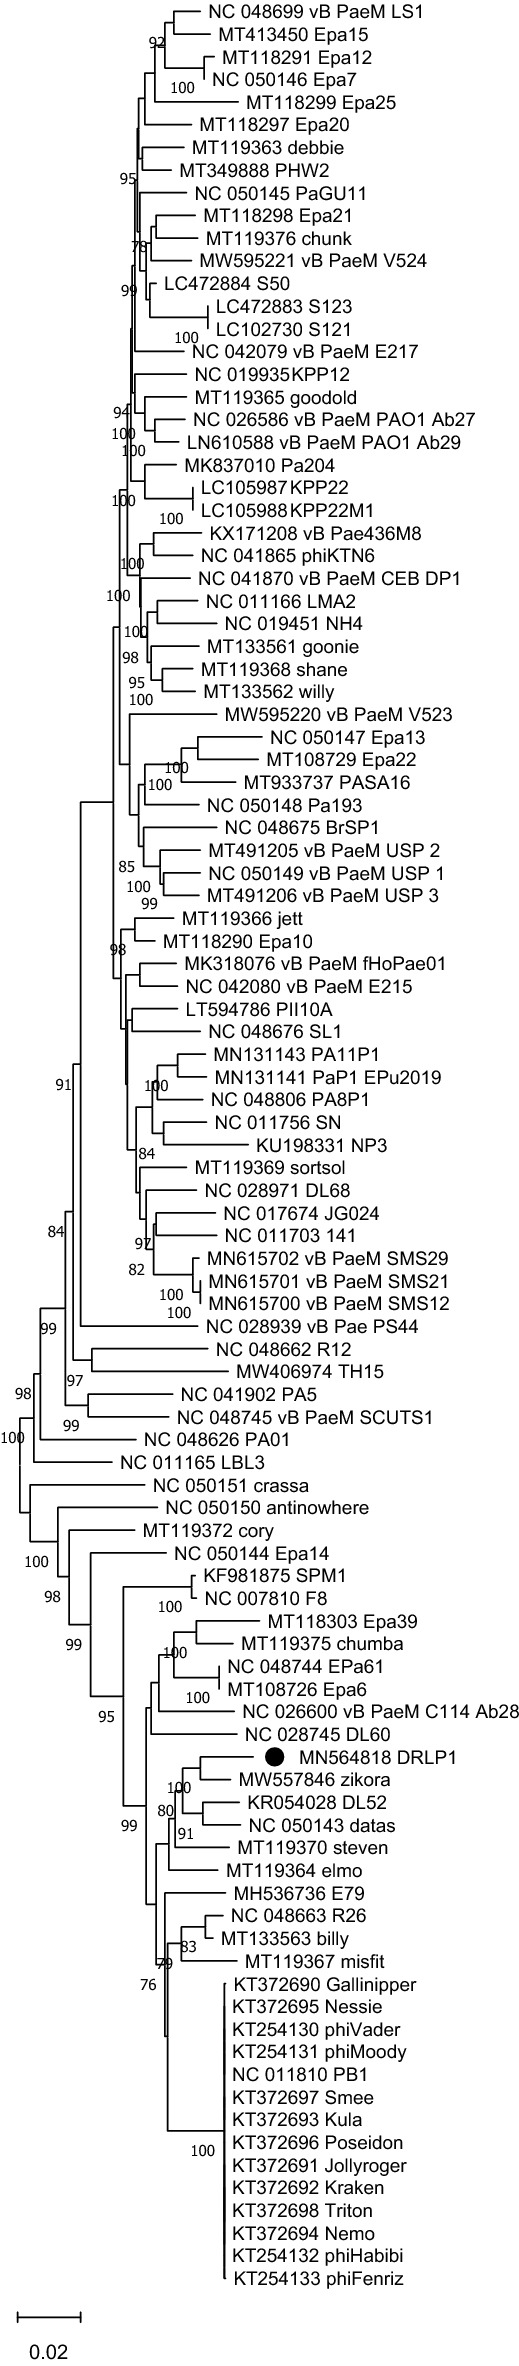
Neighbor-Joining phylogenetic tree based on complete genome sequences from DRL-P1 and related 100 GenBank sequences. Multiple sequences were aligned using the MAFFT online server. Evolutionary distances were calculated using the Maximum Composite Likelihood method implemented in MEGA X computer program. Numbers below the branches represent percentage of replicate trees, where the associated taxa clustered together during the bootstrap test (1000 replicates). The optimal tree is drawn to scale with branch lengths signifying the evolutionary distances used to infer the tree. A total of 147,417 positions were available in the final dataset for evolutionary analyses. Ambiguous positions were excluded from analysis. Graphical presentation of the phylogeny was generated using the MEGA X computer program, version 10.2.4 (https://www.megasoftware.net/).
To further elucidate the taxonomic position of DRL-P1, we used the VIRIDIC program to calculate pairwise intergenomic similarities between DRL-P1 and 100 top BLAST hit Pbunavirus genomes including 37 RefSeq and 63 other complete genome sequences retrieved from the GenBank. In concurrence with the complete genome phylogeny, the VIRIDIC program clustered DRL-P1 with ‘DL52’, ‘zikora’, ‘elmo’, and ‘steven’ as a separate species under the genus Pbunavirus (Supplementary data, Tables S5,S6), presenting with 96.0% to 97.5% nucleotide identity among themselves. On the other hand, DRL-P1 showed 93.3% and 92.8% nucleotide identity with Pbunavirus RefSeq sequences ‘DL60’ and ‘datas’, respectively, which were suggested as close relatives in the phylogenetic analysis of the terminase and DNA polymerase III genetic regions. Although DRL-P1 showed high intergenomic similarities and close phylogenetic relatedness to these phage genomes isolated from different parts of the world, results of progressive multiple genome alignment analysis demonstrated that the arrangement of locally colinear blocks (LCBs) in the DRL-P1 genome was substantially distinct (Fig. 7).
Figure 7.

Results of Mauve progressive alignment of annotated complete genome sequences of DRL-P1 with related Pbunaviruses ‘zikora’, ‘elmo’, ‘DL52’, ‘steven’, ‘datas’, ‘DL60’ and ‘PB1’ (from top to bottom). Relative position of the homologous regions or the locally collinear blocks (LCBs) shared by two or more genomes are depicted by same colors. Similarity of the LCBs between genomes are signified by plot within the blocks, where the height of the plot represents mean nucleotide identity. Relative position of the homologous LCBs among the genomes are indicated by thin vertical lines of same-color. The white blocks under the LCBs represent genome features (annotated ORFs) obtained from the GenBank. Graphical presentation of the alignment of LCBs was generated using the progressiveMauve computer program version 2.4.0 (http://darlinglab.org/mauve/mauve.html).
Minor differences in terminase and DNA polymerase III phylogenetic tree topologies along with the observed differences in the arrangement of LCBs in the DRL-P1 genome as compared to closely related Pbunavirus genomes indicated the possibility of horizontal gene transfer or recombination. Therefore, a NN was reconstructed (Fig. 8) using the complete genome dataset previously used to reconstruct NJ phylogeny. The clustering pattern of sequences in the NN principally agreed to the NJ phylogeny, yet there were signals of genetic exchange in the form of extensive reticulation at the base of the DRL-P1 stock. The reticulation between DRL-P1 and other related genomes indicated multiple events of genetic exchanges, suggesting to rationalize the observed subtle divergences in terminase and the DNA polymerase III tree topologies. Subsequent analysis of recombination revealed the existence of genetic fragments similar to various other Pbunaviruses in the DRL-P1 genome, which seem to suggest the evolution of the DRL-P1 genome through the frequent exchange of genetic material (Fig. 9, Table 2).
Figure 8.

Neighbor-Net network tree was reconstructed with 100 GenBank sequences including 37 NCBI-RefSeq and DRL-P1complete genome sequence, using the SplitsTree4 computer program. Sequences were aligned using the CLUSTALW program. Kimura-2 parameter algorithm was employed for estimating genetic differences. The dataset included a total of 119,869 positions. Gaps and parsimony uninformative sites were excluded from analysis. Graphical presentation of the network tree was generated using SplitsTree4 computer program (version 4.14.6; https://uni-tuebingen.de/en/fakultaeten/mathematisch-naturwissenschaftliche-fakultaet/fachbereiche/informatik/lehrstuehle/algorithms-in-bioinformatics/software/splitstree/).
Figure 9.

Recombination map showing 12 recombination events in the DRL-P1 genome, as detected by the RDP4 computer program. The dataset included DRL-P1 and 37 NCBI-RefSeq complete genome sequences. Details of the recombination events are presented in Table 2. Minor and Major parent involved in each of the recombination event is indicated by the most similar RefSeq isolate name. Graphical presentation of the recombination events was generated using the RDP4 computer program (version 4.95; http://web.cbio.uct.ac.za/~darren/rdp.html).
Table 2.
Details of recombination events detected in the DRL-P1 complete genome.
| Events | Breakpoint positions (99% CI) | Parental sequences most similar to RefSeq | Detection method | ||||||||
|---|---|---|---|---|---|---|---|---|---|---|---|
| Begin | End | Minor parent | Major parent | RDP | GENECONV | BOOTSCAN | MAXCHI | CHIMAERA | SISSCAN | 3SEQ | |
| 1 | *1–2508 | 27,450–27,676 | NC_050150_antinowhere | NC_011810_PB1 | NS | 7.63E−05 | 1.39E−05 | 3.44E−03 | NS | 2.33E−11 | NS |
| 2 | 12,952–13,552 | 15,791–16,070 | NC_048662_R12 | NC_41902_PA5 | 3.87E−11 | NS | 9.28E−12 | 4.06E−14 | 5.68E−17 | 1.04E−21 | NS |
| 3 | 30,300–30,982 | 31,037–31,179 | NC_028745_DL60 | NC_050150_antinowhere | NS | 6.07E−06 | NS | 2.13E−03 | 2.33E−04 | 9.07E−08 | NS |
| 4 | 34,741–34,864 | 35,766–36,483 | NC_048744_EPa61 | NC_007810_F8 | 2.17E−02 | NS | 4.30E−03 | 1.02E−09 | 7.24E−07 | NS | 7.76E−07 |
| 5 | 34,742–36,409 | 36,756–49,890 | NC_048663_R26 | NC-007810_F8 | NS | 4.52E−04 | 2.89E−06 | 3.05E−03 | NS | NS | 8.81E−05 |
| 6 | 37,757–39,593 | 40,875–41,707 | NC_011810_PB1 | NC_048744_EPa61 | 2.78E−03 | 4.94E−05 | 2.02E−02 | 7.31E−07 | 1.89E−05 | 5.20E−07 | 2.20E−19 |
| 7 | 40,875–41,089 | 41,394–41,482 | NC_048745_SCUTS1 | NC_050145_PaGU11 | NS | 4.24E−07 | 6.04E−18 | 5.99E−05 | 2.91E−04 | 2.45E−24 | 1.07E−06 |
| 8 | 42,697–42,783 | 49,313–50,275 | NC_007810_F8 | NC_050143_datas | 1.81E−34 | 5.00E−59 | 3.02E−52 | 1.76E−22 | 3.73E−14 | 4.91E−33 | 1.32E−12 |
| 9 | 54,844–55,619 | 58,859–59,079 | NC_048744_EPa61 | NC_011810_PB1 | 4.78E−66 | 3.75E−88 | 1.38E−92 | 1.20E−37 | 1.13E−38 | 6.11E−48 | NS |
| 10 | 40,432–59,079 | 59,115–59,433 | NC_041870_DP1 | NC_050150_antinowhere | NS | 3.31E−12 | 1.87E−12 | 2.63E−04 | 1.35E−04 | NS | 5.62E−11 |
| 11 | 59,386–59,605 | 59,938–60,186 | NC_007810_F8 | NC_019935_KPP12 | 5.51E−70 | 8.01E−73 | 1.85E−72 | 1.82E−13 | 6.12E−13 | 5.46E−24 | 5.62E−12 |
| 12 | 59,838–61,747 | 62,466–62,776 | NC_028745_DL60 | NC_007810_F8 | NS | NS | 2.87E−05 | 4.85E−09 | 1.85E−05 | NS | 3.74E−07 |
NS not significant.
Phage adsorption and growth kinetics
A maximum of 76% phage adsorption was documented within 20 min without any supplements. In comparison, when supplemented with MgCl2, approximately 82% of the phages were adsorbed within 5 min, while a maximum of 90% adsorption took place within 20 min. These results indicate a positive effect of Mg2+ ions on phage infectivity, probably by accelerating phage adsorption rate, thereby ensuring lysis of a maximum number of bacterial cells (Fig. 10a).
Figure 10.

(a) Effect of magnesium ion on adsorption rate of P. aeruginosa bacteriophage (DRL-P1). (b) A single-step growth curve of phage DRL-P1 measured against P. aeruginosa at an MOI of 0.1. The growth curve suggests a latent phase (LP) of ~ 30 min, while a burst size (BS) of ~ 100 PFU per infected cell. The plots represent mean obtained from three independent replicate for each point and vertical whiskers represent SD. Plots were generated using the chart function incorporated in Excel program (MS Office version 18.2106.12410.0).
A single-step growth curve (Fig. 10b) was prepared to evaluate the latent period and the burst size of the phage DRL-P1. The latent period was found to be approximately 30 min which signifies the time interval between phage adsorption and the start of the first burst. On the other hand, the duration of the rise period was estimated to be around 50 min with a burst size of approximately 100 PFU per infected cell was recorded in the experiments.
Stability of phage at different temperatures and pH conditions
The temperature vs. phage stability was studied at six different temperatures viz. 25 °C, 37 °C, 40 °C, 50 °C, 60 °C, and 70 °C. Storage at 4 °C was considered as the control for the temperature stability experiments (Fig. 11a). Our results demonstrated that the phage DRL-P1 was substantially stable at 25 °C, 37 °C temperatures, while moderately stable at 40 °C and 50 °C temperatures. However, at a temperature of 60 °C and above, phage stability decreased significantly. Specifically, as compared to control, 72% of the phages survived 60 °C temperature (*P < 0.05), whereas, only 14% of the phages could survive 70 °C temperature (***P < 0.001), after the experiment.
Figure 11.

Stability of phage DRL-P1 under different thermal and pH conditions. (a) Graph showing effects of different temperature conditions on the stability of DRL-P1. Phage aliquots were incubated at different temperatures, 25 °C, 37 °C, 40 °C, 50 °C, 60 °C and 70 °C for 60 min, followed by enumeration of viable phages by standard double-layer plaque assay. Stability of phage stored at 4 °C was considered as control for comparison. Data obtained from three independent experiments are represented here as mean ± SD. ***P < 0.001 or *P < 0.05 indicates a significant reduction at temperature 60 °C & 70 °C in comparison to initial PFU count. (b) Graph showing effects of different pH conditions on the stability of phage DRL-P1. Aliquots of phage were added to buffers adjusted to various pH conditions (1.0–14.0), incubated at room temperature for 18 h, followed by enumeration of viable phages by standard double-layer plaque assay. Data obtained from three independent experiments are represented here as mean ± SD. ***P < 0.001, **P < 0.01 or *P < 0.05 indicates a significant reduction level at pH 3, 4, 5, 10, 11 &12 in comparison to initial PFU count (as compared to phage stored in TM buffer pH 7.4 at 4 °C). Plots were generated using the chart function incorporated in Excel program (MS Office version 18.2106.12410.0) and statistical analysis were performed using the GraphPad PRISM computer program (Trial version 7.05; https://www.graphpad.com/scientific-software/prism/).
Our study demonstrated that after 18 h of incubation under different pH conditions, phage DRL-P1 was most stable at pH 6.0, 7.0, and 8.0, and no significant loss in the titer was observed. However, below pH 3.0 and beyond pH 10.0, only minute fractions of the viable phages were found. Approximately, 70% of the phage population was viable between pH 5.0 to 10.0. As compared to the initial titer, a significant reduction resulting in the survival of 65% and 72% phages was observed at pH 4.0 (**P < 0.01) and pH 5.0 (*P < 0.05), respectively. No viable phages were recovered after incubation at extreme pH 1.0, 2.0, 13.0, and 14.0 conditions (Fig. 11b).
Decontamination of fomites through phage preparations
In the present work, a glass coverslip was used to represent the contaminated solid surface. The decontamination potential of the DRL-P1 phage was determined at different MOIs. A 90% reduction in the bacterial count was recorded at MOI:1.0 (***P < 0.001), whereas at MOI:0.1, 52% (***P < 0.001) reduction was observed. As compared to no-phage control, a significant (***P < 0.001) reduction in the bacterial count was recorded at even low MOIs of 0.01 and 0.001, demonstrating 42% and 37% reduction, respectively. Data (mean ± SD) obtained from the experiments are represented in Fig. 12.
Figure 12.
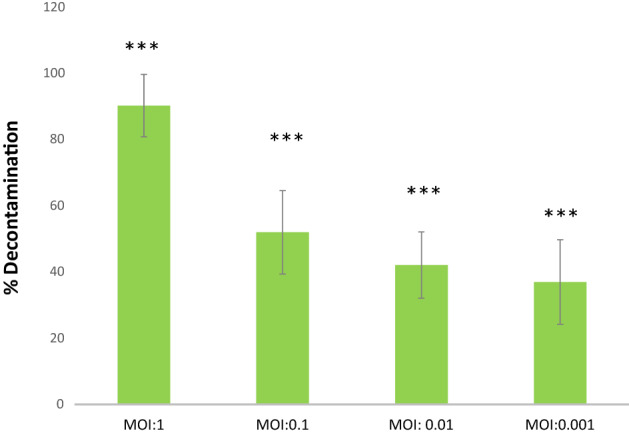
Graphical representation of results from decontamination assay experiments using artificially contaminated cover-slip model for contaminated surfaces. Decontamination of artificially contaminated glass cover slip with phage DRL-P1 application at different MOI (1.0, 0.1, .01, .001). MOI:0 represents control (no phage treatment). Bars represent average % reduction of P. aeruginosa after phage treatment at different MOIs. Data represents mean ± SD from the triplicate experiments. ***P < 0.001 indicates a significant difference between phage treatment at different MOI and the control with no phage treatment. Plots were generated using the chart function incorporated in Excel program (MS Office version 18.2106.12410.0) and statistical analysis were performed using the GraphPad PRISM computer program (Trial version 7.05; https://www.graphpad.com/scientific-software/prism/).
Phage action on bacteria
Phage action on bacterial growth was observed through a change in OD600 over 8 h of incubation. Data from the no-phage control experiment (MOI:0) showed a typical sigmoid curve representing an uninhibited bacterial growth, whereas experiments set up with different MOIs (100, 10, 1, 0.1, 0.01, and 0.001) indicated inhibition of bacterial growth due to phage action (Fig. 13).
Figure 13.

In vitro lytic activity of DRL-P1 against P. aeruginosa. Lytic activity was studied at Multiplicity of Infection (MOI), 100, 10, 1, 0.1, 0.01, 0.001 for 8 h. Bacterial growth was recorded by changes in absorbance (OD600) using an automated multi-mode plate reader. Data displayed in the plot represent mean ± SD of three independent experiments. Plots were generated using the chart function incorporated in Excel program (MS Office version 18.2106.12410.0).
Biofilm degradation assay
In our experiments, DRL-P1 showed degradation potential against pre-established P. aeruginosa biofilms (Fig. 14). Using the standard method of phage-bacteria co-cultures set-up at various MOIs, we could observe a considerable decrease in bacterial biomass after 12, 24, and 48 h of incubation. In co-cultures set-up at MOI:10, significant loss (***P < 0.001) of approximately 45%, 59%, and 67% biomass were observed after 12 h, 24 h, and 48 h incubation, respectively. Similarly, at a MOI:1.0, significant (***P < 0.001) loss of approximately 40%, 59%, and 64% biomass were observed after 12 h, 24 h, and 48 h incubation, respectively, as compared to the untreated phage control. DRL-P1 also exhibited a significant biofilm degradation efficiency even at relatively lower MOIs 0.01, 0.001 (***P < 0.001 and ***P < 0.001, respectively) after 24 and 48 h of incubation (Fig. 14).
Figure 14.

Graph showing the results of DRL-P1 mediated P. aeruginosa biofilm degradation assay performed at various MOIs (10, 1, 0.1, 0.01, 0.001). Non-phage treated biofilm was used as a positive control. OD at 595 nm was measured at 12, 24 and 48 h. Data represents mean ± SD from the triplicate experiments. ***P < 0.001 or *P < 0.05 indicate significant difference between the control and the respective phage treated samples after a particular period of time. Plots were generated using the chart function incorporated in Excel program (MS Office version 18.2106.12410.0) and statistical analysis were performed using the GraphPad PRISM computer program (Trial version 7.05; https://www.graphpad.com/scientific-software/prism/).
Stability of phage after lyophilization and encapsulation within alginate
Lyophilization of bacteriophage (~ 109 PFU mL−1) resulted in an initial drop in the phage titer (~ 108 PFU mL−1). For experiments, lyophilized phages were reconstituted in 2 mL TM buffer and plaque assay was performed to determine PFU. Our results indicate that once lyophilized, DRL-P1 retained its lytic activity without any significant drop in titer up to 12 months. However, after 18 months of storage (tested so far), the PFU of the lyophilized sample was found to be significantly reduced (~ 107 PFU mL−1, ***P < 0.001) (Fig. 15a).
Figure 15.

(a) Stability of lyophilized DRL-P1 at different time interval. Lyophilized phages were reconstituted in TM buffer and titers determined through standard double layer plaque assay. Bars represents mean ± SD from the three vials tested at each time point. ***P < 0.001 indicate significant difference between the initial titre and the stored lyophilized phage samples, after 18 months. (b) Stability of DRL-P1 in alginate capsules at different time interval. Zone of clearance by phage loaded alginate beads over the lawn of P. aeruginosa was measured. Bars represents mean ± SD from the three samples tested at each time point. *P < 0.05 indicate significant difference between the initial titre and the phage loaded in alginate beads after 18 months. Plots were generated using the chart function incorporated in Excel program (MS Office version 18.2106.12410.0) and statistical analysis were performed using the GraphPad PRISM computer program (Trial version 7.05; https://www.graphpad.com/scientific-software/prism/).
The lytic activity of phage-loaded and mock-loaded (only TM buffer) alginate beads (5–6 mm) was tested by placing the beads over a lawn of P. aeruginosa. A clear zone was measured to determine the lytic potential of the DRL-P1 phage loaded within the alginate beads. Each of the freshly prepared phage-loaded beads showed ~ 13 ± 1.1 mm zones of clearance. No statistically significant change in the zone of clearance was noted in assays performed with phage-loaded beads stored for 6 months and 12 months, showing ~ 13 ± 1.0 and ~ 11 ± 1.1 mm zones of clearance, respectively. However, after 18 months of storage, the beads showed a significant decrease (*P < 0.05) in a zone of clearance (~ 10 ± 2 mm) (Fig. 15b).
Discussion
In India, more than 50% of the P. aeruginosa isolates are reported to be resistant to broad-spectrum antibacterial (fluoroquinolones) and third-generation beta-lactam antibiotic (cephalosporins)5,6. The P. aeruginosa isolate used in the present study was resistant to multiple antibiotics including Ceftazidime (a beta-lactam, 3rd-gen bactericidal cephalosporin antibiotic), Ampicillin (a semi-synthetic beta-lactam, broad-spectrum bactericidal), Nalidixic acid (a synthetic quinolone, antibacterial), Nitrofurantoin (a synthetic derivative of imidazolidinedione, antibiotic) and Co-Trimoxazole (a combination of trimethoprim and sulfamethoxazole), which are widely used in the treatment of bacterial infections involving multiple organs27. Interestingly, aggregates of P. aeruginosa can encase themselves within biofilms through the synthesis of extracellular matrix, making them almost impossible to treat or eradicate with antibiotics15. Fortunately, phages are highly effective in the treatment of recalcitrant infections and removal of biofilms, thereby exposing the bacterial aggregates to the therapeutics8,28–30. Therefore, in the current scenario of infection with critical pathogens, phage therapy has emerged as a promising alternative to antibiotics, especially against biofilm-forming and multidrug resistance bacteria15.
Owing to the inherent advantages of phages over chemical antibacterials, several researchers have now focused their efforts on the isolation, characterization, and application of lytic phages against P. aeruginosa infections13. Although very few reports are available so far, Indian researchers have also endeavored upon attempts to isolate Pseudomonasphages. A PubMed literature search conducted on June 25th, 2021, using the query string “bacteriophage + Pseudomonas + aeruginosa” resulted in 1409 articles. On the other hand, a query string “bacteriophage + Pseudomonas + aeruginosa + India” resulted in 20 articles, of which, only 7 research articles reported the isolation and/or application of phages19–25. To the best of our knowledge, while the present manuscript was under revision, a group of researchers published a detailed characterization of a Pseudomonasphage (N4-like phage AM.P2, Podoviridae family), isolated from wastewater from the southern part of India31. In the present manuscript, we report the isolation of a lytic Pseudomonasphage DRL-P1 (Myoviridae family) from wastewater from the northeastern part of India and carried out its detailed characterization (growth parameters, TEM based morphology, whole-genome sequencing, analysis of toxin and antimicrobial genetic regions, etc.). Subsequently, we demonstrate the lytic potential of DRL-P1 as a natural decontaminating agent.
We studied the growth parameters of DRL-P1 through a single-step growth curve which helps in defining phage lytic potential for biocontrol of bacteria32,33. Our results indicate a short latency period of approximately 30 min and a considerable burst size of approximately 100 phages per infected cell for DRL-P1. While the latency period defines the period between virion attachment to the host bacterium and the release of new phage particles, burst size defines the average number of new phage particles released from each infected cell after a lytic cycle26. Therefore, short latency and large burst size are considered characteristic features of an efficient lytic phage and indicate the suitability of a phage for therapeutic applications26,34. In addition, stability of the phages at various temperatures, pH conditions, and tolerance to storage techniques are also critical parameters for their practical application in diverse settings. In clinical applications, the candidate phage has to withstand different pH conditions depending upon the route of administration, while it has to tolerate a wide variation in pH and temperature in an environmental application26,35. Our data showing that DRL-P1 is substantially stable over a wide range of conditions including temperature, pH and can withstand techniques for storage, advocate the suitability of DRL-P1 for varied settings such as clinical, environmental, etc. Therefore, wastewater receiving sewage is considered to be one of the best sources for isolation of sturdy phages that have evolved to tolerate harsh and fluctuating physicochemical conditions.
A thorough analysis of the DRL-P1 complete genome revealed its identity as a member of the Pbunavirus genus under the family Myoviridae of tailed bacteriophages. Virus particle features, genome length, GC content, number of ORFs were similar to typical Pbunaviruses36. Despite Blast search showing close homology of DRL-P1 sequence with various Pbunavirus sequences submitted in the GenBank, molecular evolutionary analyses including the terminase and DNA polymerase III displayed minor differences in phylogenetic clustering (NJ trees), suggesting a non-homogenous evolutionary history (horizontal genetic exchange such as recombination) of the DRL-P1 genome. To further explore this possibility, we reconstructed reticulate evolutionary history (NN tree), which represents tree topologies more accurately in the case of datasets comprising sequences with recombination37,38. Based on observed reticulations in the NN trees, we performed a detailed analysis of recombination, which showed that the DRL-P1 genome is composed of genetic segments from different related Pbunaviruses. Bacteriophages, owing to their extremely distant origin (> 3 billion years ago), highly dynamic population structure and active engagement in exchange of genetic material, are shown to have ‘pervasively mosaic’ genomes38, which supports our findings of frequent recombination events in the DRL-P1 genome. Notably, high intergenomic similarity estimates and species clustering patterns obtained from the VIRIDIC analysis suggested that DRL-P1 along with at least four unclassified sequences submitted in the GenBank (zikora, elmo, steven, DL52) represents a distinct species cluster under the genus Pbunavirus. However, our MAUVE analysis results show that the arrangement of LCBs in the DRL-P1 genome is substantially distinct from the other phage genomes of this species cluster, isolated from widely distant parts of the world. Taken together, our findings point to an independent evolutionary history of DRL-P1 and thus advocate its classification as a separate taxon under the genus Pbunavirus, albeit the Bacterial and Archaeal Viruses Subcommittee of the ICTV has the final authority to review and ratify phage classifications.
It is well known that motility helps a bacterial species in colonizing new surfaces, spreading across the surface, and formation of biofilms39. P. aeruginosa is a highly motile bacterium, which uses flagellum-facilitated swimming to reach and attach surfaces, and spreads across the surface by flagella and type IV pili mediated swarming and twitching movements, respectively39. P. aeruginosa can even move by sliding in the absence of flagella and type IV pili and by surfing movement in response to stress40,41. Multiple modes of motility, quorum-sensing, ability to form resistant biofilms, multiple processes for adaptation, etc. make P. aeruginosa an ideal pathogen for nosocomial transmission through contaminated surfaces, invasive ventilation devices, urinary catheterization, nasogastric feeding devices, etc.42. Our results from decontamination assays showed significant efficiency of DRL-P1 in decontaminating solid surfaces at different MOIs. We here demonstrate that contaminated surfaces can be effectively decontaminated by phage treatment, which cannot be subjected to the standard methods of decontamination, such as exposure to UV, autoclaving, etc. Similar surface decontamination by phage application has earlier been shown by Jensen et al.43 and Rashid et al.44. Previous studies have also demonstrated effective phage-mediated control of P. aeruginosa biofilm formation on catheters/endotracheal tubes and control of biofilms in mono and mixed cultures using different in vitro and in vivo models45–49. Further, application of phage DRL-P1 at low MOI of 0.01 and 0.001 resulted in effective decontamination which indicates our phage as a promising decontaminating agent against P. aeruginosa.
In addition to laboratory characterization of the potential phages, their successful application requires stable preservation in suitable excipients or as formulations in pharmaceutical products. Despite its intrinsic significance in the practical application of phages, relatively fewer studies are available on the topic. Researchers are continuously trying to improve phage stability under different storage conditions. Lyophilization-based stabilization techniques are proposed to be suitable for inhalation formulations, storage, and transportation at non-refrigerated conditions50. On the other hand, polymer encapsulation-based phage formulations have been shown to protect the phages from harsh pH, digestive enzymes, bile juices in the gastrointestinal tracts, while facilitating permeability to mucous linings51,52. Recently, Manohar & Ramesh50 compared the effect of different excipients during phage lyophilization and reported that sucrose, gelatin, and their combination have beneficial effects on phage viability during long-term storage. In the present study, we observed that initially there was a drop in PFU due to the process of lyophilization, no significant decrease was noted afterward even after 12 months of storage. A similar decrease in phage titer due to lyophilization has been described by other researchers too51,53,54. We also attempted encapsulation of the phage DRL-P1 in alginate beads and have demonstrated retention of its lytic activity after encapsulation, similar to that reported by previous studies52,55,56. Taken together, our results of lyophilization and encapsulation studies with DRL-P1 demonstrate its compatibility with different preservation procedures for diverse applications.
Although in recent times, phage therapy has gained substantial momentum in the treatment of disease caused by P. aeruginosa and other bacterial infections, several challenges still exist in the wider application of phages for therapeutic and other applications. One of the primary challenges is our limited understanding of the P. aeruginosa defense mechanisms that bestow resistance against a single phage or cocktails and permit phage adaptation to the altering host systems57. On the other hand, using an in vitro lung co-culture enhanced microenvironment model, a recent study showed that certain Pseudomonasphage promotes the production of inflammatory cytokines IL-6 and TNF-α, which emphasize the importance of understanding immunological responses to phages for their successful application as therapeutics58. Additionally, a thorough examination of the phage genomes for the presence of toxin or antibiotic resistance-related genes, careful evaluation of safety associated with combined therapies (phage + antibiotics or other drugs), and development of appropriate methods to rapidly evaluate phage competence against uncharacterized clinical isolates or poorly differentiated P. aeruginosa clones59 are some of the challenge areas that have enormous scope for further research.
Conclusion
The results of our phenotypic and genotypic characterization studies demonstrate that DRL-P1 is a virulent phage, belonging to the genus Pbunavirus under the Myoviridae family of bacteriophages. This phage was found to be highly lytic against MDR P. aeruginosa. DRL-P1 features short adsorption time, large burst size, stability over a wide range of pH and temperatures. Complete genome analysis of DRL-P1 confirmed the absence of any virulence factor such as toxins or antibiotic resistance genes. To the best of our knowledge, this is the first Pbunavirus to be isolated and characterized from India. In conclusion, our findings suggest DRL-P1 to be a potential candidate for therapeutic and sanitation applications.
Materials and methods
Phage isolation, purification, and preparation
Collection of wastewater sample was done from a community waste treatment facility (receiving human fecal matter), from Tezpur, Assam (26° 39′ 4.3848″ N and 92° 47′ 1.7268″ E). The host bacteria (P. aeruginosa) was isolated and grown on Cetrimide agar (Himedia, Mumbai, India). Briefly, the wastewater sample was spin down at 12,000×g for 10 min to remove debris and coarse matter. The supernatant was then serially passed through membrane filters of 0.45 μm and 0.22 μm pore size (Whatman filters, purchased from Sigma-Aldrich, St. Louis, USA). P. aeruginosa culture in the early exponential phase (approximately 107 CFU mL−1) was infected with the filtrate obtained and allowed to infect the host cells at 37 °C overnight with shaking (180 rpm). The presence of lytic phages in the sample was identified through clearance of lawn in spot tests.
A single plaque was picked and suspended in TM buffer (50 mM Tris–HCl, 10 mM MgCl2, pH 7.4). The titer of the phage was determined by making serial dilutions of the released phages and using it to infecting fresh P. aeruginosa cultures in log-phase, followed by double-layer agar plating and incubation at 37 °C for 16 h. Plaques were visualized and photographed using a stereo-zoom microscope (Leica EZ4 HD, Leica, Wetzlar, Germany) and the diameter of plaques (n = 56) was measured through Leica Application Suite EZ version 2.1.0 (Leica, Wetzlar, Germany; https://www.leica-microsystems.com/products/microscope-software/p/leica-application-suite/). Subsequently, phage lysate containing 109 PFU mL−1 was prepared by enrichment followed by PEG (polyethylene glycol) precipitation (8% wt/vol of PEG8000 and 1 M NaCl)60. Purified phage lysate was stored at 4 °C. A freshly prepared phage stock was sent for viewing under TEM.
This work was reviewed and approved by the DRL-IBSC (approval certificate DRL/IBSC/PROJ/10). All the microbiological manipulations were carried out inside a Class II A2 Biological Safety Cabinet (BSL2) (Esco, Singapore).
Transmission Electron Microscopy (TEM)
Around 3 µL of purified bacteriophage suspension was gently placed on glow-discharged carbon-coated 300 mesh copper grids. After about 1 min, the remaining solution on the grids was wicked away with the help of a filter paper. The grid was then stained with 2% (wt/vol) uranyl acetate and air-dried. The negatively stained phage particles were visualized with an FEI Tecnai 12 BioTwin Transmission electron microscope (FEI, Netherlands) at an operating voltage of 100 kV. Virus particle dimensions were measured using the ImageJ computer program (version 1.53e, https://imagej.nih.gov/ij/)61, with the software scale set on the scale bar obtained from the electron micrographs.
Antibiotic sensitivity assay and host range
Antibiotic sensitivity of P. aeruginosa strain used in this study was assessed using commercially available antibiotics coated Hexa discs G- minus 1 & G- minus 2 (HiMedia, Mumbai, India). Results were interpreted following the Clinical Laboratory Standard Institute (CLSI) guidelines as resistant, intermediate, or sensitive62. The following antibiotics were included in the assays: Ampicillin (AMP) 10 µg, Amoxyclav (AMC) 30 µg, Cefotaxime (CTX) 30 µg, Co-Trimoxazole (COT) 25 µg, Gentamicin (GEN) 10 µg, Tobramycin (TOB) 10 µg, Ceftazidime (CAZ) 30 µg, Ciprofloxacin (CIP) 5 µg, Amikacin (AK) 30 µg, Nitrofurantoin (NIT) 300 µg, Netillin (NET) 30 µg, Nalidixic acid (NA) 30 µg.
The host range of phage DRL-P1 was determined by spot assay and confirmed using the standard double-layer agar technique. Briefly, 5 µL of phage lysate (> 109 PFU mL−1) was spotted over a lawn of bacteria mixed with top agar. After overnight incubation at 37 °C, plates were examined for plaques/ clear zones.
Adsorption assay
For determination of the time required for the phage DRL-P1 to attach to its host, adsorption assay was performed according to Kim et al.63 with minor modifications. Briefly, exponentially growing host strain was infected with the phage at an MOI of 0.1 and was immediately aliquoted into separate vials. To see the effect of MgCl2 on phage adsorption, 10 mmol L−1 of MgCl2 was added into one aliquot, while an equal volume of sterile water was added to the other aliquot (no MgCl2). At 0, 5, 10, 15, and 20 min post-infection time intervals, 100 μL of samples were drawn from each experiment, immediately diluted in 900 μL of phosphate-buffered saline, and centrifuged at 12,000×g for 5 min. The titer of the non-adsorbed free phages in the supernatants so collected at different time intervals was determined by double-layer plaque assay.
Single-step growth curve
A single-step growth curve was performed following Kim et al.63 to determine the phage latent period and burst size. In brief, 10 mL exponentially growing P. aeruginosa culture was infected with phage particles at an MOI of 0.1 and was allowed to adsorb for 15 min at 37 °C. Subsequently, cells were pelleted by centrifugation (12,000×g for 5 min) and unadsorbed phages were removed by washing the pellets with fresh TSB. Cell pellets were then resuspended in 10 mL fresh TSB broth and incubated at 37 °C. Cultures were incubated for 120 min and after every 10 min, a sample was taken for double layer plaque assay. Each experiment was conducted in triplicate.
Temperature and pH stability assays
For thermal stability assays, equal volumes of TM buffer (900 µL) were aliquoted into 1.5 mL microcentrifuge tubes. All the tubes were kept at different temperatures (4 °C, 25 °C, 37 °C, 40 °C, 50 °C, 60 °C, and 70 °C) for 30 min. Subsequently, 100 µL of phage (~ 107 PFU mL−1) was added into each tube, mixed gently, and incubated at their respective temperature conditions for 60 min. Similarly, for pH stability assay, 100 µL of phage (~ 107 PFU mL−1) was added to microcentrifuge tubes containing 900 µL buffer solution adjusted at various pH (3.0, 4.0, 5.0, 6.0, 7.0, 8.0, 9.0, 10, 11, 12) and incubated for 18 h at room temperature. In both the studies, a double-layer plaque assay was performed and the percentage of surviving phages (as compared to phage stored in TM buffer pH 7.4 at 4 °C) was calculated by final PFU count over the initial PFU count64.
Genome sequencing, annotation, and genome analysis
For extraction of nucleic acids, phage particles released from the lysis of the host cells were collected by gently rinsing the top layer of 'web pattern’ plaque plates, using SM buffer. The high titer bacterial lysate was clarified by centrifugation at 14,000×g for 15 min at 4 °C and the clear supernatant was transferred to a fresh microcentrifuge tube. Subsequently, the supernatant was incubated with 50 U mL−1 of DNase I (Sigma-Aldrich, St. Louis, USA) and 40 U mL−1 of RNase A (ThermoFisher Scientific, Waltham, USA) for 2 h at 37 °C to remove contaminating host nucleic acids, and DNase I was then inactivated by incubation at 80 °C for 15 min. Capsid-protected phage DNA was released by proteinase K digestion for 2 h at 56 °C, purified by repeated cycles of extraction in Phenol/ Chloroform/ Isoamyl alcohol, precipitated using isopropanol, and finally dissolved in TE buffer60. The quantity and quality of the phage DNA preparation were evaluated spectro-photometrically (NanoPhotometer, Implen GmbH, Germany). The integrity of the DNA preparation was verified by electrophoresing an aliquot in 0.8% agarose gel, along with λ DNA/Hind III marker (Fermentas, Vilnius, Lithuania).
Purified phage DNA was sent to a commercial facility for NGS-based whole genome sequencing (AgriGenome Labs Pvt. Ltd., Kochi, India). Following standard quality evaluation, a paired-end library was prepared (Next Ultra, New England Biolabs, Massachusetts, USA) and library quality was evaluated on an automated electrophoresis platform (Tape Station, Agilent, Santa Clara, USA), followed by sequencing on Illumina HiSeq NGS platform (Illumina, San Diego, USA). After the sequencing run, adapter sequences were trimmed from the raw reads, reads with an average quality score of < 30 in any of the paired-end reads were filtered out as well as unique reads were removed. High-quality paired-end reads were then assembled de novo, using the Iterative Virus Assembler65. Analysis of features of the resulting phage genome including ORF prediction and annotation were accomplished using the GeneMarkS66 and PHASTER67 servers. Blastn (megablast) search was performed to find highly similar phage genome sequences in the NCBI GenBank68. BLASTX algorithm with E-value cutoff ≤ 10–3 was used to compare predicted genes with protein sequences submitted in the Uniprot database. A physical map of the annotated DRL-P1 phage genome was reconstructed using the SnapGene tool (trial version). The tRNAscan-SE program (http://lowelab.ucsc.edu/tRNAscan-SE/) was used to scan for potential tRNA genes in the genome69. Putative promoter regions were identified using the Neural Network Promoter Prediction program hosted on the Berkeley Drosophila Genome Project website (www.fruitfly.org/seqtools/promoter.html), with a minimum promoter score set at 0.970. To identify Rho-independent transcription terminators, the ARNOLD server (http://rssf.i2bc.paris-saclay.fr/toolbox/arnold/index.php) was used71. The lifestyle of the phage was predicted using the PHACTS server (http://www.phantome.org/PHACTS/index.php)72. Antimicrobial resistance (AMR) genes and variants were predicted using the Resistance Gene Identifier (RGI) tool incorporated in the Comprehensive Antibiotic Resistance Database (CARD) server (https://card.mcmaster.ca/analyze/rgi)73.
For reconstruction of evolutionary history, complete genome sequences resulting from BLAST search and well-annotated reference sequences (RefSeq database74) were retrieved from the NCBI Virus database (https://www.ncbi.nlm.nih.gov/labs/virus/vssi/#/). Genomic or subgenomic sequences (DNA polymerase III/ terminase encoding genetic regions) were manipulated using BioEdit version 7.2.5 (https://bioedit.software.informer.com/download/)75. Multiple sequence alignments were done using the MAFFT online server (https://mafft.cbrc.jp/alignment/server/)76, allowing local adjustment of sequence orientation, during alignment. The Neighbor-Joining method was employed to infer evolutionary history. The Maximum Composite Likelihood (MCL) model was used to calculate evolutionary distances and bootstrap tests (1000 replicates) were performed to examine the reliability of clustering among the taxa. Evolutionary divergence (expressed in terms of base substitutions per site) between phylogenetically closely related sequences were estimated using the MCL model including 1st + 2nd + 3rd + Noncoding positions. Ambiguous positions were excluded during analyses. All the molecular evolutionary analyses were performed using the MEGAX program version 10.2.4 (https://www.megasoftware.net/)77.
Pairwise intergenomic similarities among the related phage genomes were calculated using the Virus Intergenomic Distance Calculator (VIRIDIC; http://rhea.icbm.uni-oldenburg.de/VIRIDIC/)78, which is based on the algorithm used by the ICTV (International Committee on Taxonomy of Viruses) to compute intergenomic similarities among Bacterial and Archaeal Viruses for taxonomic classification of phages. To elucidate the genetic relatedness of the phage DRL-P1 genome with other homologous phages, we used the progressiveMauve, version 2.4.0 (http://darlinglab.org/mauve/mauve.html)79 computer program, which employs progressive multiple genome alignment techniques to compare related genomes and effectively displays the relative location of locally colinear blocks (LCBs) among genomes, indicating genetic rearrangements, loss or gain, and segmental duplication of genetic regions.
To verify reticulate evolution, we reconstructed NeighborNet (NN) network tree using the SplitsTree4 computer program (version 4.14.6; https://uni-tuebingen.de/en/fakultaeten/mathematisch-naturwissenschaftliche-fakultaet/fachbereiche/informatik/lehrstuehle/algorithms-in-bioinformatics/software/splitstree/)37. Genetic differences were estimated using the Kimura-2 parameter algorithm implemented in the program. Parsimony uninformative sites and gaps were excluded from the analysis. To examine the probability of recombinations in the DRL-P1 genome, aligned complete genome datasets were analyzed through the Recombination Detection Program, an RDP4 computer program (version 4.95; http://web.cbio.uct.ac.za/~darren/rdp.html) set at default values and standard Bonferroni correction80. The RDP4 program incorporates RDP, GENECONV, BOOTSCAN, MAXCHI, CHIMAERA, SISCAN, 3SEQ, and PHYLPRO algorithms for analysis of recombination and breakpoints. Recombination events predicted by the program were verified by examination of the breakpoint plots and UPGMA phylogenetic trees generated by the program. Events predicted by at least three different algorithms and had adequate statistical support (P < 0.01) were considered as true events.
Sequence accession number
The genome sequence of DRL-P1 is available in the NCBI GenBank under accession number MN564818.
Fomites decontamination assay
For a demonstration of decontamination of fomites by the phage DRL-P1, in vitro assays were performed using contaminated glass coverslip as model fomites, following Jensen et al.43. Briefly, fresh P. aeruginosa culture was diluted to 106 CFU mL−1 and 10 µL of diluted culture was spread over the coverslip and dried for 30 min at room temperature inside a biosafety cabinet. Thereafter, 100 µL of phage lysate was added at MOI:1.0, 0.1, 0.01 & 0.001 and phage action was allowed for 45 min. Subsequently, the coverslip was placed in 500 µL of fresh TSB, vigorously vortexed for 10 s to dislodge the attached bacteria from the surfaces. A control treatment (MOI:0) was performed using sterile phage buffer instead of phage lysate. Cultures were serially diluted and plated on TSA agar and incubated overnight at 37 °C. Percent decontamination was calculated for each MOI by calculating percent reduction in the bacterial count in comparison to control.
Phage lytic activity in vitro
Phage kinetics was performed according to a previous study81 with minor modifications to study the in vitro lysis of bacteria through a change in absorbance of optical density. Briefly, 180 µL of bacterial culture in the log phase (105 CFU mL−1) was aliquoted into wells of a 96-well microtiter plate. 20 µL of bacteriophage suspensions were added to wells at different MOI (100, 10, 1, 0.1, 0.01, 0.001). Cetrimide broth without P. aeruginosa was used as a negative control, P. aeruginosa bacteria without phage was a positive control for the experiment. The microtiter plate was incubated at 37 °C inside a programmable real-time multi-mode microplate reader (Varioskan LUX, Thermo Scientific, USA) and the change in absorbance at OD600 was automatically recorded at 10 min intervals for 390 min. Instrument set-up, run, data acquisition, analyses, and graphical presentations were done using the accompanying software, SkanIt Research Edition version 5.0 (Thermo Scientific, USA; https://www.thermofisher.com/order/catalog/product/5187139#/5187139). Three independent trials were conducted to replicate the experiment.
Biofilm degradation assay
The biofilm degradation potential of DRL-P1 was determined using a previously published protocol with slight modification81. Briefly, aliquots (200 µL) of P. aeruginosa culture (1.8 × 10⁶ CFU mL−1) were incubated in 96-well polystyrene microtitre plates for 24 h at 37 °C. After incubation, planktonic cells were removed carefully and 200 µL aliquots of DRL-P1 diluted in cetrimide broth were added to each well at different MOIs (10, 1, 0.1, 0.01, and 0.001). Inoculated bacteria without phage were taken as a positive control whereas, cetrimide broth without bacteria was used as a negative control. The wells were stained at 12, 24, and 48 h of incubation. For staining biofilm, 1% w/v crystal violet (LOBA Chemie, India) was added and allowed to stain for 20 min at room temperature. Subsequently, the wells were washed thrice with PBS to remove the unbound dye, followed by the addition of 1% SDS (w/v) to dissolve the bound dye. The absorbance was determined at OD595 and data analyzed using microplate reader and accompanying software (Varioskan LUX & SkanIt). The percentage of biofilm clearance was calculated according to a previous paper82.
Lyophilization of phage lysate and encapsulation on alginate
Lyophilization and phage encapsulation on alginate was performed according to Gonzalez-Menendez et al.83 with slight modifications. Phage lysate (~ 109 PFU mL−1) was diluted (1:1 v/v) in 22% skimmed milk and 1.6 M sucrose and the diluted phage were allowed to freeze in 2 mL vials for 24 h at -80 °C. Bacterial cells in log phage were resuspended in skimmed milk lysate to make a final dilution of 11% (v/v) skimmed milk and 0.8 M sucrose. Samples were lyophilized in a laboratory freeze dryer (Labconco, Kansas City, USA). The lyophilized preparation was reconstituted with 2 mL sterile TM buffer and phage titer were calculated using the standard method.
Encapsulation of phage DRL-P1 within alginate beads was done following a previously described method, with minor modifications55. In brief, a phage-alginate mixture was prepared in 50 mM TM buffer (pH 7.5) containing ~ 108 PFU mL−1 of DRL-P1 and 2% (w/v) sodium alginate (Himedia, Mumbai, India). The mixture was stirred continuously for 1 h at 500 rpm at room temperature and subsequently added dropwise into 0.1 M CaCl2 solution to prepare phage-loaded alginate beads. The beads were incubated for 30 min at room temperature with gentle shaking to complete the cross-linking of calcium alginate bead walls. After another 30 min of incubation at room temperature, beads were gently washed with nuclease-free water and finally stored at 4 °C, until use.
Statistical analysis
The unpaired t-test was used for statistical analysis in this study. The level of significance was set at (P ≤ 0.05). GraphPad PRISM (Trial version 7.05; https://www.graphpad.com/scientific-software/prism/) (GraphPad Software, La Jolla, USA) for windows was used to analyze the data.
Supplementary Information
Acknowledgements
The authors thankfully acknowledge the support of the Defence Research & Development Organization (DRDO), Ministry of Defence for intramural research funds. We thank Dr. Vanlalhmuaka, Dr. YD Bhutia, and Ms. Shwetnisha, for their kind support with experiments, reagents, and instrument facilities. Sincere thanks are also due to Carol DeWeese Scott, Bio Project Curation Staff, and Jon, NCBI BioSample Submissions Staff, Bethesda, Maryland USA for their help with the submission of data to SRA. The authors also extend thanks to Dr. Narendra Kumar, and Dr. Juhie Joshi, DAVV, Life sciences, Indore for help with manuscript review.
Author contributions
S.S. and S.D. conceived the study, designed and optimized laboratory experiments, analyzed data, and wrote the manuscript. S.S. performed phage characterization experiments. S.D. performed analysis of the phage genome. S.C. critically reviewed the manuscript. M.D. performed TEM and analysis of phage particle morphology, J.S., M.G.V. & R.G. contributed in reagent preparation, laboratory equipment operation, and data collection. V.V. & S.K.D. supervised the research and critically reviewed the manuscript. All authors have read and approved the manuscript.
Competing interests
The authors declare no competing interests.
Footnotes
Publisher's note
Springer Nature remains neutral with regard to jurisdictional claims in published maps and institutional affiliations.
These authors contributed equally: Sonika Sharma and Sibnarayan Datta.
Contributor Information
Sonika Sharma, Email: ssharma@drl.drdo.in.
Sibnarayan Datta, Email: sndatta@drl.drdo.in.
Supplementary Information
The online version contains supplementary material available at 10.1038/s41598-021-98457-z.
References
- 1.Nathan C. Resisting antimicrobial resistance. Nat. Rev. Microbiol. 2020;18:259–260. doi: 10.1038/s41579-020-0348-5. [DOI] [PubMed] [Google Scholar]
- 2.Reygaert WC. An overview of the antimicrobial resistance mechanisms of bacteria. AIMS Microbiol. 2018;4:482–501. doi: 10.3934/microbiol.2018.3.482. [DOI] [PMC free article] [PubMed] [Google Scholar]
- 3.Bassetti M, et al. Antimicrobial resistance in the next 30 years, humankind, bugs, and drugs: A visionary approach. Intensive Care Med. 2017;43:1464–1475. doi: 10.1007/s00134-017-4878-x. [DOI] [PubMed] [Google Scholar]
- 4.De Oliveira DMP, et al. Antimicrobial resistance in ESKAPE pathogens. Clin. Microbiol. Rev. 2020;33:e00181-19. doi: 10.1128/CMR.00181-19. [DOI] [PMC free article] [PubMed] [Google Scholar]
- 5.WHO. WHO Publishes List of Bacteria for Which New Antibiotics are Urgently Needed. https://www.who.int/news/item/27-02-2017-who-publishes-list-of-bacteria-for-which-new-antibiotics-are-urgently-needed (2017).
- 6.DBT. http://dbtindia.gov.in/latest-announcement/indian-priority-pathogen-list-jointly-developed-dbt-and-who-india-office (2021).
- 7.Schooley RT, et al. Development and use of personalized bacteriophage-based therapeutic cocktails to treat a patient with a disseminated resistant Acinetobacter baumannii infection. Antimicrob. Agents Chemother. 2017;61:e00954–e1017. doi: 10.1128/AAC.00954-17. [DOI] [PMC free article] [PubMed] [Google Scholar]
- 8.Duplessis C, et al. Refractory Pseudomonas bacteremia in a 2-year-old sterilized by bacteriophage therapy. J. Pediatric. Infect. Dis. Soc. 2018;7:253–256. doi: 10.1093/jpids/pix056. [DOI] [PubMed] [Google Scholar]
- 9.Qin J, et al. Heterogeneous Klebsiella pneumoniae co-infections complicate personalized bacteriophage therapy. Front. Cell. Infect. Microbiol. 2021;10:608402. doi: 10.3389/fcimb.2020.608402. [DOI] [PMC free article] [PubMed] [Google Scholar]
- 10.Petrovic Fabijan A, et al. Westmead Bacteriophage Therapy Team. Safety of bacteriophage therapy in severe Staphylococcus aureus infection. Nat. Microbiol. 2020;5:465–472. doi: 10.1038/s41564-019-0634-z. [DOI] [PubMed] [Google Scholar]
- 11.Patil A, Banerji R, Kanojiya P, Koratkar S, Saroj S. Bacteriophages for ESKAPE: Role in pathogenicity and measures of control. Expert. Rev. Anti. Infect. Ther. 2021;19:845–865. doi: 10.1080/14787210.2021.1858800. [DOI] [PubMed] [Google Scholar]
- 12.El Haddad L, Harb CP, Gebara MA, Stibich MA, Chemaly RF. A Systematic and critical review of bacteriophage therapy against multidrug-resistant ESKAPE organisms in Humans. Clin. Infect. Dis. 2019;69:167–178. doi: 10.1093/cid/ciy947. [DOI] [PubMed] [Google Scholar]
- 13.Mulani MS, Kamble EE, Kumkar SN, Tawre MS, Pardesi KR. Emerging strategies to combat ESKAPE pathogens in the era of antimicrobial resistance: A Review. Front. Microbiol. 2019;10:539. doi: 10.3389/fmicb.2019.00539. [DOI] [PMC free article] [PubMed] [Google Scholar]
- 14.Diggle SP, Whiteley M. Microbe Profile: Pseudomonas aeruginosa: Opportunistic pathogen and lab rat. Microbiology (Reading) 2020;166:30–33. doi: 10.1099/mic.0.000860. [DOI] [PMC free article] [PubMed] [Google Scholar]
- 15.Ciofu O, Tolker-Nielsen T. Tolerance and resistance of Pseudomonas aeruginosa biofilms to antimicrobial agents: How P aeruginosa can escape antibiotics. Front. Microbiol. 2019;10:913. doi: 10.3389/fmicb.2019.00913. [DOI] [PMC free article] [PubMed] [Google Scholar]
- 16.Conrad JC, et al. Flagella and pili-mediated near-surface single-cell motility mechanisms in P. aeruginosa. Biophys. J. 2011;100:1608–1616. doi: 10.1016/j.bpj.2011.02.020. [DOI] [PMC free article] [PubMed] [Google Scholar]
- 17.Burrows LL. Pseudomonas aeruginosa twitching motility: Type IV pili in action. Annu. Rev. Microbiol. 2012;66:493–520. doi: 10.1146/annurev-micro-092611-150055. [DOI] [PubMed] [Google Scholar]
- 18.Ji M, et al. Bacteriophages in water pollution control: Advantages and limitations. Front. Environ. Sci. Eng. 2021;15:84. doi: 10.1007/s11783-020-1378-y. [DOI] [PMC free article] [PubMed] [Google Scholar]
- 19.Ahiwale S, et al. BVPaP-3, a T7-like lytic phage of Pseudomonas aeruginosa: Its isolation and characterisation. Curr. Microbiol. 2012;64:305–311. doi: 10.1007/s00284-011-0071-6. [DOI] [PubMed] [Google Scholar]
- 20.Pallavali RR, Degati VL, Lomada D, Reddy MC, Durbaka VRP. Isolation and in vitro evaluation of bacteriophages against MDR-bacterial isolates from septic wound infections. PLoS ONE. 2017;12:e0179245. doi: 10.1371/journal.pone.0179245. [DOI] [PMC free article] [PubMed] [Google Scholar]
- 21.Chhibber S, Bansal S, Kaur S. Disrupting the mixed-species biofilm of Klebsiella pneumoniae B5055 and Pseudomonas aeruginosa PAO using bacteriophages alone or in combination with xylitol. Microbiology. 2015;161:1369–1377. doi: 10.1099/mic.0.000104. [DOI] [PubMed] [Google Scholar]
- 22.Gupta P, Singh HS, Shukla VK, Nath G, Bhartiya SK. Bacteriophage therapy of chronic nonhealing wound: Clinical study. Int. J. Low. Extrem. Wounds. 2019;18:171–175. doi: 10.1177/1534734619835115. [DOI] [PubMed] [Google Scholar]
- 23.Khairnar K, Raut MP, Chandekar RH, Sanmukh SG, Paunikar WN. Novel bacteriophage therapy for controlling metallo-beta-lactamase producing Pseudomonas aeruginosa infection in catfish. BMC Vet. Res. 2013;9:264. doi: 10.1186/1746-6148-9-264. [DOI] [PMC free article] [PubMed] [Google Scholar]
- 24.Vinodkumar CS, Kalsurmath S, Neelagund YF. Utility of lytic bacteriophage in the treatment of multidrug-resistant Pseudomonas aeruginosa septicemia in mice. Indian. J. Pathol. Microbiol. 2008;51:360–366. doi: 10.4103/0377-4929.42511. [DOI] [PubMed] [Google Scholar]
- 25.Basu S, Agarwal M, Bhartiya SK, Nath G, Shukla VK. An In vivo wound model utilizing bacteriophage therapy of Pseudomonas aeruginosa biofilms. Ostomy. Wound. Manage. 2015;61:16–23. [PubMed] [Google Scholar]
- 26.Fernández L, Gutiérrez D, García P, Rodríguez A. The perfect bacteriophage for therapeutic applications: A quick guide. Antibiotics. 2019;8:126. doi: 10.3390/antibiotics8030126. [DOI] [PMC free article] [PubMed] [Google Scholar]
- 27.Batra P, Deo V, Mathur P, Gupta AK. Cotrimoxazole, a wonder drug in the era of multi resistance: Case report and review of literature. J. Lab. Physicians. 2017;9:210–213. doi: 10.4103/0974-2727.208261. [DOI] [PMC free article] [PubMed] [Google Scholar]
- 28.Motlagh AM, Bhattacharjee AS, Goel R. Biofilm control with natural and genetically-modified phages. World J. Microb. Biot. 2016;32:67. doi: 10.1007/s11274-016-2009-4. [DOI] [PubMed] [Google Scholar]
- 29.Chan BK, et al. Phage treatment of an aortic graft infected with Pseudomonas aeruginosa. Evol. Med. Public. Health. 2018;2018:60–66. doi: 10.1093/emph/eoy005. [DOI] [PMC free article] [PubMed] [Google Scholar]
- 30.Khawaldeh A, et al. Bacteriophage therapy for refractory Pseudomonas aeruginosa urinary tract infection. J. Med. Microbiol. 2011;60:1697–1700. doi: 10.1099/jmm.0.029744-0. [DOI] [PubMed] [Google Scholar]
- 31.Menon ND, et al. A Novel N4-Like Bacteriophage isolated from a wastewater source in South India with activity against several multidrug-resistant clinical Pseudomonas aeruginosa isolates. mSphere. 2021;6:e01215. doi: 10.1128/mSphere.01215-20. [DOI] [PMC free article] [PubMed] [Google Scholar]
- 32.Amarillas L, et al. Isolation and characterization of phiLLS, a novel phage with potential biocontrol agent against multidrug-resistant Escherichia coli. Front. Microbial. 2017;8:1355. doi: 10.3389/fmicb.2017.01355. [DOI] [PMC free article] [PubMed] [Google Scholar]
- 33.Yazdi M, Bouzari M, Ghaemi EA. Isolation and characterization of a lytic bacteriophage (vB_PmiS-TH) and its application in combination with ampicillin against planktonic and biofilm forms of Proteus mirabilis isolated from urinary tract infection. J. Mol. Microbiol. Biotechnol. 2018;28:37–46. doi: 10.1159/000487137. [DOI] [PubMed] [Google Scholar]
- 34.Hyman P. Phages for phage therapy: Isolation, characterization, and host range breadth. Pharmaceuticals. 2019;12:35. doi: 10.3390/ph12010035. [DOI] [PMC free article] [PubMed] [Google Scholar]
- 35.Jassim SA, Limoges RG, El-Cheikh H. Bacteriophage biocontrol in wastewater treatment. World. J. Microbiol. Biotechnol. 2016;32:70. doi: 10.1007/s11274-016-2028-1. [DOI] [PubMed] [Google Scholar]
- 36.Pbunavirus. https://viralzone.expasy.org/2818?outline=all_by_species.
- 37.Huson DH, Bryant D. Application of phylogenetic networks in evolutionary studies. Mol. Biol. Evol. 2006;23:254–267. doi: 10.1093/molbev/msj030. [DOI] [PubMed] [Google Scholar]
- 38.Hatfull GF, Hendrix RW. Bacteriophages and their genomes. Curr. Opin. Virol. 2011;1:298–303. doi: 10.1016/j.coviro.2011.06.009. [DOI] [PMC free article] [PubMed] [Google Scholar]
- 39.O'May C, Tufenkji N. The swarming motility of Pseudomonas aeruginosa is blocked by cranberry pro anthocyanidins and other tannin-containing materials. Appl. Environ. Microbiol. 2011;77:3061–3067. doi: 10.1128/AEM.02677-10. [DOI] [PMC free article] [PubMed] [Google Scholar]
- 40.Murray TS, Kazmierczak BI. Pseudomonas aeruginosa exhibits sliding motility in the absence of type IV pili and flagella. J. Bacteriol. 2008;190:2700–2708. doi: 10.1128/JB.01620-07. [DOI] [PMC free article] [PubMed] [Google Scholar]
- 41.Pletzer D, et al. Surfing motility is a complex adaptation dependent on the stringent stress response in Pseudomonas aeruginosa LESB58. PLoS. Pathog. 2020;16:e1008444. doi: 10.1371/journal.ppat.1008444. [DOI] [PMC free article] [PubMed] [Google Scholar]
- 42.Defez C, et al. Risk factors for multidrug-resistant Pseudomonas aeruginosa nosocomial infection. J. Hosp. Infect. 2004;57:209–216. doi: 10.1016/j.jhin.2004.03.022. [DOI] [PubMed] [Google Scholar]
- 43.Jensen KC, et al. Isolation and host range of bacteriophage with lytic activity against methicillin-resistant Staphylococcus aureus and potential use as a fomites decontaminant. PLoS ONE. 2015;10:e0131714. doi: 10.1371/journal.pone.0131714. [DOI] [PMC free article] [PubMed] [Google Scholar]
- 44.Rashid MH, et al. A Yersinia pestis-specific, lytic phage preparation significantly reduces viable Y. pestis on various hard surfaces experimentally contaminated with the bacterium. Bacteriophage. 2012;2:168–177. doi: 10.4161/bact.22240. [DOI] [PMC free article] [PubMed] [Google Scholar]
- 45.Kay MK, Erwin TC, McLean RJ, Aron GM. Bacteriophage ecology in Escherichia coli and Pseudomonas aeruginosa mixed-biofilm communities. Appl. Environ. Microbiol. 2011;77:821–829. doi: 10.1128/AEM.01797-10. [DOI] [PMC free article] [PubMed] [Google Scholar]
- 46.Danis-Wlodarczyk K, et al. A proposed integrated approach for the preclinical evaluation of phage therapy in Pseudomonas infections. Sci. Rep. 2016;6:1–13. doi: 10.1038/srep28115. [DOI] [PMC free article] [PubMed] [Google Scholar]
- 47.Fu W, et al. Bacteriophage cocktail for the prevention of biofilm formation by Pseudomonas aeruginosa on catheters in an in vitro model system. Antimicrob. Agents Chemother. 2010;54:397–404. doi: 10.1128/AAC.00669-09. [DOI] [PMC free article] [PubMed] [Google Scholar]
- 48.Chegini Z, et al. Bacteriophage therapy against Pseudomonas aeruginosa biofilms: A review. Ann. Clin. Microbiol. Antimicrob. 2020;19:45. doi: 10.1186/s12941-020-00389-5. [DOI] [PMC free article] [PubMed] [Google Scholar]
- 49.Oliveira VC, et al. Identification and characterization of new bacteriophages to control multidrug-resistant Pseudomonas aeruginosa biofilm on endotracheal tubes. Front. Microbiol. 2020;11:580779. doi: 10.3389/fmicb.2020.580779. [DOI] [PMC free article] [PubMed] [Google Scholar]
- 50.Manohar P, Ramesh N. Improved lyophilization conditions for long-term storage of bacteriophages. Sci. Rep. 2019;9:1–10. doi: 10.1038/s41598-019-51742-4. [DOI] [PMC free article] [PubMed] [Google Scholar]
- 51.Gondil VS, Chhibber S. Bacteriophage and endolysin encapsulation systems: A promising strategy to improve therapeutic outcomes. Front. Pharmacol. 2021;12:675440. doi: 10.3389/fphar.2021.675440. [DOI] [PMC free article] [PubMed] [Google Scholar]
- 52.Colom J, et al. Microencapsulation with alginate/CaCO3: A strategy for improved phage therapy. Sci. Rep. 2017;7:41441. doi: 10.1038/srep41441. [DOI] [PMC free article] [PubMed] [Google Scholar]
- 53.Golec P, et al. A reliable method for storage of tailed phages. J. Microbiol. Methods. 2011;84:486–489. doi: 10.1016/j.mimet.2011.01.007. [DOI] [PubMed] [Google Scholar]
- 54.Liang L, et al. Development of a lyophilization process for campylobacter bacteriophage storage and transport. Microorganisms. 2020;8:282. doi: 10.3390/microorganisms8020282. [DOI] [PMC free article] [PubMed] [Google Scholar]
- 55.Moghtader F, Eğri S, Piskin E. Phages in modified alginate beads. Artif. Cells Nanomed. Biotechnol. 2017;45:357–363. doi: 10.3109/21691401.2016.1153485. [DOI] [PubMed] [Google Scholar]
- 56.Abdelsattar AS, Abdelrahman F, Dawoud A, Connerton IF, El-Shibiny A. Encapsulation of E. coli phage ZCEC5 in chitosan-alginate beads as a delivery system in phage therapy. AMB Express. 2019;9:87. doi: 10.1186/s13568-019-0810-9. [DOI] [PMC free article] [PubMed] [Google Scholar]
- 57.Rossitto M, Fiscarelli EV, Rosati P. Challenges and promises for planning future clinical research into bacteriophage therapy against Pseudomonas aeruginosa in cystic fibrosis. An argumentative review. Front. Microbiol. 2018;9:775. doi: 10.3389/fmicb.2018.00775. [DOI] [PMC free article] [PubMed] [Google Scholar]
- 58.Shiley JR, Comfort KK, Robinson JB. Immunogenicity and antimicrobial effectiveness of Pseudomonas aeruginosa specific bacteriophage in a human lung in vitro model. Appl. Microbiol. Biotechnol. 2017;101:7977–7985. doi: 10.1007/s00253-017-8504-1. [DOI] [PubMed] [Google Scholar]
- 59.Krylov V, et al. Modular approach to select bacteriophages targeting Pseudomonas aeruginosa for their application to children suffering with cystic fibrosis. Front. Microbiol. 2016;7:1631. doi: 10.3389/fmicb.2016.01631. [DOI] [PMC free article] [PubMed] [Google Scholar]
- 60.Sambrook JR, Russell DW. In: Molecular Cloning, A Laboratory Manual. Sambrook JR, Russell DW, editors. Cold Spring Harbor Laboratory Press; 2001. pp. 1–117. [Google Scholar]
- 61.Schneider C, Rasband W, Eliceiri K. NIH Image to ImageJ: 25 years of image analysis. Nat. Methods. 2012;9:671–675. doi: 10.1038/nmeth.2089. [DOI] [PMC free article] [PubMed] [Google Scholar]
- 62.Wayne PA. Performance Standards for Antimicrobial Susceptibility Testing; Twenty-Fourth Informational Supplement. CLSI document M100–S24. Clinical and Laboratory Standards Institute; 2014. [Google Scholar]
- 63.Kim SG, et al. Isolation and characterisation of pVa-21, a giant bacteriophage with anti-biofilm potential against Vibrio alginolyticus. Sci. Rep. 2019;9:6284. doi: 10.1038/s41598-019-42681-1. [DOI] [PMC free article] [PubMed] [Google Scholar]
- 64.Litt PK, Jaroni D. Isolation and physio-morphological characterization of Escherichia coli O157: H7-infecting bacteriophages recovered from beef cattle operations. Int. J. Microbiol. 2017;2017:7013236. doi: 10.1155/2017/7013236. [DOI] [PMC free article] [PubMed] [Google Scholar]
- 65.Hunt M, et al. IVA: Accurate de novo assembly of RNA virus genomes. J. Bioinform. 2015;31:2374–2376. doi: 10.1093/bioinformatics/btv120. [DOI] [PMC free article] [PubMed] [Google Scholar]
- 66.Besemer J, Lomsadze A, Borodovsky M. GeneMarks: A self-training method for prediction of gene starts in microbial genomes. Implications for finding sequence motifs in regulatory regions. Nucleic Acids Res. 2001;29:2607–2618. doi: 10.1093/nar/29.12.2607. [DOI] [PMC free article] [PubMed] [Google Scholar]
- 67.Arndt D, et al. PHASTER: A better, faster version of the PHAST phage search tool. Nucleic Acids Res. 2016;44:W16–W21. doi: 10.1093/nar/gkw387. [DOI] [PMC free article] [PubMed] [Google Scholar]
- 68.Altschul SF, et al. Basic local alignment search tool. J Mol. Biol. 1990;215:403–410. doi: 10.1016/S0022-2836(05)80360-2. [DOI] [PubMed] [Google Scholar]
- 69.Chan PP, Lowe TM. tRNAscan-SE: Searching for tRNA genes in genomic sequences. Methods Mol. Biol. 2019;1962:1–14. doi: 10.1007/978-1-4939-9173-0_1. [DOI] [PMC free article] [PubMed] [Google Scholar]
- 70.Reese MG. Application of a time-delay neural network to promoter annotation in the Drosophila melanogaster genome. Comput. Chem. 2001;26:51–56. doi: 10.1016/S0097-8485(01)00099-7. [DOI] [PubMed] [Google Scholar]
- 71.Naville M, Ghuillot-Gaudeffroy A, Marchais A, Gautheret D. ARNold: A web tool for the prediction of Rho-independent transcription terminators. RNA Biol. 2011;8:11–13. doi: 10.4161/rna.8.1.13346. [DOI] [PubMed] [Google Scholar]
- 72.McNair K, Bailey BA, Edwards RA. PHACTS, a computational approach to classifying the lifestyle of phages. J. Bioinform. 2012;28:614–618. doi: 10.1093/bioinformatics/bts014. [DOI] [PMC free article] [PubMed] [Google Scholar]
- 73.Alcock BP, et al. CARD 2020: Antibiotic resistome surveillance with the comprehensive antibiotic resistance database. Nucleic Acids Res. 2020;48:D517–D525. doi: 10.1093/nar/gkz1136. [DOI] [PMC free article] [PubMed] [Google Scholar]
- 74.Pruitt KD, Tatusova T, Maglott DR. NCBI reference sequences (RefSeq): A curated non-redundant sequence database of genomes, transcripts and proteins. Nucleic Acids Res. 2007;35:D61–D65. doi: 10.1093/nar/gkl842. [DOI] [PMC free article] [PubMed] [Google Scholar]
- 75.Hall TA. BioEdit: A user-friendly biological sequence alignment editor and analysis program for Windows 95/98/NT. Nucleic Acids Symp. Ser. 1999;41:95–98. [Google Scholar]
- 76.Katoh K, Misawa K, Kuma KI, Miyata T. MAFFT: A novel method for rapid multiple sequence alignment based on fast Fourier transform. Nucleic Acids Res. 2002;30:3059–3066. doi: 10.1093/nar/gkf436. [DOI] [PMC free article] [PubMed] [Google Scholar]
- 77.Kumar S, Stecher G, Li M, Knyaz C, Tamura K. MEGA X: Molecular evolutionary genetics analysis across computing platforms. Mol. Biol. Evol. 2018;35:1547–1549. doi: 10.1093/molbev/msy096. [DOI] [PMC free article] [PubMed] [Google Scholar]
- 78.Moraru C, Varsani A, Kropinski AM. VIRIDIC: A novel tool to calculate the intergenomic similarities of prokaryote-infecting viruses. Viruses. 2020;12:1268. doi: 10.3390/v12111268. [DOI] [PMC free article] [PubMed] [Google Scholar]
- 79.Darling AE, Mau B, Perna NT. progressiveMauve: Multiple genome alignment with gene gain Loss and rearrangement. PLoS ONE. 2010;5:e11147. doi: 10.1371/journal.pone.0011147. [DOI] [PMC free article] [PubMed] [Google Scholar]
- 80.Martin DP, Murrell B, Golden M, Khoosal A, Muhire B. RDP4: Detection and analysis of recombination patterns in virus genomes. Virus Evol. 2015;1:vev003. doi: 10.1093/ve/vev003. [DOI] [PMC free article] [PubMed] [Google Scholar]
- 81.Horváth M, et al. Identification of a newly isolated lytic bacteriophage against K24 capsular type, carbapenem resistant Klebsiella pneumoniae isolates. Sci. Rep. 2020;10:5891. doi: 10.1038/s41598-020-62691-8. [DOI] [PMC free article] [PubMed] [Google Scholar]
- 82.Liu J, Gao S, Dong Y, Lu C, Liu Y. Isolation and characterization of bacteriophages against virulent Aeromonas hydrophila. BMC Microbiol. 2020;20:141. doi: 10.1186/s12866-020-01811-w. [DOI] [PMC free article] [PubMed] [Google Scholar]
- 83.Gonzalez-Menendez E, et al. Comparative analysis of different preservation techniques for the storage of Staphylococcus phages aimed for the industrial development of phage-based antimicrobial products. PLoS ONE. 2018;13:e0205728. doi: 10.1371/journal.pone.0205728. [DOI] [PMC free article] [PubMed] [Google Scholar]
Associated Data
This section collects any data citations, data availability statements, or supplementary materials included in this article.