

Summary
Hematopoietic stem and progenitor cells (HSPCs) reside in the bone marrow and supply blood cells. Efficient methods for isolation of HSPCs are required. Here, we present protocols for the isolation of human and murine HSPCs using manual and FACS-assisted techniques. Isolated HSPCs can be used for downstream applications, including colony forming unit assays and DNA damage and repair assays.
For complete details on the use and execution of this protocol, please refer to Rodríguez et al. (2021a) and (2021b).
Subject areas: Cell Biology, Cell isolation, Flow Cytometry/Mass Cytometry, Cell-based Assays, Genetics, Microscopy, Stem Cells
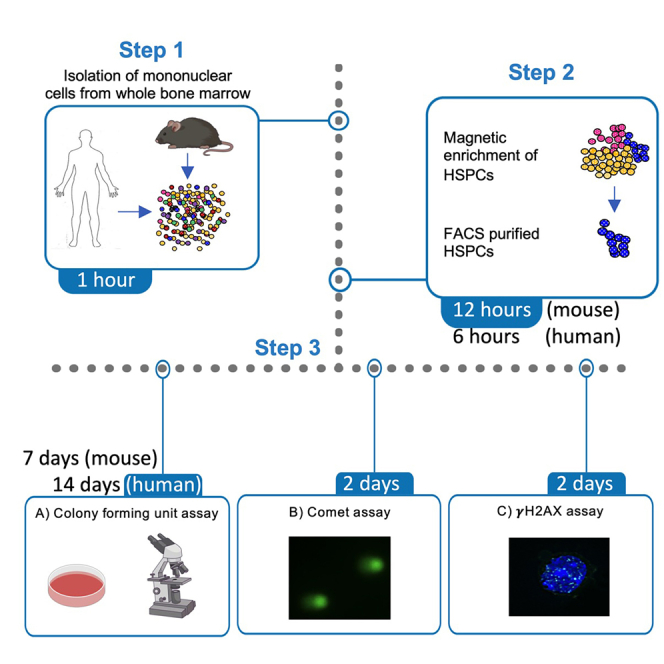
Graphical abstract
Highlights
-
•
Detailed protocol for isolating human and mouse hematopoietic stem cells
-
•
Procedures for plating and quantification of hematopoietic colony forming unit assay
-
•
Protocol for assessing DNA damage using the comet assay in hematopoietic stem cells
-
•
Protocol for assessing DNA damage using immunofluorescence in hematopoietic stem cells
Hematopoietic stem and progenitor cells (HSPCs) reside in the bone marrow and supply blood cells. Efficient methods for isolation of HSPCs are required. Here, we present protocols for the isolation of human and murine HSPCs using manual and FACS-assisted techniques. Isolated HSPCs can be used for downstream applications, including colony forming unit assays and DNA damage and repair assays.
Before you begin
Hematopoietic stem and progenitor cells (HSPC) are multipotent cells that reside within the bone marrow niche. HSPCs are responsible for the production of blood cells during the lifespan of an individual; however, they are limited in number and remain in a quiescent state. To achieve the blood cell requirements of an organism, the HSPCs must enter the cell cycle and produce progenitors that will complete multiple rounds of division, as well as produce the precursors that will mature into functional cells. However, it is critical that the HSPC pool is maintained to avoid exhaustion (Seita and Weissmann, 2010).
Multiple stimuli can modify the behavior and size of the HSPC pool. For example, infection and inflammatory stimuli can push HSPCs out of quiescence and exhaust the HSPC pool (Lin et al., 2014; Walter et al., 2015; Matatall et al., 2016). HSPCs are also highly sensitive to DNA damaging agents such as those used for chemotherapy (Tang et al., 2019). HSPCs are highly fragile in inherited bone marrow failure syndromes: genetic disorders in which patients develop childhood-onset aplastic anemia due to attrition of the HSPC pool. Patients with inherited bone marrow failure syndromes must be monitored for the emergence of hematopoietic clones that can transform into myelodysplastic syndrome and acute myeloid leukemia. The most common inherited bone marrow failure syndromes are Fanconi anemia, dyskeratosis congenita, Blackfan-Diamond anemia and Schwachman-Diamond syndrome (Shimano et al., 2021). Mouse models are widely used for the study of bone marrow biology, and some genetic models exist for the study of, for example, Fanconi anemia, including Fanca−/−, Fancg−/− and Fancd2−/− mice. Fanconi anemia mouse models allow for the study of its DNA repair defect and how the HSPCs respond to DNA-damaging stimuli and chemical agents (Parmar et al., 2009).
In this work, we describe methods for the efficient manual and FACS-assisted isolation of HSPCs from human and mouse samples using surface markers, which we have successfully used for the study of HSPCs from patients with Fanconi anemia and Fanconi anemia mouse models, which are known to have a reduced HSPCs number. Manual enrichment allows for the rapid isolation of the population of interest; however, we also present a more detailed FACS purification protocol using the LSK and SLAM markers in mouse, if a pure population is sought (Kiel et al., 2005; Yilmaz et al., 2006). We also present standardized methods for performing downstream DNA damage and repair assays with the isolated cells. The comet assay allows for the detection of DNA damage in cells using an electrophoretic field (Olive and Banáth, 2006), whereas detection of γH2AX foci by immunofluorescence allows quantifying DNA damage, usually double strand breaks (Zhang et al., 2016). We present optimized protocols to efficiently perform these assays with small cell amounts as input.
For mouse studies, 2–6-month-old C57BL/6 Fancd2−/−and WT mice were used (Parmar et al., 2009). Housing and handling of all mice, as well as experimental procedures were approved by the Animal Care and Use Committee of the Dana Farber Cancer Institute and performed according to its guidelines. Mice were euthanized by CO2 asphyxiation at the experimental time point. For human samples, written informed consent was received from participants. Use of patients’ samples was approved by the ethics and research committees from Dana Farber Cancer Institute and Instituto Mexicano del Seguro Social. Healthy bone marrow was purchased from Lonza.
Key resources table
| REAGENT or RESOURCE | SOURCE | IDENTIFIER |
|---|---|---|
| Antibodies | ||
| Biotin mouse lineage panel, diluted 1:40∗ | BD Biosciences | Cat# 559971 RRID: AB_10053179 |
| PE streptavidin; diluted 1:100 | BD Biosciences | Cat# 554061 RRID: 554061 |
| PE-Cy7 rat anti-mouse Ly-6A/E (Sca1) (clone D7); diluted 1:40∗ | BD Biosciences | Cat# 558162; RRID:AB_647253 |
| APC anti-mouse CD117 (c-kit) (clone ACK2); diluted 1:40∗ | BioLegend | Cat# 135108; RRID:AB_2028407 |
| Pacific Blue anti-mouse CD150 (clone TC15-12F12.2); diluted 1:40∗ | BioLegend | Cat# 115924; RRID:AB_2270307 |
| APC-Cy7 anti-mouse CD48 (clone HM48-1); diluted 1:40∗ | Thermo Fisher Scientific | Cat# 47-0481-82; RRID:AB_2573962 |
| Rabbit anti-human/mouse phospho-histone H2A.X (Ser139) (20E3); diluted 1:1000 | Cell Signaling Technology | Cat# 9718S; RRID:AB_2118009 |
| Donkey anti-Rabbit IgG, Alexa Fluor 488; diluted 1:500 | Thermo Fisher Scientific | Cat# A21206; RRID:AB_2535792 |
| Biological samples | ||
| Human whole bone marrow and blood from healthy donors | Lonza | Cat# 1M-105 |
| Chemicals, peptides, and recombinant proteins | ||
| FLT3-ligand, human | PeproTech | Cat# 300-19 |
| IL-6, human | PeproTech | Cat# 200-06 |
| SCF, human | PeproTech | Cat# 300-07 |
| TPO, human | PeproTech | Cat# 300-18 |
| SCF, mouse∗ | PeproTech | Cat# 250-03-10UG |
| TPO, mouse∗ | PeproTech | Cat# 315-14-10UG |
| Mitomycin C | Sigma-Aldrich | Cat# M0503 CAS:50-07-7 |
| Triton X-100 | Sigma-Aldrich | Cat# T8787 CAS:9002-93-1 |
| Sodium hydroxide (NaOH) pellets | VWR Life Science | Cat#0583-500G CAS: 1310-73-2 |
| Bovine serum albumin (BSA) | Sigma-Aldrich | Cat# A9647 CAS: 9048-46-8 |
| Ammonium chloride solution | STEMCELL Technologies | Cat# 07800 CAS: 12125-02-9 |
| EDTA (0.5 M) pH 8 | Boston BioProducts | Cat# BM150 CAS: 6381-92-6 |
| Methanol | Fisher Scientific | Cat# A412-4 CAS: 67-56-1 |
| 70% Ethanol | Fisher Scientific | Cat# BP82011 CAS: 64-17-5 |
| 16% Paraformaldehyde (formaldehyde) aqueous solution | Electron Microscopy Sciences | Cat# 15710 CAS: 50-00-0 |
| Experimental models: organisms/strains | ||
| Fancd2-/- and WT mice. C57BL/6 background, 2–6-month-old. Any gender. | Parmar et al., 2009 | N/A |
| Software and algorithms | ||
| FlowJo, version 10.5.3 | N/A | https://www.flowjo.com/ |
| OpenComet plugin | N/A | http://www.cometbio.org/ |
| ImageJ | N/A | http://fiji.sc |
| Other | ||
| EasySep Kit, human | STEMCELL Technologies | Cat# 19356 |
| EasySep Buffer | STEMCELL Technologies | Cat# 20144 |
| EasySep Magnet | STEMCELL Technologies | Cat# 18000 |
| MidiMACS Separator | Miltenyi | Cat# 130-042-302 |
| MACS MultiStand | Miltenyi | Cat# 130-042-303 |
| CD34 MicroBead Kit, human | Miltenyi | Cat# 130-046-702 |
| FcR Blocking Reagent, human | Miltenyi | Cat# 130-059-901 |
| Lineage Cell Depletion Kit, mouse∗ | Miltenyi | Cat# 130-090-858 |
| LS Column Miltenyi | Miltenyi | Cat# 130-042-401 |
| MS Column Miltenyi | Miltenyi | Cat# 130-042-201 |
| StemSpan SFEM II | STEMCELL Technologies | Cat# 09655 |
| MethoCult H4434 Classic | STEMCELL Technologies | Cat# 04434 |
| Methocult GF M3434 methylcellulose∗ | STEMCELL Technologies | Cat# 03444 |
| PBS pH 7.4 | Gibco | Cat# 100-10-023 |
| SYBR-Green dye | Invitrogen | Cat# S7567 |
| Fetal bovine serum (FBS) | Sigma-Aldrich | Cat# F2442 |
| Hanks balanced salt solution (HBSS) | Lonza | Cat# 10-547F |
| HEPES Buffer | Fisher Scientific | Cat# BP299-100 |
| Penicillin-streptomycin (PenStrep) | Gibco | Cat# 15140-122 |
| L-Glutamine | Gibco | Cat# 25030081 |
| 70 μm Cell strainer | Fisher Scientific | Cat# 087712 |
| 10 mL Eccentric tip syringe | BD | Cat# 305482 |
| 18G 1 Inch needle | BD | Cat# 305195 |
| 500 mL Bottle Top Vacuum Filter, 0.45 μm | Corning | Cat# 430514 |
| CometAssay Single Cell Gel Electrophoresis Assay Kit | Trevigen | Cat# 4250-050-K |
| Normal goat serum (10%) | Life Technologies | Cat# 50062Z |
| SuperFrost Plus Slides | Fisher Scientific | Cat# 12-550-15 |
| ProLong Gold Antifade Mountant with DAPI | Life Technologies | Cat# P36941 |
| Double Cytofunnel. Disposable sample chambers with white filter cards | Thermo Scientific | Cat# 5991039 |
| Round-Bottom Polystyrene Test Tubes with Cell Strainer Snap Cap, 5mL | Fisher Scientific | Cat# 08-771-23 |
| SmartDish | STEMCELL Technologies | Cat# 27370 |
| Non-tissue culture treated plate, 12 well flat bottom | Falcon | Cat# 351143 |
| STEMvision | STEMCELL Technologies | Cat# 22000 |
| Cytospin 3 | Shandon Scientific | Cat# 74000102 |
∗ Indicates reagents exclusive for mouse experiments
Materials and equipment
HBSS++
| Reagent | Final concentration | Amount |
|---|---|---|
| Sterile filtered FBS | 10% | 50 mL |
| HEPES (1 M) | 25 mM | 12.5 mL |
| PenStrep (10,000 U/mL) | 1% | 5 mL |
| HBSS | 1× | 432.5 mL |
| Total | n/a | 500 mL |
Prepare under sterile conditions, store at 4°C; maximum storage time 1 month.
Column buffer
| Reagent | Final concentration | Amount |
|---|---|---|
| EDTA (0.5 M) | 2 mM | 2 mL |
| BSA | 0.5% | 2.5 g |
| PBS | 1× | 500 mL |
| Total | n/a | 502 mL |
Stir on a magnetic stir plate until completely dissolved and then filter through a 0.45 μm filter. Keep sterile.
Store at 4°C; maximum storage 1 month.
Cell collection media (for human HSPCs)
Prepare stock solutions of SCF, Flt3-ligand, TPO and IL-6 in StemSpan SFEM II media. Store aliquots at −20°C.
| Reagent | Final concentration | Amount |
|---|---|---|
| StemSpan SFEM II | 1× | 848 μL |
| SCF (2 μg/mL) | 100 ng/mL | 50 μL |
| Flt3-ligand (2 μg/mL) | 100 ng/mL | 50 μL |
| TPO (2 μg/mL) | 100 ng/mL | 50 μL |
| IL-6 (10 μg/mL) | 20 ng/mL | 2 μL |
| Total | n/a | 1 mL |
Prepare fresh each time before use.
Cell collection media (for mouse HSPCs)
| Reagent | Final concentration | Amount |
|---|---|---|
| StemSpan SFEM II | 1× | 890 μL |
| SCF (2 μg/mL) | 100 ng/mL | 50 μL |
| TPO (2 μg/mL) | 100 ng/mL | 50 μL |
| L-Glutamine | 1% | 10 μL |
| Total | n/a | 1 mL |
Prepare fresh each time before use.
Immunofluorescence blocking buffer
| Reagent | Final concentration | Amount |
|---|---|---|
| 10% Triton X-100 diluted in PBS; filtered | 0.3% | 240 μL |
| 10% Normal Goat Serum | 10% | 8 mL |
| Total | n/a | 8.240 mL |
Prepare fresh each time before use.
IF buffer
| Reagent | Final concentration | Amount |
|---|---|---|
| 1% BSA diluted in PBS; filtered | 1% | 9 mL |
| 10% Triton X-100 diluted in PBS; filtered | 0.3% | 270 μL |
| Total | n/a | 9.270 mL |
Store at 4°C for a maximum of 48 h.
Alkaline Unwinding Solution, pH >13
| Reagent | Final concentration | Amount |
|---|---|---|
| NaOH Pellets | 200 mM | 0.4 g |
| 200 mM EDTA | 1 mM | 250 μL |
| Distilled H2O | 1× | 49.75 mL |
| Total | n/a | 50 mL |
Prepare fresh each time before use. Allow the solution to cool down on the benchtop.
CRITICAL: This solution will warm up during preparation. Handle with care. Wear heat-resistant gloves and eye protection while handling.
Alkaline Electrophoresis Solution, pH >13
| Reagent | Final concentration | Amount |
|---|---|---|
| NaOH Pellets | 200 mM | 8 g |
| 500 mM EDTA, pH 8 | 1 mM | 2 mL |
| Distilled H2O | Z | 1 L |
| Total | n/a | 1 L |
Prepare fresh each time. Cool to 4°C before use.
Step-by-step method details
Here, we describe protocols for the isolation of human and murine HSPCs. Multiple assays can be started simultaneously with the isolated HSPCs. We present protocols for downstream applications using the isolated HSPCs, primarily focused on assays for CFU capacity and assessment of DNA damage.
Isolation of human HSPCs
Timing: 6 h
This protocol is optimized for the efficient isolation of Lin- cells from as little as 2 mL of bone marrow. The Lin- population is enriched in CD34+ cells. Using this protocol, we were able to efficiently isolate Lin- cells from patients with Fanconi anemia, a bone marrow failure syndrome in which HSPCs are scarce. Using this protocol, we typically obtain 6.0×10⁵ - 1.0×10⁶ Lin- cells per mL of healthy bone marrow, or 1.0×10⁵ - 2.0×10⁵ Lin- cells per mL of Fanconi anemia bone marrow (Figure 1A).
Note: All steps should be performed under sterile conditions.
-
1.Plasma removal:
-
a.Centrifuge the whole bone marrow sample in a 15 mL conical tube at 2000 × g 4°C for 20 min. After centrifugation, remove the plasma with a pipette without disturbing the cells.
-
b.Plasma can be aliquoted and stored long-term at −80°C if cytokine analysis of the bone marrow is needed.
-
a.
-
2.Red blood cell lysis and isolation of mononuclear cells (MNCs):
-
a.Take 2 mL of bone marrow (after plasma removal) in a 50 mL tube and add 8 mL of ammonium chloride solution. Mix well with a pipette and then incubate for 10–15 min on ice.
-
i.Generally, the volume of ammonium chloride required is approximately 4× the volume of the bone marrow.
-
i.
-
b.Wash by directly adding 40 mL of 1× PBS and centrifuge at 500 × g for 5 min.
-
c.Aspirate supernatant. Repeat the above steps until the cell pellet appears white or with very few red cells (usually 2 more times) by adding 4 mL of ammonium chloride directly to the cells and incubating for 5–10 min on ice. Wash every incubation of ammonium chloride by directly adding 40 mL of 1× PBS and centrifuge at 500 × g for 5 min.
-
d.Aspirate the supernatant.
-
a.
-
3.Enrichment of Lin- cells (we typically obtain 6.0×10⁵–1.0×10⁶ Lin- cells per mL of healthy bone marrow or 1.0×10⁵–2.0×10⁵ Lin- cells per mL of Fanconi anemia bone marrow):
-
a.Resuspend the MNC pellet in 1 mL EasySep Buffer and transfer to a 5 mL FACS tube.
-
b.Add 50 μL of human progenitor cell enrichment cocktail (included in the EasySep kit) for every 1 mL of cell suspension. Mix with a pipette and incubate for 15 min at 18°C–21°C.
-
c.Add 50 μL of magnetic particles (included in the EasySep kit) for every 1 mL of cell suspension. Mix with a pipette and incubate for 15 min at 18°C–21°C (no rotation/rocking is needed).
-
d.Add 2.5 mL EasySep Buffer and place the tube in the EasySep Magnet. Incubate for 15 min at 18°C–21°C (no rotation/rocking is needed).
-
e.Keep the tube in the magnet and pour out the supernatant into a new tube (the supernatant contains the Lin- cells) (Figure 1A).
-
a.
-
4.
The cells that do not bind to the magnetic beads are Lin- cells; these cells are ready for further analyses.
Alternatives: Instead of the Lin- enrichment kit, a CD34+ MicroBead kit with FcR Blocking reagent can be used.
Figure 1.

Strategies for enrichment of HSPC
(A) Human Lin- cells can be enriched using a magnetic stand. Left. Cells are incubated with the progenitor cell enrichment cocktail followed by incubation with magnetic particles and incubation in the magnetic stand. Right. Lin+ cells bound by the antibodies of the enrichment cocktail and by the magnetic particles are attracted to the tube wall by the magnetic field. Lin- cells remain in suspension and can be recovered by simply pouring off the liquid into a new tube. The Lin+ cells remain in the original tube.
(B) Mouse and human HSPCs can be enriched using columns for magnetic cell separation. Cells are incubated with cell enrichment cocktail followed by incubation with magnetic beads. Left. Enrichment of mouse Lin- cells is performed with the LS Miltenyi columns; enrichment of human CD34+ cells is performed with the MS Miltenyi columns. The column is mounted into the MidiMACS separator on the MACS MultiStand and prepared by adding column buffer. Center. The cell suspension is added to the top of the column. Right. The cell suspension is left to flow through the column via gravity flow. Cells bound by the magnetic particles remain bound to the column in the magnetic field, whereas unbound cells are recovered into a clean tube.
(C) Mouse LT-HSCs can be purified from the enriched population of Lin- cells using FACS and a 5-flurochrome strategy based on the SLAM markers. Left. Detection of Lin- cells. Center. LSK cells within the Lin- population are recognized by being c-Kit+ Sca+. Right. LT-HSCs within the LSK population are recognized by being CD150+ CD48-
Isolation of mouse HSPCs
This protocol is optimized for the efficient isolation of HSPCs from wild type mice and mice with deficiency of Fanconi anemia genes. This protocol is also useful for the isolation of HSPCs after stress conditions that induce bone marrow failure in Fanconi anemia mice. We first describe a manual enrichment of Lin- cells using a column system, followed by staining of the Lin- fraction for FACS-mediated purification of LSK and LT-HSCs using the SLAM markers (Kiel et al., 2005; Yilmaz et al., 2006) (Figure 1B).
Note: All steps should be performed under sterile conditions.
Note: This protocol is applied to bone marrow pooled from 3 mice.
-
5.Bone marrow harvest:
-
a.Mice euthanasia:
-
i.Mice (8–10 weeks old) are euthanized in a CO2 chamber using 2 liters per minute (Lpm) CO2 for 5 min (according to the guidelines set by the Animal Care and Use Committee at the Dana Farber Cancer Institute).
-
i.
-
b.Bone marrow flushing from mouse hind limbs:
-
i.After euthanasia, place the mouse in a ventral position and spray with 70% ethanol for sterilization.
-
ii.Using a scalpel, remove the muscles and tissue around the legs.
-
iii.Collect the femur and tibia by making a cut in the pelvic-hip joint.Note: The muscular tissue surrounding the femur and tibia can be sticky. After the initial removal of the muscles with a scalpel, paper napkins can be used to help with the manual removal of the remaining muscles.
-
iv.Cut the femur and tibia at both ends.
-
v.Using a 27-gauge needle, fill a 10 mL syringe with HBSS++ flushing media.
-
vi.Insert the needle with HBSS++ flushing media into the hollow opening of the bone and flush the bone marrow into a 50 mL Falcon tube.
-
vii.Continue to flush until the bone looks transparent/white.
-
i.
-
a.
-
6.Enrichment of mouse Lin- cells:Note: The enrichment is performed using the Lineage cell depletion kit from Miltenyi Biotec.
-
a.Make a single cell suspension by pipetting up and down with a 10 mL pipette. Next, mix the cells using a BD 10 mL eccentric tip syringe and BD 18G 1 inch needle. Avoid foaming by releasing the cell suspension on the side of the tube.
-
b.Filter the cell suspension through a 70 μm cell strainer into a clean 50 mL conical tube.
-
c.Centrifuge at 500 × g for 5 min, then aspirate the supernatant and resuspend the cells in 600 μL of column buffer. Mix with a pipette.
-
d.Add 150 μL of the Lineage biotin antibody cocktail (from the Lineage cell depletion kit). Incubate 15 min on ice. Mix with a pipette.
-
e.Add 450 μL of column buffer, then add 300 μL of the anti-biotin microbeads (from the Lineage cell depletion kit). Mix with a pipette and incubate 15 min on ice.
-
f.Wash by adding 10 mL of column buffer, then centrifuge at 500 × g for 5 min. Aspirate the supernatant.
-
g.While the cells are in the centrifuge, set up the LS column and MidiMACS separator on the MACS MultiStand. Place a 15 mL conical tube underneath the column. Add 1 mL of column buffer to the LS column, and allow it to flow through and empty into the 15 mL conical tube by gravity flow (Figure 1B).
-
h.Resuspend the cell pellet in 1 mL column buffer and add it to the LS column.
-
i.Wash the column twice with 1 mL of column buffer.
-
i.The Lin- cells are now in the 15 mL conical tube (the Lin+ cells remain attached to the column) and can be used for further analyses. From pooling the bone marrow of three adult wild type mice, we obtain on average 3×10⁶ Lin- cells, whereas from three adult Fanconi anemia mice we obtain 2×10⁶ Lin- cells.
-
ii.To elute Lin+ cells: add 1 mL column buffer to the column, then use the plunger to expel the cells attached to the beads into a new 15 mL conical tube.
-
i.
-
a.
-
7.Isolation of LSK cells and LT-HSC using FACS (Figure 1C):Note: The Lin- cells obtained in the above protocol are ready for downstream applications. Use the following FACS staining protocol if purification of LSK cells or LT-HSC is desired.Note: The following protocol purifies LT-HSCs using the SLAM markers (Kiel et al., 2005; Yilmaz et al., 2006). If using other markers to isolate LT-HSCs, different antibodies should be used.
-
a.Resuspend the enriched Lin- cells (from the previous step) in 1 mL of HBSS++ in a 15 mL conical tube and count them. From a single wild type mouse, we typically expect 1×10⁶ Lin- cells.CRITICAL: Single-color controls for FACS compensation are critical in this protocol.Note: The following single-color controls are used in this protocol:Unstained (autofluorescence)PE single-color controlPE Cy7 single-color controlAPC single-color controlPacific Blue single-color controlAPC-Cy7 single-color controlNote: In this protocol, we prepare single-color controls using the cells obtained from the previous Lin- enrichment.
-
b.Take 1.5×10⁵–2×10⁵ Lin- cells for every single-color control and resuspend them in 100 μL of HBSS++. Keep your experimental samples in 1 mL of HBSS++.Note:Table 1 demonstrates how single-color controls are generated and how experimental samples are stained for FACS. See also text.
-
c.Add 2.5 μL of each biotin-labeled lineage antibody to the PE single-color control: Biotin Hamster anti-Mouse CD3e, Biotin Rat anti-Mouse CD11b, Biotin Rat anti-Mouse CD45R, Biotin Rat anti-Mouse Ly-6G and Ly-6C, Biotin Rat anti-Mouse TER-119/Erythroid cells (all from the Biotin Mouse Lineage Panel). See Table 1.
-
d.Add 25 μL of each biotin-labeled lineage antibody to each experimental sample: Biotin Hamster anti-Mouse CD3e, Biotin Rat anti-Mouse CD11b, Biotin Rat anti-Mouse CD45R, Biotin Rat anti-Mouse Ly-6G and Ly-6C, Biotin Rat anti-Mouse TER-119/Erythroid cells (all from the Biotin Mouse Lineage Panel). See Table 1.
-
e.Add 2.5 μL of fluorochrome-conjugated antibody to the corresponding single-color control: PE-Cy7-Sca1 (Clone D7), APC-c-kit (Clone ACK2), Pacific Blue-CD150 (Clone TC15-12F12.2) and APC-Cy7-CD48 (Clone HM48-1). See Table 1.
-
f.Add 25 μL of fluorochrome-conjugated antibody to each experimental sample: PE-Cy7-Sca1 (Clone D7), APC-c-kit (Clone ACK2), Pacific Blue-CD150 (Clone TC15-12F12.2) and APC-Cy7-CD48 (Clone HM48-1). See Table 1.CRITICAL: To ensure correct preparation of compensation controls, verify that no more than one fluorochrome is added per single-color control tube.Note: If LSK cells are the desired cells to be isolated, use only PE-Cy7-Sca (Clone D7) and APC-c-kit (Clone ACK2).
-
g.Incubate on ice for 30 min. Add 10 mL of HBSS++ to both the single-color controls and the experimental samples. Centrifuge at 500 × g for 5 min.
-
h.Aspirate the supernatant and resuspend the single-color controls in 100 μL HBSS++ and the experimental samples in 1 mL HBSS++.
-
i.Add 1 μL of the PE-streptavidin antibody (BD Biosciences, cat# 554061) to the PE single-color control and 7 μL to the experimental samples.CRITICAL: Do not add the PE-secondary antibody to the remaining single-color controls nor to the unstained control (see chart above).
-
j.Incubate on ice for 20 min. Add 10 mL of HBSS++ to the single-color controls and experimental samples. Centrifuge at 500 × g for 5 min.
-
k.Aspirate the supernatant. Resuspend the experimental samples in 500 μL HBSS++, and the single-color controls in 200 μL HBSS++.
-
l.Filter the samples using a 5 mL round bottom tube with cell strainer cap (mesh size 35 μm) to avoid large cellular clumps.
-
m.Place the samples on ice and proceed to FACS sorting.
-
n.Collect the samples in 500 μL of collection media. The sorted samples are ready for downstream applications.
-
a.
Table 1.
Generation of single-color controls for sorting of mouse LT-HSC
| Tube | HBSS++ | Biotin-labeled lineage antibodies | PE-Cy7 (Sca1) | APC (c-kit) | Pacific blue (CD150) | APC-Cy7 (CD48) | PE-streptavidin |
|---|---|---|---|---|---|---|---|
| Unstained (autofluorescence) | 100 μL | - | - | - | - | - | - |
| PE single-color control |
100 μL | 2.5 μL of each | - | - | - | - | 1 μL |
| PE-Cy7 single-color control |
100 μL | - | 2.5 μL | - | - | - | - |
| APC single-color control |
100 μL | - | - | 2.5 μL | - | - | - |
| Pacific Blue single-color control |
100 μL | - | - | - | 2.5 μL | - | - |
| APC-Cy7 single-color control |
100 μL | - | - | - | - | 2.5 μL | - |
| Experimental sample 1 | 1000 μL | 25 μL of each | 25 μL | 25 μL | 25 μL | 25 μL | 7 μL |
| Experimental sample 2 | 1000 μL | 25 μL of each | 25 μL | 25 μL | 25 μL | 25 μL | 7 μL |
| Experimental sample n | 1000 μL | 25 μL of each | 25 μL | 25 μL | 25 μL | 25 μL | 7 μL |
Note: A representative FACS strategy is shown in Figure 1C.
Colony forming unit (CFU) assay
In this protocol we present the optimized conditions for culturing enriched or purified HSPCs and assessing their CFU capacity in vitro. In order to determine the number of bone marrow or mobilized peripheral blood cells with the capacity to form hematopoietic colonies in vitro, an aliquot of the cell suspension (unselected, enriched, or purified cells) with a known number of viable cells, must be cultured on a nutritive substrate (in this case methylcellulose, a semisolid culture medium) supplemented with specific recombinant cytokines. The semisolid methylcellulose allows for the development of hematopoietic colonies of different lineages, including erythroid, granulocytic, monocytic, granulocytic-monocytic, and mixed myeloid-erythroid colonies.
Note: The procedure must be performed under sterile conditions under a class II laboratory cabinet at 18°C–21°C.
Note: The same protocol can also be used for CFU quantification from umbilical cord blood samples.
Note: Thaw the MethoCult H4434 Classic (for human samples) or MethoCult GF M3434 (for mouse samples) and bring up to 37°C in a water bath.
-
8.Cell concentration:
-
a.For Lin- cells, adjust the cell concentration to 10,000 viable cells per 100 μL in StemSpan SFEM II culture medium or HBSS++.
-
b.For CD34+ cells or LSK cells, adjust the cell concentration to 2,000 viable cells per 100 μL in StemSpan SFEM II culture medium or HBSS++.
-
a.
Note: See troubleshooting 1.
-
9.Cell culture:
-
a.For every 3 mL of MethoCult H4434 Classic or MethoCult GF M3434 add: 30 μL of PenStrep, 100 μL of the cell suspension adjusted to the cell concentration indicated above, depending on the purity of the cells. Finally, if applicable, add any experimental drug. Immediately vortex the cell suspension for 5–10 s.Note: For this step we selected the ready-to-use aliquots of 3 mL of MethoCult H4434 Classic.Alternatives: Both MethoCult H4434 Classic and MethoCult GF M3434 are also available in 100 mL bottles. If this is preferred to the ready-to-use version, 3 mL aliquots should be made in advance (and stored in 15 mL conical tubes). Before aliquoting, shake the bottle to homogenize, and allow any bubbles to disappear. Store the aliquots at -20°C. Thaw each aliquot at 37°C in a water bath right before use.CRITICAL: Samples from patients with bone marrow failure syndromes such as Fanconi anemia, Diamond-Blackfan anemia or dyskeratosis congenita have very small amounts of HSPCs. If assessing CFU capacity in samples from these patients, consider using 3–5 times the number of input cells.
-
b.Let the culture cell suspension stand for 5 min or until the bubbles that have formed disappear.
-
c.If the assay will be analyzed using the automated STEMvision machine, slowly distribute 1 mL of methylcellulose per well in a 6-well SmartDish, avoiding the formation of bubbles. Repeat this step with the remaining 2 mL of methylcellulose.Note: Each condition is plated in triplicate; a single tube containing 3 mL of methylcellulose is evenly distributed into 3 wells. Two conditions (each in triplicate) can be cultured in a 6-well plate.Note: The spaces between the wells of the plate must be filled with sterile water and the plate placed in a humid chamber.Alternatives: cells can be plated in 35 mm petri dishes (labeled on the sides) or in flat bottom non-tissue culture treated 12-well plates. Once again, plate 1 mL of the culture cell suspension in triplicate.CRITICAL: Never use tissue culture treated plates, as they will promote the attachment of cells to the plate bottom. This will prevent 3D colony formation and complicate the assessment and quantification of colonies.CRITICAL: To avoid evaporation of the methylcellulose, place the SmartDish in a humid chamber. The humid chamber must be prepared with sterile water in a sterile container. Sterility is warranted as the container will be placed inside the incubator for long periods of time (up to 14 days).
-
a.
-
10.
Incubate the cells at 37°C for 14 days (in the case of human CFU assay), or for 7 days (in the case of mouse CFU assay). To ensure the humid chamber does not dry out, more sterile water can be added if necessary.
Note: See troubleshooting 2.
-
11.
After 7 or 14 days, assess the size and shape of the colonies according to the criteria presented in the expected outcomes section.
Note: See troubleshooting 3.
The outcome of the human CFU assay plated in a SmartDish is shown in Figure 2A.
Figure 2.

Types of hematopoietic colonies recognized in the CFU assay
(A) Hematopoietic cells from human bone marrow were cultured in methylcellulose semisolid medium supplemented with recombinant hematopoietic cytokines and cultured for 14 days at 37°C and 5% CO2. Image shown corresponds to a CFU assay as seen in the STEMvision system. Left panel: negative image. Right panel: standard image.
(B) Representative hematopoietic colonies from human bone marrow scored at day 14 of culture (10×).
(C) Morphological appearance of a CFU-GEMM. Left panel: 10×. Right panel: 100×. Scale bar represents the size of the colonies in mm.
γH2AX foci detection in HSPCs by immunofluorescence
The formation of γH2AX foci is a well-known strategy for the detection of DNA damage and DNA repair signaling after a DNA damage insult. γH2AX foci formation is considered a surrogate for the formation of double strand breaks. Assessment of γH2AX foci formation by immunofluorescence is usually difficult to perform in suspension cells and even more difficult in rare populations such as HSPCs. Here we present an optimized protocol for performing γH2AX immunofluorescence in small amounts of sorted HSPCs. Quantification of γH2AX foci is used to assess the amount of DNA damage induced in the DNA molecule by a certain treatment, as well as for the evaluation of DNA repair kinetics when timepoints are performed. The quantification of γH2AX foci can be performed in freshly isolated HSPCs from mouse or human donors or after exposing the HSPCs in culture to agents that induce DNA damage, such as irradiation, cisplatin or mitomycin C. Use your desired cells of study: Lin- cells, CD34+ cells, LSK cells or LT-HSCs.
-
12.Spin down the cells onto SuperFrost Plus slides:
-
a.Set up the cytofunnel assembly.
-
b.Pipette 1.5×10⁵ - 2×10⁵ cells resuspended in 50 μL of PBS into each funnel, then place the assembly in the cytocentrifuge.
-
c.Run at 500 × g for 5 min.
-
d.Remove the funnel assembly from the cytocentrifuge and disassemble. Draw a circle on the back side of the microscope slide to indicate where the cells have been spun onto the slide.
-
e.Use a hydrophobic pen to draw a border around the cells.
-
f.Allow slides to dry completely (approximately 2 min).
-
a.
-
13.Immunofluorescence:
-
a.Fixing & permeabilization:
-
i.Prepare 4% paraformaldehyde (PFA) by diluting the stock solution in PBS. Add ∼750 μL of 4% PFA to each sample, then incubate 15 min at 18°C–21°C.
-
ii.Tap off PFA from the slides, then wash 2× 5 min with PBS.
-
iii.Add enough ice cold methanol to cover each sample (∼200 μL), then incubate for 2 min at 18°C–21°C.
-
iv.Wash 2× 5 min with PBS.
-
i.
-
b.Blocking:
-
i.Prepare fresh blocking buffer filtered through a 0.45 μm filter.
-
ii.Add 500 μL blocking buffer to each sample.
-
iii.Incubate for 1 h at 18°C–21°C.
-
i.
-
c.Primary antibody:
-
i.Prepare fresh IF buffer.
-
ii.Dilute anti-phospho-Histone H2A.X antibody 1:1000 in IF buffer. Add ∼100 μL to each sample.
-
iii.Incubate at 4°C in a humid chamber for 12–18 h.
 Pause point: At this moment, the slides can stay overnight.
 -
iv.After the overnight incubation at 4°C, incubate the slides at 37°C for 1 h.
-
v.Wash 3× 5 min with PBS.
-
i.
-
d.Secondary antibody:
-
i.Dilute secondary antibody (donkey anti-rabbit Alexa Fluor 488) 1:500 in IF buffer. Add ∼100 μL to each sample.CRITICAL: Follow the rest of the steps in the dark.
-
ii.Incubate at 37°C for 1 h in a humid chamber
-
iii.Wash 2× 5 min with PBS.
-
i.
-
e.Mounting:
-
i.Dry the slide such that all excess PBS is cleared off.
-
ii.Add a drop of ProLong Gold Antifade Mountant with DAPI over the cells.
-
iii.Place glass coverslip on top, ensuring that there are no bubbles, and that the mounting solution covers the entire coverslip.
-
iv.Seal the edges of the coverslips with clear nail polish.
-
v.Let dry at 18°C–21°C, ∼15 min.
-
vi.Image cells right away, or store at 4°C until ready to be imaged.
-
i.
-
a.
-
14.
Imaging: image the cells using FITC filter at 40× or 63× magnification.
Note: See troubleshooting 4 and 5.
Alkaline comet assay using HSPCs
The comet assay is used for assessing the breakage induced in the DNA molecule following a specific treatment. The alkaline version of the comet assay is used to detect single and double-stranded breaks in the DNA molecule. This assay can be performed in freshly isolated HSPCs from mouse or human donors, or after exposing the HSPCs in culture to agents that induce DNA breaks, such as irradiation, cisplatin or mitomycin C. The comet assay has the advantage of requiring only a small number of cells, and results can be obtained using as few as 1000 cells. Use your desired cells of study: Lin- cells, CD34+ cells, LSK cells or LT-HSCs.
Note: Use the cells isolated from the previous protocols.
Note: Work under dim light to avoid DNA breakage external to the treatment.
Note: Sterility is not required.
Note: Pre-chill the Lysis Solution to 4°C before beginning.
-
15.
Melt LMAgarose (included in the comet assay kit) in a beaker of boiling water for 5 min with the cap loosened. Then, place bottle in a 37°C water bath for at least 20 min to cool.
-
16.
Combine 1000 cells with 50 μL of LMAgarose (at 37°C) and immediately pipette this cell suspension onto a CometSlide (included in the comet assay kit). Avoid the formation of bubbles.
Note: See troubleshooting 6 and 7.
-
17.
Place slides flat at 4°C in the dark for 10 min. A clear ring will appear at the edge of the CometSlide area.
-
18.
Immerse slides in Lysis Solution (that has been pre-chilled to 4°C) and incubate for 12–18 h at 4°C.
-
19.
Drain excess buffer from slides and immerse in freshly prepared Alkaline Unwinding Solution. Incubate the slides in Alkaline Unwinding Solution for 1 h at 4°C in the dark.
-
20.
Pour the Alkaline Electrophoresis Solution into an electrophoresis chamber, carefully immerse the slides, and align them equidistant from the chamber electrodes (See Figure 3B).
-
21.
Set the power supply to 21 V and perform electrophoresis for 30 min.
Note: See troubleshooting 8.
-
22.
Drain excess electrophoresis solution, then gently wash slides 2× 5 min in deionized water, then 1× 5 min in 70% ethanol.
-
23.
Dry samples at 37°C for 10–15 min. Store at 18°C–21°C until ready to image.
-
24.
Add 100 μL of the diluted SYBR Green solution onto each circle of dried agarose and stain 30 min at 18°C–21°C. Tap the slide gently to remove excess SYBR Green solution and rinse in water. Allow the slides to dry completely at 37°C.
-
25.
View the slides using an epifluorescence microscope. SYBR Green excitation/emission spectrum is 496 nm/522 nm.
-
26.
Data can be analyzed with ImageJ software using the OpenComet plugin.
Figure 3.

Immunofluorescence for γH2AX foci and the comet assay can be used for DNA damage assessment in HSPCs
(A) Representative pictures of an immunofluorescence for detection of γH2AX foci in sorted mouse LT-HSCs treated in vitro with 5 Gy of IR. Green arrowhead points a cell negative for γH2AX foci, pink arrowhead points a cell with multiple γH2AX foci. Scale bar represents 20 μm.
(B) Picture demonstrating the correct alignment of the comet assay slides with respect to the black cathode of the electrophoretic chamber.
(C) Representative pictures of a comet assay in sorted mouse LT-HSCs untreated (left) or treated in vitro with 5 Gy of IR (right). Scale bar represents 20 μm.
Expected outcomes
CFU assay
CFU assays are analyzed after 14–16 days of incubation using an inverted light microscope, under the 5× objective. The culture dish is placed on a graduated plate to facilitate the exploration of the entire culture area. The types of colonies can be distinguished based on: color (red vs white colonies), cell and colony size (large vs small cells; large vs small colonies), number of lineages present in each colony (1, 2, 3 or 4 lineages), colony shape (compact vs diffuse colonies; one or multiple clusters, in the case of erythroid colonies) and type of colony edge. A colony must contain a minimum of 50 cells (Figure 2B). The reading begins at one of the edges of the culture dish, following a horizontal or vertical line, until the total cultivation area is verified. Small colonies may also grow on the edges of the culture dish.
Erythroid colonies have a characteristic red color due to the presence of hemoglobin-containing cells; however, it is possible to find erythroid colonies in which the red color is barely present or in which the color is black. In the latter case, the identification of the colony is achieved by turning off the microscope light; red cells have a natural fluorescence, and they will appear reddish. For suspected erythroid colonies not showing color or fluorescence, determine lineage by considering the size of the cells (erythroid cells are smaller than granulocytes or macrophages) and the shape of the colony (compact clusters of cells overlapping). Erythroid colonies come in two types: small and large Burst-Forming Unit-Erythroid (BFU-E). Large BFU-E are colonies consisting of several compact clusters, located in different spatial planes, but close to each other, since they originated from a single progenitor. Small BFU-E, on the other hand, are single colonies, in a single plane, of relatively small size (Figure 2B, upper panel).
Myeloid colonies (formed of white cells) can be of three types: CFU-Granulocytes-Monocytes (CFU-GM), CFU-Granulocytes (CFU-G), and CFU-Monocytes (CFU-M). The three colony types may be present with similar cell numbers, so they can be identified based on cell size and colony shape. CFU-G are radial colonies, which can present as a loose or extremely tight grouping; in the latter case, it can be so narrow that colonies may be mistaken for a BFU-E. However, turning off the microscope light helps to distinguish the type of colony (CFU-G will appear white). CFU-M are composed of large cells compared to those present in a granulocyte or erythroid colony. The cells appear opaque, and the colony may have an irregular distribution, spread over the substrate. Finally, CFU-GM are colonies containing both granulocytes and monocytes at different proportions (Figure 2B, lower panel). CFU-GEMM (mixed colonies of granulocytes, erythrocytes, monocytes, and megakaryocytes) contain all the lineages described above. They can also include megakaryocytic cells, although the presence of such a lineage is dependent on the addition of specific cytokines to the substrate to achieve the differentiation and identification of these cells. CFU-GEMM can be medium, large, or very large colonies, where the different lineages are intertwined on the same plane. It is important to point out that a mixed colony always contains red cells together with some of the white cell lineages, not necessarily the strict presence of all the myeloid lineages (Figure 2C).
Reading the content of hematopoietic progenitors in the automated STEMvision system allows for the morphology, shape, and size of hematopoietic colonies to be reviewed at different magnifications. However, the software only discriminates between red, white, and mixed colonies, not between the different myeloid lineages. It is also important that each reading is verified by the reader, since it is possible that the software will not detect very small colonies or those on the edges of the culture dish, as well as those that may be mistaken for substrate debris. In general, the reading in the automated system presents an undervaluation with respect to the manual reading of the same assay.
CFU numbers are usually reported as per 100,000 cells, but they can also be presented as a percentage of cultured cells. To report the content of CFU per 100,000 cells, the following equation is considered:
To report the content of CFU as a percentage of cultured cells, the following equation is considered:
Depending on the study objectives, it is possible to report the total CFU content or the content of independent lineages: CFU-Myeloid, CFU-Erythroid, CFU-Mixed. When analyzing the CFU content in a purified or enriched hematopoietic (CD34+) cell population during a particular treatment in liquid culture, it is important to consider the effect of such a treatment on cell proliferation. Colony assays are normally carried out with a sample of the total cell population, so the report of CFU content per 100,000 cells can be modified if there are fewer or more cells. Thus, the increase or decrease (fold-change) with respect to the CFU content at the beginning of the treatment can be presented.
γH2AX assay
γH2AX (or phospho-H2AX) is a marker of DNA double-stranded breaks, as well as genomic instability. Therefore, it can be used to evaluate DNA repair following treatment with DNA-damaging agents such as mitomycin C, cisplatin, or irradiation. Positive staining can also be used to assess DNA repair kinetics when timepoints are performed. Cells exposed to mitomycin C, cisplatin, or irradiation will contain more DNA damage and thus produce more foci compared to untreated cells. Likewise, cells without DNA damage should contain very little or no positive staining. γH2AX foci are visualized as bright dots within the nucleus (Figure 3A). To quantify these foci, the number of positive cells or the number of foci per nucleus can be counted.
Comet assay
The comet assay enables the detection of broken DNA. First, the cells are subjected to DNA damage, then the cytoplasm is lysed and the nuclei are subjected to an electrophoretic field causing the migration of broken DNA away from the cathode of the electrophoretic chamber. Cells are then stained with SYBR Green dye which binds to DNA and emits a green signal. Migration of the DNA molecule will form a tail, thus indicating the presence of DNA breaks. In cells without DNA damage, the fluorescence is confined to the nucleus, and the nuclei will appear as perfect circles. The undamaged DNA is supercoiled, and thus does not migrate very far out of in the electric current (Figure 3C). A good positive control for the comet assay is cells exposed to IR (5 Gy) allowed to recover for 2–4 h after IR. Common descriptors of DNA damage for alkaline comet assays are “percent of DNA in the tail”, “comet length” and “tail moment”. Percent DNA in the tail is a normalized measure of the percent of total cell DNA found in the tail. Tail moment is a damage measure combining the amount of DNA in the tail with distance of migration. The OpenComet plugin from Image J can be used for quantification of the percent of DNA in the tail, comet length and tail moment. At least 50 cells should be scored per sample.
Usefulness of assessing DNA damage in HSPCs
The continuous generation of blood from HSPCs poses a challenge on this cell compartment, and efficient DNA repair systems are needed for mitigating the damage that arises from replication stress or endogenous sources of DNA damage. A prime example of how DNA damage can affect HSPCs is Fanconi anemia, an inherited bone marrow failure syndrome with a defective FA/BRCA pathway. This pathway detects and repairs DNA interstrand crosslinks. Aplastic anemia appears at a young age in patients with Fanconi anemia since their HSPCs are remarkably sensitive to DNA damage and succumb to apoptosis (Rodríguez and D’Andrea, 2017).
Although the isolation of HSPCs is challenging given their rareness, their study is critical, not only for FA but also to study how DNA damaging agents affect hematopoiesis, as well as for the discovery of novel diseases or mechanisms of DNA damage. Also, the effectiveness of novel treatments aimed to improve DNA repair and aplastic anemia (Zhang et al., 2016), or even gene therapy strategies currently underway in Fanconi anemia (Río et al., 2019), can be assessed using DNA damage assays in HSPCs if they are efficiently isolated from either mouse or human.
Although the usage of cell lines is advantageous over primary tissues and the vast majority of research in the DNA repair field is performed in cell lines, validation of results is also critical in primary tissues or in vivo models if translational outcomes are sought. We consider that the thorough step-by-step protocol that we present here will reduce some methodological burden for researchers interested on exploring DNA repair in the HSPC compartment.
Limitations
CFU assay. The CFU assay does not detect all hematopoietic progenitors present in a particular cell population, but only those capable of forming colonies in semisolid culture. Thus, this in vitro assay should not be taken as a means of quantifying all hematopoietic progenitor cells. Indeed, it has been shown that only a fraction of CD34+ progenitors are capable of forming colonies in vitro. The CFU assay is used to determine the number and phenotype of progenitor cells capable of forming hematopoietic colonies at a specific time. However, it does not detect progenitor cells that are not able to display their colony-forming potential due to particular intrinsic (e.g., cell cycle phase) or extrinsic (e.g., type, number, or concentration of cytokines present in the culture medium) factors. CFU assays allow for the detection of multipotent, myeloid, erythroid, and, under specific culture conditions, megakaryocytic progenitor cells. However, they are not suitable for the detection of lymphoid progenitors.
γH2AX assay. The outcome of immunofluorescence staining depends on several factors. In order to minimize background while maintaining a strong signal, the quality and dilution of the antibody is critical. In some cases, resolving signal-to-noise ratio-related problems can require several test dilutions of the primary and secondary antibodies to determine the optimal concentrations. To prevent bleaching (decreased fluorescence signal due to light exposure), the protocol should be done in the dark after the addition of the secondary antibody, and an antifade reagent should be used in the mounting medium. It is essential that the samples are protected from light when not being imaged, and the slides should be exposed to the minimum amount of light from the microscope necessary to image the sample.
Comet assay. The comet assay does not provide an absolute quantification of the amount of DNA damage in a cell; therefore, it should ideally be accompanied by other assays for the detection of DNA damage. Samples must be prepared under dim lighting conditions, otherwise the DNA breaks induced by light exposure could interfere with data interpretation. Samples should be imaged quickly after staining with SYBR Green, otherwise the fluorescence signal can be lost.
Troubleshooting
Problem 1
Oversaturation of CFU cultures (major step 8).
Potential solution
Maintaining an optimal number of cells in each assay is important to avoid reading errors. A culture with too many colonies prevents their correct identification and may lead to over- or undervaluation of the real content of progenitors in a sample.
Problem 2
CFU cultures become dried out (major step 10).
Potential solution
It is important to monitor the amount of water present in the humid chamber and to add more if, during the incubation period, water levels decrease too much. If at the time of reading the plates, slight dryness is observed, but colonies are well-defined, a small amount of sterile water can be added to the surfaces of the culture without shaking, so a wet layer is formed that facilitates the reading and recognition of hematopoietic colonies.
Problem 3
Low detection of CFU colonies (major step 11).
Potential solution
The concentration of the cells to be cultured must be optimal, as well as the dilution in the liquid medium in which they are found. A highly diluted sample, when placed on the substrate, would result not only in a reduced number of cells and very few colonies. It is also important to keep the methylcellulose aliquots frozen and thaw them just prior to use. It has been shown that when complete methylcellulose medium aliquots are kept in the fridge for several weeks, cytokines may lose some potency.
Problem 4
γH2AX immunofluorescence has decreased or no signal (major step 14).
Potential solution
Ensure that the samples are not exposed to light for extended periods of time after the fluorescent secondary antibody is added. Samples should also be imaged as soon as possible after mounting; avoid extended storage periods for best results.
Problem 5
High background signal in γH2AX immunofluorescence (major step 14).
Potential solution
Attempt longer or additional washes to ensure fixative, permeabilization buffer, and/or secondary antibody have been sufficiently removed. If blocking is inadequate, use a normal serum from the same species as the secondary antibody.
Problem 6
Comet tails overlap (major step 16).
Potential solution
Reduce the number of cells. Always quantify the number of cells before starting the protocol.
Problem 7
Majority of cells in the untreated control of the comet assay have long comet tails (major step 16).
Potential solution
Keep cells on ice and prepare cell samples immediately before combining with melted agarose. Work under dim light.
Problem 8
The positive control of the comet assay has no tails (major step 21).
Potential solution
Increase the time of electrophoresis. Ensure the reagents are fresh.
Resource availability
Lead contact
Further information and requests for resources and reagents should be directed to and will be fulfilled by the lead contact, Alan D’Andrea (alan_dandrea@dfci.harvard.edu).
Materials availability
This study did not generate new unique reagents.
Acknowledgments
We thank the patients with Fanconi anemia and their families and also their physicians; we also thank the FACS facility at Dana Farber Cancer Institute. This research was supported by grants from the National Institutes of Health (R01HL052725 and P01HL048546), the Leukemia and Lymphoma Society (6237-13), and the Fanconi Anemia Research Fund (to A.D.D.).
Author contributions
A.R., P.F.-G., H.M., K.P., and A.D.D. developed protocols and designed experiments. A.R. performed experiments with the help of J.F. and P.F.-G. H.M. and A.D. provided reagents and analyzed data. A.D.D. supervised the experiments. A.R., J.F., P.F.-G., H.M., K.P., and A.D.D. wrote the manuscript.
Declaration of interests
The authors declare no competing interests.
Contributor Information
Alfredo Rodríguez, Email: alfredo.rodriguez@iibiomedicas.unam.mx.
Alan D. D’Andrea, Email: alan_dandrea@dfci.harvard.edu.
Data and code availability
This study did not generate new data or code.
References
- Kiel M.J., Yilmaz O.H., Iwashita T., Yilmaz O.H., Terhorst C., Morrison S.J. SLAM family receptors distinguish hematopoietic stem and pro- genitor cells and reveal endothelial niches for stem cells. Cell. 2005;121:1109–1121. doi: 10.1016/j.cell.2005.05.026. [DOI] [PubMed] [Google Scholar]
- Lin F.C., Karwan M., Saleh B., Hodge D.L., Chan T., Boelte K.C., Keller J.R., Young H.A. IFN-g causes aplastic anemia by altering he- matopoietic stem/progenitor cell composition and disrupting lineage differen- tiation. Blood. 2014;124:3699–3708. doi: 10.1182/blood-2014-01-549527. [DOI] [PMC free article] [PubMed] [Google Scholar]
- Matatall K.A., Jeong M., Chen S., Sun D., Chen F., Mo Q., Kimmel M., King K.Y. Chronic infection depletes hematopoietic stem cells through stress-induced terminal differentiation. Cell Rep. 2016;17:2584–2595. doi: 10.1016/j.celrep.2016.11.031. [DOI] [PMC free article] [PubMed] [Google Scholar]
- Olive P.L., Banáth J.P. The comet assay: a method to measure DNA damage in individual cells. Nat. Protoc. 2006;1:23–29. doi: 10.1038/nprot.2006.5. [DOI] [PubMed] [Google Scholar]
- Parmar K., D’Andrea A., Niedernhofer L.J. Mouse models of Fanconi anemia. Mutat. Res. 2009;668:133–140. doi: 10.1016/j.mrfmmm.2009.03.015. [DOI] [PMC free article] [PubMed] [Google Scholar]
- Río P., Navarro S., Wang W., Sánchez-Domínguez R., Pujol R.M., Segovia J.C., Bogliolo M., Merino E., Wu N., Salgado Successful engraftment of gene-corrected hematopoietic stem cells in non-conditioned patients with Fanconi anemia. Nat. Med. 2019;25:1396–1401. doi: 10.1038/s41591-019-0550-z. [DOI] [PubMed] [Google Scholar]
- Rodríguez A., Zhang K., Färkkilä A., Filiatrault J., Yang C., Velázquez M., Furutani E., Goldman D.C., García de Teresa B., Garza-Mayén G. MYC promotes bone marrow stem cell dysfunction in Fanconi anemia. Cell Stem Cell. 2021;28:33–47. doi: 10.1016/j.stem.2020.09.004. [DOI] [PMC free article] [PubMed] [Google Scholar]
- Rodríguez A., Yang C., Furutani E., García de Teresa B., Velázquez M., Filiatrault J., Sambel L.A., Phan T., Flores-Guzm P., Sánchez S. Inhibition of TGFβ1 and TGFβ3 promotes hematopoiesis in Fanconi anemia. Exp. Hematol. 2021;93:70–84. doi: 10.1016/j.exphem.2020.11.002. [DOI] [PMC free article] [PubMed] [Google Scholar]
- Rodríguez A., D’Andrea A. Fanconi anemia pathway. Curr. Biol. 2017;27:R986–R988. doi: 10.1016/j.cub.2017.07.043. [DOI] [PubMed] [Google Scholar]
- Seita J., Weissman I.L. Hematopoietic stem cell: self-renewal versus differentiation. Wiley Interdiscip. Rev. Syst. Biol. Med. 2010;2:640–653. doi: 10.1002/wsbm.86. [DOI] [PMC free article] [PubMed] [Google Scholar]
- Shimano K.A., Narla A., Rose M.J., Gloude N.J., Allen S.W., Bergstrom K., Broglie L., Carella B.A., Castillo P., de Jong J.L., Dror Y. Diagnostic work-up for severe aplastic anemia in children: consensus of the north American pediatric aplastic anemia consortium. Am. J. Hematol. 2021 doi: 10.1002/ajh.26310. [DOI] [PubMed] [Google Scholar]
- Tang J., Zhu N., Rao S., Carlson K.S. Stem cell damage after chemotherapy-can we do better? Best Pract. Res. Clin. Haematol. 2019;32:31–39. doi: 10.1016/j.beha.2019.02.001. [DOI] [PubMed] [Google Scholar]
- Walter D., Lier A., Geiselhart A., Thalheimer F.B., Huntscha S., Sobotta M.C., Moehrle B., Brocks D., Bayindir I., Kaschutnig P. Exit from dormancy provokes DNA-damage-induced attrition in haematopoietic stem cells. Nature. 2015;520:549–552. doi: 10.1038/nature14131. [DOI] [PubMed] [Google Scholar]
- Yilmaz O.H., Kiel M.J., Morrison S.J. SLAM family markers are conserved among hematopoietic stem cells from old and reconstituted mice and markedly increase their purity. Blood. 2006;107:924–930. doi: 10.1182/blood-2005-05-2140. [DOI] [PMC free article] [PubMed] [Google Scholar]
- Zhang H., Kozono D.E., O’Connor K.W., Vidal-Cardenas S., Rousseau A., Hamilton A., Moreau L., Gaudiano E.F., Greenberger J., Bagby G. TGF-β inhibition rescues hematopoietic stem cell defects and bone marrow failure in Fanconi anemia. Cell Stem Cell. 2016;18:668–681. doi: 10.1016/j.stem.2016.03.002. [DOI] [PMC free article] [PubMed] [Google Scholar]
Associated Data
This section collects any data citations, data availability statements, or supplementary materials included in this article.
Data Availability Statement
This study did not generate new data or code.