Abstract
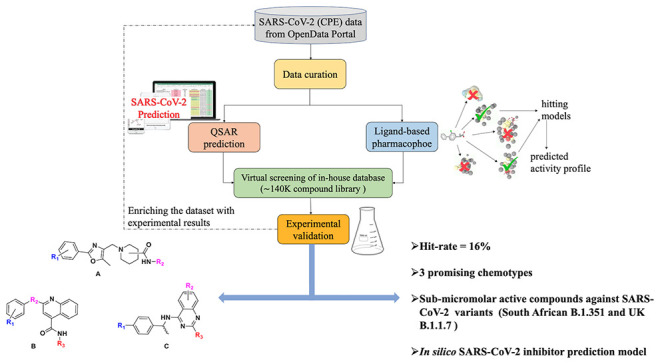
The National Center for Advancing Translational Sciences (NCATS) has been actively generating SARS-CoV-2 high-throughput screening data and disseminates it through the OpenData Portal (https://opendata.ncats.nih.gov/covid19/). Here, we provide a hybrid approach that utilizes NCATS screening data from the SARS-CoV-2 cytopathic effect reduction assay to build predictive models, using both machine learning and pharmacophore-based modeling. Optimized models were used to perform two iterative rounds of virtual screening to predict small molecules active against SARS-CoV-2. Experimental testing with live virus provided 100 (∼16% of predicted hits) active compounds (efficacy > 30%, IC50 ≤ 15 μM). Systematic clustering analysis of active compounds revealed three promising chemotypes which have not been previously identified as inhibitors of SARS-CoV-2 infection. Further investigation resulted in the identification of allosteric binders to host receptor angiotensin-converting enzyme 2; these compounds were then shown to inhibit the entry of pseudoparticles bearing spike protein of wild-type SARS-CoV-2, as well as South African B.1.351 and UK B.1.1.7 variants.
Keywords: COVID-19, SARS-CoV-2, virtual screening, machine learning, pharmacophore modeling
In December 2019, a novel coronavirus strain SARS-CoV-2 began to spread in Wuhan, China1 and eventually led to an alarming global pandemic. As of May 2021, the pandemic has reached over 154 million cases and the resulting complications have caused more than 30 million deaths worldwide.2 Numerous strategies have been employed to find a reliable COVID-19 therapy including vaccine development, drug repurposing, and developing novel small-molecule SARS-CoV-2 inhibitors.3−6 The FDA has now issued emergency use authorization for multiple vaccines; however, the outbreak is far from under control, mainly due to the emergence of SARS-CoV-2 variants. As per a recent CDC report, there are 13 variants, five of which are classified as variants of concern.7,8
At the beginning of the pandemic, the National Center for Advancing Translational Sciences (NCATS) started a COVID-19 drug repurposing campaign and created the OpenData Portal to make SARS-CoV-2-related assay data publicly accessible.9 The COVID-19-targeted high-throughput screening (HTS) campaigns at NCATS apply a wide range of biochemical and cell-based assays, including the cytopathic effect assay (CPE) of live SARS-CoV-2 in Vero-E6 cells.10 More recently, NCATS included data generated from testing of potential therapeutics against different SARS-CoV-2 variants (https://opendata.ncats.nih.gov/variant/assays).
Drug discovery is a time- and resource-intensive process; virtual screening (VS) to identify small-molecule protein modulators offers significant advantages, especially when used to complement traditional HTS methodology.11,12 Multiple in silico studies related to SARS-CoV-2 have been reported, which employ virtual screening of small-molecule databases.13−20 However, in most of these published communications, hit compounds were not experimentally validated in SARS-CoV-2 assays or were not counterscreened for cytotoxicity, rendering the results inconclusive.
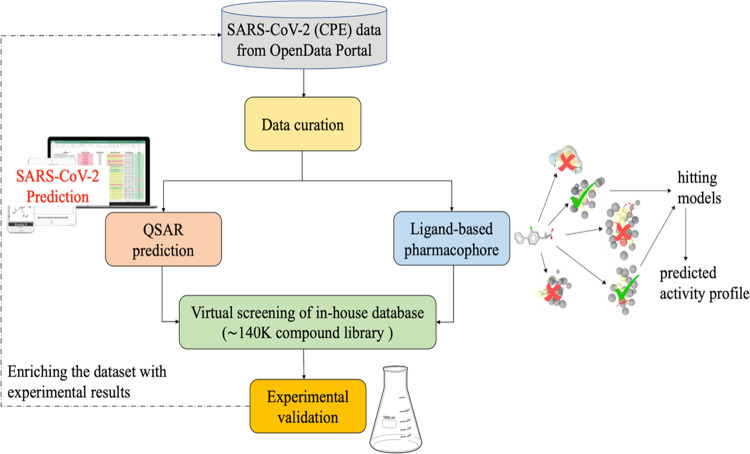
While many efforts are focused on repurposing existing drugs,21−23 we performed a hybrid virtual screening of two in-house libraries (∼140k compounds) in an effort to identify new chemotypes with antiviral activity and limited cytotoxicity, utilizing the NCATS publicly available screening data. This hybrid approach integrates a quantitative structure–activity relationship (QSAR) and ligand-based pharmacophore (LBP) modeling, followed by experimental testing of predicted hits in CPE and cytotoxicity assays. We executed two iterative rounds of virtual screening; hit compounds identified in the first round were experimentally tested, and these data were utilized to enrich the training data set for the proposed hybrid approach used in the second round (Figure 1).
Figure 1.
Flowchart of the virtual screening strategy used in this study.
These efforts resulted in a total of 100 compounds (out of 640 virtual screening hits; hit rate ∼16%) which showed inhibition (half-maximum inhibitory concentration, IC50 ≤ 15 μM; the maximum inhibitory effect observed, efficacy24 > 30%) in the CPE assay and minimal cytotoxicity (IC50 > 30 μM), where 68 of them had an efficacy greater than 70%. Interestingly, three novel antiviral chemotypes emerged with multiple (≥3) active structural analogues in each cluster. Some preliminary structure–activity relationships (SARs) were identified, which validates these chemotypes as candidates for further medicinal chemistry optimization as novel SARS-CoV-2 inhibitors.
In an effort to elucidate the mechanism of action, hit compounds/chemotypes were tested across several viral targets. Six novel SARS-CoV-2 CPE inhibitors were identified as allosteric ACE2 binders (using microscale thermophoresis, MST) and also blocked viral entry, as assessed by a pseudoparticle entry assay (PP assay). In most cases, ACE2 binding showed a direct correlation to activity in the PP assay. We further validated these six novel inhibitors in PP assays using both the South African and the UK SARS-CoV-2 variants; two compounds were identified with submicromolar activity against both variants.
To the best of our knowledge, this is the first study that identifies novel inhibitors of multiple SARS-CoV-2 variants with an elucidated mechanism of action. The curated data set and the optimized prediction models are publicly available via github (https://github.com/ncats/covid19_pred) as well as NCATS Predictor website (https://predictor.ncats.io/).
Material and Methods
The data used in this study were obtained from single-agent screening in both the SARS-CoV-2 cytopathic effect (CPE) and a host-toxicity counterscreen (CTG), CellTiter-Glo (CTG). These data are publicly accessible via the NCATS OpenData Portal (https://opendata.ncats.nih.gov/covid19/). As NCATS has been unceasingly performing screening campaigns, we combined these data with additional in-house quantitative HTS data, resulting in a data set of 9046 compounds.
Data Set Curation
The data set was curated following a protocol previously developed by Fourches et al.25−27
Briefly, the following steps were performed: (i) removal of inorganic compounds according to the chemical formula in MOE 2019.01;28 (ii) removal of salts and compounds containing metals and/or rare or special atoms; (iii) standardization of chemical structures using Francis Atkinson’s standardizer (https://github.com/flatkinson/standardiser); ans (iv) removal of duplicates and permanently charged compounds using MOE 2019.01.28
Compound Labeling
Compounds having an IC50 < 30 μM, curve class in the range of 1–3,29 and a maximum response (MaxResponse) > 30% were considered active for the CPE reduction assay, whereas others were labeled as inactive. For the cytotoxicity counterscreen (CTG), compounds with an IC50 < 30 μM, curve class in the range of 1 to −3, and MaxResponse <−30% were considered active and others as inactive. In the combined data set, compounds active in the CPE reduction assay and inactive in the CTG counterscreen were considered as active. All others were labeled as inactive. While merging the data from multiple protocols, compounds with contradictory results in different experimental runs were removed from the study. For the first round of modeling, the data set was comprised of 8474 compounds (319 active and 8155 inactive). Enriching this data set with compounds identified in the first round of virtual screening and experimentally tested in the first round of screening, resulted in a data set of 9046 compounds (456 active and 8590 inactive).
Descriptor Calculation
Three different sets of descriptors were calculated for all data sets using RDKit (https://www.rdkit.org/).
-
1.
RDKit descriptors based on the two-dimensional structure (119 descriptors in total).
-
2.
Morgan fingerprints (1024 bits).
-
3.
Avalon fingerprints (1024 bits).
Training and Test Set Selection
From each class (active, inactive), 70% of the data were randomly selected and used as a training set. The remaining 30% of compounds were considered as the test set. Five-fold external cross-validation was omitted since pharmacophore modeling is computationally expensive and the selection of the best consensus model combining pharmacophore and machine learning approaches requires the established training and the test set. We emphasize that the selected consensus model was used in virtual screening and thus, prospectively validated. The composition of the resulting data sets is shown in Table 1.
Table 1. Overview of the Data Sets Used in This Study.
| total compounds | active | inactive | imbalance ratio (inactive/active) | |
|---|---|---|---|---|
| First Round | ||||
| full data set | 8474 | 319 | 8155 | 26:1 |
| training set | 5931 | 223 | 5708 | 26:1 |
| test set | 2543 | 96 | 2447 | 25:1 |
| Second Round | ||||
| full data set | 9046 | 456 | 8590 | 19:1 |
| training set | 6332 | 319 | 6013 | 19:1 |
| test set | 2714 | 137 | 2577 | 19:1 |
Virtual Screening Libraries
To discover compounds active against SARS-CoV-2, we performed virtual screening using two of our internal libraries (∼140k compounds). These libraries contain a diverse collection of small molecules with an emphasis on medicinal chemistry-tractable scaffolds. The compound libraries were curated using the same protocol described in the Data set Curation section. These compounds were screened against the model and rank ordered based on the predicted activity score, which roughly corresponds to their probability of being active against SARS-CoV-2.
Machine Learning: Stratified Bagging (SB)
Considering the high degree of data imbalance (active:inactive, 1:26), we used undersampling stratified bagging (SB); this method has been proven to be superior when dealing with imbalanced data sets.30 SB is a machine learning technique based on an ensemble of models developed using multiple training data sets sampled from the original training set. It uses a traditional bagging approach (resampling with replacement) to create the training set of positive samples and randomly selects the same number of samples from the majority class. Thus, the total bagging training set size is double the minority class. Several models are then built and predictions are averaged to produce a final ensemble model output. Because of random sampling, about 37% of the compounds are left out in each run. These samples form “out-of-the-bag” sets, which are then used to test the final model. Although a small set of samples are selected each time, most compounds contribute to the overall bagging procedure since data sets were generated randomly. Random forest (RF) was used as a base classifier.31 The number of trees was arbitrarily set to 100 (default) since it has been shown that the optimal number of trees is usually 64–128, while further increasing the number of trees does not necessarily improve the model’s performance.32
Consensus QSAR modeling is another highly recommended approach that has been reported to outperform simple QSAR models.33,34 In this study, we used a consensus approach that utilizes the consensus of the predictions from three different descriptors to predict anti-SARS-CoV-2 activity.
Pharmacophore-Based Screening
A pharmacophore describes the spatial arrangement of essential interactions of a drug with its respective binding site. Pharmacophore modeling and subsequent virtual screening (VS) is a well-established method utilized in drug discovery.35,36 In this study, the generation of ligand-based pharmacophore models, their subsequent refinement, and virtual screening (VS) were performed with LigandScout 4.4 Advanced (Inte:Ligand GmbH). The conformational libraries for both pharmacophore modeling and the VS process were created with i:Con (max. 200 conformations per compound), a conformer generator implemented in LigandScout.37 To design the ligand-based pharmacophore model (LBP), the most potent compounds were selected based on the IC50 (<30 μM) and MaxResponse (>50.0%) values in the CPE assay. The molecules were clustered based on pharmacophore-based similarity (cluster distances 0.4, 0.6, 0.7, and 0.8, respectively). For each cluster obtained from different distance thresholds, merged-features pharmacophore (MFP) and shared-features pharmacophore (SFP) models were generated, which incorporate the features of selected compounds per cluster. A MFP merges all pharmacophore features for different molecules (in each cluster) into a single pharmacophore, interpolating the overlapping features. In comparison, an SFP contains a collection of overlapping pharmacophore features from different molecules (per cluster).38 These features allow two or more similar bio-active molecules to bind to the macromolecule in a comparable way and trigger similar biological responses. Owing to the abstract nature of pharmacophore models, they represent an efficient approach for the virtual screening of large compound libraries.39 To be more robust, we incorporated both MFP and SFP for our virtual screening. Furthermore, a good pharmacophore model should not only be able to estimate the activity of active compounds but also have the ability to identify active molecules from a database containing a large number of inactive compounds. To select the best models for screening, we applied these models on our complete data set (training and test set combined) and calculated the percentage of active and inactive that hit these pharmacophore models. The models that could identify 20% more active than inactive compounds were selected for the final virtual screening. The ligand-based pharmacophore models generated in the first and second rounds of screening are referred to as LBP-1 and LBP-2, respectively. The screening was performed using the iscreen module with default settings, with the maximum number of omitted features set to 2.
First Round of In Silico Screening
The complete collection of 138,749 compounds was tested against our stratified bagging models and ranked by the prediction score. This score takes a value between 0 and 1, indicates the probability of a compound to be active against SARS-CoV-2. In the first round of screening, we selected the top 300 predictions from each descriptor combination; 890 compounds were predicted to be in the top 300 prediction scores by at least two of the four models. We then retrieved all generated conformations of these 890 compounds prepared from the i:Con37 and screened them against our pharmacophore models (LBP-1) (Table S1 in the Supporting Information). Finally, we ranked the compounds according to their pharmacophore-fit score. The top 320 compounds were selected for experimental validation in the SARS-CoV-2 CPE assay and CTG counterscreen.
Second Round of In Silico Screening
After obtaining results from the first round of modeling, followed by experimental validation, we updated our machine learning (SB) and ligand-based pharmacophore (LBP) model with the confirmed SARS-CoV-2 active and inactive compounds. We then removed the 320 compounds tested in the first round of experimental validation from our virtual screening library. The remaining compounds (138,429 compounds) were predicted using our updated stratified bagging models (SB-2) and ranked by the prediction score. In the second round of screening, we selected the top 500 predictions from each descriptor combination. This resulted in a subset of 1,325 compounds that were consistently present in the list of top predictions by at least two of the four models. We screened 138,429 compounds using the updated ligand-based pharmacophore models (LBP-2) shortlisted for screening (Table S2 in the Supporting Information). This gave us 65,952 compounds. We then ranked these compounds according to their pharmacophore fit and selected 320 compounds that were overlapping with 1,325 compounds for experimental validation.
Model Performance Assessment
Receiver operating characteristic area under the curve (ROC AUC) was used to assess the performance of the models. ROC AUC plots sensitivity (TP/(TP + FN)) against 1-specificity (TN/(TN + FP)). The higher the ROC AUC value, the better the model performs in distinguishing between active and inactive compounds. A ROC AUC value of 1.0 indicates a perfect classification model, whereas a value close to 0.5 indicates that the model provides random predictions. The ROC AUC score was calculated using the ROC curve (javascript) node in KNIME.40 For the experimental validation results, the model performance was measured by the positive predicted value (PPV = TP/(TP + FP)). Based on earlier studies, we chose PPV and AUC as our model performance metrics.41,42
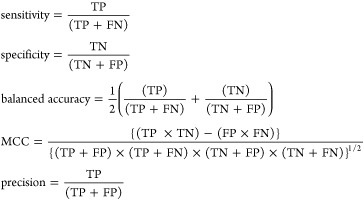 |
where TP are true positives, TN are true negatives, FP are false positives, FN are false negatives, and MCC is Matthews correlation coefficient.
Experimental Testing
SARS-CoV-2 Cytopathic Effect Assay
The cytopathic effect (CPE) of SARS-CoV-2 was measured in Vero-E6 cells in a BSL-3 facility as described previously.10 Cells were harvested, resuspended at 160 000 cells/mL in assay media (minimal essential medium, MEM, 2% (v/v) heat inactivated fetal bovine serum, FBS, 1% 4-(2-hydroxyethyl)-1-piperazineethanesulfonic acid, HEPES, 1% Pen/Strep/GlutaMax), and inoculated with SARS-CoV-2 (USA_WA1/2020) at a multiplicity of infection (MOI) of 0.002. Twenty-five microliters of the cell–virus mixture was dispensed per well of an assay-ready 384-well plate (Greiner, #781091). The assay-ready plates were prepared by adding 5 μL of assay media per well, prespotted with 60 nL of library compounds at a five-point serial dilution with concentrations ranging from 10 mM to 62 μM (final assay concentrations ranging from 20 μM to 124 nM) using an acoustic dispenser (Echo550, Labcyte, Inc.). Each plate contained two columns with 60 nL of dimethyl sulfoxide (DMSO) as negative (no inhibitor) control and 24 wells containing cells only (no virus) as a positive control. Plates were incubated for 72 h at 37 °C, 5% CO2, 90% humidity. The cell viability was assessed by measuring the luminescence signal with Envision plate reader (PerkinElmer) after the addition of 30 μL/well of CellTiter-Glo reagent (Promega, Cat #G7573) and 10 min incubation at room temperature. The signal was normalized against negative (0% response) and positive control (100% response), and the resulting percent of inhibition data were fitted to a sigmoidal dose-response curve using the four-parameter Hill equation.
CellTiter-Glo Counterscreen
The assay was set up in the same way as in the CPE assay but omitting the addition of virus. DMSO and hyamine at 100 μM final concentration served as negative and positive controls, respectively. The obtained luminescence signal was normalized against negative control (0% response) and positive control (−100% response).
SARS-CoV-2 Mpro Assay
The ability of the compounds to inhibit the recombinant Mpro activity was measured by a biochemical assay, SARS-CoV-2 Mpro assay described previously.43
ACE2-RBD AlphaLISA Proximity Assay
The interaction of SARS-CoV-2 receptor-binding domain (RBD) with ACE2 was tested using an AlphaLISA proximity assay in combination with a corresponding TruHits counter assay as described elsewhere.44
Microscale Thermophoresis Assay
The binding of compounds to recombinant human ACE2 (Sino Biological, Cat #: 10108-H08H) was evaluated by microscale thermophoresis (MST). His-tagged ACE2 was labeled with RED-tris-NTA second generation dye (Nanotemper Technologies, Cat #: MO-L018) following manufacturer’s protocol and diluted in MST buffer (10 mM HEPES pH 7.4, 150 mM NaCl, 10 mM CaCl2, 0.01% Tween-20) to a final concentration of 3 nM. Hundred nanoliters of compounds in 2-fold dilution series were transferred to 384-well compound plate (Greiner, Cat #: 784201-1B) using an Echo 650 series acoustic dispenser (Labcyte Inc.), mixed with 10 μL of labeled protein and incubated for 15 min at room temperature (RT). MST traces were collected using a Monolith NT.Automated (Nanotemper Technologies) unit and a standard treated capillary chip (Nanotemper Technologies, Cat #: MO AK002) with following setting: 45% excitation power, medium MST power, and MST periods of 3 s/10 s/1 s. Kd values were calculated by fitting the change in the normalized fluorescence signal of the thermograph using MO.Affinity analysis software.
ACE2 Enzymatic Assay
ACE2 enzyme activity was monitored in a fluorometric assay. Briefly, 25 nL of compounds were transferred to the 1536-well assay plate (Greiner, solid black medium-binding plates) using an Echo 650 (Labcyte Inc.) acoustic dispenser. Typically, 3 μL/well of 0.27 nM ACE2 (0.2 nM final concentration) suspension in assay buffer (PBS, pH 7.4, 0.01% Tween-20) was dispensed into assay plate with an Aurora Discovery BioRAPTR Dispenser (FRD; Beckton Dickenson) and incubated 15 min at room temperature (RT). Typically, 1 μL/well of 60 μM ACE2 substrate (AnaSpec, Cat #: AS-60757) was then added. The plate was centrifuged at 1000 rpm for 15 s and the fluorescence was detected with the PHERAstar plate reader (BMG Labtech) equipped with Module 340/440 at t1 = 0 min and t2 = 15 min at RT. Data was normalized to enzyme activity in the presence of DMSO, set as 0%, and in the presence of 6.2 μM MLN-4760, set as −100% inhibition. The resulting percent of inhibition data were fitted to a sigmoidal dose-response curve using a four-parameter Hill equation.
Pseudotyped Particle (PP) Entry Assay
Expi293F cells with stable expression of human ACE2 (HEK293-ACE2, Codex Biosolutions, Cat #: CB-97100-220) were seeded in white, solid bottom 384-well microplates (Greiner BioOne) at 6000 cells/well in 30 μL/well medium (DMEM, 10% FBS, 1× l-glutamine, 1× Pen/Strep, 1 μg/mL puromycin) and incubated at 37 °C with 5% CO2 overnight (∼16 h). One hundred fifty nanoliters of compounds at 11-point titration, 1:3 dilution in DMSO, were dispensed via an Echo 650 (Labcyte Inc.) acoustic dispenser to assay plates. Cells were incubated with the test compounds for 1 h at 37 °C with 5% CO2, before 2 μL/well of SARS-CoV-2-S PPs were added. PPs with the following spike variants were used: wild type (Codex Biosolutions, Cat #: CB-97100-154), South African variant B.1.351 (Codex Biosolutions, Cat #: CB-97100-154), and U.K. variant B.1.1.7 (Codex Biosolutions, Cat #: CB-97100-153). The plates were spinoculated by centrifugation at 1500 rpm (453g) for 45 min at RT and incubated for 48 h at 37 °C with 5% CO2 to allow cell entry of PPs and expression of a luciferase reporter. After the incubation, the supernatant was removed with gentle centrifugation using a Blue Washer (BlueCat Bio). Typically, 4 μL/well of the Bright-Glo Luciferase detection reagent (Promega) was added to assay plates and incubated for 5 min at RT. The luminescence signal was measured using a PHERAStar plate reader (BMG Labtech). Data were normalized against wells inoculated with SARS-CoV-2-S PPs as 100% entry and wells inoculated with “bald” PPs (containing no spike protein) as 0%.
An ATP content cytotoxicity assay was done as a counter assay. HEK293-ACE2 cells were seeded in white, solid bottom 384-well microplates (Greiner BioOne) and treated with compounds under the same experimental conditions as in the PP entry assay, omitting the inoculation step. After 48 h incubation, 4 μL/well of ATPLite (PerkinElmer) was added to assay plates and incubated for 15 min at RT. The luminescence signal was measured using a Viewlux plate reader (PerkinElmer). Data were normalized with wells containing cells as 100% and wells containing media only as 0%.
Results
Hybrid Approach for In Silico Screening
A combination of ligand- and structure-based methods has been used previously to discover small-molecule modulators of various targets,35,36,45 since it improves the precision and reduces false positives.46 In this study, we combined QSAR modeling with pharmacophore-based screening to identify novel chemotypes active against SARS-CoV-2. We used a consensus of the predictions based on the two approaches (Figure 1) to select compounds for experimental validation.
Model Performance—Stratified Bagging
The performance of QSAR models based on different combinations of descriptors and stratified bagging (SB) approaches is provided in Table S3 in the Supporting Information. It was measured by different metrics, including the receiver operating characteristic area under the curve (ROC AUC). All developed models showed ROC AUC values > 0.75. In the first round of modeling, the consensus of descriptors (RDKit, Morgan and Avalon) provided the best performance with ROC AUC = 0.80 on the test set. SB models generated in the first round of screening are referred to as SB-1. After obtaining the experimental results from the first round of virtual screening, we updated our SB model (referred to as SB-2). In the second round of modeling, the consensus of descriptors (RDKit, Morgan and Avalon) showed improved results with ROC AUC = 0.84 on the test set.
Ligand-Based Pharmacophore Modeling
For the first round of ligand-based pharmacophore modeling (LBP-1), we used 48 active compounds: clustering based on pharmacophore-based similarity (cluster distances of 0.4, 0.6, 0.7, and 0.8), followed by generation of ligand-based hypotheses led to a total of 44 pharmacophore hypotheses (merged-features pharmacophore (MFP) and shared-features pharmacophore (SFP)). Taking the computational constraints into account, 15 pharmacophore models that hit the majority (>20%) of active versus inactive (Table S1 in the Supporting Information) were selected for virtual screening. For the second round, referred to as LBP-2, we considered 53 actives and followed the same protocol as above. This resulted in 55 pharmacophore hypotheses (MFP and SFP). Pharmacophore models (20) were then selected for virtual screening. All pharmacophore hypotheses generated in this study are presented in the Supporting Information (Table S2 in the Supporting Information). In general, pharmacophoric sites such as hydrogen bond acceptor (HBA), hydrogen bond donor (HBD), aromatic ring, hydrophobic sites, and positive ionizable groups were prudently characterized.
Experimental Testing of the First Round In Silico Screening Hits
The 320 compounds selected from the first round of in silico screening (see the Materials and Methods section for details) were tested in the CPE assay in a five-point dilution series, with concentrations ranging from 20 μM to 124 nM. To exclude compounds with cytotoxic effects, the compounds were counterscreened in a cell viability assay. Out of the 320 compounds tested, 46 compounds showed a SARS-CoV-2 CPE inhibiting activity with a maximum response (MaxResponse) greater than 30% and IC50 values of 3–15 μM. Of these 46, 42 compounds did not show any cytotoxicity or modest toxicity with an efficacy <25% (Table S4 in the Supporting Information). This provided a positive prediction value (PPV) (i.e., the fraction of model predicted positives that are experimentally confirmed) of 13%, which is 3-fold higher than the PPV calculated from the training set (PPV = 4%).
Experimental Testing of the Second Round In Silico Screening Hits and Validation
The selected 320 compounds from the second round of in silico screening (see the Materials and Methods section for details) were also tested in the CPE assay in a five-point dilution series, with concentrations ranging from 20 μM to 124 nM. For the second round testing, out of the 320 compounds, 65 compounds were identified with anti-SARS-CoV2-2 activity having a MaxResponse >30% and IC50 values of 3–15 μM. Of these 65 compounds, 58 did not show any cytotoxicity or minimal toxicity (efficacy < 30%; Table S5 in the Supporting Information). Moreover, 27 of these 58 compounds exhibited an IC50 ≤ 10 μM in the CPE assay. This further improved the PPV value to 18%.
For validation, 69 compounds were “cherry-picked” and retested in the CPE assay in duplicate as an eight-point dilution series, with concentrations ranging from 20 μM to 78 nM. Fifty-three of the retested compounds were confirmed to have CPE inhibitory activity with an efficacy > 30% and IC50 of 5–25 μM; five exhibited an IC50 ≤ 10 μM with no notable cytotoxicity (Table S6 in the Supporting Information). The five most potent and efficacious compounds (1–5) from the follow-up CPE assay are shown in Table 2, along with associated in vitro ADME/physicochemical properties.
Table 2. Five Most Potent and Efficacious Compounds Identified, along with In Vitro/Physicochemical ADME Data.
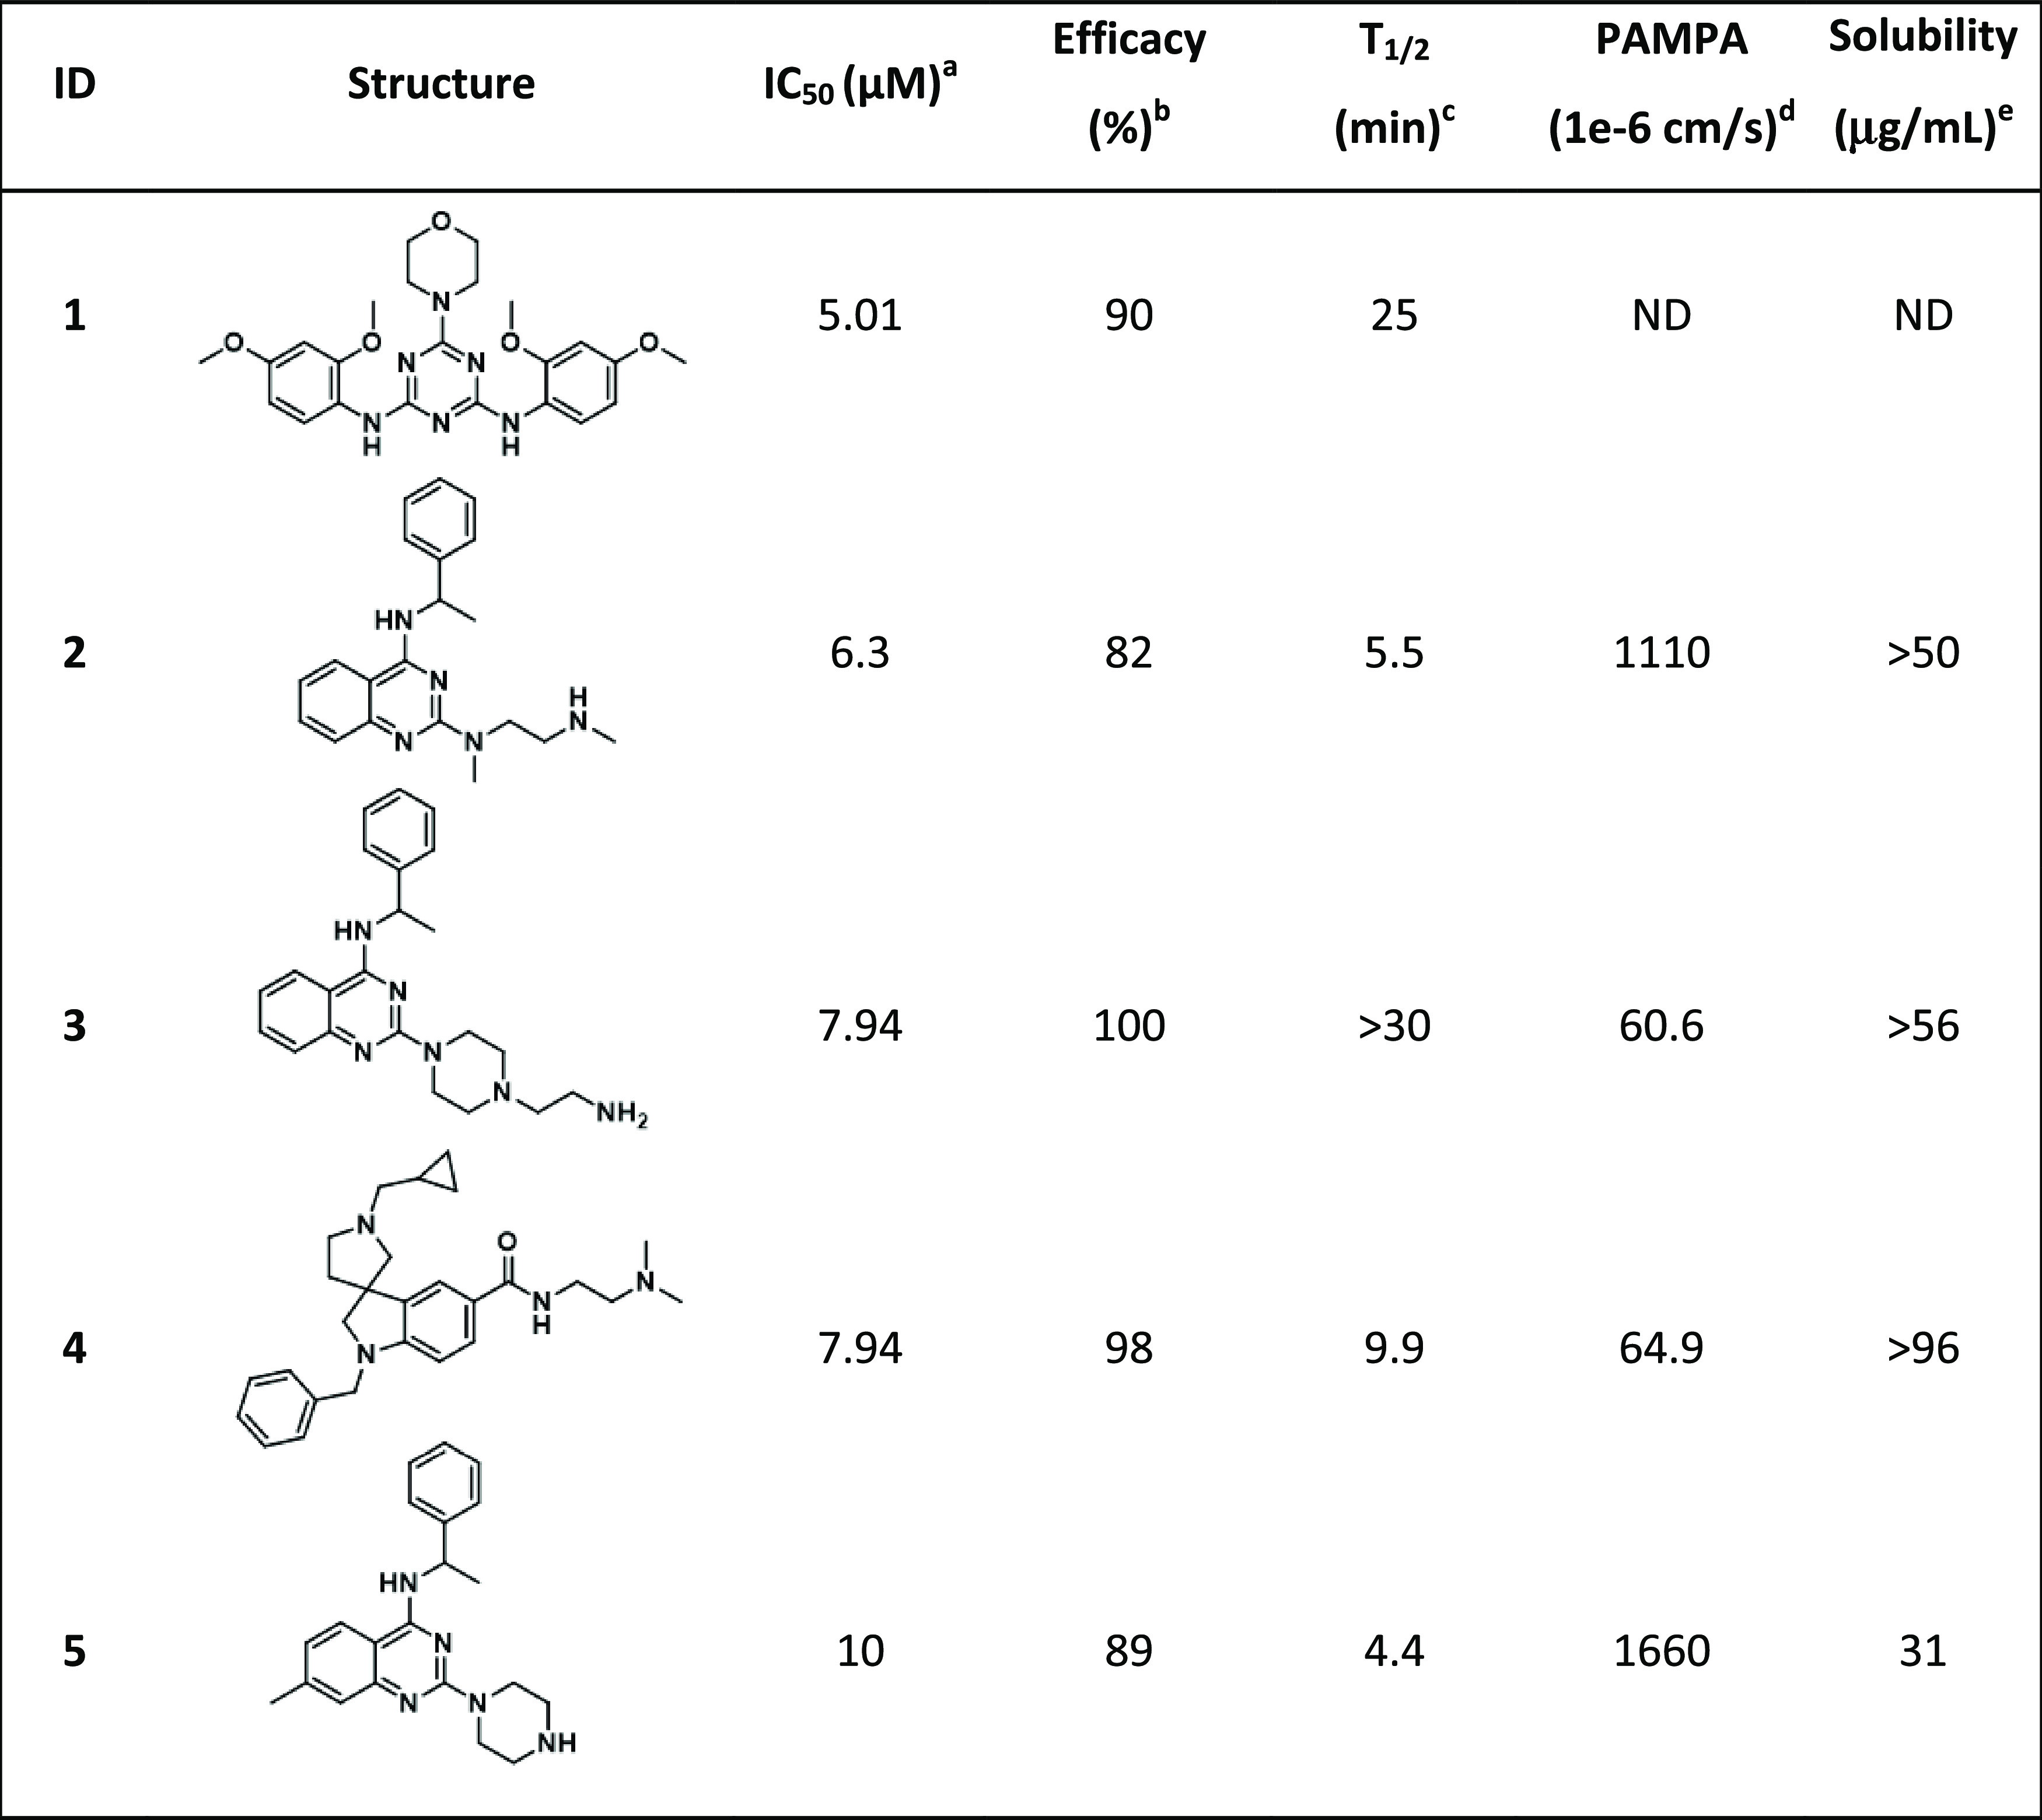
IC50: half-maximal inhibitory concentration value obtained from the CPE assay in eight-point dose response, measured in duplicate.
Efficacy: maximum inhibitory effect observed in CPE assay.
T1/2: metabolic half-life measured in rat liver microsome fractions reported in minutes, with a minimum detectable half-life of 1 min.47
Parallel artificial membrane permeation assay (PAMPA) is reported as a metric of the passive permeability of the compounds (1 × 10⁻⁶ cm/s).48,49
Solubility—pION μSOL assay for kinetic aqueous solubility determination, pH 7.4.50
Clustering and Preliminary SAR Analysis
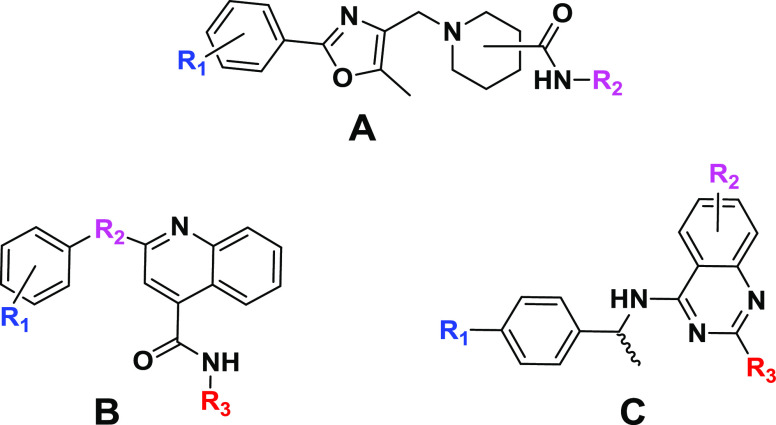
Hierarchical cluster analysis of the 100 active compounds revealed three promising chemotypes (Figure 2), where three or more active structural analogues were identified (IC50 ≤ 15 μM and efficacy ≥ 70%) and no notable cytotoxicity (IC50 ≤ 30 μM). Importantly, some preliminary structure–activity relationships (SAR) could be established for chemotypes, where the analogues analyzed (and present in in-house compound libraries) were structurally similar enough for direct comparison. The most promising analogues from each of the three chemotypes, activity in the CPE assay, as well as in vitro physicochemical properties are shown in Tables 3–5.
Figure 2.
Three chemotypes (A–C) were identified as active in the CPE assay.
Table 3. Notably Active Chemotype A Which Shows No Notable Cytotoxicity (IC50 ≤ 30 μM).
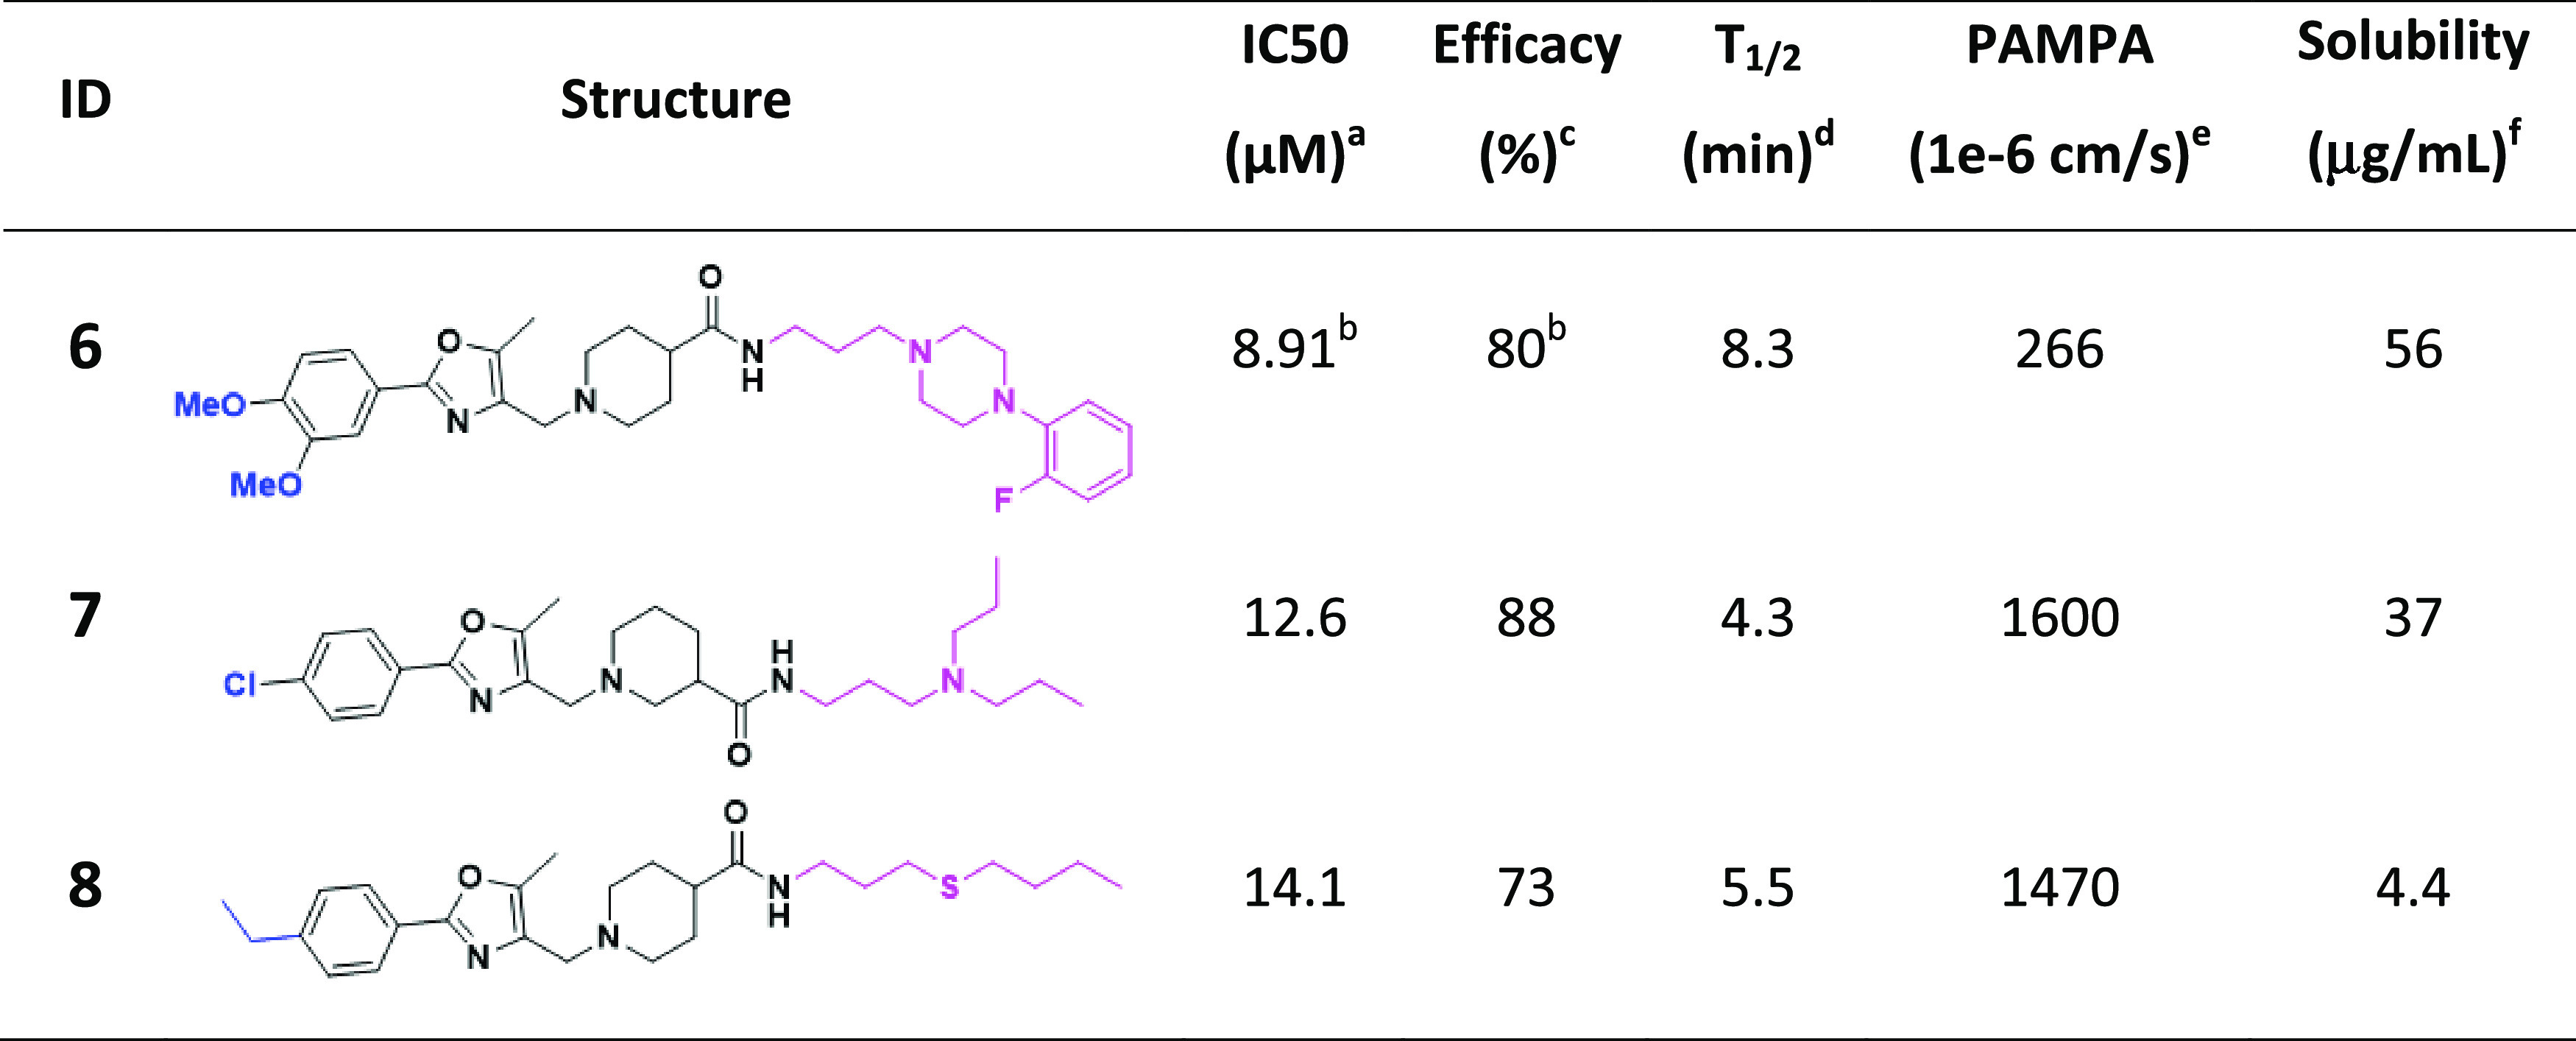
IC50: half-maximal inhibitory concentration values obtained from the CPE assay in eight-point dose response, measured in duplicate.
Values represent data obtained from five-point dose response, measured in duplicate.
Efficacy: maximum inhibitory effect observed in CPE assay.
T1/2: metabolic half-life measured in rat liver microsome fractions reported in minutes, the minimum detectable half-life of 1 min.47
Parallel artificial membrane permeation assay (PAMPA) is reported as a metric of the passive permeability of the compounds.48,49
Solubility—pION μSOL assay for kinetic aqueous solubility determination, pH 7.4.50
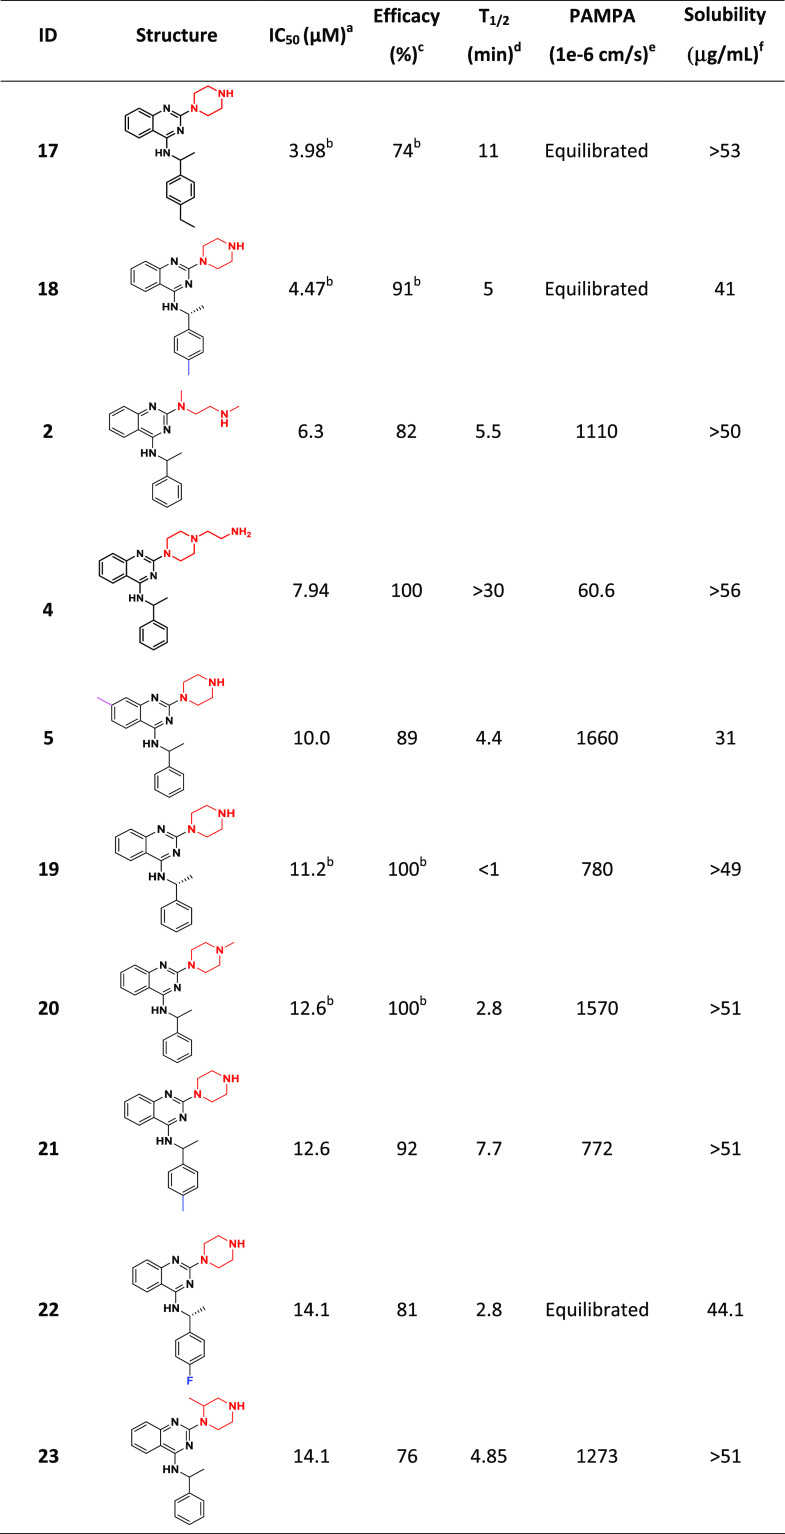
Table 5. Notably Active Chemotype C Which Shows No Notable Cytotoxicity (IC50 ≤ 30 μM).
IC50: half-maximal inhibitory concentration values obtained from the CPE assay in eight-point dose response, measured in duplicate.
Values represent data obtained from five-point dose response, measured in duplicate.
Efficacy: maximum inhibitory effect observed in CPE assay.
T1/2: metabolic half-life measured in rat liver microsome fractions reported in minutes, a minimum detectable half-life of 1 min.47
PAMPA (parallel artificial membrane permeation assay) is reported as a metric of the passive permeability of the compounds.48,49
Solubility—pION μSOL assay for kinetic aqueous solubility determination, pH 7.4.50
Within chemotype A, 26 analogues were tested from internal compound libraries and upon screening, three (compounds 6–8) have IC50 values ranging from 8.9 to 14.1 μM and efficacy ≥ 83% (Table 3). Although conclusive SAR trends were limited, the anti-SARS-CoV-2 activity (and cytotoxicity) is sensitive to substitutions on the phenyl ring attached to oxazole and both the position (3- vs 4-) and structure of the piperidinyl amide.
Within chemotype B were 18 in-house structural analogues, eight of which (compounds 9–16) have promising IC50 and efficacy values (Table 4). Analogues of this cluster were too structurally very diverse to analyze for conclusive SAR trends. With the exception of 10 which suffers from poor solubility, CPE-actives from this series have favorable solubility and permeability. Similar to chemotype A, all suffer from short metabolic half-time (T1/2) in rat liver microsomes.
Table 4. Notably Active Chemotype B Which Shows No Notable Cytotoxicity (IC50 ≤ 30 μM).
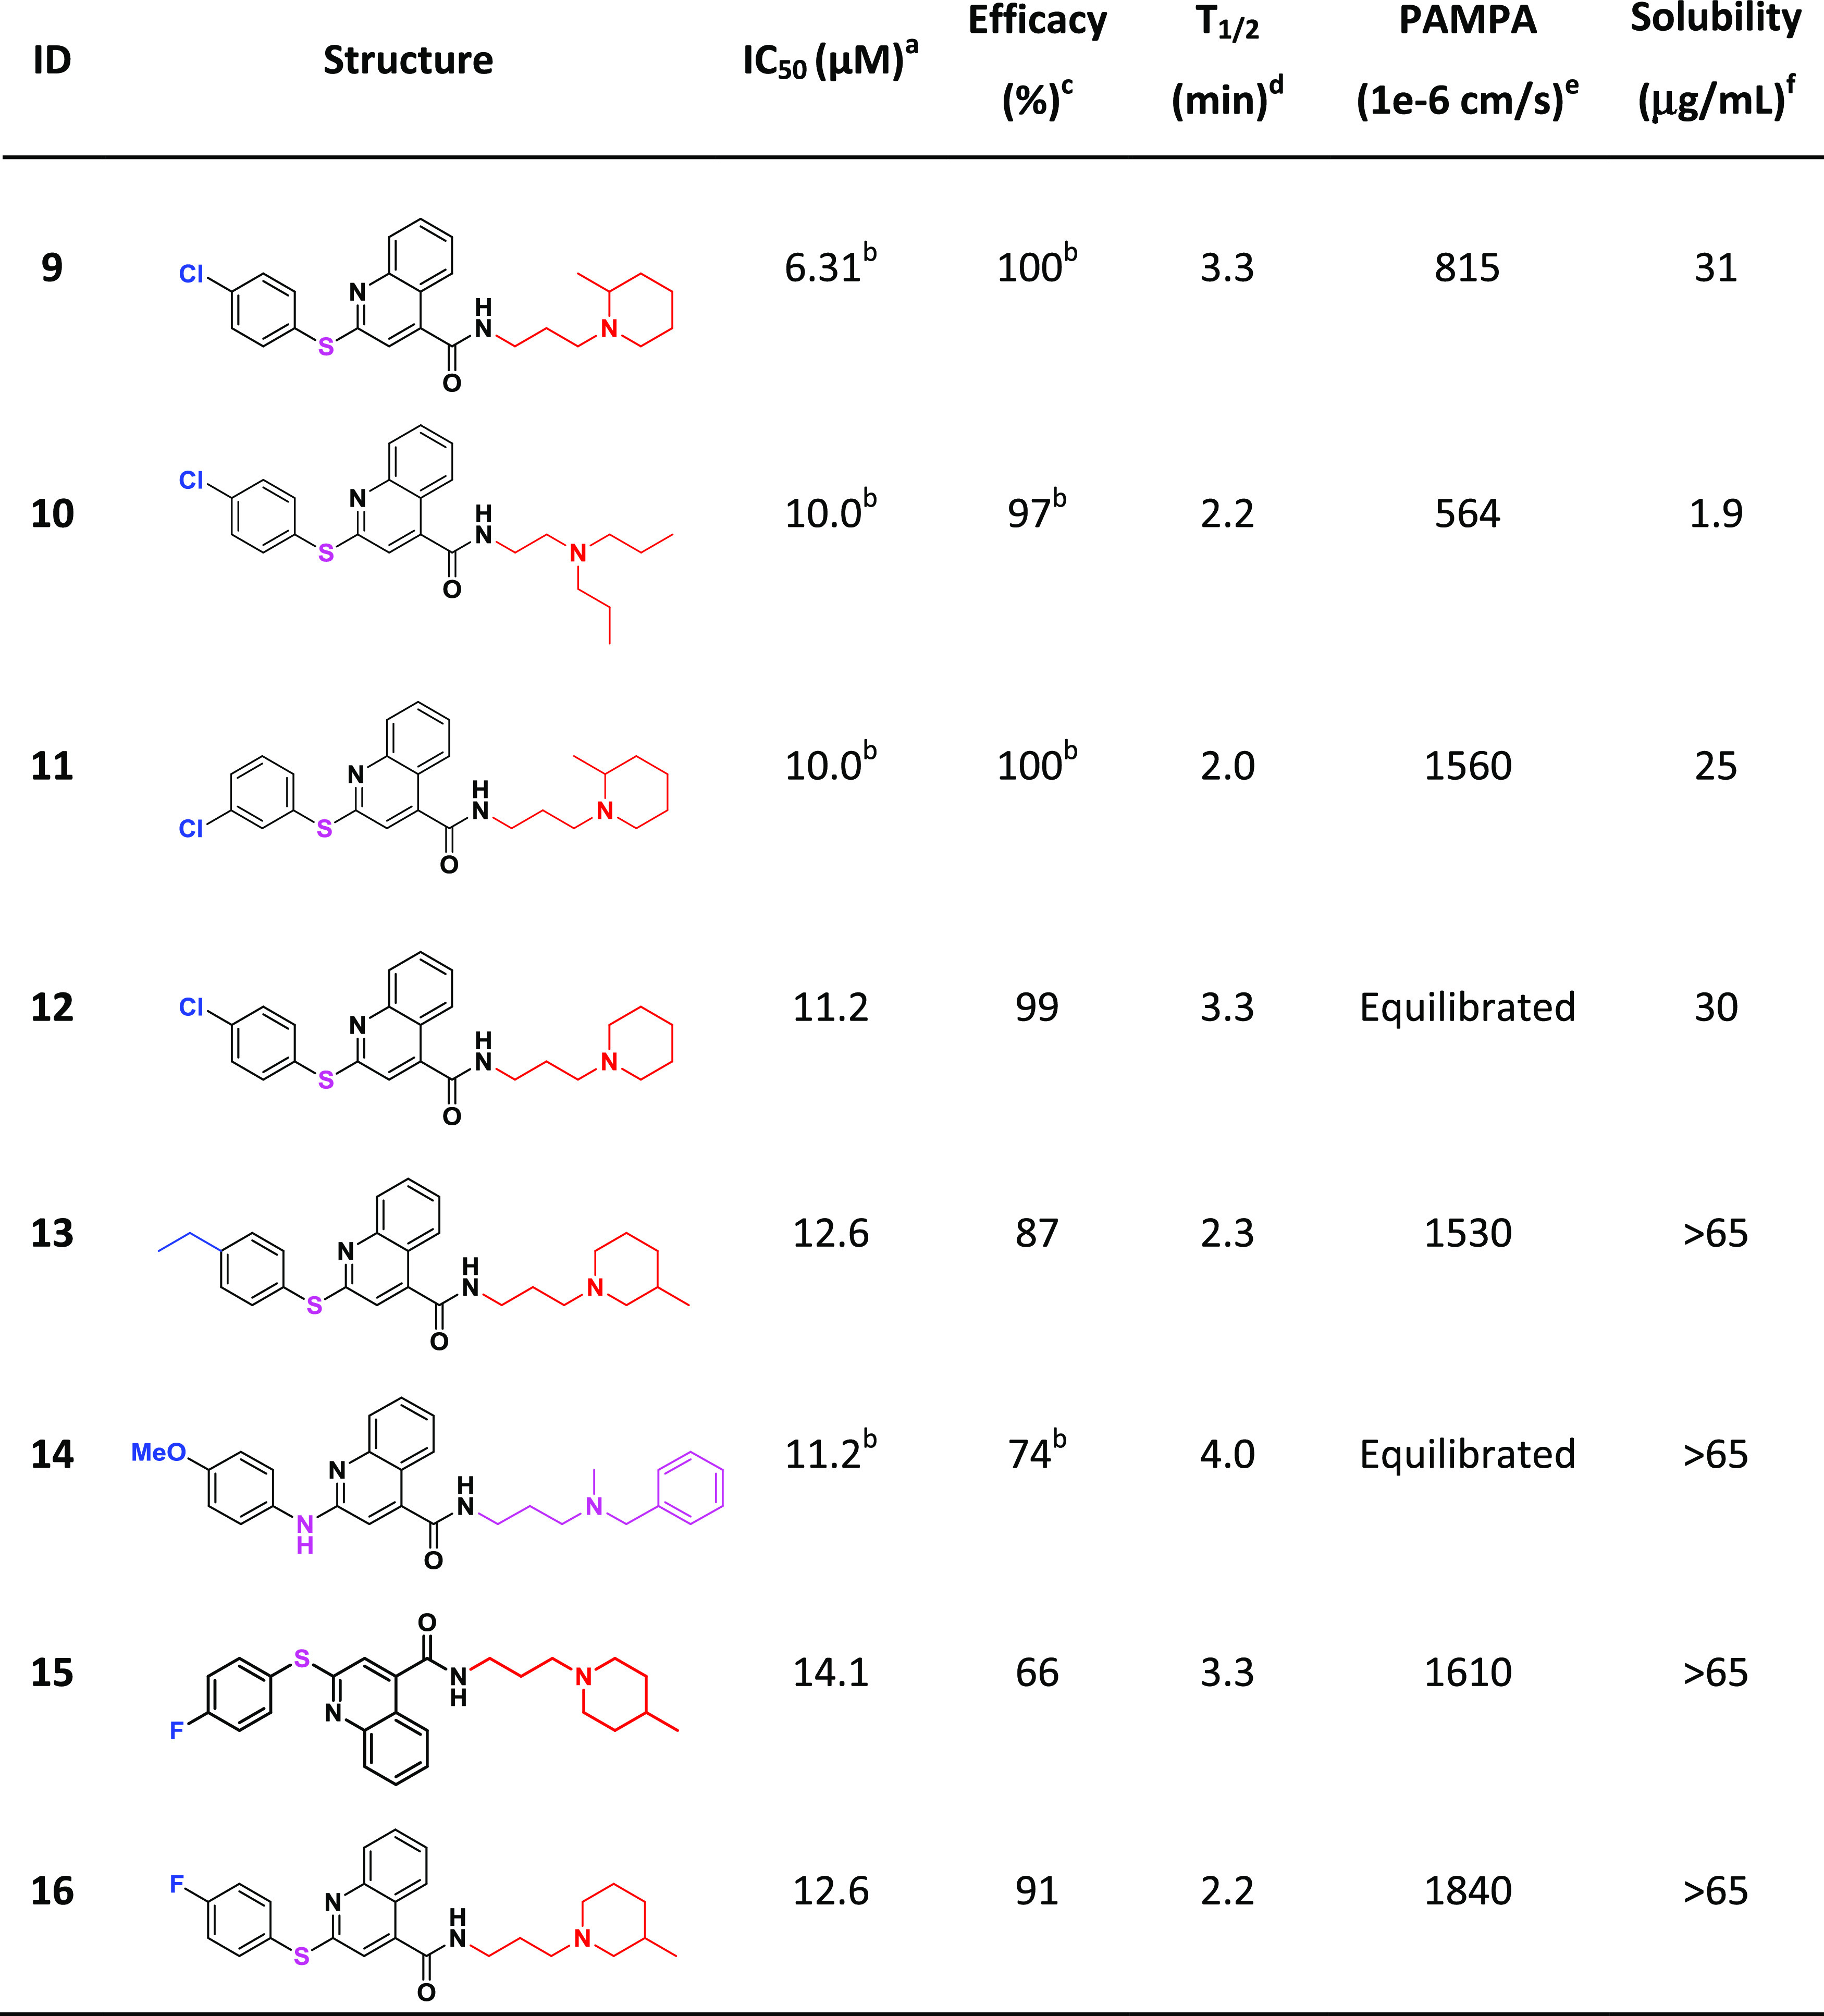
IC50: half-maximal inhibitory concentration values obtained from the CPE assay in eight-point dose response, measured in duplicate.
Values represent data obtained from five-point dose response, measured in duplicate.
Efficacy: maximum inhibitory effect observed in CPE assay.
T1/2: metabolic half-life measured in rat liver microsome fractions reported in minutes, minimum detectable half-life of 1 min.47
PAMPA (parallel artificial membrane permeation assay) is reported as a metric of the passive permeability of the compounds.48,49
Solubility—pION μSOL assay for kinetic aqueous solubility determination, pH 7.4.50
Quinazoline-containing chemotype C provided 10 promising analogues (compounds 2, 4, 5, 17, 18, 20–23), including three (2, 4, 5) of the most active compounds identified in the study (Table 5). Most of the notably active analogues contain variously substituted piperazines at the two position of the quinazoline core and 2-methyl-benzylamine at the four position. However, the open-chain (vs piperazine) analogue (2) is also quite active, suggesting that a two-position diamine with an ethylene spacer is perhaps part of the parent pharmacophore. Methyl- and ethyl-substitutions off the four position of the benzylamine phenyl ring (18 and 17, respectively) were well tolerated, while 4-fluoro (22) and 4-phenyl substituents reduced the activity. Similar to chemotypes A and B, this series has favorable solubility and permeability but suffers from poor metabolic T1/2. However, it seems that the metabolic liability can be mitigated via the addition of an N-aminoethyl group off the piperazine ring (4; T1/2 > 30 min).
Mechanism of Action Studies
In efforts to elucidate the mechanism of action against SARS-CoV-2, significantly active compounds were tested for their activity against some key events necessary for viral entry and replication. The SARS-CoV-2 main protease (Mpro) represents an attractive target for antiviral drug development because its inhibition prevents the formation of mature functional viral proteins and, thus, viral replication.51 As such, active compounds were screened in the SARS-CoV-2 Mpro enzymatic assay; however, no activity was observed.
Compounds were also tested for their ability to interrupt the binding of the SARS-CoV-2 receptor-binding domain (RBD) of the spike protein to the host receptor ACE2, using an AlphaLisa proximity assay in combination with a counter assay to identify false-positive hits. All compounds tested showed activity in both RBD-ACE2 AlphaLisa and in the TruHit counterscreen (see the Methods section for details), rendering the results inconclusive.
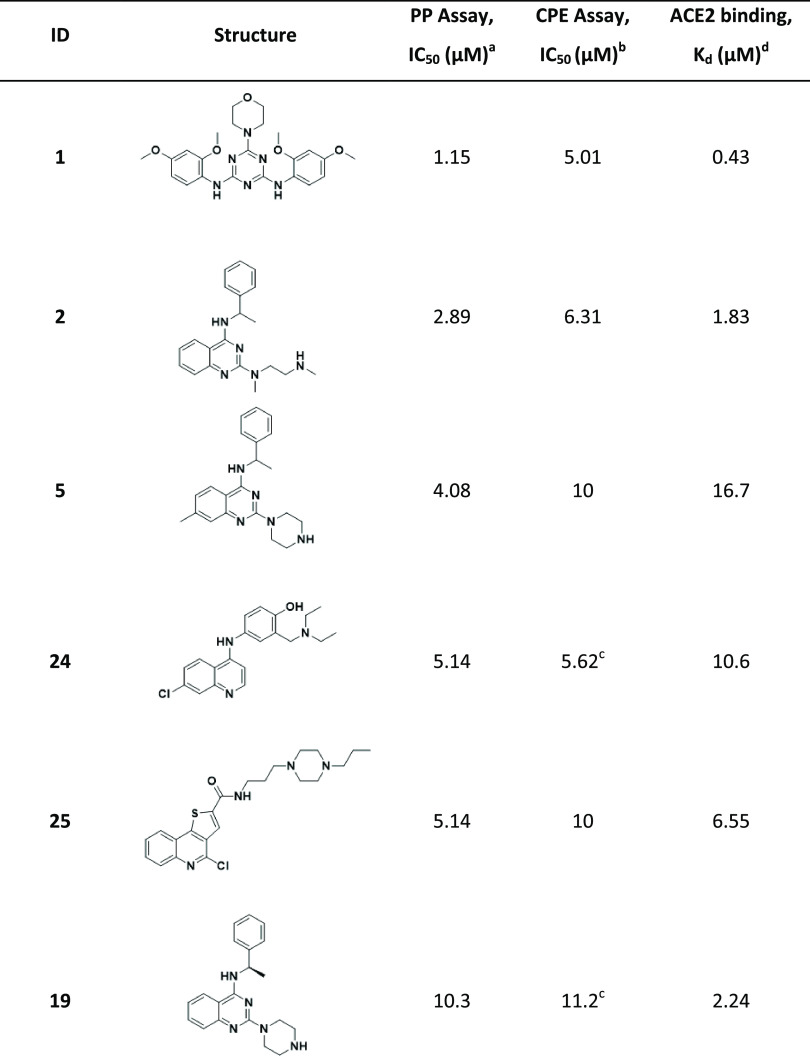
Nonetheless, we determined whether compounds could bind ACE2 using microscale thermophoresis (MST); they were subsequently tested in a SARS-CoV-2 pseudoparticle (PP) entry assay to explore if an ACE2-binding compound could interfere with viral entry. In parallel, the compounds were tested in an ACE2 enzymatic assay. Six compounds were identified as ACE2 binders with an equilibrium dissociation constant (Kd) ≤ 20 μM. No inhibitory or agonistic activity was observed in the ACE2 enzymatic assay (Table 6).
Table 6. Compounds Identified as ACE2 Binders and Inhibitors of Viral Entry in PP Assay.
Activity in the SARS-CoV-2 PP assay.
IC50: half-maximal inhibitory concentration values obtained from the CPE assay in eight-point dose response, measured in duplicate.
Values represent data obtained from five-point dose response, measured in duplicate.
ACE2-binding affinity (Kd) measured by MST.
All six ACE2-binding compounds were able to inhibit the PP entry into ACE2-overexpressing HEK293 cells, where the molecule with the strongest affinity to ACE2 showed the highest activity in PP entry inhibition (Table 6). Since these compounds do not bind S protein, we hypothesized that their activity should be independent of S protein sequence and, thus, active against different strains of SARS-CoV-2. Therefore, we tested them against other strains of SARS-CoV-2; compounds inhibited the entry of pseudoparticles bearing S proteins of South African B.1.351 and UK B.1.1.7 variants with the same or greater potency versus wild type (Figure 3).
Figure 3.
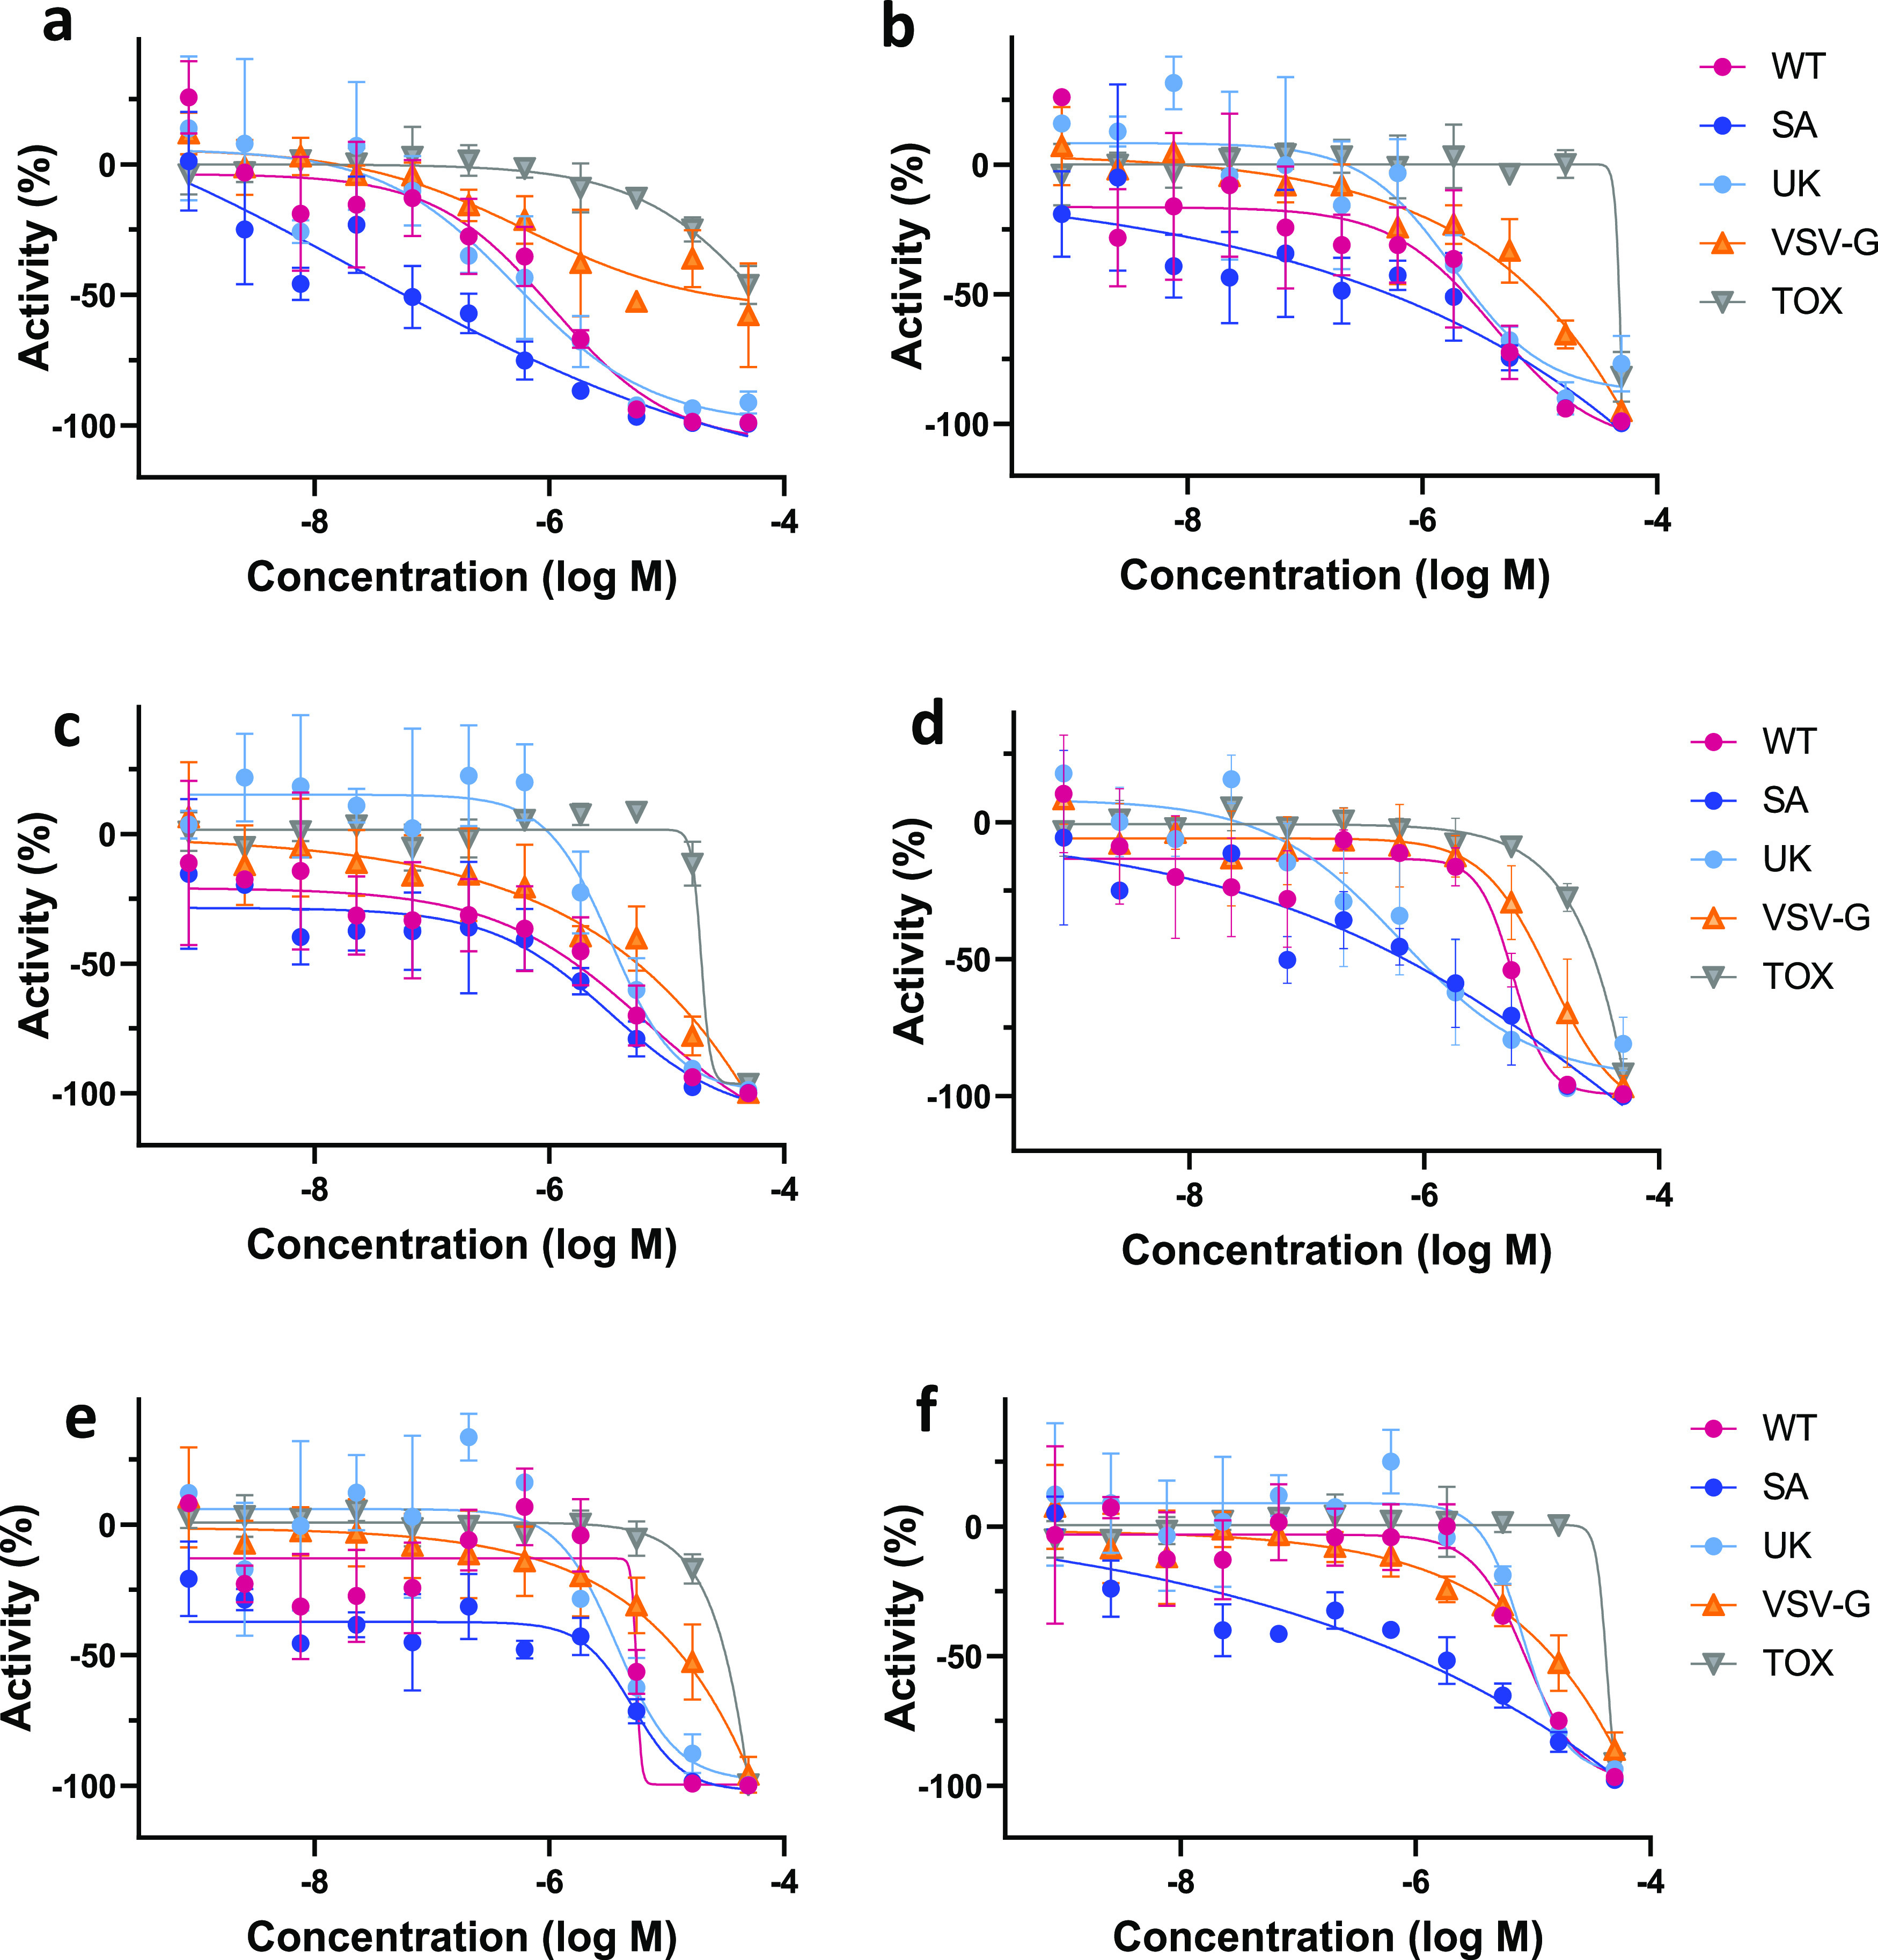
Dose-response curves of the six ACE2-binding compounds in PP and CTG assays. (a) Compound 1, (b) compound 2, (c) compound 5, (d) compound 24, (e) compound 25, and (f) compound 19. WT—wild-type SARS-CoV-2 variant assay; SA—South African B.1.351 variant assay; UK—UK B.1.1.7 variant assay; VSV-G—PP assay containing the G-protein of vesicular stomatitis virus; and Tox—cytotoxicity assay.
Discussion
A traditional QSAR modeling approach relies on the assumption that the biological activity of small molecules is correlated with their physicochemical properties or the so-called structural descriptors;52−54 however, it does not consider the three-dimensional (3D) geometric features of the molecules. This results in an incomplete description of ligand–target interactions. Furthermore, QSAR models are also restricted to their applicability domain, i.e., the chemical space within which the models are originally trained.55 To overcome these shortcomings, a hybrid approach was developed which combines QSAR models with pharmacophore-based screening that can retrieve ligands with structurally diverse scaffolds.
Utilization of the hybrid approach led to 4-fold improvement of the hit rate and revealed multiple novel scaffolds with activity against SARS-CoV-2. More importantly, 44 compounds experimentally confirmed as active in the CPE reduction assay did not show appreciable cytotoxicity.
Further analysis of active analogues revealed some preliminary SAR, although trends were limited due to significant structural differences within the set of analogues. This supports the hypothesis that these compounds are acting on a common target or via a shared mechanism to inhibit viral proliferation. Overall, the chemotypes identified showed good efficacy and potency as screening hits.
In an effort to elucidate the mechanism of action, active compounds were screened against some previously established SARS-CoV-2 targets that have been shown to mediate antiviral activity: SARS-CoV-2 Mpro and RBD-ACE2 protein–protein interaction. None of the identified hits exhibited activity against these targets.
We identified six CPE-active compounds that are ACE2 binders and, likely as a direct result, are inhibitors of viral entry. Importantly, they were also able to inhibit the entry of pseudoparticles bearing spike protein from other variants of SARS-CoV-2 (South African B.1.351 and UK B.1.1.7) with similar or increased activity. As such, further development of these small molecules into drug candidates could provide therapeutic options less susceptible to common viral resistance mechanisms.
However, these compounds do not interrupt the RDB-ACE2 interaction. We assume allosteric binding to ACE2, as they do not inhibit ACE2 enzymatic activity; at the very least, they do not interfere with substrate binding. These inhibitors could interfere with the conformational change of S protein bound to ACE2 and/or influence the endosome environment, such as the pH decrease in the endosomal lumen, which triggers the conformational change of S protein. The compounds showed some reduced inhibitory activity, compared to SARS-CoV-2 PP, in the counterscreen experiments with PP containing the G-protein of vesicular stomatitis virus (VSV-G). VSV-G does not utilize ACE2 for host cell binding but requires low endosomal pH for a conformational change to induce membrane fusion. ACE2-overexpressing HEK293 cells were used for all PP assays. Consequently, these compounds could bind to ACE2, trap within the endosomes, and affect the VSV-G PP entry. Further experimentation is required to determine the exact mechanism by which these compounds disrupt viral entry.
This study demonstrates that our hybrid approach, combining machine learning with pharmacophore-based screening, increases the hit rate and allows for the discovery of novel scaffolds with activity against SARS-CoV-2. To date, no direct-acting antiviral small-molecule drugs have been approved by the FDA for the treatment of SARS-CoV-2. Additionally, multiple SARS-CoV-2 variants have emerged, some of which are classified as variants of concern by the CDC. Our VS approach showed a PPV of 18%, compared to a PPV of 4%, from the first experimental data set for modeling.
Among the SARS-CoV-2 inhibitors identified in this study are several novel chemotypes. Furthermore, two compounds identified have submicromolar inhibitory activity against the South African B.1.351 and UK B.1.1.7 variants. These preliminary results clearly warrant further investigation of each chemotype via medicinal chemistry efforts to thoroughly explore and establish the SAR for optimization of activity and also to improve upon physicochemical/ADME properties.
To accelerate further research on the finding of small molecules active against SARS-CoV-2, we provided the best-developed prediction models and modeling sets via github (https://github.com/ncats/covid19_pred) and through the NCATS Predictor website (https://predictor.ncats.io/).
Acknowledgments
The authors would like to thank Dac-Trung Nguyen for the technical help in setting up LigandScout on the AWS cluster and Pranav Shah for the in vitro ADME/physicochemical data on our most promising compounds. This research was supported by the Intramural Research Program of the National Center for Advancing Translational Sciences (NCATS), National Institutes of Health (NIH).
Glossary
Abbreviations
- NCATS
National Center for Advancing Translational Sciences
- FDA
Food and Drug Administration
- CDC
Centers for Disease Control and Prevention
- HTS
high-throughput screening
- CPE
cytopathic effect
- QSAR
quantitative structure–activity relationship
- SAR
structure–activity relationship
- PP
pseudoparticle
- SB
stratified bagging
- RF
random forest
- VS
virtual screening
- MFP
merged-features pharmacophore
- SFP
shared-features pharmacophore
- LBP
ligand-based pharmacophore
- ROC AUC
receiver operating characteristic area under the curve
- TP
true positives
- TN
true negatives
- FP
false positives
- FN
false negatives
- PPV
positive predicted value
- MCC
Matthews correlation coefficient
- RBD
receptor-binding domain
- MST
microscale thermophoresis
- HBA
hydrogen bond acceptor
- HBD
hydrogen bond donor
- IC50
half-maximal inhibitory concentration
- PAMPA
parallel artificial membrane permeation assay
Supporting Information Available
The Supporting Information is available free of charge at https://pubs.acs.org/doi/10.1021/acsptsci.1c00176.
The authors declare no competing financial interest.
This article is made available via the ACS COVID-19 subset for unrestricted RESEARCH re-use and analyses in any form or by any means with acknowledgement of the original source. These permissions are granted for the duration of the World Health Organization (WHO) declaration of COVID-19 as a global pandemic.
Supplementary Material
References
- A Pneumonia Outbreak Associated with a New Coronavirus of Probable Bat Origin | Nature. https://www.nature.com/articles/s41586-020-2012-7 (accessed Aug 28, 2021). [DOI] [PMC free article] [PubMed]
- COVID-19 Data in Motion. https://coronavirus.jhu.edu/ (accessed May 5, 2021).
- Saul S.; Einav S. Old Drugs for a New Virus: Repurposed Approaches for Combating COVID-19. ACS Infect. Dis. 2020, 6, 2304–2318. 10.1021/acsinfecdis.0c00343. [DOI] [PubMed] [Google Scholar]
- Elfiky A. A. Anti-HCV, Nucleotide Inhibitors, Repurposing against COVID-19. Life Sci. 2020, 248, 117477 10.1016/j.lfs.2020.117477. [DOI] [PMC free article] [PubMed] [Google Scholar]
- Elfiky E.; Ibrahim N. S.. Anti-SARS and Anti-HCV Drugs Repurposing against the Papain-like Protease of the Newly Emerged Coronavirus (2019-NCoV); Research Square, 2020. [Google Scholar]
- De Savi C.; Hughes D. L.; Kvaerno L. Quest for a COVID-19 Cure by Repurposing Small-Molecule Drugs: Mechanism of Action, Clinical Development, Synthesis at Scale, and Outlook for Supply. Org. Process Res. Dev. 2020, 24, 940–976. 10.1021/acs.oprd.0c00233. [DOI] [PubMed] [Google Scholar]
- CDC. SARS-CoV-2 Variant Classifications and Definitions. https://www.cdc.gov/coronavirus/2019-ncov/cases-updates/variant-surveillance/variant-info.html (accessed May 5, 2021).
- Variant Therapeutic Data Summary. https://opendata.ncats.nih.gov/variant/summary (accessed May 5, 2021).
- Brimacombe K. R.; Zhao T.; Eastman R. T.; Hu X.; Wang K.; Backus M.; Baljinnyam B.; Chen C. Z.; Chen L.; Eicher T.; Ferrer M.; Fu Y.; Gorshkov K.; Guo H.; Hanson Q. M.; Itkin Z.; Kales S. C.; Klumpp-Thomas C.; Lee E. M.; Michael S.; Mierzwa T.; Patt A.; Pradhan M.; Renn A.; Shinn P.; Shrimp J. H.; Viraktamath A.; Wilson K. M.; Xu M.; Zakharov A. V.; Zhu W.; Zheng W.; Simeonov A.; Mathé E. A.; Lo D. C.; Hall M. D.; Shen M. An OpenData Portal to Share COVID-19 Drug Repurposing Data in Real Time. bioRxiv 2020, 135046 10.1101/2020.06.04.135046. [DOI] [Google Scholar]
- Chen C. Z.; Shinn P.; Itkin Z.; Eastman R. T.; Bostwick R.; Rasmussen L.; Huang R.; Shen M.; Hu X.; Wilson K. M.; Brooks B. M.; Guo H.; Zhao T.; Klump-Thomas C.; Simeonov A.; Michael S. G.; Lo D. C.; Hall M. D.; Zheng W. Drug Repurposing Screen for Compounds Inhibiting the Cytopathic Effect of SARS-CoV-2. Front. Pharmacol. 2021, 11, 592737 10.3389/fphar.2020.592737. [DOI] [PMC free article] [PubMed] [Google Scholar]
- Oprea T. I. Virtual Screening in Lead Discovery: A Viewpoint. Molecules 2002, 7, 51–62. 10.3390/70100051. [DOI] [Google Scholar]
- Good A.4.19—Virtual Screening. In Comprehensive Medicinal Chemistry II; Taylor J. B.; Triggle D. J., Eds.; Elsevier: Oxford, 2007; pp 459–494. 10.1016/B0-08-045044-X/00262-5. [DOI] [Google Scholar]
- Ton A.-T.; Gentile F.; Hsing M.; Ban F.; Cherkasov A. Rapid Identification of Potential Inhibitors of SARS-CoV-2 Main Protease by Deep Docking of 1.3 Billion Compounds. Mol. Inf. 2020, 39, e2000028 10.1002/minf.202000028. [DOI] [PMC free article] [PubMed] [Google Scholar]
- Zhang H.; Saravanan K. M.; Yang Y.; Hossain M. T.; Li J.; Ren X.; Pan Y.; Wei Y. Deep Learning Based Drug Screening for Novel Coronavirus 2019-NCov. Interdiscip. Sci.: Comput. Life Sci. 2020, 12, 368–376. 10.1007/s12539-020-00376-6. [DOI] [PMC free article] [PubMed] [Google Scholar]
- Berry M.; Fielding B. C.; Gamieldien J. Potential Broad Spectrum Inhibitors of the Coronavirus 3CLpro: A Virtual Screening and Structure-Based Drug Design Study. Viruses 2015, 7, 6642–6660. 10.3390/v7122963. [DOI] [PMC free article] [PubMed] [Google Scholar]
- Abuhammad A.; Al-Aqtash R. A.; Anson B. J.; Mesecar A. D.; Taha M. O. Computational Modeling of the Bat HKU4 Coronavirus 3CLpro Inhibitors as a Tool for the Development of Antivirals against the Emerging Middle East Respiratory Syndrome (MERS) Coronavirus. J. Mol. Recognit. 2017, 30, e2644 10.1002/jmr.2644. [DOI] [PMC free article] [PubMed] [Google Scholar]
- Xu C.; Ke Z.; Liu C.; Wang Z.; Liu D.; Zhang L.; Wang J.; He W.; Xu Z.; Li Y.; Yang Y.; Huang Z.; Lv P.; Wang X.; Han D.; Li Y.; Qiao N.; Liu B. Systemic In Silico Screening in Drug Discovery for Coronavirus Disease (COVID-19) with an Online Interactive Web Server. J. Chem. Inf. Model. 2020, 60, 5735–5745. 10.1021/acs.jcim.0c00821. [DOI] [PubMed] [Google Scholar]
- Singh N.; Villoutreix B. O. Resources and Computational Strategies to Advance Small Molecule SARS-CoV-2 Discovery: Lessons from the Pandemic and Preparing for Future Health Crises. Comput. Struct. Biotechnol. J. 2021, 19, 2537–2548. 10.1016/j.csbj.2021.04.059. [DOI] [PMC free article] [PubMed] [Google Scholar]
- Alves V. M.; Bobrowski T.; Melo-Filho C. C.; Korn D.; Auerbach S.; Schmitt C.; Muratov E. N.; Tropsha A. QSAR Modeling of SARS-CoV Mpro Inhibitors Identifies Sufugolix, Cenicriviroc, Proglumetacin, and Other Drugs as Candidates for Repurposing against SARS-CoV-2. Mol. Inf. 2021, 40, 2000113 10.1002/minf.202000113. [DOI] [PubMed] [Google Scholar]
- Muratov E. N.; Amaro R.; Andrade C. H.; Brown N.; Ekins S.; Fourches D.; Isayev O.; Kozakov D.; Medina-Franco J. L.; Merz K. M.; Oprea T. I.; Poroikov V.; Schneider G.; Todd M. H.; Varnek A.; Winkler D. A.; Zakharov A. V.; Cherkasov A.; Tropsha A. A Critical Overview of Computational Approaches Employed for COVID-19 Drug Discovery. Chem. Soc. Rev. 2021, 50, 9121–9151. 10.1039/D0CS01065K. [DOI] [PMC free article] [PubMed] [Google Scholar]
- Zhou Y.; Hou Y.; Shen J.; Huang Y.; Martin W.; Cheng F. Network-Based Drug Repurposing for Novel Coronavirus 2019-NCoV/SARS-CoV-2. Cell Discovery 2020, 6, 1–18. 10.1038/s41421-020-0153-3. [DOI] [PMC free article] [PubMed] [Google Scholar]
- Wang Q.; Zhao Y.; Chen X.; Hong A. Virtual Screening of Approved Clinic Drugs with Main Protease (3CLpro) Reveals Potential Inhibitory Effects on SARS-CoV-2. J. Biomol. Struct. Dyn. 2020, 1–11. 10.1080/07391102.2020.1817786. [DOI] [PMC free article] [PubMed] [Google Scholar]
- Bobrowski T.; Chen L.; Eastman R. T.; Itkin Z.; Shinn P.; Chen C. Z.; Guo H.; Zheng W.; Michael S.; Simeonov A.; Hall M. D.; Zakharov A. V.; Muratov E. N. Synergistic and Antagonistic Drug Combinations against SARS-CoV-2. Mol. Ther. 2021, 29, 873–885. 10.1016/j.ymthe.2020.12.016. [DOI] [PMC free article] [PubMed] [Google Scholar]
- Inglese J.; Auld D. S.; Jadhav A.; Johnson R. L.; Simeonov A.; Yasgar A.; Zheng W.; Austin C. P. Quantitative High-Throughput Screening: A Titration-Based Approach That Efficiently Identifies Biological Activities in Large Chemical Libraries. Proc. Natl. Acad. Sci. U.S.A. 2006, 103, 11473–11478. 10.1073/pnas.0604348103. [DOI] [PMC free article] [PubMed] [Google Scholar]
- Fourches D.; Muratov E.; Tropsha A. Trust, but Verify: On the Importance of Chemical Structure Curation in Cheminformatics and QSAR Modeling Research. J. Chem. Inf. Model. 2010, 50, 1189–1204. 10.1021/ci100176x. [DOI] [PMC free article] [PubMed] [Google Scholar]
- Fourches D.; Muratov E.; Tropsha A. Trust, but Verify II: A Practical Guide to Chemogenomics Data Curation. J. Chem. Inf. Model. 2016, 56, 1243–1252. 10.1021/acs.jcim.6b00129. [DOI] [PMC free article] [PubMed] [Google Scholar]
- Fourches D.; Muratov E.; Tropsha A. Curation of Chemogenomics Data. Nat. Chem. Biol. 2015, 11, 535–535. 10.1038/nchembio.1881. [DOI] [PubMed] [Google Scholar]
- Molecular Operating Environment (MOE), 2019.01; Chemical Computing Group ULC, 1010 Sherbooke St. West, Suite #910, Montreal, QC, Canada, 2019.
- Wang Y.; Jadhav A.; Southal N.; Huang R.; Nguyen D.-T. A Grid Algorithm for High Throughput Fitting of Dose-Response Curve Data. Curr. Chem. Genomics 2010, 4, 57–66. 10.2174/1875397301004010057. [DOI] [PMC free article] [PubMed] [Google Scholar]
- Jain S.; Kotsampasakou E.; Ecker G. F. Comparing the Performance of Meta-Classifiers-a Case Study on Selected Imbalanced Data Sets Relevant for Prediction of Liver Toxicity. J. Comput.-Aided Mol. Des. 2018, 32, 583–590. 10.1007/s10822-018-0116-z. [DOI] [PMC free article] [PubMed] [Google Scholar]
- Breiman L. Random Forests. Mach. Learn. 2001, 45, 5–32. 10.1023/A:1010933404324. [DOI] [Google Scholar]
- Oshiro T. M.; Perez P. S.; Baranauskas J. A.. How Many Trees in a Random Forest?. In Machine Learning and Data Mining in Pattern Recognition; Lecture Notes in Computer Science; Springer: Berlin, Heidelberg, 2012; pp 154–168. 10.1007/978-3-642-31537-4_13. [DOI] [Google Scholar]
- Zakharov A. V.; Varlamova E. V.; Lagunin A. A.; Dmitriev A. V.; Muratov E. N.; Fourches D.; Kuz’min V. E.; Poroikov V. V.; Tropsha A.; Nicklaus M. C. QSAR Modeling and Prediction of Drug–Drug Interactions. Mol. Pharmaceutics 2016, 13, 545–556. 10.1021/acs.molpharmaceut.5b00762. [DOI] [PubMed] [Google Scholar]
- Jain S.; Siramshetty V. B.; Alves V. M.; Muratov E. N.; Kleinstreuer N.; Tropsha A.; Nicklaus M. C.; Simeonov A.; Zakharov A. V. Large-Scale Modeling of Multispecies Acute Toxicity End Points Using Consensus of Multitask Deep Learning Methods. J. Chem. Inf. Model. 2021, 10.1021/acs.jcim.0c01164. [DOI] [PMC free article] [PubMed] [Google Scholar]
- Alamri M. A.; Alamri M. A. Pharmacophore and Docking-Based Sequential Virtual Screening for the Identification of Novel Sigma 1 Receptor Ligands. Bioinformation 2019, 15, 586–595. 10.6026/97320630015586. [DOI] [PMC free article] [PubMed] [Google Scholar]
- Vittorio S.; Seidel T.; Germanò M. P.; Gitto R.; Ielo L.; Garon A.; Rapisarda A.; Pace V.; Langer T.; Luca L. D. A Combination of Pharmacophore and Docking-Based Virtual Screening to Discover New Tyrosinase Inhibitors. Mol. Inf. 2020, 39, 1900054 10.1002/minf.201900054. [DOI] [PubMed] [Google Scholar]
- Friedrich N.-O.; de Bruyn Kops C.; Flachsenberg F.; Sommer K.; Rarey M.; Kirchmair J. Benchmarking Commercial Conformer Ensemble Generators. J. Chem. Inf. Model. 2017, 57, 2719–2728. 10.1021/acs.jcim.7b00505. [DOI] [PubMed] [Google Scholar]
- Wolber G.; Dornhofer A. A.; Langer T. Efficient Overlay of Small Organic Molecules Using 3D Pharmacophores. J. Comput.-Aided Mol. Des. 2006, 20, 773–788. 10.1007/s10822-006-9078-7. [DOI] [PubMed] [Google Scholar]
- Langer T.; Wolber G. Pharmacophore Definition and 3D Searches. Drug Discovery Today: Technol. 2004, 1, 203–207. 10.1016/j.ddtec.2004.11.015. [DOI] [PubMed] [Google Scholar]
- Berthold M. R.; Cebron N.; Dill F.; Gabriel T. R.; Kötter T.; Meinl T.; Ohl P.; Thiel K.; Wiswedel B. KNIME—the Konstanz Information Miner: Version 2.0 and Beyond. SIGKDD Explor. Newsl. 2009, 11, 26–31. 10.1145/1656274.1656280. [DOI] [Google Scholar]
- Huang R.; Xu M.; Zhu H.; Chen C. Z.; Zhu W.; Lee E. M.; He S.; Zhang L.; Zhao J.; Shamim K.; Bougie D.; Huang W.; Xia M.; Hall M. D.; Lo D.; Simeonov A.; Austin C. P.; Qiu X.; Tang H.; Zheng W. Biological Activity-Based Modeling Identifies Antiviral Leads against SARS-CoV-2. Nat. Biotechnol. 2021, 39, 747–753. 10.1038/s41587-021-00839-1. [DOI] [PMC free article] [PubMed] [Google Scholar]
- Brown J. B. Classifiers and Their Metrics Quantified. Mol. Inf. 2018, 37, 1700127 10.1002/minf.201700127. [DOI] [PMC free article] [PubMed] [Google Scholar]
- Zhu W.; Xu M.; Chen C. Z.; Guo H.; Shen M.; Hu X.; Shinn P.; Klumpp-Thomas C.; Michael S. G.; Zheng W. Identification of SARS-CoV-2 3CL Protease Inhibitors by a Quantitative High-Throughput Screening. ACS Pharmacol. Transl. Sci. 2020, 3, 1008–1016. 10.1021/acsptsci.0c00108. [DOI] [PMC free article] [PubMed] [Google Scholar]
- Hanson Q. M.; Wilson K. M.; Shen M.; Itkin Z.; Eastman R. T.; Shinn P.; Hall M. D. Targeting ACE2–RBD Interaction as a Platform for COVID-19 Therapeutics: Development and Drug-Repurposing Screen of an AlphaLISA Proximity Assay. ACS Pharmacol. Transl. Sci. 2020, 3, 1352–1360. 10.1021/acsptsci.0c00161. [DOI] [PMC free article] [PubMed] [Google Scholar]
- Troger F.; Delp J.; Funke M.; van der Stel W.; Colas C.; Leist M.; van de Water B.; Ecker G. F. Identification of Mitochondrial Toxicants by Combined in Silico and in Vitro Studies—A Structure-Based View on the Adverse Outcome Pathway. Comput. Toxicol. 2020, 14, 100123 10.1016/j.comtox.2020.100123. [DOI] [Google Scholar]
- Jain S.; Grandits M.; Richter L.; Ecker G. F. Structure Based Classification for Bile Salt Export Pump (BSEP) Inhibitors Using Comparative Structural Modeling of Human BSEP. J. Comput.-Aided Mol. Des. 2017, 31, 507–521. 10.1007/s10822-017-0021-x. [DOI] [PMC free article] [PubMed] [Google Scholar]
- Siramshetty V. B.; Shah P.; Kerns E.; Nguyen K.; Yu K. R.; Kabir M.; Williams J.; Neyra J.; Southall N.; Nguyên Đ.-T.; Xu X. Retrospective Assessment of Rat Liver Microsomal Stability at NCATS: Data and QSAR Models. Sci. Rep. 2020, 10, 20713 10.1038/s41598-020-77327-0. [DOI] [PMC free article] [PubMed] [Google Scholar]
- Sun H.; Nguyen K.; Kerns E.; Yan Z.; Yu K. R.; Shah P.; Jadhav A.; Xu X. Highly Predictive and Interpretable Models for PAMPA Permeability. Bioorg. Med. Chem. 2017, 25, 1266–1276. 10.1016/j.bmc.2016.12.049. [DOI] [PMC free article] [PubMed] [Google Scholar]
- Siramshetty V.; Williams J.; Nguyên Đ.-T.; Neyra J.; Southall N.; Mathé E.; Xu X.; Shah P. Validating ADME QSAR Models Using Marketed Drugs. SLAS Discovery 2021, 24725552211017520 10.1177/24725552211017520. [DOI] [PubMed] [Google Scholar]
- Sun H.; Shah P.; Nguyen K.; Yu K. R.; Kerns E.; Kabir M.; Wang Y.; Xu X. Predictive Models of Aqueous Solubility of Organic Compounds Built on A Large Dataset of High Integrity. Bioorg. Med. Chem. 2019, 27, 3110–3114. 10.1016/j.bmc.2019.05.037. [DOI] [PMC free article] [PubMed] [Google Scholar]
- Ullrich S.; Nitsche C. The SARS-CoV-2 Main Protease as Drug Target. Bioorg. Med. Chem. Lett. 2020, 30, 127377 10.1016/j.bmcl.2020.127377. [DOI] [PMC free article] [PubMed] [Google Scholar]
- Recent Advances in QSAR Studies—Methods and Applications | Tomasz Puzyn | Springer. https://www.springer.com/gp/book/9781402097829 (accessed Oct 9, 2020).
- Kuz’min V. E.; Artemenko A. G.; Muratov E. N.; Polischuk P. G.; Ognichenko L. N.; Liahovsky A. V.; Hromov A. I.; Varlamova E. V.. Virtual Screening and Molecular Design Based on Hierarchical Qsar Technology. In Recent Advances in QSAR Studies: Methods and Applications; Puzyn T.; Leszczynski J.; Cronin M. T., Eds.; Challenges and Advances in Computational Chemistry and Physics; Springer: Netherlands, Dordrecht, 2010; pp 127–176. 10.1007/978-1-4020-9783-6_5. [DOI] [Google Scholar]
- Alves V. M.; Golbraikh A.; Capuzzi S. J.; Liu K.; Lam W. I.; Korn D. R.; Pozefsky D.; Andrade C. H.; Muratov E. N.; Tropsha A. Multi-Descriptor Read Across (MuDRA): A Simple and Transparent Approach for Developing Accurate Quantitative Structure–Activity Relationship Models. J. Chem. Inf. Model. 2018, 58, 1214–1223. 10.1021/acs.jcim.8b00124. [DOI] [PMC free article] [PubMed] [Google Scholar]
- Roy K.; Kar S.; Das R. N.. Validation of QSAR Models. In Understanding the Basics of QSAR for Applications in Pharmaceutical Sciences and Risk Assessment; Roy K.; Kar S.; Das R. N., Eds.; Academic Press: Boston, 2015; Chapter 7, pp 231–289. 10.1016/B978-0-12-801505-6.00007-7. [DOI] [Google Scholar]
Associated Data
This section collects any data citations, data availability statements, or supplementary materials included in this article.


