

Abstract
Although immunotherapy has revolutionized cancer treatment, only a subset of patients demonstrate durable clinical benefit. Definitive predictive biomarkers and targets to overcome resistance remain unidentified, underscoring the urgency to develop reliable immunocompetent models for mechanistic assessment. Here we characterize a panel of syngeneic mouse models, rep-resenting a variety of molecular and phenotypic subtypes of human melanomas and exhibiting their diverse range of responses to immune checkpoint blockade (ICB). Comparative analysis of genomic, transcriptomic and tumor-infiltrating immune cell profiles demonstrated alignment with clinical observations and validated the correlation of T cell dysfunction and exclusion programs with resistance. Notably, genome-wide expression analysis uncovered a melanocytic plasticity signature predictive of patient outcome in response to ICB, suggesting that the multipotency and differentiation status of melanoma can determine ICB benefit. Our comparative preclinical platform recapitulates melanoma clinical behavior and can be employed to identify mechanisms and treatment strategies to improve patient care.
ICB has become the first-line treatment for metastatic melanoma, the deadliest skin cancer. Antibodies inhibiting CTLA-4 and PD-1/PD-L1 signaling have been approved, as monotherapies or in combination, for multiple cancer types due to their significant improvement of patient survival1. Yet response rates are insufficient and alternative strategies are being explored2. Despite intensive efforts to enhance ICB efficacy and discover predictive biomarkers, the mechanisms of sensitivity and resistance remain poorly understood. High tumor mutation burden (TMB) and neoantigen load in pretreated tumors, increased T cell infiltrates and treatment-induced inflammatory pathways have shown correlation with clinical benefit3–9, while antigen presentation and interferon (IFN)-γ pathway alterations were detected in some resistant patients10–12. Although specific gene expression profiles were identified in particular patient cohorts8,13,14, uncovering broad predictive signatures of ICB response remains elusive due to the scarcity of clinical datasets with high quality transcriptomic data. Recently, independent computational predictors were developed based on immune-related gene expression profiles, such as immune checkpoints, co-stimulatory molecules and T cell dysfunction and exclusion markers15–17; however, the benefit of these approaches for patient stratification requires further validation.
Mouse models have historically served as essential tools for investigating mechanisms underlying tumor initiation, progression and drug response. However, their value for informing clinical trials and predicting patient outcome remains unclear and likely depends on the quality and diversity of the models employed. Although wild-type mice rarely develop melanomas, mice have been genetically engineered with oncogenic drivers to successfully provoke melanomagenesis18–22. Nevertheless, the creation of reliable melanoma models has been handicapped by inherent differences between mouse and human skin architecture and the complexity and heterogeneity of human disease. Moreover, the majority of genetically engineered mouse (GEM) models do not incorporate appropriate exposure to ultraviolet (UV) radiation, known to be the major etiological melanoma risk factor and speculated to enhance susceptibility to immunotherapy23,24.
We have reported that constitutive activation of receptor tyrosine kinase MET in hepatocyte growth factor transgenic mice (HGFtg) leads to human-like localization of melanocytes within or near the epidermis, which are then susceptible to melanoma induction by neonatal UV radiation25,26. Lesions arising under these circumstances are highly reminiscent of human cutaneous melanomas and our base HGFtg model can be combined with various other oncogenic drivers to replicate the molecular diversity observed in patients27. Here we develop a panel of cutaneous melanoma GEM models for the preclinical study of immunotherapies. The comparative analyses of the mutational landscapes, transcriptomes and tumor-infiltrating immune cell profiles from these models, in concert with cross-validation using clinical datasets, demonstrated the reliability of the platform and uncovered a melanocytic plasticity signature (MPS) predictive of ICB efficacy.
Results
Modeling diverse subtypes of human melanoma in mice.
To reproduce the diversity of cutaneous melanoma, we developed four syngeneic models (M1–M4) in C57BL/6 mice harboring a variety of clinically relevant genetic modifications and exposed to different carcinogens (Extended Data Fig. 1). We characterized the mutational landscape of the four models by whole-exome sequencing (WES) analysis of cell lines (CL1–4) and tumor fragments expanded in syngeneic mice (GEM-derived allografts28, GDA1–4). We found the highest TMB in M1 and M4 and the lowest in M2 (Fig. 1a and Supplementary Table 1). Spectral karyotyping (SKY) analysis of the four cell lines showed 60% of tetraploid cells in M1 and high numbers of translocations and chromosomal duplications in M3 and M4, whereas no obvious alterations were observed in M2 (Extended Data Fig. 2a and Supplementary Table 2). Consistent with melanoma-inducing carcinogens used, C>T transitions, characteristic of COSMIC UV-related signature 7 (ref. 29), were predominant in M1, M2 and M4, whereas A>T transversions, characteristic of 7,12-dimethylbenz(a)anthracene (DMBA) exposure, were prevalent in M3 (Fig. 1b and Extended Data Fig. 2b). Notably, frequent oncogenic driver and tumor suppressor mutations of human melanomas30,31 were detected in the models (Fig. 1c and Supplementary Table 3). We compared the mutation profiles of the four models to The Cancer Genome Atlas (TCGA) skin cutaneous melanoma (SKCM) dataset27,31 by hierarchical clustering. M1 and M2 clustered together with patients with BRAF mutations, M3 with triple-wild-type (BRAF/RAS/NF1-wild-type) and M4 with RAS-mutant melanomas (Extended Data Fig. 2c). Western blot analysis confirmed elevated ERK phosphorylation in M1 and M2 (BrafCA/+ allele), followed by M4 (spontaneous KrasG12D mutation) and marked activation of AKT in M1 (Ptenflox/+ allele) (Extended Data Fig. 2d). Altogether, these results suggest that M1 and M2 represent subsets of mutant BRAF, M4 represents mutant RAS and M3 represent triple-wild-type melanomas27.
Fig. 1 |. Modeling diverse subtypes of human melanoma in mice.

a, Number of nonsynonymous mutations obtained from WES of GDA (black bar) and cell lines (gray bar) from the four melanoma models (M1–M4). b, Frequency of indicated single nucleotide mutations found in the four models (GDAs and cell lines). c, Hot-spot mutations frequently found in human melanomas (right) that were detected in the four models (left). Each mouse model (M1–M4) depicts two columns, representing results from either the cell line (left) or GDA (right). BRAF, RAS and NF1 alterations are highlighted as they are used to classify different molecular subtypes of human melanomas27,31. d, Heat map of the four-stage differentiation signature32 expression in the four melanoma models. Data are represented as z scores from RNA-seq of cell line-derived allografts (N = 4 tumors per model). e, Correlation of signature expression between models and TCGA patients27 from each differentiation category. Heat map depicts r values from Pearson correlation analysis (N = 4 tumors per model).
Next, we analyzed RNA sequencing (RNA-seq) data from the four models by pairwise differential gene expression and gene-set enrichment analysis (Supplementary Tables 4 and 5). We observed an upregulation of ‘melanocytic markers’ in M3 and M4, whereas ‘nervous-system-related’ and ‘inflammation’ genes characterized M1 and M2 (Supplementary Fig. 1a). Using immunohistochemistry, we detected expression of neural crest lineage transcription factor SOX10 in all models, whereas melanocytic markers dopachrome tautomerase (DCT) and TYRP1 were only expressed in M3 and M4, indicative of their differentiation status (Supplementary Fig. 1b). To compare our models with human melanoma phenotypes, we utilized a recently reported signature that classified TCGA SKCM into four differentiation categories32. We found distinct expression of genes in this signature in each model (Fig. 1d). M1 showed the highest correlation with ‘neural crest-like’, M2 with ‘undifferentiated’, M3 with ‘melanocytic’ and M4 with ‘transitory’ TCGA melanomas (Fig. 1e). Thus, our models resemble a broad spectrum of human melanoma differentiation phenotypes.
Melanoma mouse models recapitulate patient diversity in response to CTLA-4 blockade.
To evaluate response of our models to ICB, we implanted GDAs or cell lines (cell line-derived allografts; CLDAs) from each model into C57BL/6 mice and treated them with either anti-CTLA-4 or isotype control antibodies (Fig. 2a). Independently of the use of GDAs or CLDAs, anti-CTLA-4 treatment did not affect M1 or M2 tumor growth or survival. Conversely, 20–30% of M3 and 40% of M4 melanomas treated with anti-CTLA-4 reproducibly showed tumor growth delay, resulting in significantly improved survival for M4-bearing mice (Fig. 2b–e). Overall, our models displayed a broad range of responses to anti-CTLA-4 from resistant M1 and M2 to partially and highly sensitive M3 and M4, respectively, mimicking diverse clinical responses of human melanoma.
Fig. 2 |. Melanoma mouse models recapitulate patient diversity in response to CTLA-4 blockade.

a, A 2- to 3-mm3 tumor piece (GDA) or 1.0 × 10⁶ melanoma cells (CLDA) from each model were s.c. implanted into C57BL/6 syngeneic mice. When tumors reached 75–125 mm3, mice were randomized and treated with anti-CTLA-4 or isotype antibody as indicated. b, Tumor growth of the four melanoma models (GDAs) upon treatment with anti-CTLA-4 (red lines, N = 10 mice) or isotype control (blue lines, N = 10 mice). The asterisk highlights the tumors that completely regressed after treatment. c, Kaplan–Meier survival curves from b. d, Tumor growth curves of the four melanoma cell lines (CLDAs) after treatment with anti-CTLA-4 (N = 10 mice) or isotype control (N = 10 mice). e, Kaplan–Meier survival curves from d. Two-tailed P values from log-rank (Mantel–Cox) test are indicated (c and e).
ICB efficacy depends on antitumor immune responses generated upon recognition of cancer cells1. To determine the immunogenicity of our melanomas we performed vaccination assays in vivo33. The γ-irradiated cells from each model were subcutaneously (s.c.) injected into C57BL/6 mice. Four weeks post-vaccination, untreated cells from the same model were implanted into the opposite flank (Extended Data Fig. 3a). Vaccination had no significant effect on tumor-free survival in mice challenged with either M1 or M2 cells when compared to nonvaccinated control mice. In contrast, vaccination significantly delayed tumor onset in mice challenged with M3 or M4 cells (Extended Data Fig. 3b–e). These results suggest that tumor immunogenicity correlates with the response to anti-CTLA-4.
Antigen-presentation pathway is functional in the four melanoma models.
We next performed in-depth characterizationin antigen-presentation genes were found in any of our melanoma models (Supplementary Table 1). We confirmed induction of major histocompatibility complex (MHC) class I-associated genes following IFN-γ stimulation in all cell lines and validated expression of H2-Kb protein by flow cytometry (Supplementary Fig. 2a,b). Furthermore, when we analyzed the transcriptome of the four melanomas either untreated or after CTLA-4 blockade, no substantial differences were found in the expression of MHC-I- and MHC-II-related genes (Fig. 3a and Supplementary Table 4). This suggests that the integrity of the antigen-presentation pathway is maintained in all models.
Fig. 3 |. Antigen presentation is functional in the four melanoma models.

a, Expression of indicated MHC class I- and class II-related genes in the four models. Heat map depicts fragments per kilobase of transcript per million (FPKM) obtained from RNA-seq of untreated (N = 4), isotype control (N = 3 for M1–3, N = 4 for M4) or anti-CTLA-4 treated (N = 3 for M1 and M2, N = 6 for M3 and N = 5 for M4) cell line-derived allografts. b, IFN-γ concentration in the medium from 24-h co-cultures of DCT-reactive T cells and the four model cells expressing GFP–DCT peptide35,36, GFP empty vector or nontransduced. CD8+-sorted T cells from C57BL/6 splenocytes were transduced with recombinant T cell receptor (TCR) Vβ3 for the recognition of 9aa DCT peptide (DCT-Vβ3) or Thy1.1 as control. Graph depicts IFN-γ pg ml−1 measured by ELISA. c, Representative flow cytometry plots showing 41BB expression in DCT-reactive T cells after 24-h co-culture with indicated melanoma cell lines (N = 3 co-cultures). Experiments were repeated twice with similar results. NT, nontransduced. d, Percentage of 41BB-positive cells obtained from c. Data were representative of two independent experiments and are depicted as mean (N = 3 co-cultures) and error bars represent s.e.m. (b,d).
To further evaluate the functionality of the pathway, we co-cultured melanoma cells from each model with engineered CD8+ T cells, reactive against a specific antigen from the melanocytic marker DCT. Only M3 cells expressed substantial levels of Dct in culture conditions; therefore, we overexpressed the 9aa DCT peptide35 recognized by the engineered T cells in M1, M2 and M4 cells (Supplementary Fig. 2c). The 9aa DCT peptide was fused to the C terminus of eGFP protein but separated by a 2aa linker to ensure proper cleavage and presentation by MHC-I (ref. 36). We used ELISA to measure IFN-γ concentration in the media of 24-h co-cultures as readout of T cell activation. IFN-γ was accumulated 100- to 1,000-fold in media of DCT-expressing cells from all models when co-cultured with DCT-reactive T cells, but not in the presence of Thy1.1-transduced control T cells (Fig. 3b and Supplementary Fig. 2d). Moreover, 15–40% of DCT-reactive T cells, but not Thy1.1 controls, were activated by DCT-expressing cells from the four models as evidenced by expression of activation marker 4–1BB (CD137) (Fig. 3c,d and Supplementary Fig. 2e). These results confirmed the intact ability of the melanoma cells from the four models to present antigens in the context of MHC-I and activate CD8+ T cells.
Intratumoral immune cell correlates of anti-CTLA-4 response in the melanoma models.
To assess tumor-infiltrating lymphocytes (TILs) in the four models we performed CD3 immunostaining of untreated melanomas (Extended Data Fig. 4a). Automated quantification of total CD3-positive area per section did not differentiate sensitive from nonresponsive models, with resistant M1 and sensitive M4 displaying the highest T cell infiltration (Extended Data Fig. 4b). Next, we addressed T cell infiltration after anti-CTLA-4 treatment of M4. We collected tumors at early time points when progressively growing melanomas were distinguished from stable/regressing melanomas, but size was comparable (32–39 d post-implantation; Extended Data Fig. 4c). Consistent with previous clinical observations, tumors that responded to anti-CTLA-4 exhibited significantly increased TIL densities relative to nonresponders or those treated with isotype control (Extended Data Fig. 4d).
We next performed in-depth characterization of immune cell populations infiltrating untreated melanomas from our models by unbiased high parametric flow cytometry analysis. We found a strikingly distinct distribution of the immune populations between the four models, although the total number of infiltrating leukocytes (CD45+ cells) was similar (Fig. 4a, Extended Data Fig. 5a and Supplementary Table 6). The lymphoid fraction was most enriched in M4, followed by M1, whereas macrophages and neutrophils were predominant in M2 and M1 (Fig. 4a and Extended Data Fig. 5b–d). In contrast, dendritic cells (DCs) were more abundant in M3 (Extended Data Fig. 5e). In agreement with immunostaining results, CD3+ T cells were highest in M4 and M1, almost absent in M2 (≤3%) and intermediate in M3 (Fig. 4b). CD8+ T cells represented most of the T cell compartment in M1 and were found in similar frequencies in M4 (Fig. 4c). Total CD4+ T cells were more abundant in M4 and M3, and although the frequency of regulatory T cells (CD3+CD4+CD25+FoxP3+, Tregs) was also higher in M3 tumors, they represented a small proportion of total CD4+ T cells (Fig. 4d and Extended Data Fig. 5f). Notably, the few T cells found in the resistant M2 tumors were predominantly Tregs (Fig. 4e). Consistent with their higher CD8+ T cell content, CD8+ T cell:Treg ratios were increased in M1 and M4 (Fig. 4f). Of note, unconventional γδ T cells, which exert antitumor cytotoxic responses37, were rare but higher in the sensitive M4 (Fig. 4g). Altogether, these results reveal the immunological diversity of the models and suggest that in addition to quantity, the quality of TILs and the presence of other immune cell populations is an important determinant of response.
Fig. 4 |. Intratumoral immune cell correlates of anti-CTLA-4 response in the melanoma models.
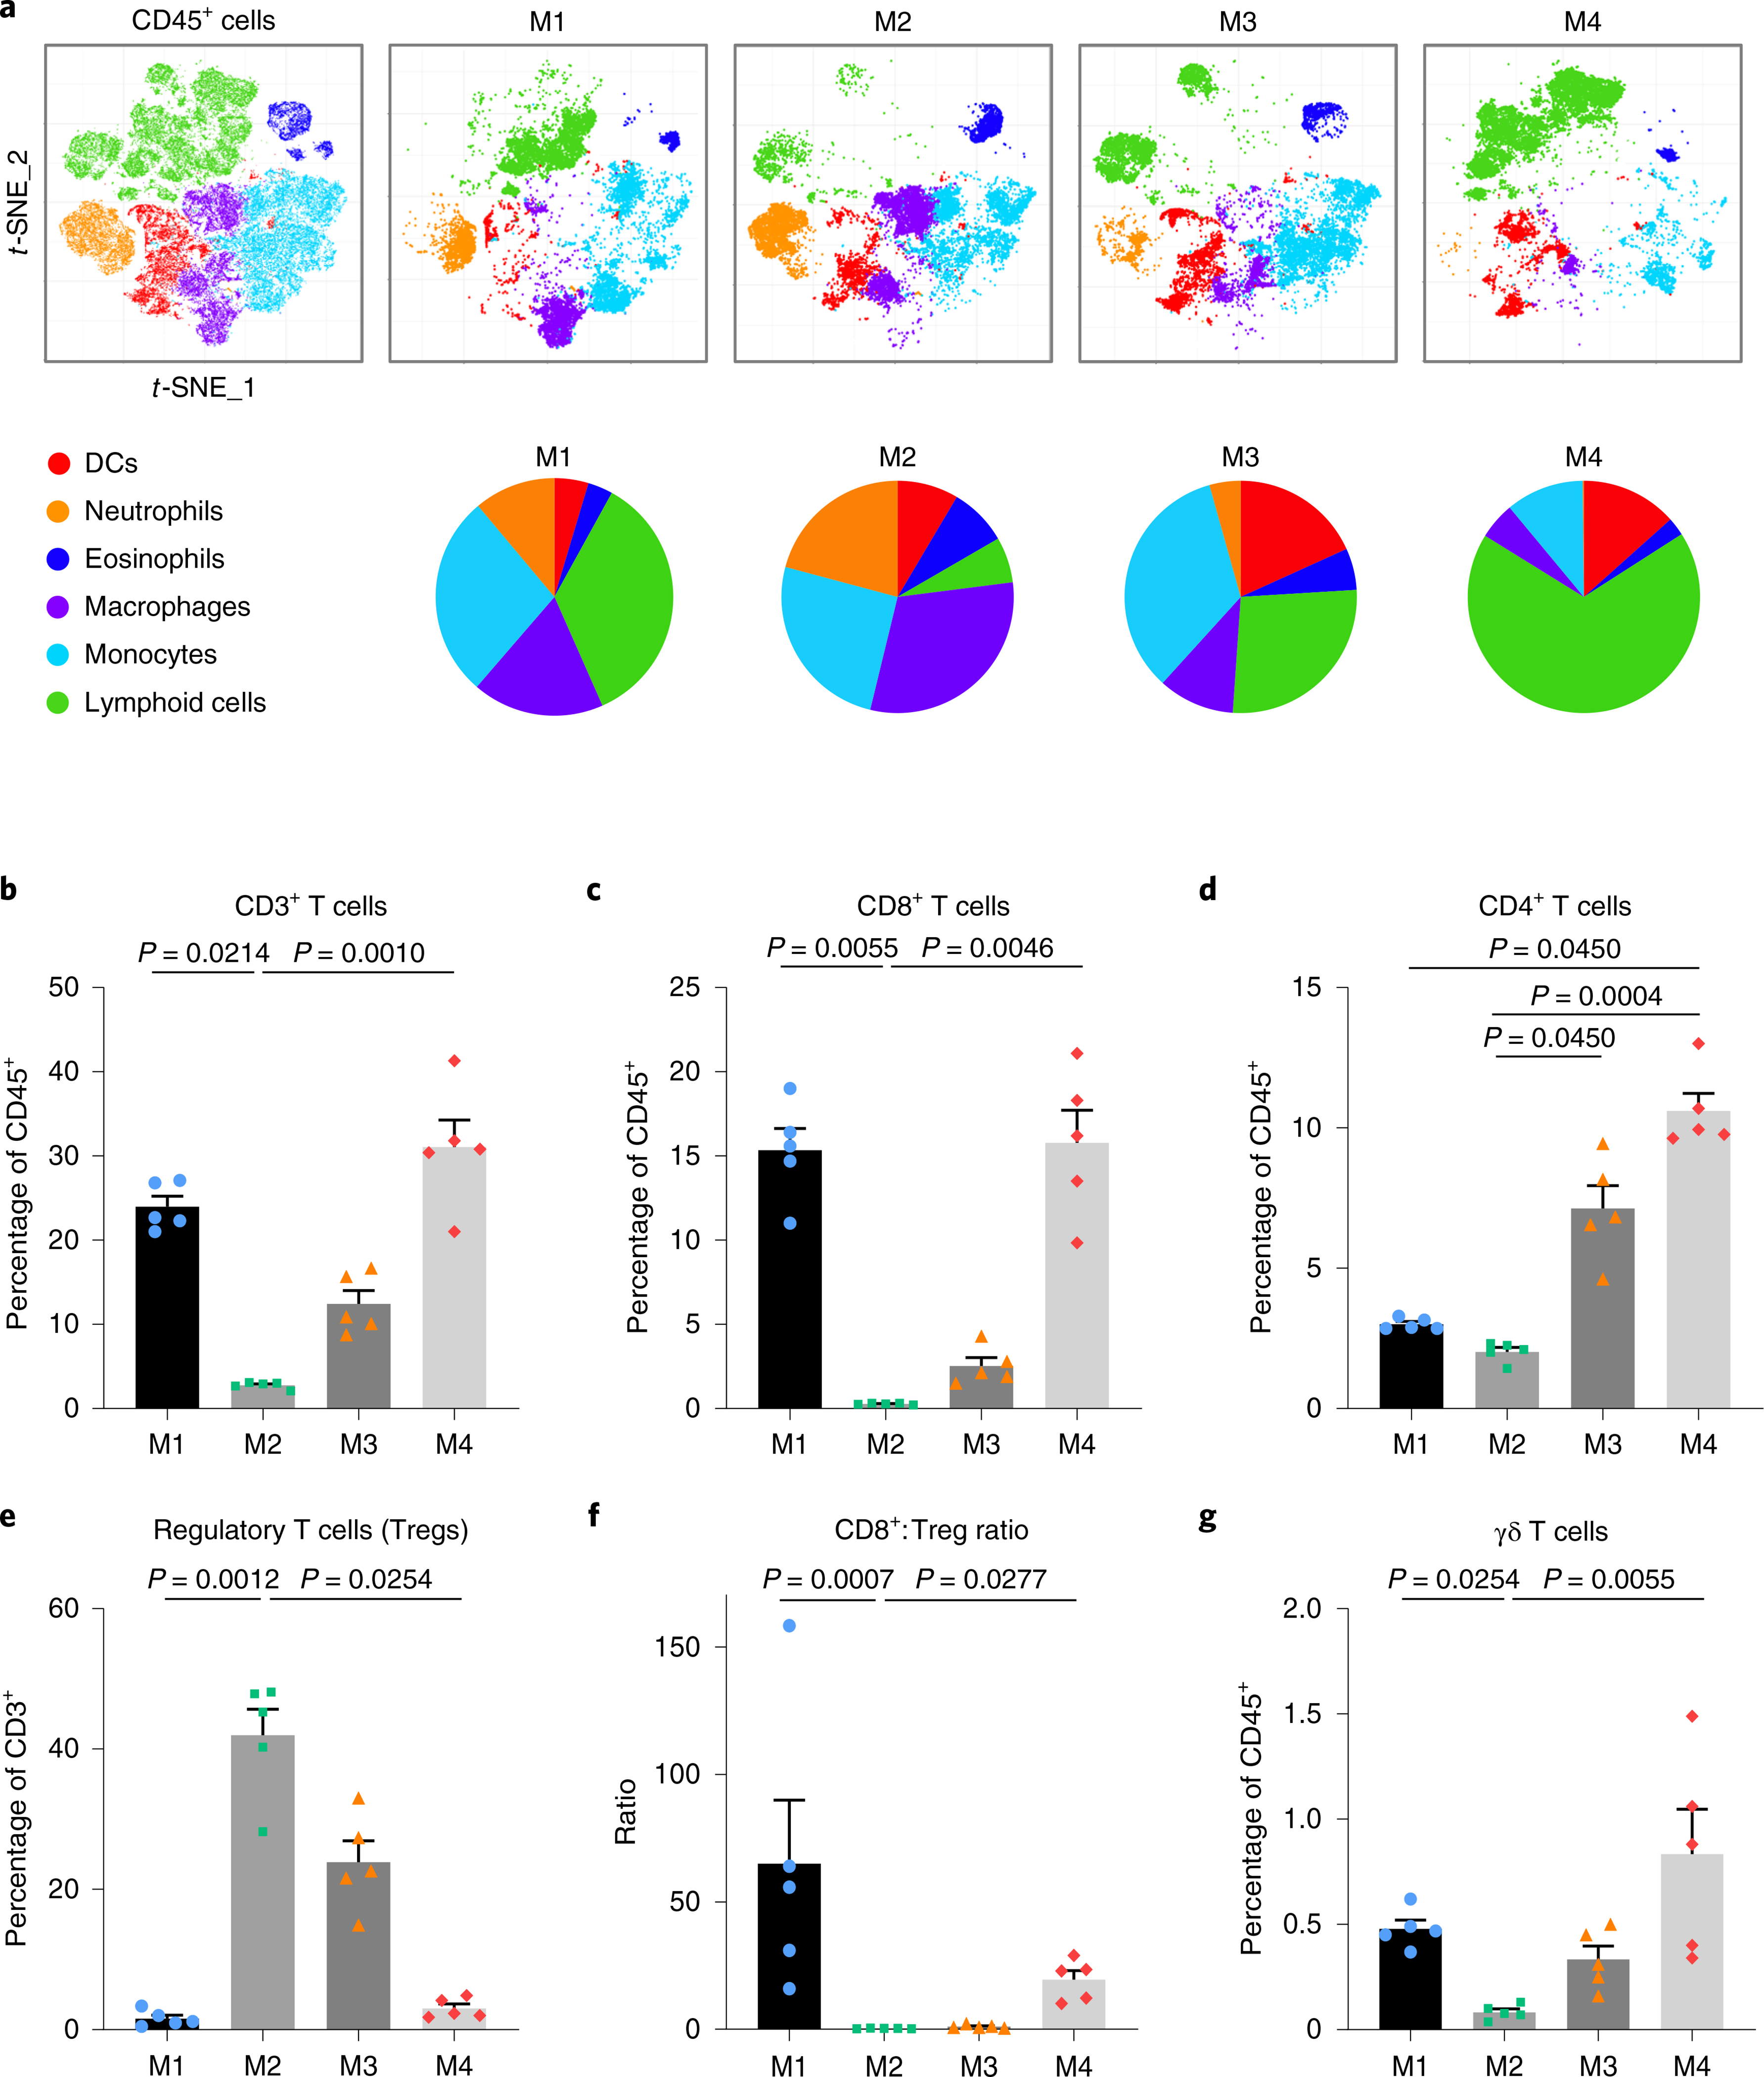
a, Twenty-parameter flow cytometry analysis by t-SNE of the intratumoral CD45+ cells (top; see also Extended Data Fig. 5). Pie charts represent percentage of indicated immune cells infiltrating untreated cell line-derived allografts from the four models (bottom; N = 5 tumors per model from a representative of two independent experiments). b–e, Percentage of intratumoral CD3+ (b), CD8+ (c), CD4+ (d) T cells and Tregs (CD3+TCR-β+CD4+CD25+FoxP3+) (e). f, Ratio of intratumoral CD8+ T cell:Treg. g, Percentage of intratumoral γδ T cells. Data are representative of two experiments and are depicted as the mean (N = 5 tumors) and error bars represent s.e.m. Kruskal–Wallis test P values adjusted for multiple comparisons by Dunn’s test are indicated (b–g). See also Supplementary Table 6 for the population definition.
Anti-CTLA-4-resistant models exhibit T cell dysfunction or exclusion profiles associated with distinct myeloid populations.
Overall TIL abundance was insufficient to explain the different responses of the models to anti-CTLA-4. To further address the mechanism of immune evasion, we used t-stochastic neighbor embedding (t-SNE) analysis of flow cytometry data to decipher CD3+ T cell populations and confirmed that M1 had a higher proportion of CD8+-exhausted T cells (Fig. 5a,b). Moreover, expression of exhaustion markers PD-1, LAG3 and TIM3 was significantly elevated in M1 CD8+ T cell infiltrates (Extended Data Fig. 6a–d). M1 melanomas were also enriched in PD-L1+ macrophages (Fig. 5c) and PD-L1 levels were increased in macrophages and DCs infiltrating M1 tumors (Extended Data Fig. 6e,f), suggesting that the myeloid cell compartment could sustain T cell exhaustion in M1. We further validated expression of T cell exhaustion profiles38,39 in M1 melanomas by RNA-seq (Extended Data Fig. 6g). Next, we analyzed RNA expression data of our models using a tumor immune dysfunction and exclusion (TIDE) computational method, which recently predicted the response to anti-CTLA-4 and anti-PD-1 monotherapies in patients with melanoma16. Notably, 100% of untreated M1 and M2 were predicted as ‘nonresponders’ and 75% of M3 and M4 as ‘responders’ by a cutoff value of 0 (Fig. 5d). Moreover, M1 showed high T cell dysfunction scores, whereas M2 presented increased exclusion scores. These data demonstrate a predominant T cell exhaustion phenotype in M1, perhaps explaining the high TMB and TIL densities but resistance to anti-CTLA-4 exhibited by this model.
Fig. 5 |. Models resistant to anti-CTLA-4 exhibit T cell dysfunction or exclusion profiles.

a, t-SNE analysis of intratumoral CD3+ T cells in the four models (N = 5 untreated tumors). TE/EM, T effector/effector memory (CD62L+CD44+); CM, central memory (CD62L−CD44+); naive (CD62L+CD44−); exhausted (PD-1+LAG3+TIGIT+TIM3+) and DN, double negative (CD4−CD8−). b,c, Percentage of intratumoral exhausted CD8+ T cells (b) and PD-L1+ macrophages (CD68hiCD64+F480+Ly6C−) (c). Data from a representative of two experiments are depicted as the mean (N = 5 tumors) and error bars represent s.e.m. (b,c). d, TIDE scores16 of the four models (N = 4 tumors). Model and replicate number are indicated and each sample is color-coded as: M1, blue; M2, light green; M3, orange; and M4, red. e, Frequency of cDC1 (CD103+CD11b−) with respect to NK cells (CD3−NK1.1+) in the four models (N = 5 tumors). f, Correlation between CTL levels and cDC1 signature from RNA-seq analysis in the four models (N = 4 tumors). g, Expression of cDC1 versus NK cell signatures in ipilimumab-treated melanomas (anti-CTLA-4, Van Allen dataset4). h, CD8a/c expression in high- (orange, N = 24) and low-NK-cDC1 (blue, N = 17) samples from g. i, Correlation between CTL levels and cDC1 signature in samples from g. Samples are color-coded according to T cell exclusion scores by TIDE (g,i). j, Frequency of cDC2 (CD103−CD11b+) with respect to Tregs in the four models (N = 5 tumors). k, Percentage of CD4+ Tconv according to cDC2-Treg frequencies from j. l, cDC2:Treg ratio in low- (orange, N = 20) and high-exclusion (blue, N = 21) samples from g. Boxes represent median, upper and lower quartiles and whiskers represent minimum to maximum range (h,k,l). Two-tailed P values from Kruskal–Wallis adjusted for multiple comparisons by Dunn’s test (b,c,k) and from Mann–Whitney U-test (h,l) are indicated. Pearson correlation r and two-tailed P values obtained using t-distribution are indicated (e–g,i). See also Supplementary Tables 6 and 7.
To better understand the T cell exclusion phenotype of M2, we explored immune populations involved in T cell priming, expansion and/or activation. Notably, most macrophages found in M1 and M2 were CD206+, a marker widely used to identify alternatively activated macrophages (Extended Data Fig. 7a). Moreover, high CD206 and low MHC-II expression in tumor-infiltrating macrophages of M2 indicated a tumor-promoting phenotype (Extended Data Fig. 7b,c), as described in preclinical and clinical studies40. RNA-seq analysis by CIBERSORT41,42 confirmed a trend toward enrichment of the protumor macrophage fraction in M2 as well as in nonresponder patients with melanoma treated with ipilimumab (anti-CTLA-4, Van Allen dataset4; Extended Data Fig. 7d,e).
Conversely, we found reduced natural killer (NK) cells in M2 melanomas (Extended Data Fig. 7f), which have been shown to recruit conventional type 1 DCs (cDC1) through the secretion of CCL5 and XCL1/2 (ref. 43). Indeed, the frequency of cDC1 was tightly correlated with the presence of intratumoral NK cells across the four models (Fig. 5e). cDC1 are known to induce antitumor CD8+ T cell priming and expansion both in mouse and human tumors44. The expression of Ccl5 and Xcl1 was especially reduced in the M2 tumors in accordance with their low cDC1-NK cells and CD8+ T cells (Extended Data Fig. 7g and Fig. 4c). We further confirmed by RNA-seq analysis that cDC1 signature45,46 was strongly correlated with cytotoxic T lymphocyte (CTL) levels16 (Fig. 5f and Supplementary Table 7). Notably, we validated these immune molecular profiles using the Van Allen dataset4 and showed that the status of the NK cell–cDC1 axis was linked to CCL5, XCL1 and XCL2 expression, and correlated with the levels of CD8a/b and T cell exclusion scores, as determined by TIDE (Fig. 5g,h and Extended Data Fig. 7h). Moreover, we validated a significant correlation of cDC1 signature with CTL levels in this patient cohort (Fig. 5i).
In the absence of cDC1, the activation of conventional CD4+ T cells (CD4+ Tconv) by cDC2, which contribute to antitumor responses, has recently been shown to be suppressed by Tregs and the cDC2/Treg content to serve as a predictor of effective antitumor response in mouse and human47. We found that enrichment of intratumoral cDC2 was associated with significantly higher CD4+ Tconv densities only when Tregs were reduced in our models (Fig. 5j,k; quadrant I versus II and III). Of note, the abundant intratumoral CD4+ Tconv from the responder M4 (cDC2high/Treglow) expressed high levels of activation marker CD44, whereas elevated PD-1 levels were found in the scarce CD4+ Tconv from resistant M1 (cDC2low/Treglow; Extended Data Fig. 7i), supporting an exhaustion phenotype as observed in patients with cancer47. We also confirmed that cDC2:Treg ratios were significantly lower in high-T cell exclusion samples from the Van Allen dataset4 (Fig. 5l). Overall, these results revealed a distinct immune suppressive tumor microenvironment (TME) in M1 and M2 and support the key role of T cell dysfunction and exclusion programs sustained by myeloid cells in melanoma resistance to ICB.
Transcriptomic profiling of our models identifies a melanocytic plasticity signature that predicts patient outcome in response to ICB.
Next, we developed a gene signature predictive of ICB efficacy through a comparison of the resistant M1 and M2 versus the sensitive M3 and M4 transcriptomes. Based on differential gene expression statistics and sequential evaluation of response prediction in the Van Allen dataset4 by Fisher’s exact test, we identified a 45-gene signature consisting of 33 upregulated and 12 downregulated genes in M1/M2 (see Methods; Supplementary Table 8). To examine the biological functions of these signature genes, we performed ingenuity pathway analysis (IPA) and found ‘nervous system development and function’ and ‘neurological disease’ as the top two most significant categories (Extended Data Fig. 8a). Because melanocytes and peripheral nervous system have a common embryonic origin in the neural crest and share stem cell progenitors in the skin48, we explored signature expression in several melanocytic precursors. We computed scores based on expression of the 45 genes in mouse melanoblasts at embryonic day 15.5 and 17.5 (E15.5 and E17.5) and differentiated melanocytes from pups at postnatal day 1 and 7 (P1 and P7)49. The signature expression in melanoblasts was aligned with resistant M1/M2, whereas melanocytes correlated with sensitive M3/M4 (Extended Data Fig. 8b). We also interrogated signature expression in two hair follicle melanocytic stem cell populations described in adult mouse skin (P56) with distinct regenerative capacities50. Consistently, multipotent progenitors with neural crest stem cell-like properties (CD34+) showed higher scores than those committed to melanocytic differentiation (CD34−; Extended Data Fig. 8c). CD34 expression was also higher in resistant M1/M2 compared to sensitive M3/M4 (data not shown). Altogether, these results suggest that the signature reflects the multipotency or differentiation of the melanocytic lineage, which we will hereafter refer to as MPS. High MPS scores represent undifferentiation, multipotency and/or neural crest stem cell properties and low MPS scores depict later stages of melanocytic differentiation.
We next analyzed MPS expression in the Van Allen dataset4 and found significantly lower scores in responders compared to nonresponders (Fig. 6a). Furthermore, MPS scores correctly predicted the response of 81% of patients using the 33rd percentile as a cutoff (Fisher’s exact test P value = 0.0049; Fig. 6b). Notably, high MPS scores significantly correlated with worse progression-free survival (PFS) and overall survival (OS) of the patients from this cohort (Fig. 6c,d). To confirm the ability of MPS to predict ICB efficacy, we compiled baseline RNA-seq data of immunotherapy-naive patients from two metastatic melanoma cohorts treated with anti-PD-1 (Hugo and Riaz datasets9,13). Nonresponder melanomas consistently exhibited significantly higher MPS scores than responders (Extended Data Fig. 9a). Moreover, low-MPS score patients showed significantly better OS (Extended Data Fig. 9b). To further validate the correlation of MPS with response to anti-PD-1, we treated our melanoma models with anti-PD-1 or isotype antibody as control (Extended Data Fig. 10a). In line with our observations for anti-CTLA-4, M1 and M2 tumor growth and survival were not affected by anti-PD-1, M3 presented modest tumor growth delay and M4 showed 37% response rate, resulting in significantly improved survival (Extended Data Fig. 10b,c). These results confirm the value of MPS for predicting patient outcome in response to ICB and suggest that the multipotency and differentiation status of the melanomas could broadly influence ICB efficacy.
Fig. 6 |. Transcriptomic profiling of the models identifies an MPS that predicts patient outcome in response to ICB.

a, Expression of MPS in patients with ipilimumab-treated melanoma (anti-CTLA-4, Van Allen dataset4). The box plot shows the MPS scores in pretreated melanomas from nonresponder (NR; green, N = 23), long survivors (LS) but nonresponders by RECIST (yellow, N = 5) and responder (R; violet, N = 14) patients. The box represents median, upper and lower quartiles and whiskers represent the minimum to maximum range. Kruskal–Wallis test P value adjusted for multiple comparisons by Dunn’s test is indicated. b, Waterfall plot representing prediction scores for each patient in Van Allen dataset (N = 42 patients). Two-tailed Fisher’s exact test P value is indicated. c,d, Kaplan–Meier curves of PFS (c) and OS (d) for ipilimumab-treated patients according to MPS scores. e,f, ROC curves to evaluate prediction performance of MPS, TIDE and MPS + TIDE in Van Allen (N = 42 patients) (e) and Hugo–Riaz9,13 (N = 51 patients) (f) datasets. ROC AUC values for each predictor are indicated. g–i, Kaplan–Meier curves of the PFS (g) and OS (h,i) for Van Allen (g,h) and Hugo–Riaz (i) datasets by combination of MPS and TIDE scores. MPS_TIDE = 0: MPSlowTIDElow; MPS_TIDE = 1: MPShighTIDElow or MPSlowTIDEhigh; and MPS_TIDE = 2: MPShighTIDEhigh. The number of patients per group is indicated and two-tailed P values were calculated by log-rank (Mantel–Cox) test (c,d,g–i).
The combination of MPS and TIDE scores improves prediction of patient response and survival upon ICB in multiple datasets.
To address whether MPS was associated with the immune response we analyzed the expression of immune checkpoint genes (for example CTLA-4, PD-1, PD-L1, PD-L2), the CTL levels or the immune populations sustaining or impairing T cell infiltration (for example, NK cells, cDC1, cDC2, Tregs) in the Van Allen dataset4 and found no difference between patients with a high and low MPS score (data not shown). Next, we employed receiver operating characteristic (ROC) curves to compare prediction performance of MPS with PD-L1 expression and TMB, used as biomarkers of anti-PD-1 response for some cancers51 and the TIDE method16. Notably, MPS achieved the best ROC area under the curve (AUC) value in the Van Allen and Hugo–Riaz9,13 datasets, closely followed by TIDE (Extended Data Fig. 9c). We hypothesized that the combination of MPS and TIDE scores (Methods) would further improve the ability to predict ICB efficacy. ROC curves showed a marked improvement of the AUC values by MPS + TIDE for the Van Allen cohort but were the same as MPS alone for the Hugo–Riaz dataset (Fig. 6e, f).
To evaluate a potential additive effect of MPS and TIDE signatures on survival, we performed Kaplan–Meier analysis by stratifying melanomas from each dataset into three groups according to their MPS and TIDE scores and found significantly improved PFS and OS for the low-MPS and low-TIDE group (MPS_TIDE = 0, violet), whereas patients with high scores for both predictors (MPS_TIDE = 2, orange) exhibited the poorest survival in Kaplan–Meier curves (Fig. 6g–i). These results confirmed a better correlation with survival of MPS and TIDE together than each signature alone (Fig. 6c,d and Extended Data Fig. 9b,d). Our results demonstrate the power of combining cancer cell intrinsic (multipotency/differentiation) and extrinsic (immune phenotype) factors to build stronger predictors of patient survival in response to anti-CTLA-4 or anti-PD-1.
Discussion
In this study we characterized a set of four immunocompetent melanoma mouse models that faithfully represent major molecular and phenotypic subtypes of human cutaneous melanoma and recapitulate the diversity of clinical responses to ICB. In contrast to most preclinical studies focused on single models, we analyzed multiple GEM-derived melanomas and cross-validated our findings with human datasets to uncover key determinants of ICB efficacy. Analysis of TMB, TIL densities and immune cell profiles demonstrated that our models resemble clinical associations with ICB response. Moreover, this preclinical panel has provided insight into both melanoma cell extrinsic and intrinsic determinants of ICB response. We identified a strong correlation of T cell dysfunction and exclusion programs, as well as status of melanoma potency and differentiation, with resistance and combined both signatures to better predict patient outcome in response to ICB. Furthermore, we generated rich genomic and transcriptomic murine datasets that provide a platform for the discovery of predictive biomarkers.
Our studies revealed a distinct immune composition in the TME of the four melanoma models, emphasizing nonoverlapped immunosuppressive populations in resistant M1 and M2 models. We found, as in clinical observations, that TIL densities after CTLA-4 blockade correlated better with efficacy than at baseline. However, our results underscored the importance of T cell functionality beyond mere quantity to distinguish responder from resistant tumors. CD8+ and CD4+ T cell dysfunction profiles sustained by intratumoral macrophages and DCs explained the resistance of M1 to anti-CTLA-4 despite high TMB and TIL quantities. In contrast, the enrichment of tumor-promoting macrophages, reduced NK cell–cDC1 axis and a cDC2high:Treghigh ratio supported the low-T cell inflamed, ‘cold’ TME of resistant M2. Notably, we found similar distribution of these immune cells in nonresponder patients to ICB. Moreover, we applied the TIDE method, which evaluates T cell dysfunction and exclusion profiles16, to our models and obtained consistent predictions of their response, highlighting their utility for the functional validation of predictors built from patient data.
We used genome-wide transcriptomes to identify a predictive signature representative of melanocytic plasticity, not previously linked to ICB or immune responses. Notably, the MPS predictor that was built to distinguish resistant M1/M2 from sensitive M3/M4 melanomas also aligned with distinct melanocytic precursors from the adult hair follicle with high multipotency capacities50 and embryonic melanoblasts49. Whether the MPS reflects melanoma immunogenicity (linked to the expression of tumor-self antigens52,53), a melanoma stemness indicator that promotes survival32, an active immunomodulatory function or a more complex combination of these remains to be elucidated in future studies. Regardless, our results underscore the complexity of ICB responses as the combination of immune-related (TIDE) and tumor cell-intrinsic (MPS) factors demonstrated improved performance of patient outcome prediction.
Our findings demonstrate that the use of mouse transcriptomes to build predictors of ICB clinical benefit, although challenging, is a valuable strategy for the discovery of evolutionarily conserved signatures. A clear advantage of the comparative analysis of distinct but genetically controlled syngeneic models is to reduce the noise derived from genetically diverse backgrounds, especially prevalent in human datasets. However, we acknowledge that validation of our signatures, although significant, is limited by relatively small patient cohorts currently available that include high quality RNA-seq data from pretreatment samples of ICB-naive melanomas. Nonetheless, we anticipate that this preclinical platform and the future development of models that are representative of other melanoma subtypes (such as uveal, acral or mucosal and NRAS or NF1 mutant) will speed the identification of additional biomarkers and immunotherapeutic targets.
Online content
Any methods, additional references, Nature Research reporting summaries, source data, extended data, supplementary information, acknowledgements, peer review information; details of author contributions and competing interests; and statements of data and code availability are available at https://doi.org/10.1038/s41591-020-0818-3.
Methods
Mouse models.
All four mouse models in this study were generated on the C57BL/6 strain background (Supplementary Fig. 1). In brief, M1 was induced in BrafCA/+; Ptenflox/+; Cdkn2aflox/+; Tyr-CreERT2-tg mice by UV radiation at postnatal day 3 and activation of CreERT2 at day 7 (refs. 18,25,54). M2 was generated in BrafCA/+; Cdkn2aflox/+; Tyr-CreERT2-tg; Hgftg mice and induced as in M1. M3 was induced in Cdk4R24C/R24C; Hgftg mice by topic administration of DMBA as described by Bald et al.55,56. Finally, M4 was generated in Hgftg mice by UV radiation at day 3 (ref. 25). CreERT2 was activated by topical 4-hydroxy-tamoxifen (4-OHT) treatment as follows: 0.1 ml of 25 mg ml−1 4-OHT in DMSO was administrated to a 1.5 × 1.5 cm patch of shaved dorsal skin, once daily for 3–5 consecutive days starting at postnatal day 7 (ref. 57). For UV treatment, a single dose of erythemal radiation generated from a bank of FS40 lamps was given to mice at postnatal day 3 (ref. 25). M1, M2 and M3 melanomas were obtained from female mice and M4 melanoma from a male mouse. Tumor fragments from each model were expanded in C57BL/6 mice as GDAs28 and viably cryopreserved to generate a tumor biobank. In parallel, cell lines from each model (CL1–4) were established and implanted into syngeneic mice (CLDA) for complementary studies (Supplementary Fig. 1). The M3 tumor (GDA3) and cell line (CL3) were provided by T. Tueting’s laboratory (University of Magdeburg)55,56. GDA4 was generated by s.c. implantation of CL4 (B2905) followed by expansion in C57BL/6 mice for at least three passages.
All mouse experiments were performed in accordance with Animal Study Protocols approved by the Animal Care and Use Committee, NCI, NIH. NCI is accredited by the Association for Assessment and Accreditation of Laboratory Animal Care and follows the Public Health Service Policy on the Care and Use of Laboratory Animals. All animals used in this research project were cared for and used humanely according to the following policies: the US Public Health Service Policy on Humane Care and Use of Animals (2015); the Guide for the Care and Use of Laboratory Animals (2011); and the US Government Principles for Utilization and Care of Vertebrate Animals Used in Testing, Research, and Training (1985).
Cell lines.
Cell lines from M1 (Mel114433), M3 (HCmel1274) and M4 (B2905) were cultured in RPMI medium supplemented with 10% FBS and 1% l-glutamine; and M2 cell line (B9013HCB) in Tu2% medium (https://wistar.org/sites/default/files/2017–11/Herlyn%20Lab%20-%20Cell%20Culture%20Techniques%20-%202017.pdf). Authentication of all cell lines was performed by WES, genotyping the alleles in corresponding mouse models and SKY analysis. CD8+ T cells from C57BL/6 spleens were cultured in RPMI medium supplemented with 10% FBS, 1% P/S, 50 μg ml−1 gentamicin, 1% l-glutamine, 1% sodium pyruvate, 1% NEAA and 55 μM β-mercaptoethanol at 37 °C and 5% CO2. Cell lines were confirmed as Mycoplasma negative using a Mycoplasma detection kit (Lonza, LT07–418).
In vivo treatments and vaccination assays.
All mice used in preclinical studies were 6–12-week-old female C57BL/6N mice, supplied by Charles River facility in NCI-Frederick, with no selection by weight. They were housed in Association for Assessment and Accreditation of Laboratory Animal Care-accredited cages as a group of five, with ad libitum food and water and a 12-h light cycle. When GDAs were used, a cryopreserved tumor fragment of 300–500 mm3 was divided and s.c. implanted into five mice. When tumors reached an average size of 500 mm3, a tumor with exponential growth kinetics was selected to be divided and implanted into ten mice. When these tumors reached an average size of 500 mm3, those with similar exponential growth kinetics were collected, divided evenly and transplanted into mice chosen for study.
For anti-CTLA-4 efficacy studies, 2–3 mm3 tumor pieces (GDA) or 1.0 × 10⁶ melanoma cells (CLDA) from each model were implanted s.c. into C57BL/6N mice. When tumors reached an average size of 75 mm3, mice were randomized and treated with mouse anti-CTLA-4 (BioXCell, BP0164, clone 9D9) or mouse IgG2b as isotype control (BioXcell, BP0086). Antibodies were administered intravenously at a final dose of 10 mg kg−1 twice per week for a total of four doses.
For anti-PD-1 efficacy studies, 1.0 × 10⁶ melanoma cells (CLDA) from each model were s.c. implanted into 6–8-week-old female C57BL/6 mice (Charles River Facility K92). When tumors reached approximately 50 mm3, mice were randomized and treated with rat anti-PD-1 (BioXCell, BE0146, clone RMP1–14) or rat IgG2a isotype control (BioXcell, BE0089, anti-trinitrophenol). Antibodies were administered intraperitoneally at a dose of 200 μg per mouse every 3 d for a total of three doses.
For vaccination assays, 1.0 × 10⁶ cells from each model received γ-irradiation at 35 (M1, M3 and M4) or 200 (M2) Gy using a 137Cs MARK I irradiator (JL Shepherd & Associates), and then s.c. injected into dorsal surface of C57BL/6 mice as vaccinated groups. After 4 weeks, the vaccinated and nonvaccinated control groups were challenged with the same number of viable melanoma cells from paired models.
Tumor size and body weight were measured 2–3 times per week and the endpoint was established as the occurrence of one of the following events: (1) tumor size reached 2,000 mm3 (anti-CTLA-4 treatment and vaccination assays) or tumor diameter reached 20 mm (anti-PD-1); (2) tumor became ulcerated; and/or (3) the mouse showed moribund status or sickness behavior.
Immunohistochemistry.
For TIL analysis of M4 cell line-derived allografts, tumors were measured twice per week and collected between 32 and 39 d post-implantation when growth kinetics distinguished responders and nonresponders to anti-CTLA-4. Nonresponder tumors measured between 190–400 mm3 and responder tumors measured between 20–125 mm3 at the time of sample collection. IgG control tumors were collected at 39 d post-injection (except one tumor collected at 32 d). IgG control tumors measured between 400–1,200 mm3 at the time of sample collection.
Formalin-fixed and paraffin-embedded 5-μm sections of GDAs (N = 3) and CLDAs (N = 3) from each melanoma model were stained with H&E, DCT (Pep8h58), TYRP1 (clone Ta99, Invitrogen, MA1–25303), SOX10 (clone EP268, Cell Marque, 383R-15) or CD3 (clone CD3–12, BioRad, MCA1477) antibodies using standard immunohistochemistry methods. Antigen retrieval was performed in a pressure cooker using target retrieval buffer pH6 (Dako, S1699). Protein-blocking reagent (Dako, X0909) and Bloxall blocking solution (Vector, SP-6000–100) were used to block nonspecific proteins and endogenous peroxidase and alkaline phosphatase activities. The antibodies were incubated overnight at 4 °C, except for SOX10, which was incubated for 30 min at room temperature, in a humidity chamber. Antibody detection was performed using Impress AP Reagent anti-rabbit Ig (Vector, MP-5401) or Impress AP Reagent anti-rat IgG (Vector, MP-5444) and ImPACT Vector Red (Vector, SK-5105). Slides were counterstained with Mayer’s hematoxylin (Electron Microscopy Sciences, 26043–06) and Giemsa (New Comer Supply, 1120A). Digital image files of slides were visualized using Aperio ImageScope (Leica Biosystems). Image analysis of immunohistochemistry slides (one section per tumor) labeled with ImPACT Vector Red was performed using an Aperio color deconvolution algorithm (code shown below).
| Algorithm Inputs | Algorithm Inputs |
|---|---|
| Version | 9.1 |
| View Width | 1,000 |
| View Height | 1,000 |
| Overlap Size | 0 |
| Image Zoom | 1 |
| Classifier | None |
| Class List | |
| Classifier Neighborhood | 0 |
| Color Channel to Quantitate | 2 |
| Markup Image Type | 0 |
| Weak Positive Threshold | 180 |
| Medium Positive Threshold | 150 |
| Strong Positive Threshold | 120 |
| Black Threshold | 0 |
| Color(1) Red OD | 0.65 |
| Color(1) Green OD | 0.704 |
| Color(1) Blue OD | 0.286 |
| Color(2) Red OD | 0.286 |
| Color(2) Green OD | 0.715 |
| Color(2) Blue OD | 0.637 |
| Color(3) Red OD | 0.451 |
| Color(3) Green OD | 0.576 |
| Color(3) Blue OD | 0.682 |
Western blot.
Western blots were performed by standard methods using the following antibodies: anti-MET (clone 25H2, Cell Signaling Technology, 3127), anti-phospho-Met (Tyr1234/1235, clone D26, Cell Signaling Technology, 3077), anti-ERK1/2 (p44/42 MAPK, clone 137F5, Cell Signaling Technology, 4695), anti-phospho-ERK (p44/42 MAPK, clone D13.14.4E, Cell Signaling Technology, 4370), anti-PTEN (clone D4.3, Cell Signaling Technology, 9188), anti-AKT (clone C67E7, Cell Signaling Technology, 4691), anti-phospho-AKT (clone D9E, Cell Signaling Technology, 4060) and anti-GAPDH (EMD Millipore Corp, MAB374).
Antigen presentation, T cell activation assays and flow cytometry.
For the validation of MHC-I-related gene expression in the cell lines from the four models, cells were cultured for 24 h in medium containing 20 ng ml−1 of mouse recombinant IFN-γ (MBL International, JM-4117–100). Cells were stained with H2-Kb-APC antibody (clone AF6 88.5, BioLegend, 116518) and analyzed by flow cytometry using a BD FACSCanto II device. MHC-I-related gene expression was analyzed by mRNA reverse transcription (SuperScript III Reverse Transcriptase, ThermoFiser Scientific, 18080044) and qPCR (Kappa Biosystems, KK4603) (RT–qPCR). The following primers were used: B2m-Fwd: TTCTGGTGCTTGTCTCACTGAC, B2m-Rev: CAGTATGTTCGGCTTCCCATTC; Tap1-Fwd: AGAAGAGACGTC TCTACCTGG, Tap1-Rev: TGGTGAGAATGGACATGAGCC; Tapbp-Fwd: TCTACCTGGCTACGGTACAC, Tapbp-Rev: GGGAAGAAGTGGGATGCAA GA and Psmb9-Fwd: ATGCCCAAGCCATAGCTGAC, Psmb9-Rev: GCTAACA AGTCCTCACGGTAC.
For T cell activation assays, M1, M2 and M4 cells were transduced with a lentiviral vector for the expression of a 9aa peptide from mouse DCT protein35 fused to the C terminus of eGFP protein but separated by a 2aa linker to ensure cleavage and presentation by MHC-I (ref. 36). GFP+ cells were sorted in a BD FACSAria Fusion device and GFP–Dct expression was confirmed by RT–qPCR (primers: Dct-Fwd: TTCCCCGAGTCTGCATGAC, Dct-Rev: TGCATGTCC GGTTGAAGAATTT; eGFP–DCT-Fwd: ACATGGTCCTGCTGGAGTTCGTG, eGFP–DCT-Rev: AAGCAGCGTATCCACATAGC). Naive CD8+ T cells from C57BL/6N splenocytes (from five mice) were sorted using anti-mouse CD8a particles (BD Biosciences, 551516) and cultured under CD3, CD28 and interleukin-2 stimulation for 2 d. CD8+ T cells were transduced with recombinant TCR Vβ3 for the recognition of the 9aa DCT peptide (DCT-Vβ3) or Thy1.1 retroviral vector and left resting (without CD3 and CD28 stimulation) for 1 d. Transduction efficiency was confirmed by flow cytometry using BD FACSCanto II device. Recombinant Vβ3+ and Thy1.1+ T cells were co-cultured with the melanoma cells from each model in a 1:1 ratio. After 24-h co-culture, the concentration of IFN-γ in the medium was measured by ELISA (Invitrogen, 88–7314). T cells from 24-h co-cultures were collected, stained with CD8a-APC (clone 53–6.7, eBiosciences, 17–0081-82), CD137-PE (41BB, clone 17B5, BioLegend, 106106), Vβ3-FITC (clone KJ25, BD Pharmigen, 553208) and CD90.1 (Thy1.1)-PECy7 (clone HIS51, eBiosciences, 25–0900-82) antibodies and analyzed by flow cytometry using a BD LSR Fortessa SORP I device. All flow cytometry data were analyzed using FlowJo v.10 software.
Phenotypic analysis of tumor immune infiltrate.
For immunophenotyping, 1.0 × 10⁶ melanoma cells from each model were implanted s.c. into C57BL/6N mice. When tumors reached 100–300 mm3, mice were killed for tumor collection and were processed as previously described59,60. Briefly, tumors were weighed, mechanically disrupted and incubated in RPMI medium containing 1 mg ml−1 of DNase I (Roche, 10104159001), 200 U of collagenase IV (Gibco, 17104–019), and 0.5% FCS for 40 min at 37 °C. Red blood cells were lysed using ACK buffer and cells were resuspended in 2 mM EDTA PBS and stained with LIVE/DEAD Fixable Dead Cell Stain kit (Invitrogen) for 15 min at 4 °C. Next, cells were stained with the corresponding antibody cocktail prepared in Brilliant stain buffer (BD Biosciences). Fc receptors were blocked with anti-CD16/32 antibody (2.4G2, BioXcell) and the following anti-mouse antibodies were used: CD45.2 (clone 104), CD4 (GK1.5), CD62L (MEL-14), CD223/Lag3 (C9B7W), CD279/PD1 (RMP1–30), TCR-β (H57–597), NK1.1 (PK-136), TIGIT (1G9), Ly6G (1A8), CD64 (X54–5/7.1), CD274/PDL1 (MIH5), CD24 (M1/69), Ly6C (AL-21), CD135 (A2F10.1), SiglecF (E50–2440), all purchased from BD Biosciences; CD127 (A7R34), CD8a (53–6.7), Ly6G (1A8), CD44 (IM7), CD103 (2E7), CX3CR1 (SA011F11), ICAM1 (YN1/1.7.4), NK1.1 (PK136), CD206 (C068C2), F4/80 (BM8) all purchased from BioLegend; TIM3 (RMT3–23), F4/80 (BM8), CD19 (eBio1D3), TCRγδ (eBioGL3), CD25 (PC61 5.3), KLRG1 (2F1), MHC-II (M5/114.15.2), TCRβ (H57–597), Ter119 (TER-119), CD19 (eBio1D3), CD11c (N418), CD11b (M1/70), all purchased from eBioscience. When biotinylated antibodies were used, cells were subsequently incubated with fluorochrome-conjugated streptavidin. Following surface staining, cells were fixed and permeabilized using FOXP3/Transcription Factor Staining Buffer kit (eBioscience) according to the manufacturer’s instructions and intracellularly stained with a combination of the following anti-mouse antibodies: FOXP3 (FJK-16s) and CD3 (145–2C11) from eBioscience, CD68 (FA-11) from BioLegend. Samples were acquired in a FACS Symphony A5 running under BD FACSDiva software (BD Biosciences) and data were analyzed with FlowJo software (v.10.6.0). Further analysis was performed with the R package Cytofkit2 (J. Chen’s laboratory)61. The t-SNE algorithm was run with a concatenation of five samples per tumor type and four tumor types simultaneously. For cluster analysis, Rphenograph was selected in the same package (k = 30) and the clusters were annotated based on expression levels of the markers of interest. Clusters representing the populations of interest were selected and quantified in FlowJo. Frequencies from total leukocytes (Live CD45+ cells) were determined and absolute numbers per mg of tumor were calculated.
Spectral karyotyping.
Cells from the four melanoma models were arrested in metaphase by incubation with 10 μg ml−1 of Colcemid (15210–040, KaryoMax Colcemid solution, Invitrogen) for 3 h before collection. Cells were collected and treated with hypotonic solution (0.075 M KCL, 6858–04, Macron Chemical) for 15 min at 37 °C and fixed with methanol and acetic acid at a 3:1 dilution. Slides were prepared and aged overnight for use in SKY analysis.
The metaphases were hybridized with the 21-color mouse SKY paint kit (FPRPR0030, ASI) according to the manufacturer’s protocol62. Hybridization was carried out in a humidity chamber at 37 °C for 16 h. The post-hybridization rapid wash procedure was used with 0.4× saline-sodium citrate buffer at 72 °C for 4 min. Detection was carried out following the manufacturer’s protocol. Spectral images of the hybridized metaphases were acquired using Hyper Spectral Imaging system (Applied Spectral Imaging) mounted on top of an epi-fluorescence microscope (Imager Z2, Zeiss). Images were analyzed using HiSKY 7.2 acquisition software (Genasis, Applied Spectral Imaging). G-banding was simulated by electronic inversion of DAPI counterstaining. An average of 10–15 mitoses of comparable staining intensity and quality was examined per cell line and compared for chromosomal abnormality. The karyotype was determined by comparison to the standard ideogram of banding patterns for mouse chromosomes63.
Whole-exome sequencing.
Mouse genomic DNA concentration was measured using the picogreen assay. A total of 200 ng of DNA was sheared by Covaris Instrument (E210) to ~150–200 bp fragments. Shearing was performed in a Covaris snap cap tube (microTUBE Covaris p/n 520045) with the following parameters: duty cycle, 10%; intensity, 5; cycle burst, 200; time, 360 s at 4 °C. Samples quality assessment/size was validated by Bioanalyzer DNA high sensitivity kit (Agilent Technologies, 5067-4626).
Agilent SureSelectXT library prep ILM Kit (Agilent Technologies, G9611A) was used to prepare the library for each sheared mouse DNA sample. DNA fragment ends were repaired, followed by adenylation of the 3′ end and then ligation of paired-end adaptor. Adaptor-ligated libraries were then amplified (precapture PCR amplification: 98 °C 2 min, ten cycles; 98 °C 30 s; 65 °C 30 s; 72 °C 1 min; then 72 °C 10 min, 4 °C hold) by Herculase II fusion enzyme (Agilent Technologies, 600679). After each step, DNA was purified by Ampure XP beads (Beckmann Coulter Genomics, A63882). DNA Lo Bind Tubes, 1.5 ml of PCR clean (Eppendorf, 022431021) or 96-well plates were used to process the samples.
Samples were analyzed by bioanalyzer using a DNA-1000 kit (Agilent, 5067-1504). Concentration of each library was determined by integrating under the peak of approximately 225–275 bp. Then each genomic DNA library (~750–1,000 ng) was hybridized with biotinylated mouse-specific capture RNA baits (SureSelectXT Mouse All Exon, 5190–4641, 16 reactions) in the presence of blocking oligonucleotides. Hybridization was performed at 65 °C for 16 h using SureSelectXT kit reagents. Bait-target hybrids were captured by streptavidin-coated magnetic beads (Dynabeads MyOne Streptavidin T1, Life Technologies, 6560) for 30 min at room temperature. Then after a series of washes to remove the nonspecifically bound DNA, the captured library was eluted in nuclease-free water and half volume was amplified with individual index (post-capture PCR amplification: 98 °C 2 min; ten cycles, 98 °C 30 s; 57 °C 30 s; 72 °C 1 min; then 72 °C 10 min, 4 °C hold). A Bioanalyzer high sensitivity kit was used to validate the size of the libraries before sequencing.
Single-nucleotide variant analysis.
All analyses were carried out on NIH’s biowulf2 high performance computing environment. Statistical analysis was carried out in the R environment.
Fastq sequence reads were mapped to the mouse reference genome mm10 with BWA or Bowtie. Single-nucleotide variants were identified using samtools mpileup or GATK HaplotypeCaller. Mouse germline single-nucleotide polymorphisms were filtered out using the Sanger Mouse Genomes Project database for variants identified from whole genome sequencing of 36 mouse strains (ftp://ftp-mouse.sanger.ac.uk/current_snps/mgp.v5.merged.snps_all.dbSNP142.vcf.gz). Variants with a Phred-scaled quality score <30 were removed. Variants that are present in normal spleen samples (in-house collection) were also removed. Variants were annotated with Annovar software to identify nonsynonymous mutations.
For mutation signature analysis, 5′ and 3′ nucleotide sequences flanking the mutations were retrieved from the mm10 reference genome using bedtools getfasta. The frequency of 96 trinucleotides (six substitutions multiplied by 16 combinations of 5′ and 3′ nucleotides) was computed for each sample with an in-house R script. Cosmic Signatures29 were identified using the R package deconstructSigs.
For clustering analysis with TCGA samples, we used 20 genes that are most frequently mutated in human melanoma studies31. The samples (the cell lines or GDAs from the four models or TCGA melanomas) that have a mutation from the 20-gene list were coded as 1 for that gene, whereas the samples without mutation were coded as 0 for that gene. The heat map and oncoprint plots were generated using the R package ComplexHeatmap.
RNA sequencing.
Between 100 ng to 1 μg of total RNA was used to capture mRNA with oligonucleotide-dT coated magnetic beads. The mRNA was fragmented, and then a random-primed cDNA synthesis was performed. The RNA was fragmented into small pieces and cleaved RNA fragments were copied into first strand cDNA using RT and random primers, followed by second-strand cDNA synthesis using DNA polymerase I and RNase H. The resulting double-strand cDNA was used as input to a standard Illumina library prep with end repair, adaptor ligation and PCR amplification being performed to obtain a sequencing-ready library. The final purified product was then quantitated by qPCR before cluster generation and sequencing.
Differential gene expression analysis.
The sequence reads in fastq format were aligned to the mouse reference genome mm10 using STAR64 and RSEM65 to obtain gene expression as transcript per million and FPKM mapped reads. Pairwise differential expression of the cell line-derived allografts from the four melanoma models was performed using DESeq2 (ref. 66). For untreated melanomas, the 20% most differentially expressed genes between the models (M1 versus M3, M1 versus M4, M2 versus M3 and M2 versus M4) were used to generate a heat map by unsupervised hierarchical clustering using R. The functional category of the differentially expressed genes was analyzed by IPA (QIAGEN) using the ‘Disease and functions’ annotation.
Gene-set enrichment analysis, differentiation trajectory signature analysis, CIBERSORT and immune cell signatures analysis.
The gene expression counts of RNA-seq data from cell line-derived allografts were analyzed by DESeq2 (v.1.25.1.) to compare models and then results were further analyzed by gene-set enrichment analysis67. For each comparison between two models, we identified enriched ‘Hallmark’ pathways and considered significant ones with a false discovery rate <0.05.
For the analysis of the four-stage differentiation signature (‘differentiation trajectory’ signature)32 in the four models, z scores for each gene in the signature were calculated from gene expression data of untreated cell line-derived allografts and a semi-supervised heat map was generated using R. The reported classification of TCGA skin cutaneous melanomas (TCGA SKCM) into four differentiation categories32 was used. The average gene expression of each gene in the differentiation trajectory signature for the TCGA SKCM samples from each category was compared to the expression in untreated tumors from the four models across genes by Pearson correlation analysis.
For immune cell signatures analysis (Supplementary Table 7, refs. 16,45,46,68,69), the average of gene expression as log2(FPKM + 1) of all genes in each signature was calculated from the four models untreated CLDAs and ipilimumab-treated melanomas from the Van Allen dataset4. The CTL levels were calculated in the same samples as previously decribed16.
For the analysis of immune cell population abundance from RNA-seq data, we used the CIBERSORT tool41. In particular, we analyzed the cell fraction of protumor macrophages (‘M2 macrophages’) in untreated CLDAs from each model and ipilimumab-treated melanomas from the Van Allen dataset4. Only the samples from the Van Allen dataset with P values ≤0.1 and Pearson correlation r > 0.1 were included in the analysis.
TIDE score prediction.
The gene expression data of the untreated cell line-derived allografts from each model were analyzed by the TIDE tool using the TIDE web application at http://tide.dfci.harvard.edu/, following the developer’s instructions. We used a cutoff value of 0 to predict response of each tumor.
MPS development.
Based on the expression of untreated cell line-derived tumors from the four mouse models, the differentially expressed genes comparing M1 and M2 to M3 and M4 were identified by Student’s t-test on the FPKM data and by DESeq2 (v.1.25.1.) on the RNA-seq count data. The differentially expressed genes were ranked by log2fold-change from DESeq2. Our gene selection approach started from choosing the two most upregulated genes and stepwise adding the next most upregulated gene and using the sum of gene expression as a score to classify patient samples in the Van Allen dataset4. We used Fisher’s exact test to evaluate the performance of our classifier in predicting patient response to treatment. We chose the largest gene list that had a P value <0.05 as derived from Fisher’s exact test and identified 27 upregulated genes using this approach. Similarly, we identified 12 downregulated genes ranked by t-statistic. In addition, we identified another eight upregulated genes ranked by −log2fold-change multiplied by log10 (Padj) from DESeq2 (v.1.25.1); two of them overlapped with the 27 upregulated genes identified before. In the end, we had a 45-gene signature consisting of 33 upregulated genes and 12 downregulated genes in M1/M2. To calculate MPS scores the expression of 45 genes in FPKM was weighted by 1 for upregulated genes and −1 for downregulated genes and added together. MPS scores were converted to z scores in each dataset. For MPS and TIDE combination, z scores for each predictor were calculated and added together for each patient in each dataset.
The functional category of 45 genes in the MPS was analyzed by IPA (QIAGEN) using the ‘Disease and Bio function’ annotation.
Statistical analysis.
For in vivo therapeutic studies, tumors were measured independently by an animal technician and the size (V) was calculated as following: V = 0.5 × L × W2, in which L is the longer diameter and W is the shorter diameter. The survival time of the mice was defined as the duration from tumor implantation to the occurrence of one of the following events: (1) the tumor reached 2,000 mm3; (2) the tumor became ulcerated; or (3) the mouse showed moribund status or sickness behavior. The Kaplan–Meier survival analysis was performed using GraphPad Prism software (v.7.0.1), and significance was analyzed by the log-rank (Mantel–Cox) test. For vaccination studies, tumor onset time was defined as the post-implantation time when the tumor was observed to be palpable independently by an animal technician.
Unless otherwise indicated, all comparisons between two groups were analyzed by a Mann–Whitney U-test with 95% confidence level using GraphPad Prism software (v.7.0.1). For phenotypic analysis of tumor immune infiltrate in the four models, Kruskal–Wallis test followed by correction of multiple comparisons by Dunn’s test was performed in GraphPad Prism software (v.7.0.1). For survival analysis of Van Allen4 and Hugo–Riaz9,13 datasets, Kaplan–Meier and log-rank (Mantel–Cox) tests were performed in GraphPad Prism software (v.7.0.1). All P values obtained were two-tailed.
Contact for reagents and resource sharing.
Further information and requests for resources and reagents should be directed to and will be fulfilled by G.M. as corresponding author. Requests for reagents derived from mouse models (alleles, tumor tissues, cell lines) and DNA constructs developed in this study will require a material transfer agreement as per NIH guidelines.
Reporting Summary.
Further information on research design is available in the Nature Research Reporting Summary linked to this article.
Data availability
WES raw data of the melanomas and cell lines from the four models and RNA-seq raw data of the cell line-derived allografts from the four models was deposited on Gene Expression Omnibus accession code: GSE144946.
Code availability
The custom code used in this manuscript is available in Online Methods.
Extended Data
Extended Data Fig. 1 |. Study design and sample processing.

Melanomas were induced in four genetically engineered mice (GEM) harboring the indicated genetic modifications by ultraviolet (UV) radiation or 7,12-Dimethylbenz[a]anthracene (DMBA) topical administration at postnatal day 3 and activation of CreERT2 at day 7. Fragments from each melanoma were expanded in C57BL/6 syngeneic mice and viably archived at low passage to generate a GEM-derived allograft (GDA) biobank. A cell line (CL) from each model was isolated. GDA and cell line-derived allografts (CLDA) were implanted in C57BL/6 mice and treated with CTLA-4 blocking antibody (αCTLA-4) or isotype control. GDAs, CLDAs and CLs from each model were processed in triplicates for whole exome sequencing (WES), RNA sequencing and/or histopathology.
Extended Data Fig. 2 |. Generation of four mouse models representative of diverse human melanomas.

a, Representative images showing chromosomal duplications and translocations analyzed by spectral karyotyping (SKY) of the four melanoma cell lines. N = 12 cells for M1, N = 15 cell for M2, N = 15 for M3 and N = 10 cells for M4 from one experiment. See also Supplementary Table 2. b, Distribution of COSMIC mutation signatures29 found in the four models (GDAs and cell lines). c, GDAs and cell lines derived from the four mouse models were clustered accordingly to their mutation profiles with TCGA patient samples from different mutation categories (i.e., BRAF, NRAS or NF1 mutants, or triple-wildtype27,31). d, Immunoblot showing MAPK and PI3K activation and expression of the indicated proteins in the four melanoma cell lines. Representative cropped images of three independent experiments are shown (see full scans in Source Data Extended Data Fig. 2).
Extended Data Fig. 3 |. Tumor immunogenicity correlates with αCTLA-4 response in the melanoma models.

a, Schematic of the in vivo study design. 1.0×10⁶ γ-irradiated melanoma cells from each model were injected subcutaneously into C57BL/6 mice as vaccinated groups. After 4 weeks, the vaccinated and non-vaccinated control groups were challenged with the same number of viable melanoma cells from paired models. b-e, Tumor growth curves (left panels) and tumor onset (right panels) of vaccinated (magenta) and control (light blue) groups from M1 (b, N = 9 mice in control and N = 8 mice in vaccinated group), M2 (c, N = 10 mice), M3 (d, N = 5 mice) and M4 (e, N = 5 mice). Asterisk highlights the mice that did not develop tumors (d, 2/5 from vaccinated group). The time of tumor onset was considered as the first day after implantation when tumors were measurable. Data is depicted as the mean and error bars represent S.E.M. Mann-Whitney test two-tailed P-values are indicated (b-e, right panels).
Extended Data Fig. 4 |. Increased tumor-infiltrating lymphocytes are associated with αCTLA-4 response in the melanoma models.

a, Representative images of CD3 immunostaining (red staining) of the four melanoma models (untreated). N = 6 melanomas (one section per tumor) from two independent experiments. Arrows point to the area magnified and bars represent 200μm. b, Automated quantification of CD3 positive area obtained from (a). Whole-tumor sections from melanomas of each model were quantified using Aperio software from one experiment. N = 6 melanomas (one section per tumor) from two independent experiments. c, Tumor growth curves of M4 melanomas treated with αCTLA-4 (green and red lines) or isotype antibody (blue dashed line). Red arrow indicates the time of the first dose of the treatment. Tumors were considered non-responders (NR, green) when their size was >150mm3 and increasing for more than 2 consecutive measurements and responders (R, red) when their size was <120mm3 and decreasing for more than 2 consecutive measurements. d, Percentage of CD3 positive area in whole-tumor sections from M4 treated with αCTLA (NR, green bar and R, red bar) or isotype antibody (blue bar). Data are depicted as the mean and error bars represent S.E.M (N = 5 isotype control treated tumors, N = 6 NR tumors and N = 9 R tumors). Kruskal-Wallis test P-values adjusted by Dunn’s test for multiple comparisons (b) and Mann-Whitney test two-tailed P-values (d) are indicated.
Extended Data Fig. 5 |. High parametric flow cytometry analysis of the intratumoral immune cell populations from the four melanoma models.

a, Total number of leukocytes (CD45+ cells) infiltrating the untreated cell line-derived allografts of the four melanoma models. b-f, Percentage of intratumoral eosinophils (CD11b+Ly6G−Ly6CintSiglecF+F4/80+CD64−CD24+) (b), neutrophils (CD11b+Ly6G+Ly6CintSiglecF−CD24+) (c), macrophages (CD11b+CD68hiC D64+F480+Ly6C−Ly6G−SiglecF−CD24−) (d), dendritic cells (Ly6G−SiglecF−CD11c+MHC-II+CD64−CD24int/hiCD135+) (e) and Treg (CD3+TCRβ+CD4+CD25 +FoxP3+) (f). Data from a representative of two experiments is depicted as the mean (N = 5 untreated tumors per model) and error bars represent S.E.M. Kruskal-Wallis test P-values adjusted by Dunn’s test for multiple comparisons are indicated (a-f). See also Supplementary Table 6 for the population definition.
Extended Data Fig. 6 |. High expression of T-cell exhaustion markers in αCTLA-4-resistant M1 melanomas.

a, Expression of the indicated markers per intratumoral CD3+ T-cell from the four models analyzed by t-stochastic neighbor embedding (t-SNE). The t-SNE plots show a representative of two independent experiments (N = 5 tumors per model). The samples from each model were color coded as indicated (first left upper plot). b-d, Expression of PD-1 (b), TIM3 (c) and LAG3 (d) in CD8+ T-cells as the mean fluorescence intensity (MFI) from flow cytometry. e-f, Expression of PD-L1 in macrophages (e) and dendritic cells (DCs) (f) as MFI from flow cytometry. Data from a representative of two experiments is depicted as the mean (N = 5 untreated tumors per model) and error bars represent S.E.M. Kruskal-Wallis test P-values adjusted by Dunn’s test for multiple comparisons are indicated (b-f). See also Supplementary Table 6 for the population definition. g, Expression of T-cell exhaustion and dysfunction markers38,39 in untreated tumors from the four models. Data is shown as FPKM from RNA sequencing analysis (N = 4 tumors).
Extended Data Fig. 7 |. Specific myeloid and lymphoid populations correlate with the response to αCTLA-4.

a, Percentage of CD206+ macrophages infiltrating untreated cell line-derived allografts from the four models. b-c, Expression of CD206 (b) and MHC-II (c) in the intratumoral macrophages measured by flow cytometry (MFI: mean fluorescence intensity). Data from a representative of two experiments is depicted as the mean (N = 5 tumors per model) and error bars represent S.E.M. (a-c). Kruskal-Wallis test P-values adjusted by Dunn’s test for multiple comparisons are indicated (a-c). See also Supplementary Table 6 for the population definition. d-e, Fraction of pro-tumor macrophages obtained by CIBERSORT41,42 analysis of the transcriptomes of the four models (d) and metastatic melanoma patients treated with Ipilimumab (αCTLA-4, Van Allen data set4) (e). Bar center represent the mean (N = 4 untreated tumors) and error bars represent S.E.M. (d). Boxes represent the median, upper and lower quartiles and the whiskers the minimum to maximum range (N = 9 non-responder and N = 7 responder patients). Unpaired t-test two-tailed P-value is indicated (e). f, Percentage of intratumoral NK cells (CD3−NK1.1+) in untreated melanomas from the four models by flow cytometry (N = 5 tumors). g, Ccl5 and Xcl1 expression from RNA sequencing analysis of the four models (N = 4 untreated tumors). Data is depicted as the mean and error bars represent S.E.M (f,g). h, CCL5, XCL1 and XCL2 expression in ipilimumab-treated melanoma patients (αCTLA-4, Van Allen data set) with High (N = 16 patients, orange) and Low (N = 17, blue) NK and cDC1 signature levels. Boxes represent the median, upper and lower quartiles and the whiskers the minimum to maximum range. i, Expression of CD44 and PD-1 as the mean fluorescence intensity (MFI) from flow cytometry in the conventional CD4+ T-cells (CD4+ Tconv) infiltrating the four models (N = 5 untreated tumors). P-values from Kruskal-Wallis test adjusted by Dunn’s test for multiple comparisons (f,g) and two-tailed P-values from Mann-Whitney test (h) are indicated.
Extended Data Fig. 8 |. Association of the predictive signature with melanocytic lineage differentiation.

a, Top 10 IPA Disease and Bio function categories enriched in the 45 genes of the signature. X axis represent Fisher’s exact test P-values. The number of MPS genes in each category (N) are indicated. b, c, Expression of the Melanocytic Plasticity Signature (MPS) genes and MPS scores of mouse melanoblasts (days E15.5 and E17.5) vs. melanocytes (P1 and P7)49 (N = 1 sample per stage) (b) and multipotent (CD34+) vs. melanocytic committed (CD34−) melanocyte stem cells from the hair follicles of P56 mice50 (N = 3 samples per population) (c). Data is represented as the z-scores from RNA sequencing (b, c).
Extended Data Fig. 9 |. The Melanocytic Plasticity Signature (MPS) predicts patient outcome in response to αPD-1.

a, Melanocytic Plasticity Signature (MPS) in ipilimumab-naïve melanoma patients treated with αPD-1 (Hugo and Riaz data sets9,13). The box-plot shows the MPS scores of baseline samples from non-responder (NR, green, N = 25) and responder (R, violet, N = 25) patients. Boxes represent the median, upper and lower quartiles and the whiskers the minimum to maximum range. Mann-Whitney test two-tailed P-values are indicated. b, Kaplan-Meier curves of the overall survival of the patients in (a) accordingly to their MPS scores. c, Area under the ROC curve (AUC) values comparing the prediction performance of Tumor mutation burden (TMB), PD-L1 expression, TIDE16 and MPS scores in Van Allen4 (left, N = 42 patients) and Hugo-Riaz9,13 (right, N = 50 patients) data sets. d, Kaplan-Meier curves of the overall survival of the patients in (a) accordingly to their TIDE scores. N for each group and two-tailed P-values from the Log-rank (Mantel-Cox) test are indicated (b, d).
Extended Data Fig. 10 |. The response of the four melanoma models to αPD-1 is similar to αCTLA-4.

a, Schematic of the in vivo study design. 1.0 ×10⁶ melanoma cells from each model were implanted subcutaneously into C57BL/6 syngeneic mice. When the tumors reached 50mm3, mice were randomized and treated with αPD-1 or isotype antibody as control every 3 days for a total of 3 doses. b, Tumor growth of the melanomas from the indicated models upon treatment with αPD-1 (red lines) or isotype control (blue lines). N = 10 per group. c, Kaplan-Meier survival curves from (b). A representative from two experiments is shown. Two-tailed P-value from Gehan-Breslow-Wilcoxon test is indicated (c).
Supplementary Material
Acknowledgements
We thank T.A. Chan (Memorial Sloan-Kettering Cancer Center) for suggestions and comments; T. Tüting (University of Magdeburg), M. McMahon (University of Utah) and M. Bosenberg (Yale School of Medicine) for mouse reagents; E. Van Allen (Dana-Farber Cancer Institute) for sharing clinical data; S. Burkett (Molecular Cytogenetics Core Facility, MCGP, NCI-Frederick) for SKY analysis; C. Redon (NCI) for assistance with gamma irradiation; Y. Boumber (Fox Chase Cancer Center) and C. Alewine (NCI) for manuscript revision and editing. This research was supported in part by funds from the NIH intramural research program and a FLEX Synergy Award from the NCI Center for Cancer Research. An NCI Director’s Innovation Award to E.P.-G. helped support this project. R.S.L. received founding from the Ressler Family Foundation and from Merck and Bristol-Myers Squibb. W.H. received a Daneen & Charles Stiefel Investigative Scientist Award from American Skin Association and a Young Investigator Award from Melanoma Research Alliance.
Footnotes
Competing interests
R.S.L. received funding from Merck and Bristol-Myers Squibb. The rest of the authors declare no competing interests.
Additional information
Extended data is available for this paper at https://doi.org/10.1038/s41591-020-0818-3.
Supplementary information is available for this paper at https://doi.org/10.1038/s41591-020-0818-3.
Peer review information Javier Carmona was the primary editor on this article and managed its editorial process and peer review in collaboration with the rest of the editorial team.
Reprints and permissions information is available at www.nature.com/reprints.
References
- 1.Wei SC, Duffy CR & Allison JP Fundamental mechanisms of immune checkpoint blockade therapy. Cancer Discov. 8, 1069–1086 (2018). [DOI] [PubMed] [Google Scholar]
- 2.Zappasodi R, Merghoub T & Wolchok JD Emerging concepts for immune checkpoint blockade-based combination therapies. Cancer Cell 33, 581–598 (2018). [DOI] [PMC free article] [PubMed] [Google Scholar]
- 3.Snyder A et al. Genetic basis for clinical response to CTLA-4 blockade in melanoma. N. Engl. J. Med. 371, 2189–2199 (2014). [DOI] [PMC free article] [PubMed] [Google Scholar]
- 4.Van Allen EM et al. Genomic correlates of response to CTLA-4 blockade in metastatic melanoma. Science 350, 207–211 (2015). [DOI] [PMC free article] [PubMed] [Google Scholar]
- 5.Nathanson T et al. Somatic mutations and neoepitope homology in melanomas treated with CTLA-4 blockade. Cancer Immunol. Res. 5, 84–91 (2017). [DOI] [PMC free article] [PubMed] [Google Scholar]
- 6.Rizvi NA et al. Cancer immunology. Mutational landscape determines sensitivity to PD-1 blockade in non-small cell lung cancer. Science 348, 124–128 (2015). [DOI] [PMC free article] [PubMed] [Google Scholar]
- 7.Tumeh PC et al. PD-1 blockade induces responses by inhibiting adaptive immune resistance. Nature 515, 568–571 (2014). [DOI] [PMC free article] [PubMed] [Google Scholar]
- 8.Chen PL et al. Analysis of immune signatures in longitudinal tumor samples yields insight into biomarkers of response and mechanisms of resistance to immune checkpoint blockade. Cancer Discov. 6, 827–837 (2016). [DOI] [PMC free article] [PubMed] [Google Scholar]
- 9.Riaz N et al. Tumor and microenvironment evolution during immunotherapy with nivolumab. Cell 171, 934–949 (2017). [DOI] [PMC free article] [PubMed] [Google Scholar]
- 10.Zaretsky JM et al. Mutations associated with acquired resistance to PD-1 blockade in melanoma. N. Engl. J. Med. 375, 819–829 (2016). [DOI] [PMC free article] [PubMed] [Google Scholar]
- 11.Rodig SJ et al. MHC proteins confer differential sensitivity to CTLA-4 and PD-1 blockade in untreated metastatic melanoma. Sci. Transl. Med. 10, eaar3342 (2018). [DOI] [PubMed] [Google Scholar]
- 12.Gao J et al. Loss of IFN-γ pathway genes in tumor cells as a mechanism of resistance to anti-CTLA-4 therapy. Cell. 167, 397–404 (2016). [DOI] [PMC free article] [PubMed] [Google Scholar]
- 13.Hugo W et al. Genomic and transcriptomic features of response to anti-PD-1 therapy in metastatic melanoma. Cell 165, 35–44 (2016). [DOI] [PMC free article] [PubMed] [Google Scholar]
- 14.Ayers M et al. IFN-γ-related mRNA profile predicts clinical response to PD-1 blockade. J. Clin. Invest. 127, 2930–2940 (2017). [DOI] [PMC free article] [PubMed] [Google Scholar]
- 15.Auslander N et al. Robust prediction of response to immune checkpoint blockade therapy in metastatic melanoma. Nat. Med. 24, 1545–1549 (2018). [DOI] [PMC free article] [PubMed] [Google Scholar]
- 16.Jiang P et al. Signatures of T cell dysfunction and exclusion predict cancer immunotherapy response. Nat. Med. 24, 1550–1558 (2018). [DOI] [PMC free article] [PubMed] [Google Scholar]
- 17.Jerby-Arnon L et al. A cancer cell program promotes T cell exclusion and resistance to checkpoint blockade. Cell. 175, 984–997 (2018). [DOI] [PMC free article] [PubMed] [Google Scholar]
- 18.Dankort D et al. Braf(V600E) cooperates with Pten loss to induce metastatic melanoma. Nat. Genet. 41, 544–552 (2009). [DOI] [PMC free article] [PubMed] [Google Scholar]
- 19.Chin L et al. Cooperative effects of INK4a and Ras in melanoma susceptibility in vivo. Genes Dev. 11, 2822–2834 (1997). [DOI] [PMC free article] [PubMed] [Google Scholar]
- 20.Ackermann J et al. Metastasizing melanoma formation caused by expression of activated N-RasQ61K on an INK4a-deficient background. Cancer Res. 65, 4005–4011 (2005). [DOI] [PubMed] [Google Scholar]
- 21.Dhomen N et al. Oncogenic Braf induces melanocyte senescence and melanoma in mice. Cancer Cell. 15, 294–303 (2009). [DOI] [PubMed] [Google Scholar]
- 22.Damsky WE et al. β-catenin signaling controls metastasis in Braf-activated Pten-deficient melanomas. Cancer Cell 20, 741–754 (2011). [DOI] [PMC free article] [PubMed] [Google Scholar]
- 23.Veierod MB, Adami HO, Lund E, Armstrong BK & Weiderpass E Sun and solarium exposure and melanoma risk: effects of age, pigmentary characteristics and nevi. Cancer Epidemiol. Biomarkers Prev. 19, 111–120 (2010). [DOI] [PubMed] [Google Scholar]
- 24.Day CP, Marchalik R, Merlino G & Michael H Mouse models of UV-induced melanoma: genetics, pathology, and clinical relevance. Lab. Invest. 97, 698–705 (2017). [DOI] [PMC free article] [PubMed] [Google Scholar]
- 25.Noonan FP et al. Neonatal sunburn and melanoma in mice. Nature 413, 271–272 (2001). [DOI] [PubMed] [Google Scholar]
- 26.De Fabo EC, Noonan FP, Fears T & Merlino G Ultraviolet B but not ultraviolet A radiation initiates melanoma. Cancer Res. 64, 6372–6376 (2004). [DOI] [PubMed] [Google Scholar]
- 27.Cancer Genome Atlas. Genomic classification of cutaneous melanoma. Cell 161, 1681–1696 (2015). [DOI] [PMC free article] [PubMed] [Google Scholar]
- 28.Day CP, Merlino G & Van Dyke T Preclinical mouse cancer models: a maze of opportunities and challenges. Cell 163, 39–53 (2015). [DOI] [PMC free article] [PubMed] [Google Scholar]
- 29.Alexandrov LB et al. Signatures of mutational processes in human cancer. Nature 500, 415–421 (2013). [DOI] [PMC free article] [PubMed] [Google Scholar]
- 30.Vidwans SJ et al. A melanoma molecular disease model. PloS ONE. 6, e18257 (2011). [DOI] [PMC free article] [PubMed] [Google Scholar]
- 31.Hayward NK et al. Whole-genome landscapes of major melanoma subtypes. Nature 545, 175–180 (2017). [DOI] [PubMed] [Google Scholar]
- 32.Tsoi J et al. Multi-stage differentiation defines melanoma subtypes with differential vulnerability to drug-induced iron-dependent oxidative stress. Cancer Cell. 33, 890–904 e895 (2018). [DOI] [PMC free article] [PubMed] [Google Scholar]
- 33.Chen L et al. Tumor immunogenicity determines the effect of B7 costimulation on T cell-mediated tumor immunity. J. Exp. Med. 179, 523–532 (1994). [DOI] [PMC free article] [PubMed] [Google Scholar]
- 34.Patel SJ et al. Identification of essential genes for cancer immunotherapy. Nature 548, 537–542 (2017). [DOI] [PMC free article] [PubMed] [Google Scholar]
- 35.Bloom MB et al. Identification of tyrosinase-related protein 2 as a tumor rejection antigen for the B16 melanoma. J. Exp. Med. 185, 453–459 (1997). [DOI] [PMC free article] [PubMed] [Google Scholar]
- 36.Wolkers MC, Brouwenstijn N, Bakker AH, Toebes M & Schumacher TN Antigen bias in T cell cross-priming. Science 304, 1314–1317 (2004). [DOI] [PubMed] [Google Scholar]
- 37.Godfrey DI, Le Nours J, Andrews DM, Uldrich AP & Rossjohn J Unconventional T cell targets for cancer immunotherapy. Immunity 48, 453–473 (2018). [DOI] [PubMed] [Google Scholar]
- 38.Guo X et al. Global characterization of T cells in non-small cell lung cancer by single-cell sequencing. Nat. Med. 24, 978–985 (2018). [DOI] [PubMed] [Google Scholar]
- 39.Philip M et al. Chromatin states define tumour-specific T cell dysfunction and reprogramming. Nature 545, 452–456 (2017). [DOI] [PMC free article] [PubMed] [Google Scholar]
- 40.De Palma M & Lewis CE Macrophage regulation of tumor responses to anticancer therapies. Cancer Cell 23, 277–286 (2013). [DOI] [PubMed] [Google Scholar]
- 41.Newman AM et al. Robust enumeration of cell subsets from tissue expression profiles. Nat. Methods 12, 453–457 (2015). [DOI] [PMC free article] [PubMed] [Google Scholar]
- 42.Chen Z et al. Inference of immune cell composition on the expression profiles of mouse tissue. Sci. Rep. 7, 40508 (2017). [DOI] [PMC free article] [PubMed] [Google Scholar]
- 43.Bottcher JP et al. NK cells stimulate recruitment of cDC1 into the tumor microenvironment promoting cancer immune control. Cell. 172, 1022–1037 (2018). [DOI] [PMC free article] [PubMed] [Google Scholar]
- 44.Bottcher JP & Reis ESC The role of type 1 conventional dendritic cells in cancer immunity. Trends Cancer 4, 784–792 (2018). [DOI] [PMC free article] [PubMed] [Google Scholar]
- 45.Collin M & Bigley V Human dendritic cell subsets: an update. Immunology 154, 3–20 (2018). [DOI] [PMC free article] [PubMed] [Google Scholar]
- 46.Barry KC et al. A natural killer-dendritic cell axis defines checkpoint therapy-responsive tumor microenvironments. Nat. Med. 24, 1178–1191 (2018). [DOI] [PMC free article] [PubMed] [Google Scholar]
- 47.Binnewies M et al. Unleashing type-2 dendritic cells to drive protective antitumor CD4(+) T cell immunity. Cell 177, 556–571 (2019). [DOI] [PMC free article] [PubMed] [Google Scholar]
- 48.Vandamme N & Berx G From neural crest cells to melanocytes: cellular plasticity during development and beyond. Cell Mol. Life Sci. 76, 1919–1934 (2019). [DOI] [PMC free article] [PubMed] [Google Scholar]
- 49.Marie KL et al. Melanoblast transcriptome analysis reveals pathways promoting melanoma metastasis. Nat. Commun. 11, 333 (2020). [DOI] [PMC free article] [PubMed] [Google Scholar]
- 50.Joshi SS et al. CD34 defines melanocyte stem cell subpopulations with distinct regenerative properties. PLoS Genet. 15, e1008034 (2019). [DOI] [PMC free article] [PubMed] [Google Scholar]
- 51.Chan TA et al. Development of tumor mutation burden as an immunotherapy biomarker: utility for the oncology clinic. Ann. Oncol. 30, 44–56 (2019). [DOI] [PMC free article] [PubMed] [Google Scholar]
- 52.Landsberg J et al. Melanomas resist T cell therapy through inflammation-induced reversible dedifferentiation. Nature 490, 412–416 (2012). [DOI] [PubMed] [Google Scholar]
- 53.Mehta A et al. Immunotherapy resistance by inflammation-induced dedifferentiation. Cancer Discov. 8, 935–943 (2018). [DOI] [PMC free article] [PubMed] [Google Scholar]
References
- 54.Aguirre AJ et al. Activated Kras and Ink4a/Arf deficiency cooperate to produce metastatic pancreatic ductal adenocarcinoma. Genes Dev. 17, 3112–3126 (2003). [DOI] [PMC free article] [PubMed] [Google Scholar]
- 55.Bald T et al. Ultraviolet-radiation-induced inflammation promotes angiotropism and metastasis in melanoma. Nature 507, 109–113 (2014). [DOI] [PubMed] [Google Scholar]
- 56.Bald T et al. Immune cell-poor melanomas benefit from PD-1 blockade after targeted type I IFN activation. Cancer Discov. 4, 674–687 (2014). [DOI] [PubMed] [Google Scholar]
- 57.Vasioukhin V, Degenstein L, Wise B & Fuchs E The magical touch: genome targeting in epidermal stem cells induced by tamoxifen application to mouse skin. Proc. Natl Acad. Sci. USA 96, 8551–8556 (1999). [DOI] [PMC free article] [PubMed] [Google Scholar]
- 58.Virador V et al. Production of melanocyte-specific antibodies to human melanosomal proteins: expression patterns in normal human skin and in cutaneous pigmented lesions. Pigment Cell Res. 14, 289–297 (2001). [DOI] [PubMed] [Google Scholar]
- 59.Iida N et al. Commensal bacteria control cancer response to therapy by modulating the tumor microenvironment. Science 342, 967–970 (2013). [DOI] [PMC free article] [PubMed] [Google Scholar]
- 60.Araya RE & Goldszmid RS Characterization of the tumor immune infiltrate by multiparametric flow cytometry and unbiased high-dimensional data analysis. Methods Enzymol. 632, 309–337 (2020). [DOI] [PMC free article] [PubMed] [Google Scholar]
- 61.Chen H et al. Cytofkit: A bioconductor package for an integrated mass cytometry data analysis pipeline. PLoS Comput. Biol. 12, e1005112 (2016). [DOI] [PMC free article] [PubMed] [Google Scholar]
- 62.Schrock E et al. Multicolor spectral karyotyping of human chromosomes. Science 273, 494–497 (1996). [DOI] [PubMed] [Google Scholar]
- 63.Nesbitt MN & Francke U A system of nomenclature for band patterns of mouse chromosomes. Chromosoma 41, 145–158 (1973). [DOI] [PubMed] [Google Scholar]
- 64.Dobin A et al. STAR: ultrafast universal RNA-seq aligner. Bioinformatics 29, 15–21 (2013). [DOI] [PMC free article] [PubMed] [Google Scholar]
- 65.Li B & Dewey CN RSEM: accurate transcript quantification from RNA-seq data with or without a reference genome. BMC Bioinformatics 12, 323 (2011). [DOI] [PMC free article] [PubMed] [Google Scholar]
- 66.Love MI, Huber W & Anders S Moderated estimation of fold change and dispersion for RNA-seq data with DESeq2. Genome Biol. 15, 550 (2014). [DOI] [PMC free article] [PubMed] [Google Scholar]
- 67.Subramanian A et al. Gene set enrichment analysis: a knowledge-based approach for interpreting genome-wide expression profiles. Proc. Natl Acad. Sci. USA 102, 15545–15550 (2005). [DOI] [PMC free article] [PubMed] [Google Scholar]
- 68.Azizi E et al. Single-cell map of diverse immune phenotypes in the breast tumor microenvironment. Cell 174, 1293–1308 (2018). [DOI] [PMC free article] [PubMed] [Google Scholar]
- 69.Brown CC et al. Transcriptional basis of mouse and human dendritic cell heterogeneity. Cell. 179, 846–863 (2019). [DOI] [PMC free article] [PubMed] [Google Scholar]
Associated Data
This section collects any data citations, data availability statements, or supplementary materials included in this article.
Supplementary Materials
Data Availability Statement
WES raw data of the melanomas and cell lines from the four models and RNA-seq raw data of the cell line-derived allografts from the four models was deposited on Gene Expression Omnibus accession code: GSE144946.