Abstract
The mitochondrial membrane-bound AAA protein Bcs1 translocate substrates across the mitochondrial inner membrane with-out previous unfolding. One substrate of Bcs1 is the iron–sulfur protein (ISP), a subunit of the respiratory Complex III. How Bcs1 translocates ISP across the membrane is unknown. Here we report structures of mouse Bcs1 in two different conformations, representing three nucleotide states. The apo and ADP-bound structures reveal a homo-heptamer and show a large putative substrate-binding cavity accessible to the matrix space. ATP binding drives a contraction of the cavity by concerted motion of the ATPase domains, which could push substrate across the membrane. Our findings shed light on the potential mechanism of translocating folded proteins across a membrane, offer insights into the assembly process of Complex III and allow mapping of human disease-associated mutations onto the Bcs1 structure.
Protein unfolding and translocation across the membranes are biological processes essential for cellular functions. Although different cellular machineries are employed to drive the two processes, both occur through a ubiquitous mechanism of threading, in which protein substrates are translocated as unfolded polypeptide chains, as demonstrated in the functions of Sec translocon and AAA unfoldase Cdc48/p97 (refs. 1–3). However, not all proteins can be transported in an unfolded form. One example is the Rieske iron–sulfur protein (ISP), one of the three catalytic subunits of the mitochondrial Complex III, also known as the cytochrome bc1 complex (cyt bc1).
Complex III is the mid-segment of the respiratory chain4, catalyzing the reaction of electron transfer-coupled proton translocation across the membrane, contributing to the proton motive force (PMF) of mitochondria. The functional importance of the Complex III is underscored by its susceptibility to mutations in its components, which lead to various mitochondrial diseases5, and to targeted inhibition by numerous natural and synthetic inhibitors6. Eukaryotic Complex III is dimeric and oligomeric, consisting of 10 or 11 different subunits per monomer7,8. Except for the cyt b subunit, all other subunits are nuclear-encoded and transported into the mitochondrial matrix before their incorporation into the Complex III9,10. The entire assembly process involves the use of translocases of the outer and inner mitochondrial membranes for protein translocation as unfolded polypeptide chains as well as specific factors required for subsequent protein refolding and incorporation into the Complex III. Bcs1, one such factor, plays a key role in incorporating the ISP subunit into the Complex III11.
A mature ISP subunit consists of two domains: an N-terminal helix anchored to the transmembrane (TM) section of Complex III and a functional C-terminal globular domain, also called the extrinsic domain (ISP–ED) due to its intermembrane space localization, containing a 2Fe–2S cluster. Both domains are connected via a flexible yet highly conserved linker12. In eukaryotes, the integration of ISP into Complex III begins with the importation of newly synthesized ISP precursors into the mitochondrial matrix, which is required due to the matrix localization of the iron–sulfur cluster synthesis machinery13. In mammals, an ISP precursor enters the mitochondrial matrix as an unfolded polypeptide chain, which folds into an apoprotein amenable to 2Fe–2S cluster installation14,15. The ISP–ED of a fully assembled ISP precursor is again translocated across the inner membrane into the intermembrane space, while the N-terminal TM helix becomes associated with the membrane section of Complex III and the signal sequence remains in the matrix. After assembly, the precursor is processed in a single step, resulting in a mature ISP with the signal peptide retained as subunit 9 (ref. 15).
Bcs1 was first identified in yeast as a protein factor localized to the mitochondria and required for incorporation of Rip1 (yeast ISP) into the yeast Complex III16,17. It contains an N-terminal Bcs1-specific domain and at its C terminus an ATPase domain that bears sequence similarity to the AAA family proteins (ATPases associated with various cellular activities). Members of the AAA family are oligomeric ATPases involved in protein quality control and sorting, DNA replication and repair, and membrane fusion18. Bcs1 is anchored to the mitochondrial inner membrane via single N-terminal TM helices of its subunits19. Identification of the human ortholog of yeast bcs1, BCS1L or bcs1-like gene20, led to the linkage of Complex III deficiencies to mutations in BCS1L21,22. Despite genetic and biochemical studies, how Bcs1 facilitates the translocation and incorporation of a folded ISP into the core assembly of Complex III remains unclear. Here we report the structures of mouse Bcs1 (mBcs1) in three nucleotide states. These structures reveal homo-heptameric association of Bcs1 subunits in solution, that undergo concerted conformational re-arrangement in different nucleotide-binding states.
Results
mBcs1 is membrane-bound and exhibits nucleotide-dependent conformational changes.
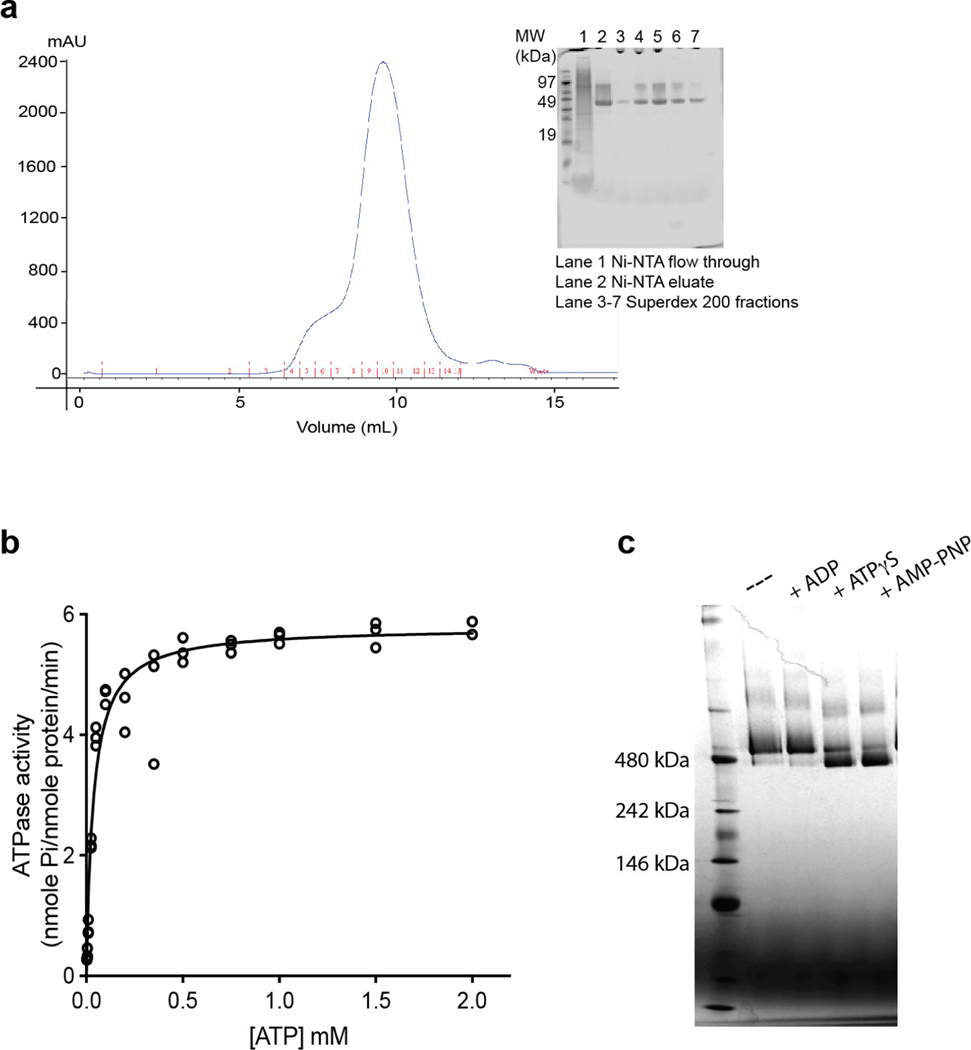
To obtain proteins of Bcs1 for structural studies, we surveyed sequences of Bcs1 from several different organisms and decided to experimentally evaluate the expression of yeast, human and mouse proteins, which share sequence identities from 50 to 94%. Bcs1 molecules from different organisms are thought to have the same domain organization, consisting of a mitochondrial targeting and sorting domain, a Bcs1-specific domain and a AAA domain. Additionally, a TM segment of 21 residues was predicted at the N terminus of the protein20. Mouse Bcs1, compared to those of yeast and human, displayed the best solution behavior that deemed critical for structural studies (Extended Data Fig. 1a), and was chosen for further study.
Isolated mBcs1 is enzymatically active, with the kinetic constant (Km) for ATP of 0.04 mM and Vmax of 5.8 nmole Pi per nmole protein per min (Extended Data Fig. 1b). It also displays a nucleotide-dependent conformational change detectable by blue-native–PAGE (BN–PAGE) (Extended Data Fig. 1c). Removing bound nucleotides by apyrase treatment did not appear to affect the conformation of mBcs1 in solution, as no change was observed in the migration of the protein in BN–PAGE. However, incubation of ATPγS or AMP-PNP (nonhydrolyzable ATP) caused a shift in the protein band, suggesting a conformational change in the protein.
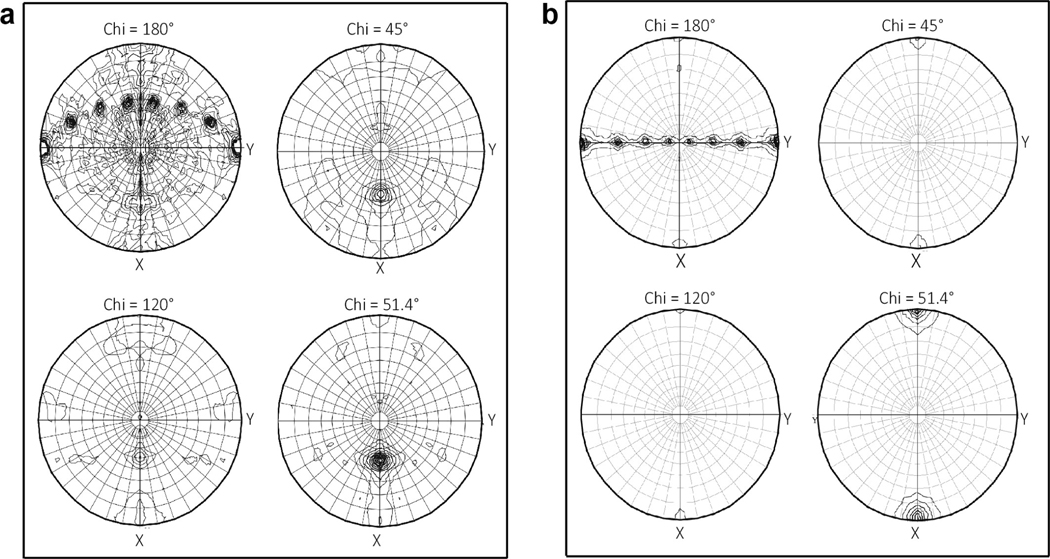
Crystallization of mBcs1 yielded diffracting crystals only in the presence of ATPγS•Mg2+, giving rise to data sets best to 4.4 Å resolution (Table 1). Diffraction data displayed seven-fold symmetry in a self-rotation function search (Extended Data Fig. 2a), which suggests a heptameric association of mBcs1 subunits, different from the classic hexamer structure found in most AAA proteins18. Paradoxically, molecular replacement using known AAA domains as search models did not produce a solution for this data set. We subsequently constructed and purified a truncated version of mBcs1 lacking the N-terminal Bcs1-specific domain (ΔNmBcs1), which was crystallized in the presence of AMP-PNP. Crystals of ΔNmBcs1 diffracted X-rays to 2.2 Å resolution (Table 1) and the data also exhibited a seven-fold symmetry (Extended Data Fig. 2b). Again, molecular replacement searching with known AAA domains failed to produce a structural solution.
Table 1 |.
X-ray diffraction data collection and model refinement statistics
| ΔNmBcs1-AMP-PNP (PDB 6U1Y) | FLmBcs1-ADP (PDB 6UKO) | |
|---|---|---|
|
| ||
| Data collection | ||
| Space group | P21 | C2 |
| Cell dimensions | ||
| a, b, c (Å) | 41.21, 207.5, 116.6 | 254.1, 161.1, 132.6 |
| α, β, γ (°) | 90.0, 95.98, 90.0 | 90.0, 107.3, 90.0 |
| Resolution (Å) | 37.29–2.17 (2.25–2.17)a | 50–4.4 (4.56–4.4) |
| Rmeas | 0.11 (0.95) | 0.09 (1.075) |
| I/σ(I) | 4.45 (1.03) | 8.94 (1.90) |
| CC 1/2 | 0.98 (0.50) | 0.80 (0.31) |
| Completeness (%) | 86.8 (78.3) | 99.2 (99.9) |
| Redundancy | 1.5 (1.4) | 6.0 (5.4) |
| Refinement | ||
| Resolution (Å) | 37.29–2.17 | 24.89–4.40 |
| No. reflections | 88,747 | 32,323 |
| Rwork/Rfree | 18.34/23.70 | 35.1/39.7 |
| No. atoms | ||
| Protein | 13,710 | 21,056 |
| Ligand/ion | 224 (7 AMP-PNP, 7 Mg2+) | 196 (7, ADP) |
| Water | 1,936 | 0 |
| B factors (Å2) | ||
| Protein | 43.79 | 260.61 |
| Ligand/ion | 30.12 | 258.34 |
| Water | 49.5 | - |
| r.m.s. deviations | ||
| Bond lengths (Å) | 0.014 | 0.004 |
| Bond angles (°) | 1.81 | 0.77 |
Values in parentheses are for highest-resolution shell.
Structures of mBcs1 determined by cryogenic electron microscopy (cryo-EM) in the presence and absence of nucleotide.
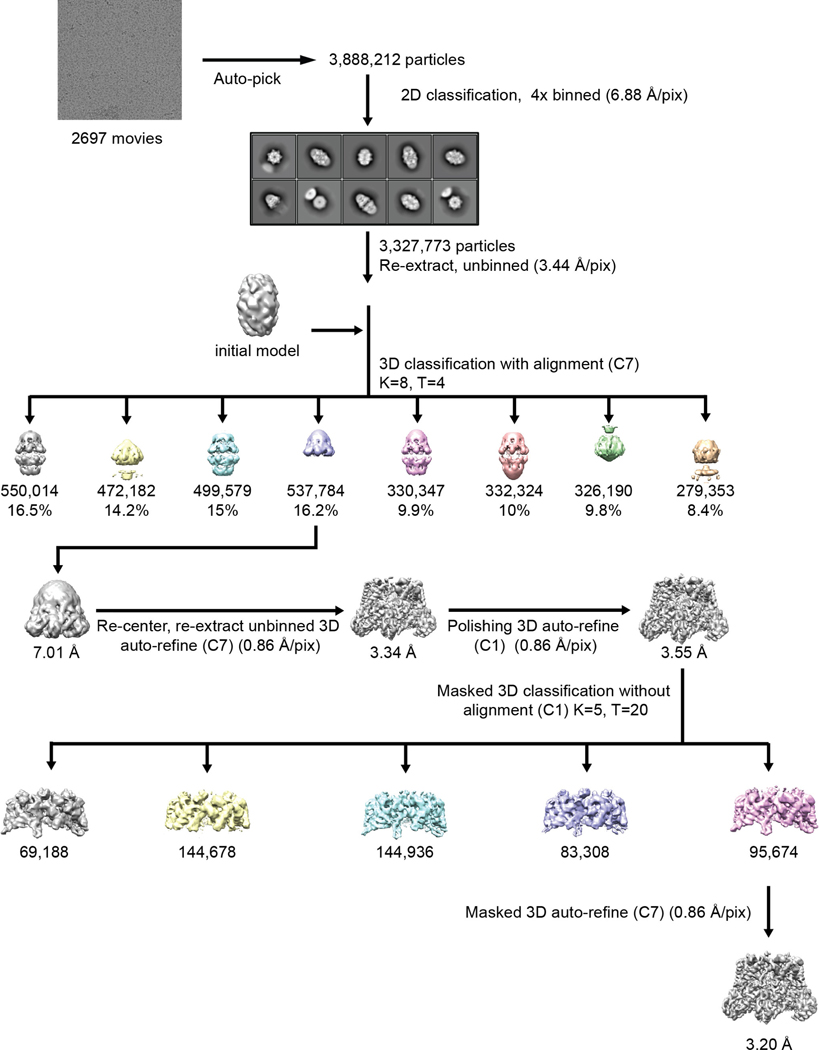
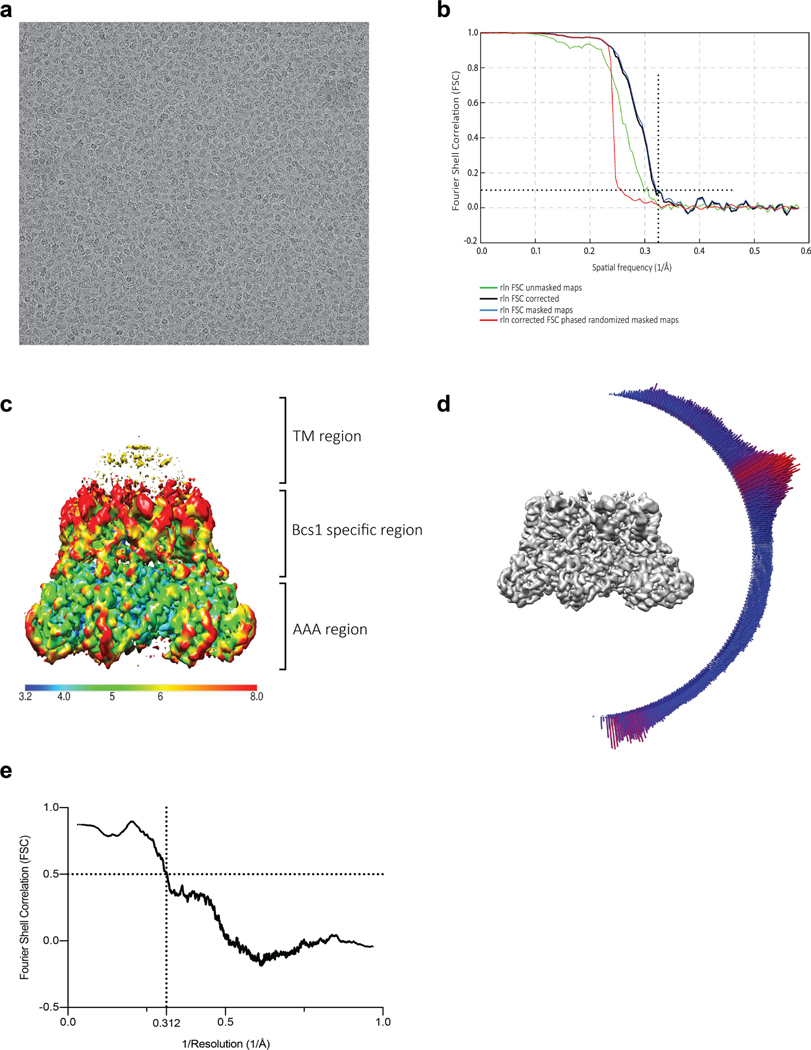
Since the mBcs1 machine has a molecular mass of nearly 324 kDa, we turned to cryo-EM for structural solution, hoping to phase the diffraction data with an EM model. We included ATPγS•Mg2+ in our first sample preparation because BN–PAGE analysis suggested a more compact structure (Extended Data Fig. 1c). Two- and three-dimensional (2D and 3D) classifications allowed selection of one class (537,784 particles) for further analysis (Extended Data Fig. 3 and Table 2). When the structure of mBcs1 was first determined with imposed C7 symmetry, the AAA domain was clearly resolved with local resolution better than 4 Å (Extended Data Fig. 4) and contains a piece of density that matches the shape and size of bound ATPγS in the nucleotide-binding pocket (Extended Data Fig. 5d), while the Bcs1-specific domain displayed substantial mobility with untraceable weaker EM density (~6 Å). Nevertheless, the EM density led to a AAA domain model that was used successfully to phase the diffraction data of the ΔNmBcs1, yielding a heptameric structure with clearly visible bound AMP-PNP (Extended Data Fig. 5e) and suggesting structural similarity between the ATPγS- and AMP-PNP-bound Bcs1 (Table 1). Masking of the Bcs1-specific domain allowed masked 3D classification, which yielded one class (95,674 particles) that was further refined to an overall resolution of 3.2 Å (Extended Data Figs. 3 and 4). The resulting EM density permitted tracing to residue I49.
Table 2 |.
Cryo-EM data collection, model refinement and validation statistics
| Apo mBcs1 (EMD-20808, PDB 6UKP) | ATPγS-bound mBcs1 (EMD-20811, PDB 6UKS) | |
|---|---|---|
|
| ||
| Data collection and processing | ||
| Magnification | ×14,000 | ×14,000 |
| Voltage (kV) | 300 | 300 |
| Electron exposure (e-/Å2) | 40 | 40 |
| Defocus range (μm) | −1.25 to −2.5 | −1.25 to −2.5 |
| Pixel size (Å) | 0.86 | 0.86 |
| Symmetry imposed | C7 | C7 |
| Initial particle images (no.) | 560,780 | 3,888,212 |
| Final particle images (no.) | 67,261 | 95,674 |
| Map resolution (Å) | 3.81 | 3.2 |
| FSC threshold | 0.143 | 0.143 |
| Map resolution range (Å) | 3.5–12 | 3.0–12 |
| Refinement | ||
| Initial model used (PDB code) | Bcs1-specific domain built de novo | AAA domain built de novo |
| Model resolution (Å) | 4.1 | 3.8 |
| FSC threshold | 0.5 | 0.5 |
| Map sharpening B factor (Å2) | −46.1 | −20.18 |
| Model composition | ||
| Nonhydrogen atoms | 41,132 | 40,929 |
| Protein residues | 2,569 | 2,534 |
| Ligands | - | 14 (7 ATPγS, 7 Mg2+) |
| B factors (Å2) | ||
| Protein | 107.76 | 82.94 |
| Ligand | - | 59.10 |
| r.m.s. deviations | ||
| Bond lengths (Å) | 0.006 | 0.007 |
| Bond angles (°) | 1.035 | 0.857 |
| Validation | ||
| MolProbity score | 1.62 | 1.45 |
| Clashscore | 2.72 | 1.88 |
| Poor rotamers (%) | 0 | 0 |
| Ramachandran plot | ||
| Favored (%) | 89.53 | 91.62 |
| Allowed (%) | 10.47 | 8.38 |
| Disallowed (%) | 0 | 0 |
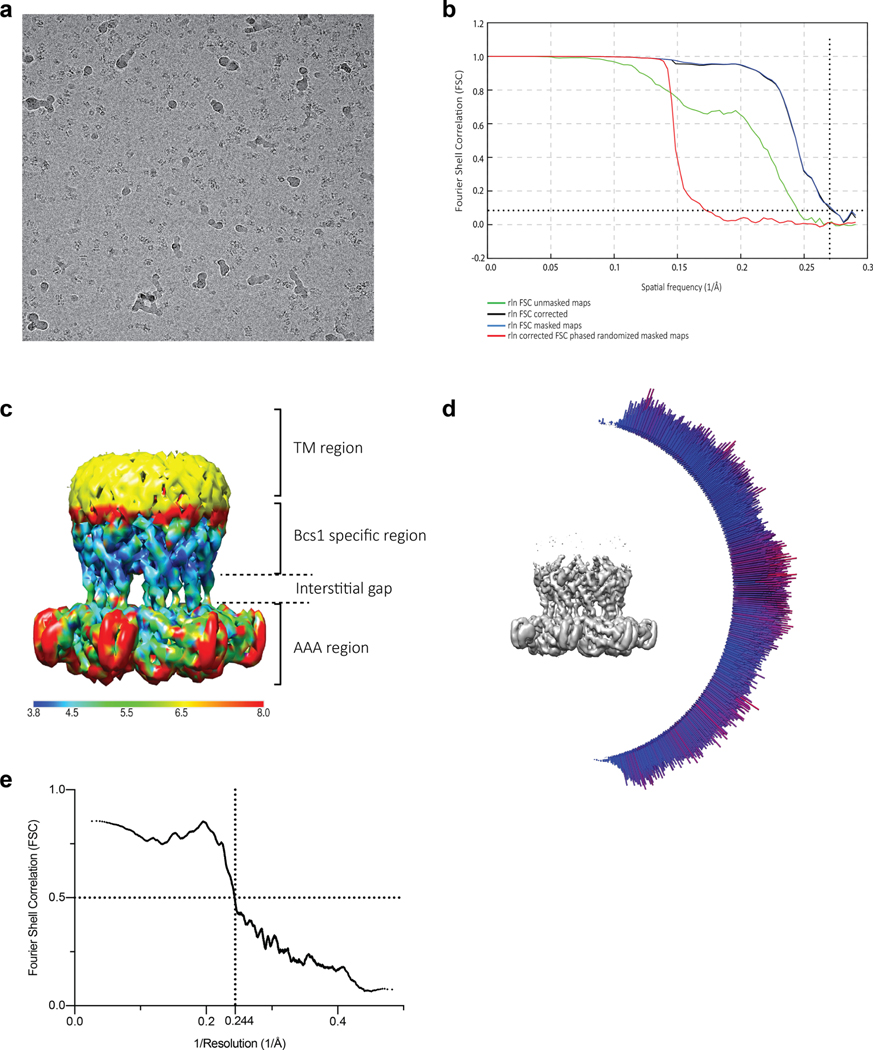
We further collected an EM data set on an mBcs1 sample in the absence of nucleotide (apo mBcs1). The 2D and 3D classifications and subsequent refinement with imposed seven-fold symmetry led to a model density at 4.34 Å resolution (Extended Data Fig. 6). Again, masked 3D classification led to the best model density at 3.81 Å resolution (Extended Data Fig. 7).
Domain structure and organization of mBcs1.
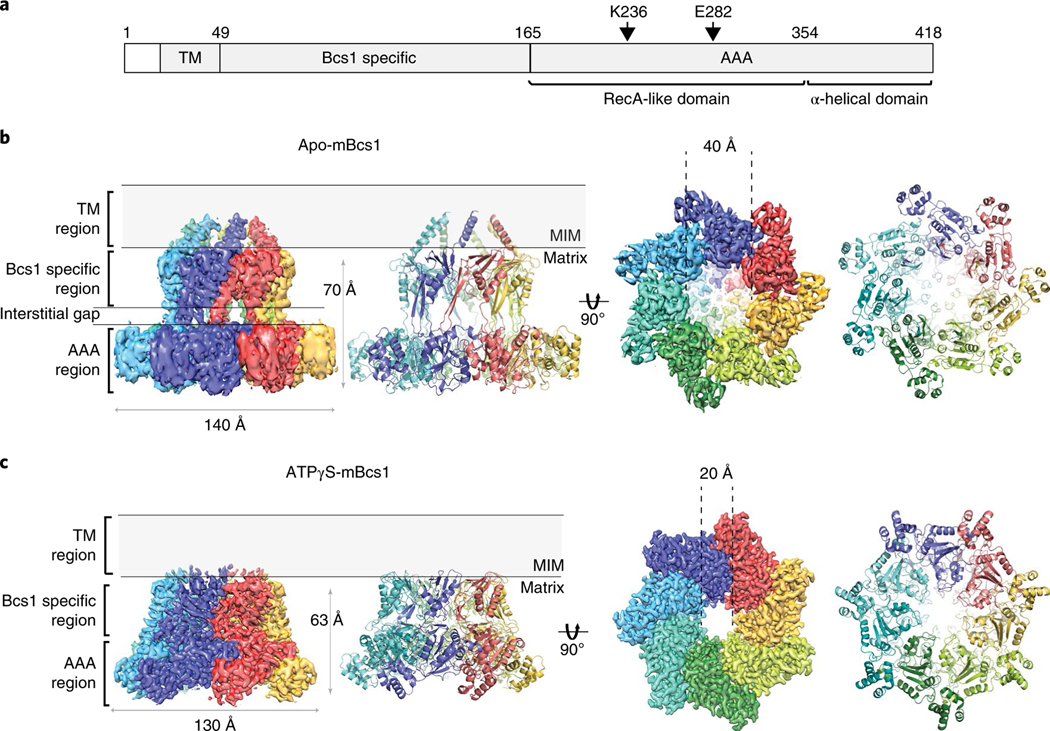
The apo mBcs1 is a heptamer that has an overall shape similar to an upside-down mushroom (Fig. 1a,b). It consists of three regions: the AAA region, the Bcs1-specific region and the TM region; each region is approximately 30–40 Å in height. We noticed that in the apo structure, there is an interstitial gap of approximately 15 Å between the Bcs1-specific region and the AAA region. The EM density is best defined in the Bcs1-specific region, less well defined in the AAA region, and rather disordered in the TM region (Extended Data Fig. 7c). In the final model, 21 (29–49) out of 37 (13–49) residues in the presumed TM helix were built (Fig. 1a).
Fig. 1 |. EM density and heptameric organization of mBcs1.
a, Schematic diagram showing experimentally determined domain boundaries of mBcs1. In the apo structure, the model for the transmembrane (TM) domain begins at residue L29 and ends at I49. The Bcs1-specific domain spans the range of residues 49 to 165. The AAA domain is composed of the RecA-like (residues 165–354) and α-helical domains (residues 355–418). The Walker A residue K236 and Walker B residue E282 are indicated. b,c, EM density maps and atomic models for apo mBcs1 (b) and for the ATPγS-bound mBcs1 (c) in two orthogonal orientations: side view (left) and view from the matrix side (right). Each subunit is colored differently. The TM, Bcs1-specific and AAA regions of the protein are indicated. Most of the protein resides in the mitochondrial matrix. The ‘Interstitial gap’ is defined for the less-dense part of the Bcs1-specific region connecting to the AAA regions.
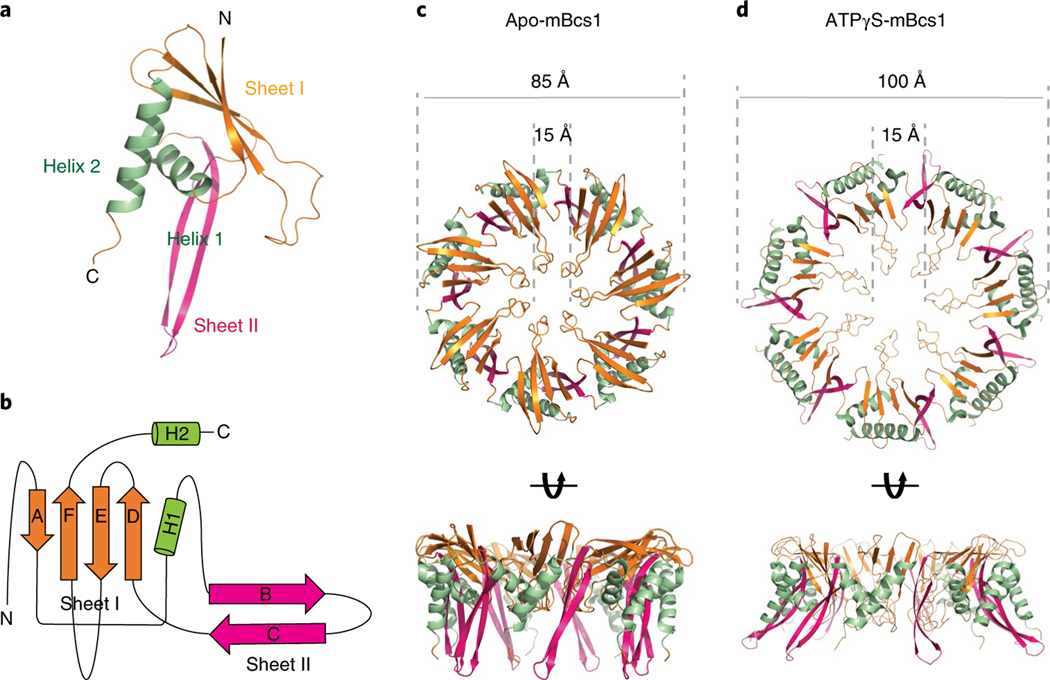
The fold of the Bcs1-specific domain (residues 49–165) is unique, as a search using the DALI server23 revealed no similar protein folds, thus deserving a more detailed description. Each Bcs1-specific domain consists of two β-sheets (Fig. 2a,b). Sheet I is formed by antiparallel strands A, F, E and D. Sheet II is made up of two antiparallel stands (B and C). These two β-sheets are supported by helices H1 (residues 59–72) and H2 (residues 143–163). In the heptamer, looking down the seven-fold axis from the membrane, the Bcs1-specific region is organized in two layers with Sheets I forming the top layer and Sheets II and the two helices forming the bottom layer (Fig. 2c). Furthermore, Sheet I of one subunit joins Sheet II of its neighbor to form a continuous six-stranded β-sheet in such a way that the entire Bcs1-specific region has the appearance of a seven-bladed propeller.
Fig. 2 |. Bcs1-specific domain of mBcs1.
a, Cartoon representation of the Bcs1-specific domain. The β-Sheet I and Sheet II are colored coral and magenta, respectively. The α-helices H1 and H2 are shown in green. b, Topological drawing showing the connectivity of the secondary structures of the Bcs1-specific domain. c, Heptameric association of the Bcs1-specific domains in the apo structure in two orthogonal views. The color code is the same as in a. d, Heptameric association of the Bcs1-specific domains in the ATPγS-bound structure.
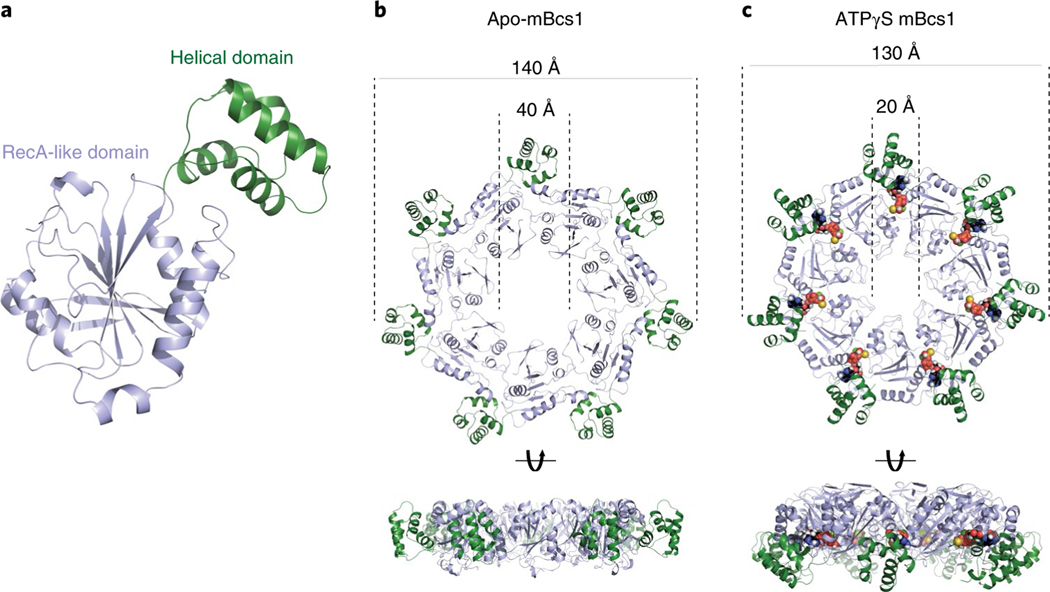
The AAA domain of mBcs1 has 254 residues (residues 165–418). This was determined by both crystallography and EM and is consistent with analysis of yeast mutants and their revertants24. Like typical AAA domains, it consists of two subdomains: a large RecA-like domain (residues 165–354) and a small helical domain (residues 355–418) (Fig. 3a). The nucleotide-binding site is at the interface between the two subdomains. The AAA domain of mBcs1 is unique in that it features a seven-stranded β-sheet in the RecA-like subdomain, which is unusual for a AAA protein. On heptameric association, the AAA region and part (Sheet II and Helix 2) of the Bcs1-specific region of the apo mBcs1 encircle a large barrel-like cavity with a maximal diameter of approximately 40 Å, which is capped by the rest (Sheet I and Helix I) of the Bcs1-specific region. This cavity hereafter is referred to as the putative substrate-binding cavity (Fig. 1b). The AAA domains also form a large entrance accessible to protein substrates in the matrix (Fig. 3b).
Fig. 3 |. AAA domain of mBcs1.
a, Cartoon representation of the AAA domain. The RecA-like domain in light blue features a central seven-stranded β-sheet with a number of α-helices guarding both sides of the β-sheet. The characteristic helical domain is shown in green. b, Heptameric association of the AAA domains in the apo structure from two different views. The color code is the same as in a. c, Heptameric association of the AAA domains in the ATPγS-bound structure; the nucleotides are shown in the Corey–Pauling–Koltun model mode.
Nucleotide-dependent conformations of Bcs1.
The structure of mBcs1 with bound ATPγS was determined to an overall resolution of 3.2 Å (Extended Data Figs. 3 and 4). Unlike the apo mBcs1, the AAA ATPase region was better determined than the Bcs1-specific region and the poor density for the TM region did not permit chain tracing (Extended Data Fig. 4c). Therefore, the first residue built for this structure is I49, which is the beginning of the Bcs1-specific domain. On binding of ATPγS, mBcs1 undergoes a conformational transition compared to the apo structure. Morphologically, it becomes more compact with a reduced diameter, resembling the shape of a bullet head (Fig. 1c) when viewed perpendicular to the seven-fold axis. Most importantly, the binding of ATPγS leads to the disappearance of the interstitial gap between the Bcs1-specific region and the AAA region and collapsing of the putative substrate-binding cavity.
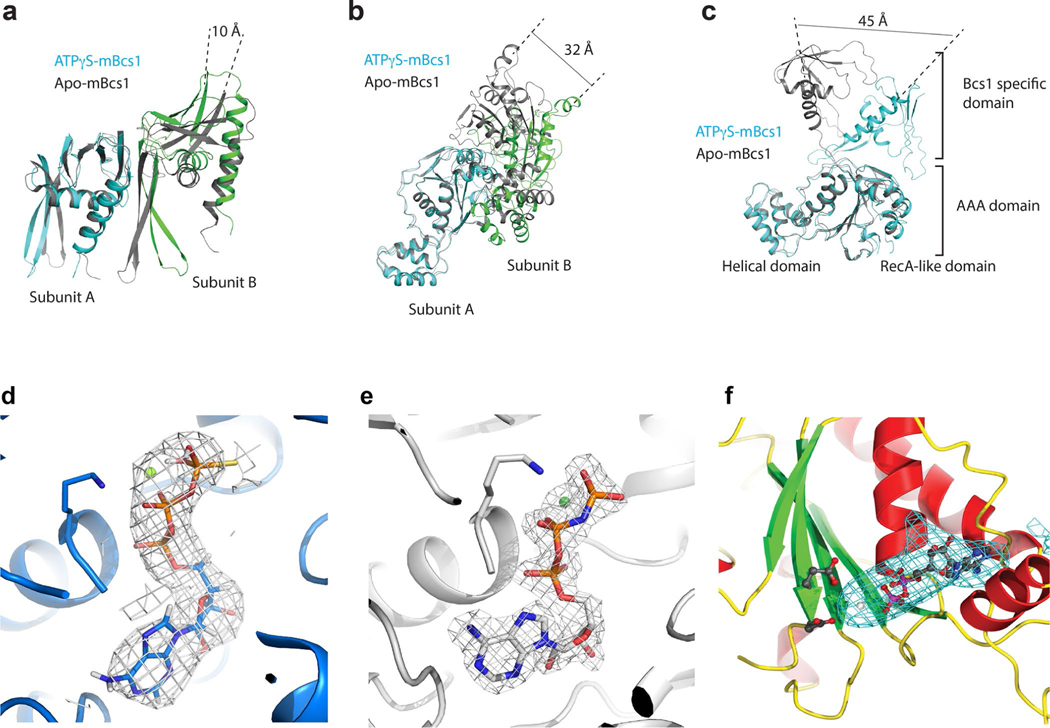
The binding of ATPγS seems to have a minimal impact on the structure of the AAA domain, as the apo and ATPγS-bound AAA domains are superimposable with an r.m.s deviation of 1.1 Å (Extended Data Fig. 8a). Similarly, the Bcs1-specific domain only experiences changes in the β-Sheet II, with an r.m.s. deviation of 1.8 Å (Extended Data Fig. 8b). However, ATPγS binding alters how a subunit interacts with its immediate neighbor, which can be clearly demonstrated by superposing an ATPγS-bound subunit with an apo subunit and observing the relative motion of the associated neighboring subunits (Extended Data Fig. 5a,b). For example, by superposing a single subunit of the Bcs1-specific domain of both forms, we observed a 10 Å movement measured from the tip of a β-strand of its neighboring subunit (Extended Data Fig. 5a). Similarly, as much as 32 Å movement was observed for the AAA domain on nucleotide binding (Extended Data Fig. 5b). Another way to appreciate the conformational change at the subunit level is to superpose the two AAA domains in different nucleotide states and observe the very large movement by the Bcs1-specific domain, where a movement as large as 45 Å was measured from the tip of the helix H2 of the Bcs1-specific domain (Extended Data Fig. 5c).
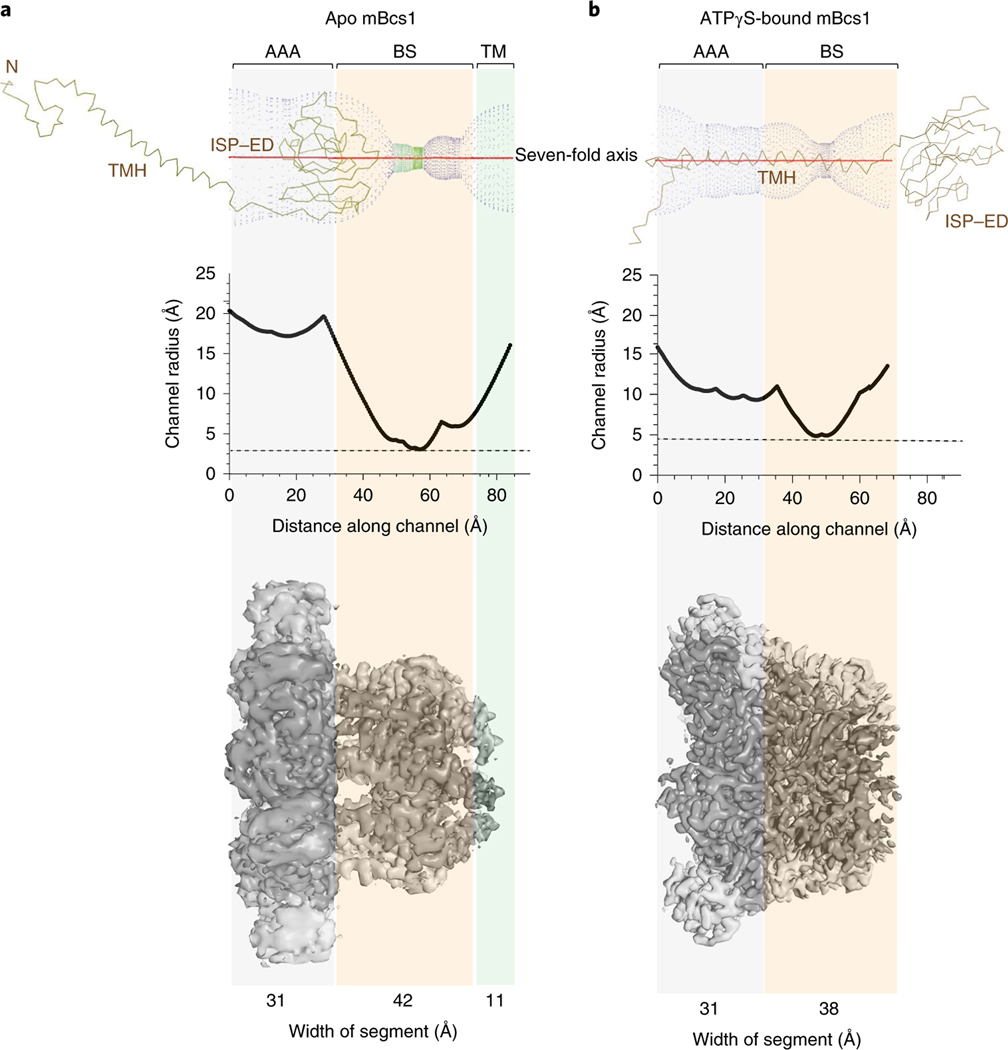
The largest conformational change by far is presented by the heptameric mBcs1. For the apo mBcs1, one prominent feature is the very large cavity formed by the seven AAA domains and the Bcs1-specific region. This cavity is barrel-shaped, approximately 40 Å in diameter at its widest part and running as deep as 40 Å along the seven-fold axis (Fig. 4a). It is accessible from the mitochondrial matrix and has an estimated volume of ~28,000 Å3, sufficient to accommodate a folded, compact, globular protein such as the C-terminal functional domain of ISP (ISP–ED, 126 residues, 21,000 Å3). The binding of ATPγS induces a contraction of this cavity, reducing its volume to approximately 9,000 Å3. The widest part of the barrel is shrunk by half to approximately 20 Å in diameter and its length is reduced to 25 Å. This cavity is no longer able to accommodate the folded ISP–ED (Fig. 4b).
Fig. 4 |. Size measurement of the putative substrate-binding cavity in apo and ATPγS-bound mBcs1 structures.
a,b, The radius of the cavity along the length of the protein was measured with Coot39 for apo mBcs1 (a) and ATPγS-bound mBcs1 (b). Top panels show the graphical plot of the cavity into which the head domain of the ISP subunit (Cα tracing, TMH, transmembrane helix) fits. A plot of the cavity radius as a function of the length along the seven-fold axis is shown in the middle panel. The bottom panel shows the EM density for the apo and ATPγS-bound mBcs1. The vertical transparent panels indicate the width of each structural region.
The conformational change in the TM region is less conspicuous, because this region of the structure under both nucleotide states was not as well determined. Nevertheless, indications about its conformation could be predicated on the basis of the partially determined structures in the TM region in apo mBcs1 and the starting position of the residues in the Bcs1-specific domain in the ATPγS-bound structure. In the apo structure, a segment of the TM helix (residues 29–48) was traced (Fig. 1b), representing approximately half of the TM domain. The direction of these TM helices suggests close association of the remainder of the TM helices in the apo structure. By contrast, in the ATPγS-bound structure, the TM region is entirely disordered. The first residue that can be confidently modeled is I49 of the Bcs1-specific domain, suggesting a lack of interactions among the TM helices (Fig. 1c).
Crystal structure of the full-length, ADP-bound mBcs1.
As mentioned earlier, the diffraction data set for the full-length mBcs1 crystal obtained in the presence of ATPγS•Mg2+ could not be phased with known AAA structures. The molecular replacement trials using the coordinates of either ΔNmBcs1 or ATPγS-bound full-length mBcs1 also failed to work. A structure solution was obtained and refined when the coordinates of the apo mBcs1 were used as a phasing model (Table 1). Unlike apo mBcs1 and despite low resolution, the nucleotide-binding pockets in the AAA domains of this structure clearly contain large pieces of density that can only be modeled as bound ADP (Extended Data Fig. 5f). Except for local changes in the vicinity of bound nucleotide, the overall conformation of the ADP-bound mBcs1 resembles that of apo mBcs1.
Discussion
Bcs1 mechanism of transporting folded protein domains.
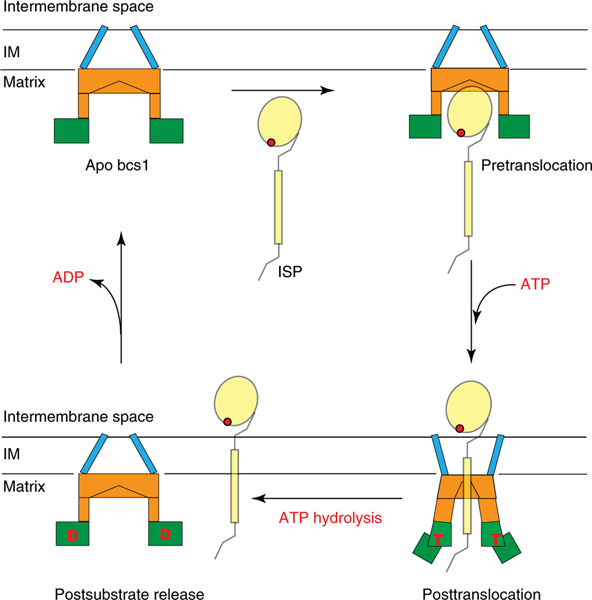
As early as 1999, yeast Bcs1 was suggested to have the ability to translocate the 15 kDa functional domain of the ISP subunit across the inner membrane of mitochondria16. Indeed, ISP mutants that partially unfold fail to get transported by Bcs1 (ref. 25). Translocation of the ISP–ED in its folded form is necessary because insertion of the 2Fe–2S cluster into the apo ISP takes place in the mitochondrial matrix. Moving a fully folded globular protein domain of 126 residues across a membrane barrier is not trivial, considering the size of the protein substrate with an effective diameter of 25 Å and the preservation of a large PMF across the membrane. Until now, passage of substrates of this size through the channel of a AAA protein has not been described11. By solving mBcs1 structures in three different nucleotide states, we have obtained important insights into the mechanics of the transport process (Fig. 5). (1) To transport a substrate of the size of the ISP–ED, Bcs1 takes the form of a heptamer instead of a hexamer, the form more frequently seen in AAA proteins. Conceivably, the heptameric form affords Bcs1 the ability to create a larger entrance and binding cavity to accommodate folded protein substrates. (2) It appears that the substrate is able to access the binding cavity only when all the Bcs1 subunits are in the apo or ADP-bound state, in which the barrel-shaped, putative substrate-binding cavity has an average diameter of 35 Å and a total volume of 28,000 Å3 (Fig. 4a). This observation is consistent with a previous report showing that ISP binding to Bcs1 takes place in the absence of ATP25. In this conformation, the narrowest constriction of the cavity features a cylindrical van der Waals’ surface of less than 5 Å in diameter and is formed by four hydrophobic residues (M121, M123, V124 and L128) contributed by Bcs1-specific domain of each subunit. (3) On binding of ATP, as obtained by our ATPγS-bound structure, all the Bcs1 subunits undergo a concerted conformational change that contracts the binding cavity to a total volume 9,000 Å3 (Fig. 4b), reducing the cavity size by approximately 70%, which can no longer contain the substrate. Accompanying the cavity size reduction is the shrinking of the opening to the cavity from a diameter of 40 to 20 Å (Figs. 3c and 5b), ensuring that no substrate can slip back out of the cavity. Thus, the ATPγS-bound structure represents a postsubstrate translocation conformation. It should also be emphasized that after translocation, the substrate remains bound to the Bcs1 via the TMH and possibly the N-terminal segment25, which is consistent with our transport model (Figs. 4 and 5). (4) The subsequent ATP hydrolysis by the Bcs1 subunits is to allow rapid release of the remainder of the substrate into the membrane section of Complex III and resets the system back to the apo Bcs1 conformation, as represented by the postsubstrate releasing ADP-bound mBcs1 structure.
Fig. 5 |. Model for substrate translocation by Bcs1.
Two conformations of Bcs1, which represent three nucleotide states (apo, ATP (T)- and ADP (D)-bound) are depicted schematically. The TM domain is in blue, Bcs1-specific domain in orange and AAA domain in green. Mitochondrial inner membrane (IM) is represented by two parallel horizontal lines. The substrate ISP is also shown. In the apo state, Bcs1 creates an entrance and cavity to accommodate ISP. On binding of ATP, Bcs1 undergoes a conformational change that contracts the cavity and translocates the head domain of ISP across the mitochondrial inner membrane. Subsequent ATP hydrolysis allows the release of ISP to the precomplex of Complex III and resets the system back to the apo Bcs1 conformation.
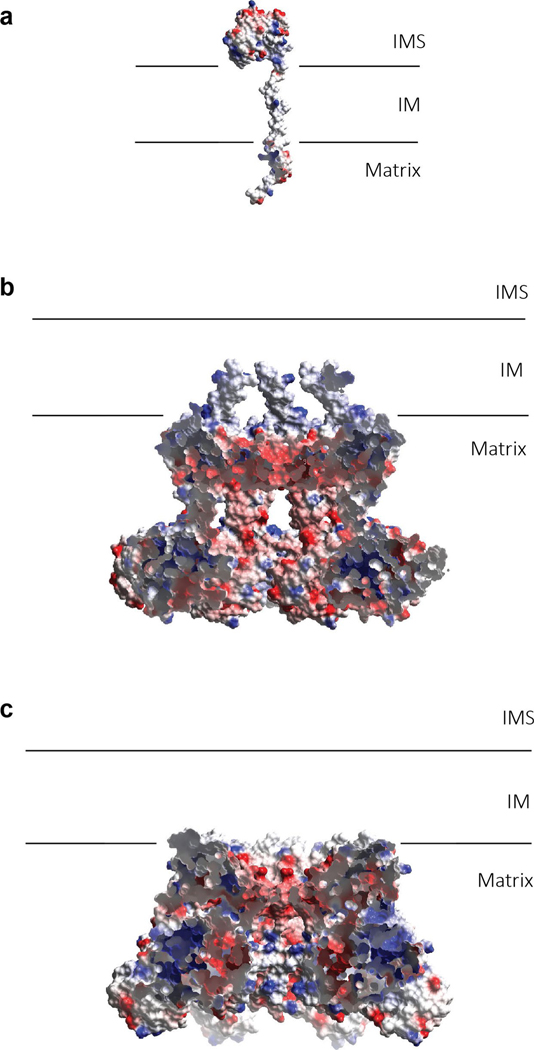
Electrostatic surface potential of the ISP subunit is negative for the ISP–ED, neutral for the TMH and hydrophilic for the N-terminal segment (Extended Data Fig. 9a). Electrostatic surface potentials of Bcs1 are more positive on its exterior surface than on its interior surface, both of which are hydrophilic. The cap of the putative substrate-binding cavity, which is made of the Bcs1-specific domain, is intensely negatively charged (Extended Data Fig. 9b,c). How such a distribution of surface properties could facilitate substrate translocation requires further investigation. Future studies are also necessary to reveal the mechanism by which Bcs1 recognizes the folded ISP domain, to catch the action of Bcs1 transferring the substrate across the membrane, and to visualize how it releases the substrate into the membrane.
Bcs1 represents a class of AAA proteins with a new mechanism of function.
The necessity to transport folded proteins is not unique to the assembly of Complex III in eukaryotes. Bacterial secretion systems are among some of the well-studied examples, in which, for example, folded protein subunits are translocated across the outer membrane via the chaperone-usher pathway26. In bacteria, especially photosynthetic bacteria, and in plant chloroplasts, there exists a Tat (twin arginine translocation) pathway that is responsible for translocation of folded proteins, and its function is coupled to membrane PMF27. In chloroplasts, Tat participates in the incorporation of the ISP subunit into the cyt b6f complex, a homolog of the cyt bc1 complex (Complex III) of mitochondria28. It is speculated that the function of Tat has been replaced by the AAA protein Bcs1 in mitochondria over the course of evolution.
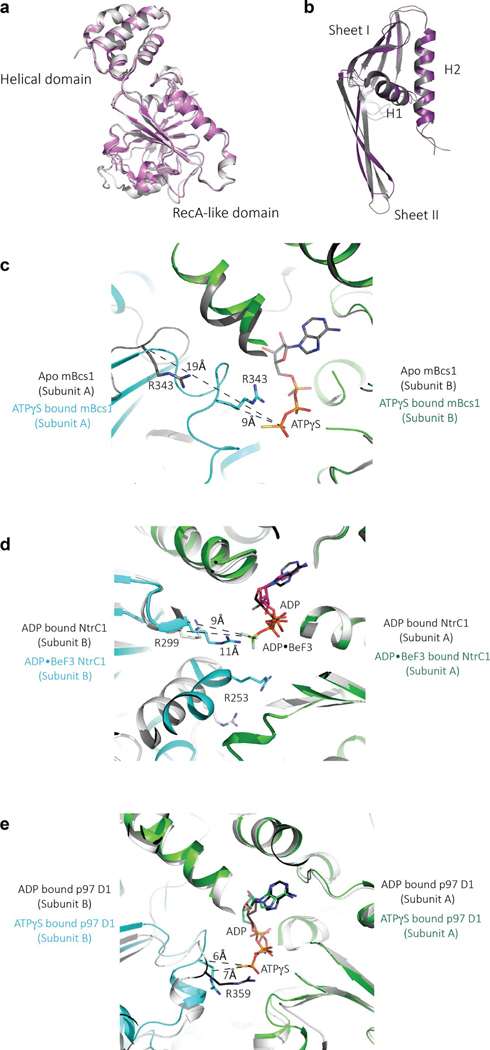
Bcs1 is a type I AAA protein that features a single AAA ATPase domain at C terminus of its subunit. Despite the similarity in its domain organization and structural preservation common to AAA proteins, Bcs1 has a very low overall sequence identity (~30%) compared to other AAA proteins and even to the AAA domains. Indeed, phylogenetic analysis of AAA domains places Bcs1 in a separate group of its own29. The structures of mBcs1 exhibit two unique features that may be important to function of this class of AAA proteins: (1) the RecA-like domain of mBcs1 has a seven-stranded β-sheet (Fig. 3a), whereas a five-stranded β-sheet is observed in most AAA proteins. These extra two β-strands are at the N terminus of the AAA domain. (2) Binding of ATP induces a sliding movement between neighboring AAA subunits such that the Arg-finger residue (R343) is 19 Å away from the nucleotide-binding site in the apo mBcs1 structure but snaps back to interact with the γ-phosphate in the ATPγS-bound structure (Extended Data Fig. 8c). Other AAA domains such as the bacterial σ54 activator NtrC1 and the human protein unfodase p97 D1 domain show relatively small movement between neighboring subunits going from ATP to ADP states (Extended Data Fig. 8d,e).
The unique features revealed by the structures of mBcs1 suggest a possible departure in the protein transport mechanism by Bcs1 from the more ubiquitous threading or hand-over-hand mechanism revealed recently in many well-studied hexameric ring-shaped AAA proteins such as those of protein unfoldases p97 (cdc48 in yeast) and Hsp104 (refs. 1,2,30), the helicase in DNA replication31, the AAA ATPase in the proteasome32,33, Vps4 in membrane fission34 and Rix 7 in ribosome assembly35. In those cases, protein substrates being unfolded or DNA strings are pulled through a narrow channel formed by a set of AAA subunits arranged in a staircase fashion.
Given the structural similarity of Bcs1 to other AAA proteins, the possibility that Bcs1 use the same asymmetric hand-over-hand mechanism cannot be ruled out, especially in the absence of substrate. That said, it is also important to point out unique features in the AAA domain of Bcs1 that may indicate a deviation in its mechanism of substrate translocation (Extended Data Videos 1 and 2). In addition to forming its own clan in the phylogenetic study and featuring a distinct seven-stranded β-sheet, the AAA domain of Bcs1 actually bears more similarity to the D1 domain of p97/Cdc48 than the D2 domain; the latter plays a more important role in the hand-over-hand mechanism of p97/cdc48 (ref. 1). More important, Bcs1 lacks the substrate-contact pore loop, one of the conserved structural motifs of those AAA proteins that follow the ‘hand-over-hand’ mechanism for threading. Furthermore, in Bcs1, the sensor-II region that is in the small helical domain and involved in ATP binding is missing.
Bcs1 mutations that alter Complex III assembly and cause human diseases.
The study of human diseases caused by Complex III deficiencies linked some of the diseases to the function of human Bcs1 ortholog BCS1L (Bcs1-like protein), in which mutants of Bcs1l failed to incorporate the ISP subunit into the core assembly of Complex III21. However, different mutations in BCS1L can have very different prognoses for patients. GRACILE syndrome (growth restriction, aminaciduria, cholestasis, iron overload, lactacidosis and early death) is a severe type of the disease that results in liver and kidney failure in young children. In contrast, Björnstad syndrome stems from BCS1L mutations with a much milder clinical presentation of highly restricted pili torti (twisted hair) and sensorineural hearing loss, with patients often surviving to older ages36. Additionally, mutations that cause the Björnstad syndrome illustrate the exquisite sensitivity to the production of reactive oxygen species37. Clinical manifestations due to mutations in BCS1L can fall anywhere between the two extremes38.
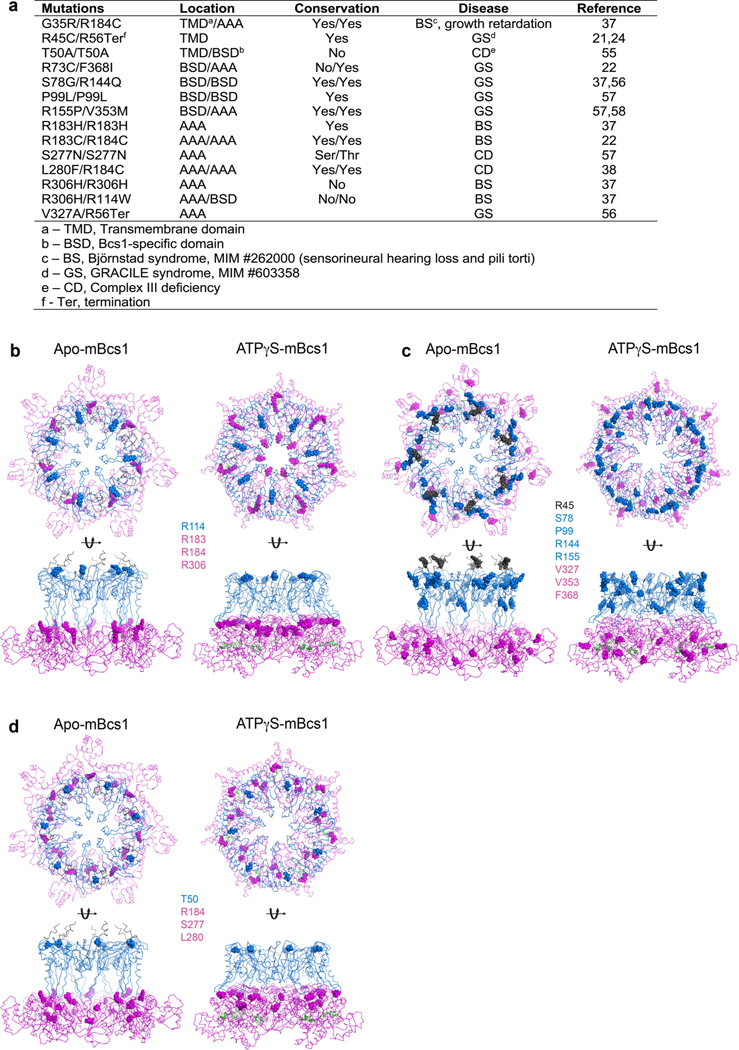
Attempts to understand the phenotype-genotype relationship have been documented in the literature37,38, in which BCS1L mutations were mapped to structural models of Bcs1l. Challenges in these studies were present not only in the use of structure created by homology modeling but also in the fact that mutations in BCS1L are autosomal recessive. With the availability of an experimental structure of mBcs1, which shares 94% sequence identity to human Bcs1l, we sought to map the locations of mutations on the structure of mBcs1 and correlated the positions with reported severity of the defects in patients (Extended Data Fig. 10). Most pathogenic mutations are highly conserved; 14 out of 21 missense mutations involve positively charged arginine residues. Our modeling study correlates the GRACILE syndrome with mutations in the Bcs1-specific domains, whereas mutations in the AAA domain are more likely to cause the milder Björnstad syndrome (Extended Data Fig. 10). From a structural point of view, the severity in clinical manifestation or prognosis of BCS1L mutations seems to depend heavily on the structural integrity of the Bcs1-specific region, which has the shape of a propeller and may work as a shutter to control passage of substrate through the membrane and to prevent dissipation of the membrane PMF during the translocation process. Because nearly all Bcs1-specific domain mutations are located at the interface of subunits, one possible consequence of altered structural integrity in the Bcs1-specific domain is proton leakage, in addition to failed Complex III assembly, thus leading to a severe form of the disease. Mutations in the AAA domain of Bcs1l, on the other hand, only affect the assembly of Complex III. This is also consistent with the observation that these mutations often lead to increased production of reactive oxygen species due to increased protein motive force37.
Online content
Any methods, additional references, Nature Research reporting summaries, source data, extended data, supplementary information, acknowledgements, peer review information; details of author contributions and competing interests; and statements of data and code availability are available at https://doi.org/10.1038/s41594-020-0373-0.
Methods
Cloning of mBcs1 and its variants.
The cDNA clone of mBcs1 (accession number BC019781) was purchased from Life Technologies. The coding region of mBcs1 (residues 1–418) was amplified and inserted into the Pichia yeast expression vector pPICZ A (Life Technologies). Depending on the position of the hexahistindine tag, two different constructs of full-length mBcs1 (pPICZ-His-mBcs1 and pPICZ-mBcs1-His) were generated. Truncated mBcs1, named ΔNmBcs1 (residues 151–418), was generated using QuikChange Mutagenesis kit (Qiagen), creating the construct pPICA-ΔNmBcs1-His.
Expression of mBcs1 and its variants.
Expression of mBcs1 protein was carried out in Pichia according to the protocol described in the EasySelect Pichia Expression Kit (Life Technologies). Briefly, the pPICZ-His-mBcs1 or pPICZ-mBcs1-His plasmid was linearized with the restriction enzyme PmeI before being transformed into Pichia pastoris yeast strain X33 by electroporation (Life Technologies). Transformants were grown in minimal glycerol medium (1.34% yeast nitrogen base (YNB), 1% glycerol, 4 × 10⁻⁵% biotin) at 29 °C until it reached an optical density (OD600) of ~4. Cells were spun down and re-suspended in minimal methanol medium (1.34% YNB, 4 × 10⁻⁵ % biotin, 0.25% methanol) to achieve OD600 = 1. Cells were cultured at 29 °C for 4 d, with 0.25% methanol supplemented for every 24 h. For the expression of ΔNmBcs1, cells transformed with linearized pPICZ-ΔNmBcs1-His were grown at 29 °C in minimal methanol medium for 2 d with 0.25% methanol supplemented for every 24 h.
Purification of mBcs1 and variants.
Cells were collected by centrifugation at 4,000g for 25 min and re-suspended with homogenization buffer (100 mM Tris, pH 8, 100 mM sucrose, 1 mM EDTA, 2 mM phenylmethylsulfonyl fluoride) in a ratio of 3 ml per 1 g of dry cell weight. Cells were disrupted by Microfluidizer (Microfluidics International Corporation) at 2,500 bar for three passages. Cell debris was removed by spinning at 3,500g for 25 min. Crude membranes were collected by ultracentrifugation of the supernatant at 125,000g for 1 h. The membranes in the pellet were washed by re-suspending in the homogenization buffer (2 ml per 1 g of cells) followed by centrifugation at 125,000g for 1 h. The pellet was re-suspended again in the washing buffer (25 mM Tris, pH 8, 200 mM NaCl) followed by centrifugation at 125,000g for 1.5 h. The crude membranes were subsequently re-suspended in a buffer containing 25 mM potassium phosphate, pH 7.4 and 200 mM NaCl. Protein concentration was determined using the bicinchoninic acid assay method40 (Thermo Fisher Scientific). Then, 20% CHAPS solution (Anatrace) was added slowly to a final concentration of 0.5% to solubilize the membrane with a final protein concentration of 5 mg ml−1 at 4 °C for 30 min. Insoluble materials were removed by centrifugation at 125,000g for 30 min.
The solubilized mBcs1 was mixed with Ni-NTA resin (Qiagen) preequilibrated with Buffer A (25 mM Tris, pH 8, 300 mM NaCl, 10% glycerol, 10 mM imidazole, 0.05% N-dodecyl-β-D-maltoside (DDM) (Anatrace)) at 4 °C for 30 min. The admixture was washed with Buffer A supplemented with 100 mM imidazole. mBcs1 was eluted with 250 mM imidazole in Buffer A. Fractions containing mBcs1 were concentrated and loaded onto Superdex 200 (GE Life Sciences) equilibrated with 20 mM Tris, pH 8.0, 200 mM NaCl, 10% glycerol, 0.05% DDM.
For the purification of the soluble ΔNmBcs1 that has the TM and Bcs1-specific domains removed, cells were disrupted by Microfluidizer at 2,500 bar for three passages. Cell debris was removed by spinning at 95,000g for 30 min. The protein was purified using the same procedure as described above without the addition of DDM.
ATPase activity assay.
ATPase activity of mBcs1-His was determined by measuring the amount of inorganic phosphate released from ATP hydrolysis, which reacts with malachite green and molybdate41,42. The activity assay was performed in an assay buffer containing 50 mM Tris-HCl, pH 8.0, 20 mM MgCl2 and 1 mM EDTA. A total of 50 μl reaction mix containing 2–5 μg of protein and 4 mM ATP in the assay buffer was incubated at 37 °C for 15 min. The reaction was immediately stopped by the addition of 800 μl dye buffer (a fresh mixture of 0.045% malachite green and 1.4% ammonium molybdate tetrahydrate in 4 N HCl in 1:3 ratios) followed by addition of 100 μl of 34% sodium citrate solution after 1 min. After 10 min incubation at room temperature, 16 μl of 10% Tween-20 was added to dissolve any precipitate formed. Absorbance was then measured at 660 nm. The amount of inorganic phosphate released was calculated based on the standard curve established by a known amount of KH2PO4 (10–100 μM) dissolved in the assay buffer.
Crystallization and X-ray diffraction data collection.
Crystals of mBcs1 (mBcs1-His) were grown using the sitting-drop vapor diffusion method at 4 °C. A protein solution of 5 mg ml−1 was mixed with ATPγS and MgCl2 to reach final concentrations of 2 and 20 mM, respectively, and incubated on ice for 30 min. The admixture was then spun at 18,000g for 30 min on a benchtop centrifuge at 4 °C. The supernatant was mixed with 0.1 M Tris, pH 9.0, 100 mM NaCl, 60 mM MgCl2, 15% PEG 400 in a 1:1 ratio for crystallization. Crystals were flash cooled directly into liquid propane.
Crystals of ΔNmBcs1 in complex with AMP-PNP were grown using the sitting-drop vapor diffusion method at 16 °C. A protein solution of 7 mg ml−1 was mixed with AMP-PMP and MgCl2 to reach final concentrations of 2 and 20 mM, respectively, and incubated on ice for 30 min. The admixture was then spun at 18,000g for 30 min at 4 °C. The supernatant was mixed with a well solution containing 0.1 M HEPES, pH 7.5, 12% PEG 3350, 3% 1,6-hexanediol in a 1:1 ratio for crystallization. Crystals were cryoprotected with well solution supplemented with 30% PEG 400, 2 mM AMP-PNP and 20 mM MgCl2 and flash cooled in liquid propane. X-ray diffraction experiments were carried out at 100 K at GM/CA and SER-CAT beamlines at the Advanced Photon Source, Argonne National Laboratory.
Structure determination of full-length and ΔNmBcs1 by X-ray crystallography.
Diffraction images were processed and scaled together with the HKL2000 package43. The crystal structure of ΔNmBcs1 was determined by molecular replacement in MOLREP44 using the initial EM model of mBcs1 with ATPγS-bound as search model. The structure was refined using Refamc45 in the CCP4 program package46 and the model was manually built using the program COOT39. For the full-length mBcs1 with bound ADP, the structure was determined by molecular replacement using the initial EM model of apo mBcs1 as search model and refined with Phenix47.
Cryo-EM grid preparation and data collection of mBcs1.
For ATPγS-bound mBcs1, ATPγS and MgCl2 were added to a final concentration of 2 and 20 mM, respectively, to the mBcs1-His protein solution. Aliquots of 3 μl of the admixture (0.23 mg ml−1) were dispensed on Quantifoil R1.2/1.3 carbon grids, 200 mesh copper with 2 nm continuous carbon support (Quantifoil). For apo mBcs1, aliquots of 3 μl of purified His-mBcs1 (3.8 mg ml−1) were dispensed on fabricated Quantifoil R1.2/1.3 holey carbon grids, 200 mesh gold. The fabrication was done according to Meyerson’s protocol48. Grids were blotted and flash frozen in liquid ethane using a Leica EM GP instrument (Leica Microsystem Inc.). Images were collected on a FEI Titan Krios transmission electron microscope operating at 300 kV. Movies were recorded with a Gatan K2 Summit camera (Gatan Inc.) operating in super-resolution mode (0.86 Å pixel−1), at the nominal magnification of ×14,000 corresponding to a physical pixel size of 1.72 Å pixel−1 with a defocus range of −0.8 to −1.4 μm. Exposures were recorded using the Latitude automated data acquisition software (Gatan, Inc.) as 38-frame movie series, with a dose rate of ~7.7 e− pixel−1 s−1 (equivalent to ~2.6 e− Å−2 s−1 at the specimen plane) and a total exposure time of 15.2 s, with intermediate frames being recorded every 0.4 s, giving an accumulated dose of ~40 e− Å−2.
Image processing.
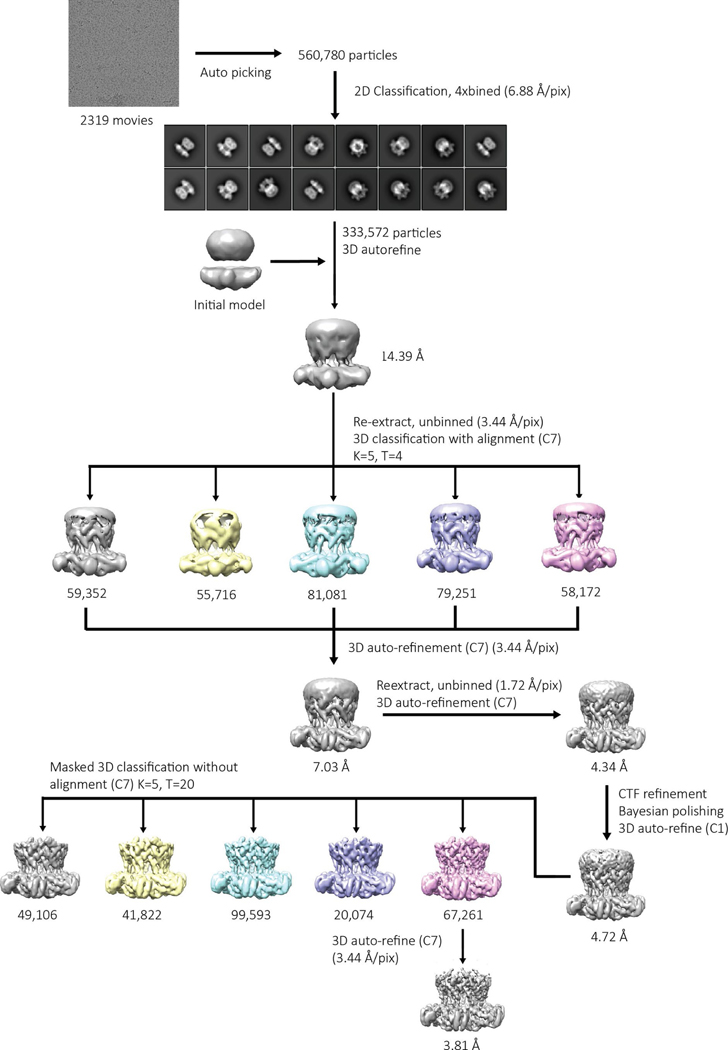
For the apo structure (Extended Data Fig. 6), super-resolution images were Fourier-binned 2 × 2 (1.72 Å pixel−1), motion corrected and dose-weighted using MotionCor2 (ref. 49). Frame alignment was performed on 5 × 5 tiled frames with a B factor of 150 Å2 applied. Unweighted summed images were used for contrast transfer function (CTF) determination using gCTF50. Next, 1,032 particles were manually picked (1.72 Å pixel−1, 184-pixel box size) and subjected to reference-free 2D classification in RELION 3.0 (ref. 51) to generate templates for auto-picking. Then 560,780 particles were auto-picked from the 2,319 micrographs, were binned 4 × 4 (6.88 Å pixel−1 with 46-pixel box size) and subjected to reference-free 2D classification. The best class contained 333,572 particles, which were subjected to 3D auto-refinement. The particles were re-centered and re-extracted (3.44 Å pixel−1, 92-pixel box size), and were subjected to 3D classification (K = 5, T = 4). The particles from the classes with the best defined secondary structural characteristics were pooled together and subjected to 3D auto-refinement, which were then re-centered and re-extracted (277,856 particles, 1.72 Å pixel−1, 184-pixel box size), subjected to 3D auto-refinement, CTF refinement and Bayesian polishing. The polished particles were then subjected to another round of 3D auto-refinement. The particles were subjected to masked 3D classification (K = 5, T = 20) with a soft mask around the Bcs1-specific and AAA regions. The particles from each 3D class with the best defined secondary structural characteristics were subjected to 3D auto-refinement, yielding a reconstruction of 3.81 Å resolution, as determined by gold-standard 0.143 Fourier shell correlation (Extended Data Fig. 7). Local resolution was calculated using Monores52, and map sharpening was performed with LocalDeblur53.
For the ATPγS-bound structure, super-resolution images were Fourier-binned 2 × 2 (1.72 Å pixel−1), motion corrected, and dose-weighted using MotionCor2. Frame alignment was performed on 5 × 5 tiled frames with a B factor of 150 Å2 applied. Unweighted summed images were used for CTF determination using gCTF. 21,667 particles were picked (6.88 Å pixel−1, 54-pixel box size) from 20 micrographs using the Laplaican-of-Gaussian function in RELION 3.0, which were subjected to reference-free 2D classification to generate an initial template. Multiple rounds of template-based auto-picking and 2D classification were performed to generate a final template. Next, 3,888,212 particles were picked from 2,697 micrographs (6.88 Å pixel−1, 54-pixel box size) with the final template and subjected to 2D classification. The best classes contained 3,327,773 particles, which were re-extracted (3.44 Å pixel−1, 108-pixel box size) and subjected to 3D classification (K = 8, T = 4) with alignment. The 3D model and particles from the best class that did not associate to form higher-ordered dimer of heptamers were chosen. The 3D model was re-centered on its center of mass in UCSF Chimera54, and the particles were subjected to 3D auto-refinement. The particles were re-centered and re-extracted (537,784 particles, 0.86 Å pixel−1, 264-pixel box size) from super-resolution images that had been motion corrected and dose-weighted using MotionCor2, with frame alignment performed on 5 × 5 tiled frames with a B factor of 150 applied. Unweighted summed images were used for CTF determination using gCTF. The resulting stack was subjected to 3D auto-refinement, followed by CTF refinement and Bayesian polishing. The polished particles were subjected to another round of 3D auto-refinement, followed by 3D classification (K = 5, T = 20) without image alignment using a soft mask about the Bcs1-specific domain. Next, 95,674 particles with the best resolved density were subjected to 3D auto-refinement with a soft mask around the Bcs1-specific and AAA domains, yielding a reconstruction of 3.20 Å determined by gold-standard 0.143 Fourier shell correlation. Local resolution was calculated using MonoRes, and map sharpening was performed with LocalDeblur.
Reporting Summary.
Further information on research design is available in the Nature Research Reporting Summary linked to this article.
Data availability
Atomic coordinates and structure factors have been deposited in the Protein Data Bank (PDB) with accession codes PDB 6U1Y (ΔNmBcs1-AMP-PNP) and PDB 6UKO (FLmBcs1-ADP). Cryo-EM structures and atomic models have been deposited in the Electron Microscopy Data Bank and PDB with accession codes EMDB 20808, PDB 6UKP (Apo mBcs1) and EMDB 20811, PDB 6UKS (ATPγS-bound mBcs1). Source data for Extended Data Fig. 1 are provided with the paper.
Extended Data
Extended Data Fig. 1 |. Biochemical characterizations of recombinant mBcs1.
a, Size exclusion chromatographic profile of mBcs1 on Superdex 200. Inset: SDS-PAGE showing the purity of mBcs1 along the purification steps. b, One representative Michaelis Menten plot out of three experiments of mBcs1 ATPase activity to ATP concentration (n=3 technical replicates). c, Nucleotide-dependent conformational change of mBcs1 in the presence of different nucleotides as observed by Blue-Native PAGE.
Extended Data Fig. 2 |. Rotation function plots showing the presence of a proper 7-fold axis.
a, Full-length mBcs1 and b, ΔNmBcs1 crystals.
Extended Data Fig. 3 |. Data processing workflow for mBcs1 in ATPγS-bound form.
Particles of mBcs1 in the presence of ATPγS appear to form a mix of single and dual heptamer. Initial processing showed the two heptamers in the dual heptamer do not interact uniformly, hence reducing the resolutions. Therefore, only the class that contains single heptamers was selected for subsequent refinement. To improve resolution, the AAA-domain was masked for final refinement.
Extended Data Fig. 4 |. Single-particle cryo-EM analysis of mBcs1 in ATPγS-bound form.
a, Representative motion-corrected micrograph of an ATPγSbound mBcs1 sample. b, Gold-standard Fourier shell correlation (FSC) curves of the final density map of the ATPγS-bound mBcs1. The reported resolution for this structure was based on the FSC=0.143 criterion. c, Local resolution map of ATPγS-bound mBcs1 structure at 4σ contour level. The color code is given by the bottom color strip. d, Angular distribution of particles used in the final 3D reconstruction of ATPγS-bound mBcs1. The height of the cylinder is proportional to the number of particles for that view. e, Map-to-model FSC.
Extended Data Fig. 5 |. Structural comparison of mBcs1 domains in different nucleotide states and example densities of bound ligands.
The ATPγSbound mBcs1 structure is shown in colored ribbons (subunit A in cyan; subunit B in green) and subunits of the apo mBcs1 structure are shown in gray ribbons. a, Superposition of the Bcs1-specific domain of subunit A in the apo state (cyan) with the ATPγS-bound structure of the same domain (gray). The distance change in residue I49 of subunits B is indicated. b, Superposition of the structure of the AAA domain of subunit A in the apo state (cyan) with of the same structure in the ATPγS-bound state (gray) The distance change in residue R218 of subunits B is indicated. c, Conformational difference in a single mBcs1 subunit in the two nucleotide states. The distance change in residue K145 from the tip of the helix H2 is indicated. d, EM density map of ATPγS binding site (5.0σ level, gray mesh). mBcs1 is represented in blue cartoon. Walker-A K236 and ATPγS are shown as stick models with carbon, oxygen, nitrogen, phosphorous and sulphur atoms in blue, red, dark blue, orange and yellow, respectively. e, Difference Fourier map showing the bound AMP-PNP in the nucleotide-binding site (3.0σ level, gray mesh) in crystal structure of ΔNmBcs1. The structure of ΔNmBcs1 is represented by gray cartoon. Green sphere is Mg2+. Walker-A K236 and ATPγS are shown as stick models with carbon, oxygen, nitrogen and phosphorous atoms in gray, red, dark blue and orange, respectively. f, Difference Fourier map showing the bound ADP in the nucleotide-binding site (3.0σ level, cyan mesh) in crystal structure of full-length mBcs1. Residues E282, D283 and ADP are shown as stick models with carbon, oxygen, nitrogen and phosphorous atoms in gray, red, dark blue and magenta, respectively.
Extended Data Fig. 6 |. Data processing workflow for mBcs1 in apo form.
Additional details are provided in the Methods section.
Extended Data Fig. 7 |. Single-particle cryo-EM analysis of mBcs1 in apo form.
a, Representative motion-corrected micrograph of apo-mBcs1 sample. b, Gold-standard Fourier shell correlation (FSC) curves of the final density map for the apo mBcs1 structure. The reported resolution for this structure was based on the FSC=0.143 criterion. c, Local resolution map for the apo mBcs1 structure at 2.5σ level. The color code is given by the bottom color strip. d, Angular distribution of particles used in the final 3D reconstruction of apo mBcs1. The height of the cylinder is proportional to the number of particles for that view. e, Map-to-model FSC.
Extended Data Fig. 8 |. Superposition of structural domains of mBcs1.
a, Superposition of the AAA domain from apo (gray) and ATPγS-bound (magenta) structures. b, Superposition of the Bcs1-specific domain from apo (gray) and ATPγS-bound (magenta) structures. c, Interface between two neighboring AAA domains of mBcs1 undergoes a sliding movement upon ATP binding. The structure in the vicinity of ATP binding site for the apo structure (both subunit A and B) is shown as cartoon in gray. The Arg-finger residue R343 of subunit A of the apo mBcs1 is shown as a stick model. The subunit A of the ATPγS-bound mBcs1 is shown in cyan and its neighboring subunit B is shown in green. The residue R343 of subunit A of the ATPγS-bound structure is shown as a stick model. The two structures are superimposed based on subunit B. The distances from CA atoms of R343 of apo or ATPγS-bound Bcs1 to the γ-phosphate of ATP are given. d, Interface between two neighboring AAA domains of bacterial NtrC1 in ADP- or ADP•BeF3-bound forms. Distances from CA atoms of Arg-finger residue R299 to bound ADP•BeF3 are given. e, Interface between two neighboring AAA domains of mammalian AAA protein p97 D1 domain in ADP- or ATPγS-bound forms. Distances from CA atoms of Arg-finger residue R299 to γ-phosphate of ATPγS are given.
Extended Data Fig. 9 |. Electrostatic surface potential of substrate and the putative substrate-binding cavity of mBcs1 in different states.
a, Electrostatic potential surface for the ISP subunit. b, Electrostatic potential surface of the apo mBcs1. The front portion of the surface was cut away to reveal the interior surface potential of the putative substrate-binding cavity. c, Electrostatic potential surface of the mBcs1 bound with ATPγS. The front portion of the surface was cut away to reveal the interior surface potential of the putative substrate-binding cavity.
Extended Data Fig. 10 |. Pathogenic mutations of BCS1L.
a, Pathogenic mutations of BCS1L and their locations in the Bcs1 structure. b–d, Mapping of the mutations on ATPγS-bound and apo mBcs1 in two orthogonal orientations: top view (top) and side view (bottom). TM, Bcs1-specific and AAA regions are in black, blue and magenta ribbons, respectively. Mutations are showed in spheres. Mutations found in (b), Björnstad syndrome; (c) GRACILE syndrome and (d) Complex III deficiency.
Supplementary Material
Acknowledgements
This research was supported by the intramural Research Program of the Center for Cancer Research, National Cancer Institute, National Institutes of Health. M.J.B. is supported by US National Institute of Environmental Health Sciences (grant no. ZIC ES103326 to M.J.B). We thank the staff members of the SER-CAT and GM/CA beamlines at the Advanced Photon Source, Argonne National Laboratory for beamline support. All DNA sequencing services was conducted at the Center for Cancer Research Genomics Core, National Cancer Institute and computation for the EM image reconstruction was carried out using the Biowulf Linux cluster (biowulf.nih.gov) at the National Institutes of Health, Bethesda. We thank G. Leiman for editorial assistance.
Footnotes
competing interests
The authors declare no competing interests.
Additional information
Extended data is available for this paper at https://doi.org/10.1038/s41594-020-0373-0.
Supplementary information is available for this paper at https://doi.org/10.1038/s41594-020-0373-0.
Peer review information Anke Sparmann was the primary editor on this article and managed its editorial process and peer review in collaboration with the rest of the editorial team.
Reprints and permissions information is available at www.nature.com/reprints.
References
- 1.Twomey EC et al. Substrate processing by the Cdc48 ATPase complex is initiated by ubiquitin unfolding. Science 365, eaax1033 (2019). [DOI] [PMC free article] [PubMed] [Google Scholar]
- 2.Cooney I. et al. Structure of the Cdc48 segregase in the act of unfolding an authentic substrate. Science 365, 502–505 (2019). [DOI] [PMC free article] [PubMed] [Google Scholar]
- 3.Park E. & Rapoport TA Mechanisms of Sec61/SecY-mediated protein translocation across membranes. Annu. Rev. Biophys 41, 21–40 (2012). [DOI] [PubMed] [Google Scholar]
- 4.Letts JA & Sazanov LA Clarifying the supercomplex: the higher-order organization of the mitochondrial electron transport chain. Nat. Struct. Mol. Biol 24, 800–808 (2017). [DOI] [PubMed] [Google Scholar]
- 5.DiMauro S. & Schon EA Mitochondrial respiratory-chain diseases. N. Engl. J. Med 348, 2656–2668 (2003). [DOI] [PubMed] [Google Scholar]
- 6.Esser L, Yu CA & Xia D. Structural basis of resistance to anti-cytochrome bc(1) complex inhibitors: implication for drug improvement. Curr. Pharm. Des 20, 704–724 (2014). [DOI] [PMC free article] [PubMed] [Google Scholar]
- 7.Xia D. et al. Crystal structure of the cytochrome bc1 complex from bovine heart mitochondria. Science 277, 60–66 (1997). [DOI] [PMC free article] [PubMed] [Google Scholar]
- 8.Hunte C, Koepke J, Lange C, Rossmanith T. & Michel H. Structure at 2.3 A resolution of the cytochrome bc(1) complex from the yeast Saccharomyces cerevisiae co-crystallized with an antibody Fv fragment. Structure 8, 669–684 (2000). [DOI] [PubMed] [Google Scholar]
- 9.Pfanner N, Warscheid B. & Wiedemann N. Mitochondrial proteins: from biogenesis to functional networks. Nat. Rev. Mol. Cell Biol 20, 267–284 (2019). [DOI] [PMC free article] [PubMed] [Google Scholar]
- 10.Cui TZ, Smith PM, Fox JL, Khalimonchuk O. & Winge DR Late-stage maturation of the Rieske Fe/S protein: Mzm1 stabilizes Rip1 but does not facilitate its translocation by the AAA ATPase Bcs1. Mol. Cell. Biol 32, 4400–4409 (2012). [DOI] [PMC free article] [PubMed] [Google Scholar]
- 11.Wagener N. & Neupert W. Bcs1, a AAA protein of the mitochondria with a role in the biogenesis of the respiratory chain. J. Struct. Biol 179, 121–125 (2012). [DOI] [PubMed] [Google Scholar]
- 12.Esser L. et al. Surface-modulated motion switch: capture and release of iron-sulfur protein in the cytochrome bc1 complex. Proc. Natl Acad. Sci. USA 103, 13045–13050 (2006). [DOI] [PMC free article] [PubMed] [Google Scholar]
- 13.Lill R. Function and biogenesis of iron-sulphur proteins. Nature 460, 831–838 (2009). [DOI] [PubMed] [Google Scholar]
- 14.Graham LA, Brandt U, Sargent JS & Trumpower BL Mutational analysis of assembly and function of the iron-sulfur protein of the cytochrome bc1 complex in Saccharomyces cerevisiae. J. Bioenerg. Biomembr 25, 245–257 (1993). [DOI] [PubMed] [Google Scholar]
- 15.Brandt U, Yu L, Yu CA & Trumpower BL The mitochondrial targeting presequence of the Rieske iron-sulfur protein is processed in a single step after insertion into the cytochrome bc1 complex in mammals and retained as a subunit in the complex. J. Biol. Chem 268, 8387–8390 (1993). [PubMed] [Google Scholar]
- 16.Cruciat CM, Hell K, Folsch H, Neupert W. & Stuart RA Bcs1p, an AAA-family member, is a chaperone for the assembly of the cytochrome bc(1) complex. EMBO J. 18, 5226–5233 (1999). [DOI] [PMC free article] [PubMed] [Google Scholar]
- 17.Nobrega FG, Nobrega MP & Tzagoloff A. BCS1, a novel gene required for the expression of functional Rieske iron-sulfur protein in Saccharomyces cerevisiae. EMBO J. 11, 3821–3829 (1992). [DOI] [PMC free article] [PubMed] [Google Scholar]
- 18.Ogura T. & Wilkinson AJ AAA+ superfamily ATPases: common structure—diverse function. Genes Cells 6, 575–597 (2001). [DOI] [PubMed] [Google Scholar]
- 19.Folsch H, Guiard B, Neupert W. & Stuart RA Internal targeting signal of the BCS1 protein: a novel mechanism of import into mitochondria. EMBO J. 15, 479–487 (1996). [PMC free article] [PubMed] [Google Scholar]
- 20.Petruzzella V. et al. Identification and characterization of human cDNAs specific to BCS1, PET112, SCO1, COX15, and COX11, five genes involved in the formation and function of the mitochondrial respiratory chain. Genomics 54, 494–504 (1998). [DOI] [PubMed] [Google Scholar]
- 21.De Meirleir L. et al. Clinical and diagnostic characteristics of complex III deficiency due to mutations in the BCS1L gene. Am J. Med. Genet. A 121A, 126–131 (2003). [DOI] [PubMed] [Google Scholar]
- 22.Fernandez-Vizarra E. et al. Impaired complex III assembly associated with BCS1L gene mutations in isolated mitochondrial encephalopathy. Hum. Mol. Genet 16, 1241–1252 (2007). [DOI] [PubMed] [Google Scholar]
- 23.Holm L. & Sander C. Protein structure comparison by alignment of distance matrices. J. Mol. Biol 233, 123–138 (1993). [DOI] [PubMed] [Google Scholar]
- 24.Nouet C, Truan G, Mathieu L. & Dujardin G. Functional analysis of yeast bcs1 mutants highlights the role of Bcs1p-specific amino acids in the AAA domain. J. Mol. Biol 388, 252–261 (2009). [DOI] [PubMed] [Google Scholar]
- 25.Wagener N, Ackermann M, Funes S. & Neupert W. A pathway of protein translocation in mitochondria mediated by the AAA-ATPase Bcs1. Mol. Cell 44, 191–202 (2011). [DOI] [PubMed] [Google Scholar]
- 26.Busch A. & Waksman G. Chaperone-usher pathways: diversity and pilus assembly mechanism. Philos. Trans. R. Soc. Lond. B 367, 1112–1122 (2012). [DOI] [PMC free article] [PubMed] [Google Scholar]
- 27.Palmer T. & Berks BC The twin-arginine translocation (Tat) protein export pathway. Nat. Rev. Microbiol 10, 483–496 (2012). [DOI] [PubMed] [Google Scholar]
- 28.Kurisu G, Zhang H, Smith JL & Cramer WA Structure of the cytochrome b6f complex of oxygenic photosynthesis: tuning the cavity. Science 302, 1009–1014 (2003). [DOI] [PubMed] [Google Scholar]
- 29.Frickey T. & Lupas AN Phylogenetic analysis of AAA proteins. J. Struct. Biol 146, 2–10 (2004). [DOI] [PubMed] [Google Scholar]
- 30.Gates SN et al. Ratchet-like polypeptide translocation mechanism of the AAA+ disaggregase Hsp104. Science 357, 273–279 (2017). [DOI] [PMC free article] [PubMed] [Google Scholar]
- 31.Gao Y. et al. Structures and operating principles of the replisome. Science 363, eaav7003 (2019). [DOI] [PMC free article] [PubMed] [Google Scholar]
- 32.Dong Y. et al. Cryo-EM structures and dynamics of substrate-engaged human 26S proteasome. Nature 565, 49–55 (2019). [DOI] [PMC free article] [PubMed] [Google Scholar]
- 33.de la Pena AH, Goodall EA, Gates SN, Lander GC & Martin A. Substrate-engaged 26S proteasome structures reveal mechanisms for ATP-hydrolysis-driven translocation. Science 362, eaav0725 (2018). [DOI] [PMC free article] [PubMed] [Google Scholar]
- 34.Han H, Monroe N, Sundquist WI, Shen PS & Hill CP The AAA ATPase Vps4 binds ESCRT-III substrates through a repeating array of dipeptide-binding pockets. eLife 6, e31324 (2017). [DOI] [PMC free article] [PubMed] [Google Scholar]
- 35.Lo YH et al. Cryo-EM structure of the essential ribosome assembly AAA-ATPase Rix7. Nat. Commun 10, 513 (2019). [DOI] [PMC free article] [PubMed] [Google Scholar]
- 36.Ramos-Arroyo MA et al. Clinical and biochemical spectrum of mitochondrial complex III deficiency caused by mutations in the BCS1L gene. Clin. Genet 75, 585–587 (2009). [DOI] [PubMed] [Google Scholar]
- 37.Hinson JT et al. Missense mutations in the BCS1L gene as a cause of the Bjornstad syndrome. N. Engl. J. Med 356, 809–819 (2007). [DOI] [PubMed] [Google Scholar]
- 38.Baker RA, Priestley JRC, Wilstermann AM, Reese KJ & Mark PR Clinical spectrum of BCS1L Mitopathies and their underlying structural relationships. Am. J. Med. Genet A 179, 373–380 (2019). [DOI] [PubMed] [Google Scholar]
- 39.Emsley P. & Cowtan K. Coot: model-building tools for molecular graphics. Acta Crystallogr. D 60, 2126–2132 (2004). [DOI] [PubMed] [Google Scholar]
- 40.Smith PK et al. Measurement of protein using bicinchoninic acid. Anal. Biochem 150, 76–85 (1985). [DOI] [PubMed] [Google Scholar]
- 41.Lanzetta PA, Alvarez LJ, Reinach PS & Candia OA An improved assay for nanomole amounts of inorganic phosphate. Anal. Biochem 100, 95–97 (1979). [DOI] [PubMed] [Google Scholar]
- 42.Hess HH & Derr JE Assay of inorganic and organic phosphorus in the 0.1–5 nanomole range. Anal. Biochem 63, 607–613 (1975). [DOI] [PubMed] [Google Scholar]
- 43.Otwinowski Z. & Minor W. Processing of X-ray diffraction data collected in oscillation mode. Methods Enzymol. 276, 307–326 (1997). [DOI] [PubMed] [Google Scholar]
- 44.Vagin A. & Teplyakov A. Molecular replacement with MOLREP. Acta Crystallogr. D 66, 22–25 (2010). [DOI] [PubMed] [Google Scholar]
- 45.Murshudov GN, Vagin AA & Dodson EJ Refinement of macromolecular structures by the maximum-likelihood method. Acta Crystallogr. D 53, 240–255 (1997). [DOI] [PubMed] [Google Scholar]
- 46.Collaborative Computational Project N. The CCP4 suite: programs for protein crystallography. Acta Crystallogr. D 50, 760–763 (1994). [DOI] [PubMed] [Google Scholar]
- 47.Adams PD et al. PHENIX: building new software for automated crystallographic structure determination. Acta Crystallogr. D 58, 1948–1954 (2002). [DOI] [PubMed] [Google Scholar]
- 48.Meyerson JR et al. Self-assembled monolayers improve protein distribution on holey carbon cryo-EM supports. Sci. Rep 4, 7084 (2014). [DOI] [PMC free article] [PubMed] [Google Scholar]
- 49.Zheng SQ et al. MotionCor2: anisotropic correction of beam-induced motion for improved cryo-electron microscopy. Nat. Methods 14, 331–332 (2017). [DOI] [PMC free article] [PubMed] [Google Scholar]
- 50.Zhang K. Gctf: real-time CTF determination and correction. J. Struct. Biol 193, 1–12 (2016). [DOI] [PMC free article] [PubMed] [Google Scholar]
- 51.Zivanov J. et al. New tools for automated high-resolution cryo-EM structure determination in RELION-3. eLife 7, e42166 (2018). [DOI] [PMC free article] [PubMed] [Google Scholar]
- 52.Vilas JL et al. MonoRes: automatic and accurate estimation of local resolution for electron microscopy maps. Structure 26, 337–344 e4 (2018). [DOI] [PubMed] [Google Scholar]
- 53.Ramirez-Aportela E. et al. Automatic local resolution-based sharpening of cryo-EM maps. Bioinformatics 10.1093/bioinformatics/btz671 (2019). [DOI] [PMC free article] [PubMed] [Google Scholar]
- 54.Pettersen EF et al. UCSF Chimera—a visualization system for exploratory research and analysis. J. Comput. Chem 25, 1605–1612 (2004). [DOI] [PubMed] [Google Scholar]
- 55.Blazquez A. et al. Infantile mitochondrial encephalomyopathy with unusual phenotype caused by a novel BCS1L mutation in an isolated complex III-deficient patient. Neuromuscul. Disord 19, 143–146 (2009). [DOI] [PubMed] [Google Scholar]
- 56.Visapaa I. et al. GRACILE syndrome, a lethal metabolic disorder with iron overload, is caused by a point mutation in BCS1L. Am. J. Hum. Genet 71, 863–876 (2002). [DOI] [PMC free article] [PubMed] [Google Scholar]
- 57.de Lonlay P. et al. A mutant mitochondrial respiratory chain assembly protein causes complex III deficiency in patients with tubulopathy, encephalopathy and liver failure. Nat. Genet 29, 57–60 (2001). [DOI] [PubMed] [Google Scholar]
- 58.Leveen P. et al. The GRACILE mutation introduced into Bcs1l causes postnatal complex III deficiency: a viable mouse model for mitochondrial hepatopathy. Hepatology 53, 437–447 (2011). [DOI] [PubMed] [Google Scholar]
Associated Data
This section collects any data citations, data availability statements, or supplementary materials included in this article.
Supplementary Materials
Data Availability Statement
Atomic coordinates and structure factors have been deposited in the Protein Data Bank (PDB) with accession codes PDB 6U1Y (ΔNmBcs1-AMP-PNP) and PDB 6UKO (FLmBcs1-ADP). Cryo-EM structures and atomic models have been deposited in the Electron Microscopy Data Bank and PDB with accession codes EMDB 20808, PDB 6UKP (Apo mBcs1) and EMDB 20811, PDB 6UKS (ATPγS-bound mBcs1). Source data for Extended Data Fig. 1 are provided with the paper.


