

Abstract
This work presents an overview of the evolution of mathematical modeling applied to the context of epidemics and the advances in modeling in epidemiological studies. In fact, mathematical treatments have contributed substantially in the epidemiology area since the formulation of the famous SIR (susceptible-infected-recovered) model, in the beginning of the 20th century. We presented the SIR deterministic model and we also showed a more realistic application of this model applying a stochastic approach in complex networks. Nowadays, computational tools, such as big data and complex networks, in addition to mathematical modeling and statistical analysis, have been shown to be essential to understand the developing of the disease and the scale of the emerging outbreak. These issues are fundamental concerns to guide public health policies. Lately, the current pandemic caused by the new coronavirus further enlightened the importance of mathematical modeling associated with computational and statistical tools. For this reason, we intend to bring basic knowledge of mathematical modeling applied to epidemiology to a broad audience. We show the progress of this field of knowledge over the years, as well as the technical part involving several numerical tools.
Keywords: Epidemic, Mathematical modeling, SIR model, Disease spreading, Public health, Complex networks
Introduction
Studies involving epidemiology were consolidated in the 19th century although the mortality from infectious diseases has been investigated mathematically since the Eighteenth century [20]. But it was only in 1927, with the formulation of a mathematical model known as SIR (susceptible-infected-recovered) model [45], by the biochemist Kermack and the physician McKendrick , that the modern mathematical epidemiology indeed began.
Afterwards, many increasingly complex models were created to model epidemic processes, but most of them are based on the concepts of the SIR model [8, 47]. In general, such models are extremely useful for finding out how rapidly the etiological agent, for example, a virus, can spread, how many people will be affected, what containment measures can be taken, what proportion of a population should be vaccinated, etc.
The study of infectious disease dynamics has become very interdisciplinary, in the last decades. The contributions of mathematics, physics, biology, computer science, statistics and epidemiology are essential to provide effective responses for the development and improvement of public health. In this context, mathematical modeling appears with a huge potential to clarify the complexity of the dynamics of infectious diseases [30, 40].
Infectious diseases emerge due to environmental, social and demographic factors because we are always in contact with microorganisms or animals that host them [58]. According to World Health Organization (WHO), research and development efforts must prioritize a set of diseases, all of them caused by virus, including ebola virus [16], Zika virus [2], Middle East respiratory syndrome coronavirus (MERS) [39] and severe acute respiratory syndrome (SARS) [28, 50].
Recently, due to the current pandemic caused by the new coronavirus, the importance of mathematical modeling have become increasingly remarkable. Jargons of the area such as basic reproductive number, infection rate, epidemic threshold, etc., are frequently mentioned in news and in social media posts. In this context, our aim is to provide basic information of mathematical modeling applied to epidemiology to a broad audience and more detailed references for those who would like to learn deeper the topic.
This manuscript is divided as follows: in Sect. 2, we presented a historical background about epidemiology and multicausality. In Sect. 3 we presented the advances of mathematical models in the context of epidemiological analysis. In Sect. 4, we presented the mathematical development of the SIR model, its usefulness for modeling a pandemic, its unfolding in other more complex epidemic models and its implementation using complex networks. Finally, in Sect. 5, we closed this issue presenting some perspectives and challenges of the mathematical modeling related to pandemics, public health, vaccines and infodemic.
Historical background of epidemiology and multicausality
Researches involving epidemiology were well-established in the Nineteenth century with pioneering studies about the London cholera epidemic (1849–1854) by the sanitarist medical-doctor John Snow. He became known as the father of epidemiology because he was able to determine the source of infection from a disease, even without knowing its etiological agent [63]. Afterward, the scientist Louis Pasteur determined the etiological agent of diseases, which enabled the introduction of prevention and treatment measures [72].
Previously, this research area had already had contributions from experts as John Graunt, in the Fifteenth century, who quantified the patterns of mortality and birth rates [68]. In the Sixteenth century, Louis Villermé investigated the impact of poverty and bad working conditions on the health of the population [43] and Pierre Louis used the epidemiological method in clinical investigations [56]. Edward Jenner, in 1796, discovered the first smallpox vaccine, almost a hundred years before the virus was discovered. Fortunately, this disease was permanently eradicated from the planet in 1980 due to mass vaccination [67]. Ignaz Semmelweis, in the 19h century, was the first health professional to associate the contamination of hands with transmission disease and he introduced hygiene measures to reduce the spread of pathogens, significantly decreasing the number of deaths from infection in hospitals [77].
Therefore, infectious diseases are a ubiquitous part of human life. The bubonic plague, caused by a bacteria transmitted to human by the rat flea, reached Europe in the Fourteenth century leaving 50 million dead. Cholera, known since ancient times and transmitted to people through contaminated water and food, had a first epidemic outbreak in the early Nineteenth century killing hundreds of thousands of people. Tuberculosis is highly contagious because it is transmitted from one person to another through the respiratory tract [58, 60]. This disease killed a billion people between 1850 and 1950 although trace elements of the disease were found in skeletons 7000 years ago. In recent years, the infection has resurfaced in underdeveloped countries and currently, together with malaria, they are considered the most important re-emerging infectious diseases in the world [80].
Epidemics of new and old infectious diseases, also known as emerging and reemerging diseases, periodically emerge [57]. They remain among the leading causes of death and can be associated with human behaviours and environmental perturbation [25]. There are many infectious diseases that have plagued humanity for years such as bubonic plague, cholera, tuberculosis, smallpox, Spanish flu, dengue fever, AIDS, etc. Many of them have caused terrible epidemics and/or cause worrying endemics, especially in tropical and underdeveloped countries [60].
Remarkably, major epidemics of the Twentieth and Twenty first centuries are caused by virus. The World Health Organization (WHO) has indicated that vector-borne diseases account for more than of infectious diseases in the world, causing more than 700,000 deaths per year. Many of them are transmitted by a virus through a vector, such as dengue, yellow fever and Zika [80]. Such infections affect more the poorest populations of underdeveloped countries, being classified as neglected tropical diseases [80]. The Zika virus, for example was identified in 1947 among primates in the Zika forest in Uganda but the major outbreak happened in Brazil between 2015 and 2016 and subsequently spread to other countries in South America, Central America and the Caribbean. Brazil led the discovery of the relationship between the Zika virus and the increase cases of microcephaly in newborns [12].
Another viral disease of global importance is Acquired Immunodeficiency Syndrome (AIDS), whose outbreak began in the 1980s, that is caused by HIV virus and it attacks the immune system. There is no vaccine, but treatment can be done with antiretroviral drugs, which also greatly reduces the chance of transmission through sexual relations [32]. In Africa, it is estimated that of adults have the virus, according to WHO [80]. This continent is also the most affected by the ebola virus. This disease can be transmitted through contaminated meat (bats are usuallys the primary hosts) or body fluids from infected people. As it manifests severe symptoms, it is easy to identify and isolate the infected individual. The same does not happen with diseases caused by viruses like influenza and coronavirus [16].
Some strains of the influenza virus, for example, were responsible for the Spanish flu in 1918 [75], killing millions of people worldwide and for swine flu in 2009. Different strains of the coronavirus were responsible for the 2002 epidemic when SARS-CoV virus caused an outbreak of severe acute respiratory syndrome (SARS) [28, 50]. In 2012 MERS-CoV virus caused Middle East respiratory syndrome (MERS) [39] and finally, in 2019 , the pandemic caused by the new coronavirus SARS-CoV2, responsible for the corona virus disease (COVID-19) [48], infected 25 million people and killed 848,000 people around the world until August 2020, according to WHO [80].
In general, the symptoms of these diseases are similar and in the beggining not much severe. People usually present clinical symptoms as fever, cough and difficulty in breathing. The delay in the manifestation of symptoms (about a week after contagion) combined with mild symptoms that affect the majority of the population are key ingredients that promote a fast spreading of the disease [49]. In addition to these ingredients, the way as the virus is transmitted from one person to another also facilitates the spread. Transmission occurs through physical contact with contaminated people or surfaces, such as shaking hands or touching a contaminated surface and then touching the eyes, mouth or nose, for example. Sneezing, coughing and saliva droplets from infected people also transmit the virus, that is why the use of masks and measures related to social distance are so required by health surveillance [80].
In this context, mathematical modeling offers valuable tools for understanding the disease spreading, quantifying the total number of people being infected over time and, consequently, investigating the impact of humans mobility, environmental changes and also the effectiveness of prevention and control measures for developing and evaluating evidence for decision-making in global health [8, 30].
Advances in mathematical models
The SIR model is one of the most basic models to investigate epidemic process. In this scenario, each individual can be in one of three epidemiological states at any given time: susceptible, infected and infectious, or removed which can mean immunized (recovered) or dead [45]. The model specifies the rates at which individual changes their state, as detailed in the netx section.
Originally, epidemic models did not taking into account the heterogeneity in contact behavior not even the mobility of the agents involved in the disease transmission process. The simplest theory of epidemic spreading assumes that the population can be divided into different compartments according to the stage of the disease as susceptible, infected or removed, for the SIR model, for example. However, individuals are assumed to be identical and have approximately the same number of neighbors. From this elementary approach, we are able to write a time evolution equation for the number of infected individuals and finally, we can obtain relevant informations about the disease spreading. This characterizes the homogenenous mean-field theory [7] and the complete analysis of this algebraic development is shown in Sect. 4.
Over the past few decades, the increase sophistication of epidemic models, the advance in the computational system and the use of complex network tools combine with big data provide opportunities to predict epidemic outbreaks and control strategies in an accurate and increasingly realistic way [8, 11, 40, 47].
There are many works in the literature that can exemplify the advancement in mathematical modeling [3, 44]. For instance, to model the measles outbreak in children, the models considered age groups, spatial and temporal features and metapopulation structured [24, 38, 82]. Metapopulation is a set of populations, separated in space, but connected with each other allowing the movement of people between them [21].
When it concerns about infectious diseases transmitted by a vector, such as malaria, dengue fever, Zika and leishmaniasis, the modeling involves at least two host species and environmental conditions should be considered. In this case, multilayer networks [37] have shown to be useful because they are composed by two distinc layers, for instance, one representing the human population and its mobility, and the other representing the same for the vector—a mosquito, for example—that transmits the disease to humans. The disease propagation between layers since one infected human can infect a insect which, in turn, can sting a healthy human and infects him [37].
Novel emerging infections such as SARS, MERS, and SARS-Cov2 required models that take into account contact tracing, quarantine, human mobility patterns, intervetions measures, latency period, comorbidities, age groups and impact of vaccines. Besides that, social mixing patterns, the urban demography and spatial dynamics also have to be taken into account as they directly impact on the transmission of infectious diseases. [46, 51, 53].
To implement and to investigate the spread of infectious diseases we can used a set of approaches: deterministic, stochastic, agent-based, or a mixed of them. These alternative perspectives allowing researchers to gain complementary insights about infectious diseases and investigate strategies for combating them. Most of them are based on compartment models, this means, the populations of individuals are divided in different compartments, where each compartment represents a specific stage of the disease [30]. In a stochastic framework, the transition probabilities of one compartment to another can be modeled by a continuous time Markov process [1, 76]. However, these probabilities can be approximated, in the deterministic approach, by a differential form. In this case, the set of ordinary differential equations describe how the system evolve in time [69, 74]. Besides that, statistical approaches can also be used to model epidemic dynamics, mainly when it involves concerns related to the spatio-temporal behavior of the disease [6, 41, 66]. In general, all of these models try to capture the complexity of the real-world such as mobility patterns, social contacts, age stratification and spatial distribution of the population.
The deterministic investigation of epidemic models is already sufficient to provide us a basic description of an epidemic, such as the existence of an epidemic threshold that separates a phase where the epidemic grows exponentially from a disease-free state [54]. It is due to the existence of this threshold that disease control measures can be introduced. On the other hand, stochastic models, associated with Monte Carlos simulations, are useful to investigate epidemic models on networks [4, 36, 62, 64]. In this scenario, each individual of a population is represented by a vertex or a node of the network and the transmission of the disease occurs through edges connecting them. This framework provides a more realistic perspective, since we are able to investigate the epidemic spreading on large and highly heterogeneous systems. In the next section, we describe both deterministic and stochastic approaches to explore the SIR model.
Epidemic modeling
How to model the evolution of the dynamic disease and how to mitigate its growth? [45] An epidemic outbreak usually starts with just one infected person—called zero individual—that is the first one takes the virus. As mentioned previously, we can use the SIR model [45] to investigate this dynamic. The SIR model becomes a famous epidemic model because despite its simplicity, it is able to predict an essential feature for epidemiology: epidemic threshold. It separates two distinct states of the epidemic: disease free scenario and a state of there are a significant quantity of infected people [54]. There are many other models more complex than the SIR model, but almost all of them are based on the SIR rules, that describes very well the dynamic of an epidemic [62]. We firstly investigated this successful model using a deterministic approach and after we implemented this model in networks using the stochastic framework.
The SIR deterministic model
In this model [45], the population is divided in three compartments: susceptible S, infected I or removed R. Susceptible individuals are at risk of getting the disease, if they have some contact with an infected one. If it happens, the susceptible individual becomes infected and, consequently, he/she is able to disseminate the virus. Generally, there are two possibilities for infected people, to heal and become immune or, unfortunately, to die. Both of cases are equivalent from a mathematical point of view because they do not transmit the virus anymore and pass to the removed class.
Besides the SIR model, there are other models that include more compartments and that can be useful depending on the type of disease one wants to model. For example, in the SEIR model, we consider a latent period, called Exposed (E), in which an individual is infected but it still does not transmit the virus. This stage corresponds to an intermediate period between susceptible and infected. We can also include a differentiation between recovered and dead individuals through the inclusion of compartment D (dead). In this case, we have a SEIRD model. Another example is the famous SIRS model, in which the individual has only temporary immunity, and may become susceptible to the disease again after a certain time [64]. Recently, Arenas and collaborators [5] proposed a model to study the spreading of the COVID-19 pandemic based on 10 compartments. According to this work, the population is divided into: susceptible (S), exposed (E), asymptomatic infectious (A), symptomatic infectious (I), to be admitted in ICU (pre hospitalized in ICU,PH), fatal prognosis (predeceased,PD), admitted in ICU that will recover (HR) or decease (HD), recovered (R), and deceased(D).
Thus we can then conclude that, according to the complexity of the investigated disease, many compartments can be incorporated into the model. However, it is interesting to note that, despite its simplicity, the SIR model is able to capture essential features of an ordinary epidemic, such as the fact that social distancing measures work very well and that vaccination is really the best strategy to contain its spreading, as we will show below. Therefore, in this work we are going to focus on this model. If the reader wants to know more details about the other models, we recommend reading references [30, 64].
In the SIR model, we considered that the size N of population remains constant, this means: , where X(t) represents the population of the compartment X in a given time step t. So, S(t)/N is the fraction of the population that can be infected. Let’s suppose that each infected individual has, on average, contacts, then daily meetings can result in contagion. However, it is reasonable to assume that only a fraction of those meetings effectively results in contagion. Consequently, the number of new infected people in the next day will be [45]:
But the number of infected people also decreases as long as they become recovered or dead. If the mean recovered time is D days, a fraction of infected will become recovered every day. Finally, the number of total infected in the next day can given by:
| 1 |
where is the unit of time that corresponds to an specific time interval, which can denote, for example, one day. If N has a large value, we can consider that the variables are continuous when we make the interval of time smaller and smaller, that is:
| 2 |
In the beginning of a new epidemic, that corresponds to in our mathematical approach, we can assume a commonly hypothesis that practically all individuals are susceptible1 - except the zero individual—it means . This value remains pretty constant in the first steps of the contagion. For example we can cite the number of infected people with the new coronavirus (SARS-CoV-2).The first reported case occurs in Wuhan, China on December 31, 2019. After one month, in January 31, 2020, there were 9826 infected individuals, according to the Situation Report 11 of WHO [80]. This correspond to a tiny fraction of the global population - more than seven billion of people according to the United Nations Organization. Considering this approximation, we have
| 3 |
which gives,
| 4 |
as a solution of the evolution of the number of infected people in the beginning of the epidemic. We can obtain a valuable information with this expression. If , the number of infected grows exponentially. However, if , the number of infected people decreases until the complete extinction of the epidemic. The value is the epidemic threshold, which separates two distinct phases of the epidemic. When the initial condition corresponds to all susceptible people, as happened in the COVID-19 spreading for example, we have a particular case when the value is known as the basic reproductive number and it measures the “intensity of the contagion”, this means, the quantity of contagion that each infected person can cause. It means that the number of infected will increase because . On the other hand, when we look at how the number of susceptible people changes over time, we concluded that this quantity will always decreases with time because
| 5 |
Therefore, there will be a time when the quantity will become smaller than one, and consequently, the number of infected will start to decrease. That is, the number of infected individuals grows exponentially fast at the beginning of the epidemic, reaches a peak and begins to decline as we show in Fig. 1a. This is the natural behavior of an epidemic. However, waiting for a large part of the population to become infected in order to mitigate the epidemic is certainly not the best strategy, especially when the disease presents high mortality and lethality rates.
Fig. 1.

a The evolution of density of infected, susceptible and removed individuals over time. The number of infected individuals grows exponentially fast at the beginning of the epidemic, reaches a peak and begins to decline, showing the natural behavior of an epidemic. b The graph is the same as represented in (a) but here is a simple demonstration of the effectiveness of vaccination. A small portion initially immunized (about of individuals at ) is already enough to drastically decrease the number of people infected over time and it is also decrease the peak of the epidemic (Color figure online)
We can remember that , and, in the beginning of the epidemic , then if
| 6 |
the epidemic starts to reduce. This shows us there are other strategies that can be adopted by governments and the entire population to mitigate the epidemic.
Indeed, the most efficient measure that would cause minor impact on society is mass vaccination. If that happened at the beginning of the epidemic, few people would be infected because the quantity S(t) would already start with a reduced value, quickly extinguishing the epidemic (see Fig. 1b). This measure has worked for many cases as we mentioned in historical background, but unfortunately this strategy is not always possible especially when it comes to new emerging diseases, such as SARS-COV-2.
To reduce the contagion we can also reduce , the number of contact promoting measures of social distance, or we can minimize which implies reducing contagious encounters, that is, wearing masks, not touching infected people, and washing hands frequently. When these rates and are reduced, the curve of infected people changes becoming more flattened and with a lower peak, as we show in Fig. 2. This explain why such measures of social distance are very important: the peak reduction, that is, the reduction of people that are infected simultaneously, avoids overloading health systems. How long a person remains infected is also a relevant factor. The faster the individual is cured, the less the transmission.
Fig. 2.
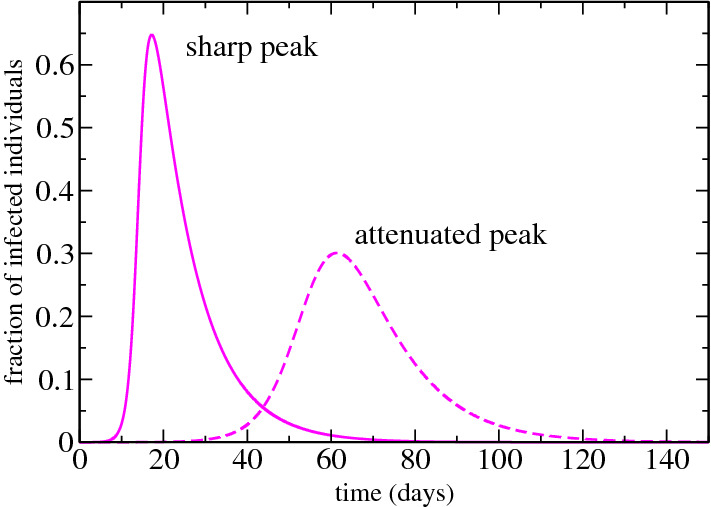
We show the difference between the infected curve over time when the contagion is reduced. The peak becomes more attenuated and consequently the epidemic lasts longer (Color figure online)
From these analyzes, we can observe how mathematical modeling can influence public health policies. However, when we investigate a pandemic, which affects several countries at the same time, the situation is more complex. Countries, states and cities have completely different demographic, economic and social configurations; therefore, other elements must be considered in the diagnosis of the evolution of the disease and in the insertion of control measures. To cover all this complexity, stochastic models are more robust as we will see in the simplest example showed below.
The SIR stochastic model running on top of complex networks
In the previous analysis we were not concern about the connection between infected, susceptible and recovered individuals. However to cover a more realistic situation we can take into account different patterns of connectivity between them. We can make this assumption considering a network where each individual is represented by a vertex or a node and the transmission of the disease occurs through edges connecting them [4, 36, 62].
The simplest scenario can be represent by a random graph as the model proposed by Erdős and Rényi (ER) [29], where a network is constructed starting from a set of N nodes and all pair of nodes have the same probability of connecting. This generates a homogeneous graph (see Fig. 3a) in which the vertices have a number of neighbors, named k degree, that do not differ much from the average degree . The connectivity distribution for this graph can be represent by a Poisson distribution, as showed in Fig. 4. Here we compared this homogeneous network with a heterogeneous one. This comparison, despite its simplicity, it is useful enough to show how the topology of the network, this mean, the pattern of connection can highly impact on the epidemic spreading.
Fig. 3.
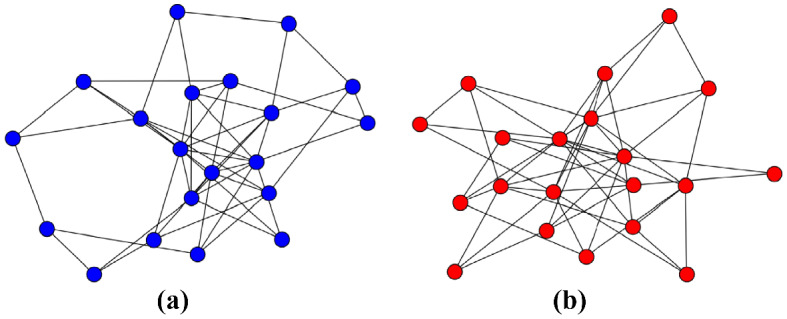
An illustration of (a) Erdős and Rényi and (b) Barabàsi-Albert networks. Both with nodes. It is possible to observe the difference between the connectivity patterns. While the former has nodes with almost the same number of links, the latter has a few of nodes with many edges (Color figure online)
Fig. 4.
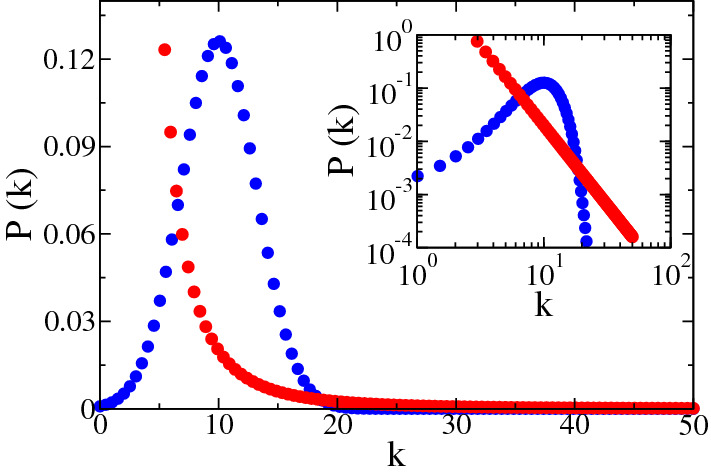
The degree distribution of networks generated by Erdős and Rényi (blue circles) and Barabàsi-Albert (red circles) networks. The inset (log-log scale) shows clearly the heavy-tail of the heterogeneous distribution compared with the homogeneous one (Color figure online)
As an example of heterogeneous network, we used the most well-known complex network model: Barabàsi-Albert (BA) model [9]. In this system, new nodes are added to the network and they are connected to those nodes already present in the network with a probability proportional to their degrees, promoting the emergence of hubs, it means, nodes with a large number of connections () as we showed in Fig. 3b. These growth and preferential attachment rules provide a network with a power law degree distribution , with in the thermodynamic limit (see Fig. 4). This connectivity distribution, known as heavy-tail distribution indicates that there is a low probability, but different from zero, to find hubs in the network. This is an important feature of heterogeneous networks since hubs can spread the disease to a larger number of neighbors, thus contributing to the speed of infection. Despite the addition of new nodes, when we investigate epidemic process in this network, we consider it a static network since it is grown first and after the dynamics run through the substrate.
To investigate the role of connectivity pattern, we can rewrite Eq. (2) using a heterogeneous mean-field (HMF) approach, in which dynamical quantities, as the density of infected individuals, depend only of the vertex degree. Then, we named the density of infected nodes with a given degree k and the dynamical mean-field equation describing the system can thus be written as [62]:
| 7 |
The first term on the right-side considers the event that a node with k links is healthy, , and gets the infection via a nearest neighbor. The probability of this event is proportional to the infection rate , the number of connections k and the density of infected neighbors . The second term considers nodes becoming healthy at rate . To solve this equation we should consider there is no degree correlations, this means the probability that a link between a node with degree k and other node with degree can be expressed as [10]. So, can be expressed as
| 8 |
The term considers that at least one link of an infected node points to other infected node, through which it got infected and this node can not be reinfected again, because, once infected, it becomes removed at a rate and it can not return to the susceptible compartment [62]. We can replace with , where is the number of recovered nodes with degree k in the time t. Performing the linearization of Eq. (7), we obtain the epidemic threshold, this means, the value of delimiting the transition between the absorbing phase () and the active phase ( and finite), and it is given by [10, 62]:
| 9 |
Other mean-field approaches can be used to calculate the epidemic threshold, as for example, the quenched mean-field theory [17], that explicitly takes into account the actual connectivity of the network through its adjacency matrix, whose elements if the vertices i and j are connected, and , otherwise [10]. However, for the scope of this work, the previous analysis is quite enough.
We can estimate now the epidemic threshold of the SIR model running on top of the Erdős-Rényi and the Barabàsi-Albert networks. For the homogeneous model, we obtain a finite threshold, however, for the heterogeneous network, we obtain a vanishing one, since scale-free networks, characterized by a power-law degree distribution with exponent , has when the network goes to an infinite size [15]. This simple analysis shows us how the connection structure of individuals in a network plays a fundamental role in the spread of the disease, which shows how complex the study of an epidemic can become.
To verify this prediction we can simulate the SIR model running on the top of both networks. Numerical simulations is an important tool to check the accuracy of mean-field approaches. The Gillespie algorithm [34] is the standard algorithm to implement continuous-time Markov processes [4, 36]. In a Markov chain process the physical state at a given time t depends only on the state at the previous time. We can associated independent spontaneous processes to each dynamical transition, infection and cure, for example. However, in each change of state, a list of all possible spontaneous processes must be updated. For very large networks this task is computationally unsustainable. Cota and Ferreira [23] proposed an optimized version of the Gillespie recipe and the SIR dynamics can be simulated according to the following steps [33]:
To keep and constantly to update a list with the positions of all infected vertices where changes will take place;
the time step is incremented by ;
With probability an infected vertex i is selected randomly and turns it to removed;
With complementary probability an infected vertex is selected at random and accepted with probability proportional to its degree. In the infection attempt, a neighbor of the selected vertex is randomly chosen and if susceptible, it is infected. Otherwise nothing happens and simulations run to the next time step.
The total rate that an infected vertex becomes removed in the whole network is , where is the number of infected vertices and the total rate that one susceptible vertex is infected is given by , where is the number of vertices emanating from infected nodes.
In the Fig. 5 we show the density of removed individuals as a function of the parameter control . In this simulation we fixed and named the threshold, without loss of generality, just to simplify the notation. Note that the density of recovered nodes changes from a null value (absorbing state) to a finite value (active state) for a specific value of that is known as , the epidemic threshold.2 For BA network, this happen for a smaller value of , near to zero, as expected because when . While for ER network, it is necessary a bigger value of infection rate to start the spreading of the disease to the entire network, confirming how the network topology influences the dynamics of the epidemic. For both networks, we used and . It is well-known that real systems are much more similar to BA network than ER one [15]. This elucidates many real-world phenomena such as the fact that only one infected individual, called individual zero, is enough to spread an epidemic to the entire world, as happened in the COVID-19 pandemic [30, 48].
Fig. 5.
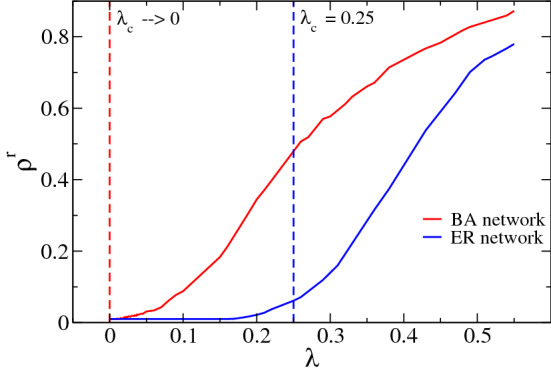
Density of recovered (or removed) nodes (individuals)— - in function of the infection rate , also known as control parameter. For BA network, a small value of the infection rate is enough to start the disease spreading while for ER network, it is necessary a bigger value of to start the spreading of the disease to the entire network. The value of is the epidemic threshold for the SIR model running on top of these different substrates. Here, we used both networks with nodes (Color figure online)
As we mentioned previously, despite the simplicity of this comparison, we hope that it has become clear to the reader the relevance of complex networks in epidemic modeling and how this issue gets more and more refined and intricate depending on the substrate used. However, as we discussed in Sect. 2, more sophisticated network models such as metapopulations [21], multilayer networks [26, 37, 59], models that include agent mobility patterns, age stratification social mixing patterns, spatial structure, interventions measures [30, 46, 51, 53] are even more realistic and, when they are used in combination with big data and statistical tools, they are able to provide increasingly accurate outcomes.
Non-compartmental models
Most of studies to model epidemic spreading are based on compartmental models. However, other methodologies, for example, statistical analyses, can also be used. Typically, at the beginning of disease spreading, compartmental models are useful to predict the development of the epidemic. This is important to help the government make decisions related to containment measures and also to prevent the population from the risk of contagion [5, 42, 81]. But spatial statistics methods is able to obtain more appreciable insights related to the spreading pattern of the disease in space and time, taking into account geographic, social and demographic factors. Indeed, there are many different types of statistical approaches that can be used to investigate epidemic spreading processes. It would be unfeasible to discuss in greater detail all of them in this work. However, we would like to mention some important aspects of this kind of approach.
For example, there are recent studies using statistical tools to investigate the spatio-temporal spreading of the COVID-19 disease. Wells and collaborators [79] used maximum likelihood to predict the impact of travels on the dynamic of this pandemic. Azevedo and colleagues [6] analyzed the spatial and temporal dynamics of the disease by mapping the infection rates in the municipalities of Portugal through maps of the interpolation of this rate over time. Ribeiro et al. [66] predicted the cumulative cases of COVID-19 in ten Brazilian states. Zhao et al. [84] used correlational analysis to quantify the relation between the number of passengers from Wuhan with the number of infected people in a set of ten nearby cities.
In other recent study, the authors [78] observed 1212 patients in China and they evaluated the incubation period using maximum likelihood estimation. The authors of reference [70] also investigated the spatial and temporal associations of the incidence, mortality, and the rate of two different kinds of tests in a specific region from Brazil. Pedrosa and collaborators [65] also analysed the COVID-19 cases spatially and related to the number of intensive care beds in the region investigated.
Despite extensive efforts to predict and contain an epidemic, we must always remember that the spread of a disease involves an exponential growth of infected people and this is intrinsically unpredictable. In addition, such events are directly related to the individual and collective behavior of the population, which makes it even more complex [18].
Final remarks: challenges and perspectives
In this paper, we briefly reviewed epidemics from the perspective of historical background and mathematical modeling. Our aim was to introduce this topic for a broad audience, on the purpose of summarizing the evolution of the use of mathematical modeling, complex networks and statistical tools in epidemiology. We synthesized the primary literature on this topic over the years and we provided a comprehensive list of citations for those who desire to go beyond.
We believe that it became clear to the reader the importance of computational tools in predicting epidemics, in helping governments to implement safe and efficient public policies and in implementing different vaccination strategies [40]. This is essential to think about public health policies and, above all, to make the population aware of the importance of control measures such as social isolation, quarantine, wearing masks, constant hand hygiene, etc. Infectious diseases are challenging in the scope of public health policies because their prevention and control involve national and regional efforts coordinated worldwide [27].
Scientific community has done great efforts to search for specific antiviral therapeutics and vaccines against many virus such as SARS-CoV-2. The main idea, explaining in a trivial way, is found a method to inhibit the activity of the main protease of the virus – in this specific example, the new coronavirus - and consequently to block viral replication. In this context, complex networks can also help to answer questions related to protein structure and functioning (useful surveys related to this topic can be found in the references [13, 31]).
It is important to emphasize that epidemic models–despite their usefulness to predict and to better understand dynamical diseases—present limitations of modeling related to uncertainties in predictions since, however sophisticated they are, they are not able to capture all the complexity of social interactions [27, 40]. In addition, there are other challenges such as synthesizing data in real time, underreporting of cases and deaths, new policies to vaccinate the most vulnerable population, missing information on the influence of control measures to comprehension human responses, etc [35].
Besides the challenges inherent in predicting and controlling any epidemic, lately we have a major obstacle related to the large amount of information we receive daily, especially from social media. WHO classified this phenomena as an infodemic [80], this means, the volume of information related to an specific topic, such as the COVID-19 pandemic, has grown exponentially fast in a short period of time, mainly because social media. This huge quantify of information—not always accurate - negatively affects human health making people confused, and increasing mental health problems like depression and anxiety. It makes hard for people to find trusted sources and consequently it impacts in the community engagement and its well-being [83].
In conclusion, we emphasized that the progress in the epidemiological modeling area has grown incredibly fast and it is not possible to discuss all recent surveys, but we mentioned the main advances in this field. The relevance of studying epidemic models becomes more evident when faced with alarming situations such as the recent pandemic of COVID-19 [30, 48]. Recently, there have been several innovative and interesting works on the modeling of SARS-CoV-2 using different substrates related to complex networks [19, 22, 52, 71, 73]. It is also relevant to mention that the use of mathematical and computational tools presented here can be expanded and applied to other disease spreading such as livestock and vector-borne diseases [14, 80]. We are aware that there are many challenges in modeling spreading diseases mainly related to public health and global transmission [55]. However, we hope that this survey identifies our current situation and what we still need to do to improve our mathematical and computational tools and, consequently, to fight better future epidemics.
Acknowledgements
Angélica S. Mata acknowledges the support from FAPEMIG (Grant No. APQ-02482-18) and CNPq (Grant No. 423185/2018-7).
Declarations
Conflict of interest
The authors declare there is no conflict of interest.
Footnotes
Here we are considering an approximation to simplify the mathematical calculations. We know that there are several biological factors that can, for example, make a fraction of the population naturally immune to some new epidemic. However, to attend our aim, this assumption is quite reasonable.
In fact, any realization of the epidemic dynamics in finite networks reaches the absorbing state sooner or later because of dynamic fluctuations inherent to stochastic process, even above the critical point. This simulation difficulty was traditionally overcome by quasi stationary methods. For further details, the reader can consult the following references: [54, 61]
Publisher's Note
Springer Nature remains neutral with regard to jurisdictional claims in published maps and institutional affiliations.
References
- 1.Allen, L.J.: A primer on stochastic epidemic models: formulation, numerical simulation, and analysis. Infect. Dis. Modell. 2(2), 128–142 (2017) [DOI] [PMC free article] [PubMed] [Google Scholar]
- 2.Anderson, K.B., Thomas, S.J., Endy, T.P.: The emergence of zika virus. Ann. Intern. Med. 165(3), 175–183 (2016) [DOI] [PubMed] [Google Scholar]
- 3.Anderson, R., May, R.: Infectious Diseases of Humans: Dynamics and Control. Dynamics and Control. OUP, Oxford (1992) [Google Scholar]
- 4.Anderson, W.: Continuous-time Markov Chains: an Applications-Oriented Approach. Springer Series in Statistics. Springer, New York (2012) [Google Scholar]
- 5.Arenas, A., Cota, W., Gómez-Gardeñes, J., Gómez, S., Granell, C., Matamalas, J.T., Soriano-Paños, D., Steinegger, B.: Modeling the spatiotemporal epidemic spreading of covid-19 and the impact of mobility and social distancing interventions. Phys. Rev. X 10, 041055 (2020). 10.1103/PhysRevX.10.041055 [Google Scholar]
- 6.Azevedo, L., Pereira, M.J., Ribeiro, M.C., Soares, A.: Geostatistical covid-19 infection risk maps for portugal. Int. J. Health Geogr. 19(1), 1–8 (2020) [DOI] [PMC free article] [PubMed] [Google Scholar]
- 7.Bailey, N.T.J.: The Mathematical Theory of Infectious Diseases and Its Applications. Charles Griffin Company Limited, London (1975) [Google Scholar]
- 8.Balcan, D., Gonçalves, B., Hu, H., Ramasco, J.J., Colizza, V., Vespignani, A.: Modeling the spatial spread of infectious diseases: the global epidemic and mobility computational model. J. Comput. Sci. 3, 132–145 (2010) [DOI] [PMC free article] [PubMed] [Google Scholar]
- 9.Barabási, A.L., Albert, R.: Emergence of scaling in random networks. Science 286(5439), 509–512 (1999) [DOI] [PubMed] [Google Scholar]
- 10.Barrat, A., Barthélemy, M., Vespignani, A.: Dynamical Processes on Complex Networks. Cambridge University Press, Cambridge (2008) [Google Scholar]
- 11.Bauch, C.T., Galvani, A.P.: Social factors in epidemiology. Science 342(6154), 47–49 (2013) [DOI] [PMC free article] [PubMed] [Google Scholar]
- 12.Bautista, L.E.: Maternal zika virus infection and newborn microcephaly–an analysis of the epidemiological evidence. Ann. Epidemiol. 28(2), 111–118 (2018) [DOI] [PubMed] [Google Scholar]
- 13.Blanco-Melo, D., Nilsson-Payant, B.E., Liu, W.C., Uhl, S., Hoagland, D., Møller, R., Jordan, T.X., Oishi, K., Panis, M., Sachs, D., Wang, T.T., Schwartz, R.E., Lim, J.K., Albrecht, R.A., tenOever, B.R.: Imbalanced host response to sars-cov-2 drives development of covid-19. Cell 181(5), 1036-1045.e9 (2020) [DOI] [PMC free article] [PubMed] [Google Scholar]
- 14.Brooks-Pollock, E., de Jong, M., Keeling, M., Klinkenberg, D., Wood, J.: Eight challenges in modelling infectious livestock diseases. Epidemics 10, 1–5 (2015) [DOI] [PubMed] [Google Scholar]
- 15.Caldarelli, G.: Scale-Free Networks: Complex Webs in Nature and Technology. Oxford University Press, Oxford (2007) [Google Scholar]
- 16.Carias, C., O’Hagan, J.J., Gambhir, M., Kahn, E.B., Swerdlow, D.L., Meltzer, M.I.: Forecasting the 2014 west African ebola outbreak. Epidemiol. Rev. 41(1), 34–50 (2019) [DOI] [PubMed]
- 17.Castellano, C., Pastor-Satorras, R.: Thresholds for epidemic spreading in networks. Phys. Rev. Lett. 105, 218701d (2010) [DOI] [PubMed] [Google Scholar]
- 18.Castro, M., Ares, S., Cuesta, J.A., Manrubia, S.: Predictability: can the turning point and end of an expanding epidemic be precisely forecast? 2004.08842 (2020) [DOI] [PMC free article] [PubMed]
- 19.Chang, S., Pierson, E., Koh, P.W., Gerardin, J., Redbird, B., Grusky, D., Leskovec, J.: Mobility network models of covid-19 explain inequities and inform reopening. Nature 589(37), 82–87 (2021). 10.1038/s41586-020-2923-3 [DOI] [PubMed] [Google Scholar]
- 20.Choi, B.C.K.: The past, present, and future of public health surveillance. Scientifica 2012 (2012) [DOI] [PMC free article] [PubMed]
- 21.Colizza, V., Vespignani, A.: Invasion threshold in heterogeneous metapopulation networks. Phys. Rev. Lett. 99, 148701 (2007) [DOI] [PubMed] [Google Scholar]
- 22.Costa, G.S., Cota, W., Ferreira, S.C.: Outbreak diversity in epidemic waves propagating through distinct geographical scales. Phys. Rev. Res. 2, 043306 (2020). 10.1103/PhysRevResearch.2.043306 [Google Scholar]
- 23.Cota, W., Ferreira, S.C.: Optimized gillespie algorithms for the simulation of Markovian epidemic processes on large and heterogeneous networks. Comput. Phys. Commun. 219, 303–312 (2017) [Google Scholar]
- 24.Cutts, F., Dansereau, E., Ferrari, M., Hanson, M., McCarthy, K., Metcalf, C., Takahashi, S., Tatem, A., Thakkar, N., Truelove, S., Utazi, E., Wesolowski, A., Winter, A.: Using models to shape measles control and elimination strategies in low- and middle-income countries: a review of recent applications. Vaccine 38(5), 979–992 (2020) [DOI] [PMC free article] [PubMed] [Google Scholar]
- 25.Dave, K., Lee, P.C.: Global geographical and temporal patterns of seasonal influenza and associated climatic factors. Epidemiol. Rev. 41(1), 51–68 (2019) [DOI] [PubMed] [Google Scholar]
- 26.de Arruda, G.F., Rodrigues, F.A., Moreno, Y.: Fundamentals of spreading processes in single and multilayer complex networks. Phys. Rep. 756, 1–59 (2018). 10.1016/j.physrep.2018.06.007 [Google Scholar]
- 27.Dye, C., Mertens, T., Hirnschall, G., Mpanju-Shumbusho, W., Newman, R.D., Raviglione, M.C., Savioli, L., Nakatani, H.: Who and the future of disease control programmes. The Lancet 381(9864), 413–418 (2013) [DOI] [PubMed] [Google Scholar]
- 28.Emanuel, E.J.: The lessons of sars. Ann. Intern. Med. 139(7), 589–591 (2003) [DOI] [PubMed] [Google Scholar]
- 29.Erdős, P., Rényi, A.: On random graphs. Publicationes Mathematicae Debrecen 6, 290–297 (1959) [Google Scholar]
- 30.Estrada, E.: Covid-19 and sars-cov-2. modeling the present, looking at the future. Phys. Rep. 869, 1–51 (2020a) [DOI] [PMC free article] [PubMed] [Google Scholar]
- 31.Estrada, E.: Topological analysis of sars cov-2 main protease. Chaos: an Interdisciplinary. J. Nonlinear Sci. 30(6), 061102 (2020b) [DOI] [PMC free article] [PubMed] [Google Scholar]
- 32.Fauci, A.S., Macher, A.M., Longo, D.L., Lane, H.C., Rook, A.H., Masur, H., Gelmann, E.P.: Acquired immunodeficiency syndrome: epidemiologic, clinical, immunologic, and therapeutic considerations. Ann. Intern. Med. 100(1), 92–106 (1984) [DOI] [PubMed] [Google Scholar]
- 33.Ferreira, S.C., Castellano, C., Pastor-Satorras, R.: Epidemic thresholds of the susceptible-infected-susceptible model on networks: a comparison of numerical and theoretical results. Phys. Rev. E 86, 041125 (2012) [DOI] [PubMed] [Google Scholar]
- 34.Gillespie, D.T.: A general method for numerically simulating the stochastic time evolution of coupled chemical reactions. J. Comput. Phys. 22(4), 403–434 (1976) [Google Scholar]
- 35.Gog, J.R.: How you can help with covid-19 modelling. Nat. Rev. Phys. 2(6), 274–275 (2020) [DOI] [PMC free article] [PubMed] [Google Scholar]
- 36.Gómez, S., Arenas, A., Borge-Holthoefer, J., Meloni, S., Moreno, Y.: Discrete-time Markov chain approach to contact-based disease spreading in complex networks. EPL (Europhys. Lett.) 89(3), 38009 (2010) [Google Scholar]
- 37.Gómez, S., Díaz-Guilera, A., Gómez-Gardeñes, J., Pérez-Vicente, C.J., Moreno, Y., Arenas, A.: Diffusion dynamics on multiplex networks. Phys. Rev. Lett. 110, 028701 (2013) [DOI] [PubMed] [Google Scholar]
- 38.Goufo, E.F.D., Noutchie, S.C.O., Mugisha, S.: A fractional seir epidemic model for spatial and temporal spread of measles in metapopulations. Abstract Appl. Anal. 2014(781028),(2014)
- 39.Grant, R., Malik, M.R., Elkholy, A., Van Kerkhove, M.D.: A review of asymptomatic and subclinical middle east respiratory syndrome coronavirus infections. Epidemiol. Rev. 41(1), 69–81 (2019) [DOI] [PMC free article] [PubMed] [Google Scholar]
- 40.Heesterbeek, H., Anderson, R.M., Andreasen, V., Bansal, S., De Angelis, D., Dye, C., Eames, K.T.D., Edmunds, W.J., Frost, S.D.W., Funk, S., Hollingsworth, T.D., House, T., Isham, V., Klepac, P., Lessler, J., Lloyd-Smith, J.O., Metcalf, C.J.E., Mollison, D., Pellis, L., Pulliam, J.R.C., Roberts, M.G., Viboud, C.: Modeling infectious disease dynamics in the complex landscape of global health. Science 347(6227),(2015) [DOI] [PMC free article] [PubMed]
- 41.Huang, R., Liu, M., Ding, Y.: Spatial-temporal distribution of covid-19 in china and its prediction: a data-driven modeling analysis. J. Infect. Dev. Ctries. 14(3), 246–253 (2020) [DOI] [PubMed] [Google Scholar]
- 42.Imai, N., Cori, A., Dorigatti, I., Baguelin, M., Donnelly, C.A., Riley, S., Ferguson, N.M.: Report 3—transmissibility of 2019-ncov. WHO collaborating centre for infectious disease modelling, pp 689–697 (2020)
- 43.Julia, C., Valleron, A.J.: Louis-rené villermé (1782–1863), a pioneer in social epidemiology: re-analysis of his data on comparative mortality in paris in the early 19th century. J. Epidemiol. Commun. Health 65(8), 666–670 (2011) [DOI] [PubMed] [Google Scholar]
- 44.Keeling, M.J., Rohani, P.: Model. Infect. Dis. Hum. Anim. Princeton University Press, Princeton, Oxford (2008) [Google Scholar]
- 45.Kermack, W.O., McKendrick, A.G., Walker, G.T.: A contribution to the mathematical theory of epidemics. Proc. R. Soc. Lond. Ser. A Contain. Pap. Math. Phys. Charact. 115(772), 700–721 (1927) [Google Scholar]
- 46.Klepac, P., Kucharski, A.J., Conlan, A.J., Kissler, S., Tang, M., Fry, H., Gog, J.R.: Contacts in context: large-scale setting-specific social mixing matrices from the bbc pandemic project. medRxiv (2020)
- 47.Koher, A., Lentz, H.H.K., Gleeson, J.P., Hövel, P.: Contact-based model for epidemic spreading on temporal networks. Phys. Rev. X 9, 031017 (2019) [Google Scholar]
- 48.Lai, C.C., Shih, T.P., Ko, W.C., Tang, H.J., Hsueh, P.R.: Severe acute respiratory syndrome coronavirus 2 (sars-cov-2) and coronavirus disease-2019 (covid-19): the epidemic and the challenges. Int. J. Antimicrob. Agents 55(3), 105924 (2020) [DOI] [PMC free article] [PubMed] [Google Scholar]
- 49.Lauer, S., Grantz, K., Bi, Q., Jones, F., Zheng, Q., Meredith, H., Azman, A., Nand Lessler, Reich J.: The incubation period of coronavirus disease 2019 (covid-19) from publicly reported confirmed cases: estimation and application. Ann. Intern. Med. 172, 577–582 (2020) [DOI] [PMC free article] [PubMed] [Google Scholar]
- 50.Leung, G.M., Hedley, A.J., Ho, L.M., et al.: The epidemiology of severe acute respiratory syndrome in the 2003 Hong Kong epidemic: an analysis of all 1755 patients. Ann. Intern. Med. 141(9), 662–673 (2004) [DOI] [PubMed] [Google Scholar]
- 51.Linka, K., Peirlinck, M., Costabal, F.S., Kuhl, E.: Outbreak dynamics of covid-19 in Europe and the effect of travel restrictions. Comput. Methods Biomech. Biomed. Engin. 23(11), 710–717 (2020) [DOI] [PMC free article] [PubMed] [Google Scholar]
- 52.Maheshwari, P., Albert, R.: Network model and analysis of the spread of covid-19 with social distancing. Netw. Sci. Appl. (2020). 10.1007/s41109-020-00344-5 [DOI] [PMC free article] [PubMed] [Google Scholar]
- 53.Manchein, C., Brugnago, E.L., da Silva, R.M., Mendes, C.F.O., Beims, M.W.: Strong correlations between power-law growth of covid-19 in four continents and the inefficiency of soft quarantine strategies. Chaos: An Interdisciplinary. J. Nonlinear Sci. 30(4), 041102 (2020) [DOI] [PMC free article] [PubMed] [Google Scholar]
- 54.Marro, J., Dickman, R.: Nonequilibrium Phase Transitions in Lattice Models. Cambridge University Press, Cambridge (1999) [Google Scholar]
- 55.Metcalf, C., Edmunds, W., Lessler, J.: Six challenges in modelling for public health policy. Epidemics 10, 93–96 (2015) [DOI] [PubMed] [Google Scholar]
- 56.Morabia, A.: P. c. a. louis and the birth of clinical epidemiology. J. Clin. Epidemiol. 49(12), 1327–1333 (1996) [DOI] [PubMed] [Google Scholar]
- 57.Morens, D.M., Folkers, G.K., Fauci, A.S.: The challenge of emerging and re-emerging infectious diseases. Nature 430(6996), 242–249 (2004) [DOI] [PMC free article] [PubMed] [Google Scholar]
- 58.Morse, S.S.: Factors in the emergence of infectious diseases. Emerg. Infect. Dis. 1, 7–15 (1995) [DOI] [PMC free article] [PubMed] [Google Scholar]
- 59.Mucha, P.J., Richardson, T., Macon, K., Porter, M.A., Onnela, J.P.: Community structure in time-dependent, multiscale, and multiplex networks. Science 328(5980), 876–878 (2010) [DOI] [PubMed] [Google Scholar]
- 60.Nii-Trebi, N.I.: (2017) Emerging and neglected infectious diseases: insights, advances, and challenges. BioMed Res. Int. (2017) [DOI] [PMC free article] [PubMed]
- 61.de Oliveira, M.M., Dickman, R.: How to simulate the quasistationary state. Phys. Rev. E 71, 016129 (2005) [DOI] [PubMed] [Google Scholar]
- 62.Pastor-Satorras, R., Vespignani, A.: Epidemic spreading in scale-free networks. Phys. Rev. Lett. 86, 3200–3203 (2001) [DOI] [PubMed] [Google Scholar]
- 63.Paneth, A.N.: Assessing the contributions of john snow to epidemiology: 150 years after removal of the broad street pump handle. Epidemiology 15, 514–516 (2004) [DOI] [PubMed] [Google Scholar]
- 64.Pastor-Satorras, R., Castellano, C., Van Mieghem, P., Vespignani, A.: Epidemic processes in complex networks. Rev. Mod. Phys. 87, 925–979 (2015). 10.1103/RevModPhys.87.925 [Google Scholar]
- 65.Pedrosa, N.L., Albuquerque, N.L.S.: Spatial analysis of covid-19 cases and intensive care beds in the state of ceará, brazil. Cien. Saude Colet. 25, 2461–2468 (2020) [DOI] [PubMed] [Google Scholar]
- 66.Ribeiro, M.H.D.M., da Silva, R.G., Mariani, V., dos Santos, C.L.: Short-term forecasting covid-19 cumulative confirmed cases: perspectives for Brazil. Chaos Solitons Fractals, 1–10 (2020) [DOI] [PMC free article] [PubMed]
- 67.Riedel, S.: Edward jenner and the history of smallpox and vaccination. Proc (Bayl Univ Med Cent) 18, 21–25 (2005) [DOI] [PMC free article] [PubMed] [Google Scholar]
- 68.Rothman, K.J.: Lessons from John Graunt. Lancet 347(8993), 37–39 (1996) [DOI] [PubMed] [Google Scholar]
- 69.Sharkey, K.J.: Deterministic epidemic models on contact networks: correlations and unbiological terms. Theor. Popul. Biol. 79(4), 115–129 (2011) [DOI] [PubMed] [Google Scholar]
- 70.Silva-Júnior, M., Mendonça, K., Lima, C., Pires, P.L.S., Calegari, T., Oliveira, S.: Analysis of the spatial-temporal dynamics of incidence, mortality and test rates (rapid and rt-pcr) of covid-19 in the state of minas Gerais, Brazil. Scielo Preprint pp 1–16 (2020)
- 71.Small, M., Cavanagh, D.: Modelling strong control measures for epidemic propagation with networks—a covid-19 case study. IEEE Access 8, 109719–109731 (2020) [DOI] [PMC free article] [PubMed] [Google Scholar]
- 72.Smith, K.: Louis pasteur, the father of immunology? Front. Immunol. 3, 68 (2012) [DOI] [PMC free article] [PubMed] [Google Scholar]
- 73.Thurner, S., Klimek, P., Hanel, R.: A network-based explanation of why most covid-19 infection curves are linear. Proc. Natl. Acad. Sci. 117(37), 22684–22689 (2020). 10.1073/pnas.2010398117 [DOI] [PMC free article] [PubMed] [Google Scholar]
- 74.Trawicki, M.: Deterministic seirs epidemic model for modeling vital dynamics, vaccinations, and temporary immunity. Mathematics 5(7) (2017)
- 75.Trilla, A., Trilla, G., Daer, C.: The 1918 “spanish flu” in Spain. Clin. Infect. Dis. 47(5), 668–673 (2008) [DOI] [PubMed]
- 76.Tulu, T.W., Tian, B., Wu, Z.: Mathematical modeling, analysis and Markov chain Monte Carlo simulation of ebola epidemics. Res. Phys. 7, 962–968 (2017) [Google Scholar]
- 77.Vermeil, T., Peters, A., Kilpatrick, C., Pires, D., Allegranzi, B., Pittet, D.: Hand hygiene in hospitals: anatomy of a revolution. J. Hosp. Infect. 101(4), 383–392 (2019) [DOI] [PubMed] [Google Scholar]
- 78.Wang, P., Ja, Lu., Zhu, M., Wang, L., Chen, S.: Statistical and network analysis of 1212 covid-19 patients in Henan, China. Int. J. Infect. Dis. 95, 391–398 (2020) [DOI] [PMC free article] [PubMed] [Google Scholar]
- 79.Wells, C.R., Sah, P., Moghadas, S.M., Pandey, A., Shoukat, A., Wang, Y., Wang, Z., Meyers, L.A., Singer, B.H., Galvani, A.P.: Impact of international travel and border control measures on the global spread of the novel 2019 coronavirus outbreak. Proc. Natl. Acad. Sci. U.S.A. 117(13), 7504–7509 (2020) [DOI] [PMC free article] [PubMed] [Google Scholar]
- 80.WHO (2021) World health organization. https://www.who.int/
- 81.Wu, J.T., Leung, K., Leung, G.M.: Nowcasting and forecasting the potential domestic and international spread of the 2019-ncov outbreak originating in wuhan, china: a modelling study. Lancet 395, 689–697 (2020) [DOI] [PMC free article] [PubMed] [Google Scholar]
- 82.Xia, Y., Bjørnstad, O.N., Grenfell, B.T.: Measles metapopulation dynamics: a gravity model for epidemiological coupling and dynamics. Am. Nat. 164(2), 267–281 (2004) [DOI] [PubMed] [Google Scholar]
- 83.Zarocostas, J.: How to fight an infodemic. The Lancet 395(10225), 676 (2020) [DOI] [PMC free article] [PubMed] [Google Scholar]
- 84.Zhao, S., Zhuang, Z., Cao, P., Ran, J., Gao, D., Lou, Y., Yang, L., Cai, Y., Wang, W., He, D., Wang, M.H.: Quantifying the association between domestic travel and the exportation of novel coronavirus (2019-ncov) cases from wuhan, china in 2020: a correlational analysis. J. Travel Med. 27(2), taaa0222 (2020) [DOI] [PMC free article] [PubMed] [Google Scholar]