

Abstract
Iron ions play an important role in our lives. Excessive or lack of iron ion intake leads to many diseases. At the same time, the water environment is easily polluted by these metal ions with the acceleration of industrialization. Therefore, the detection of iron ions in the water environment and the human body is particularly important. In this paper, we prepared a RhB-EDA fluorescent probe by condensing rhodamine B (RhB) with ethylenediamine (EDA) for high recognition of Fe3+. A RhB-EDA molecule itself is colorless and has no fluorescence emission in an alcohol solution. When Fe3+ was added, the lactam ring structure of the fluorescent probe opened, and the UV and fluorescence spectra changed. At the same time, the color of the mixed solution gradually deepened toward pink. Therefore, dual spectral detection and naked-eye observation of Fe3+ were realized. In addition, with the decrease of the pH value and the prolongation of chelating time, the ultraviolet absorbance and fluorescence emission intensity were enhanced and the color of the mixed solution deepened. The RhD-EDA fluorescent probe is simple and accurate and provides good technical support for the detection of Fe3+.
1. Introduction
Water, as the most abundant resource on the earth, plays a vital role in the normal life activities of human beings. However, at present, the pollution of water resources is rather serious all over the world.1,2 Agricultural wastewater, domestic production wastewater, and industrial wastewater have caused a great impact on water quality. Especially, with the development of industrialization, the discharge of wastewater containing heavy metals such as iron ions, mercury ions, and chromium has increased sharply, causing a certain degree of pollution to water resources.3,4 When people drink this contaminated water, excessive intake of heavy metal ions is extremely harmful to the human body, and if it is not properly handled, it will seriously endanger human life and health.5 Therefore, it is necessary to analyze and detect these metal ions accurately. Especially, the detection of Fe3+ is of great importance due to its biological and environmental significance.
Up to now, many analytical methods have been developed to detect metal ions,6−13 such as electrochemical analysis, chemical titration, atomic absorption spectrometry, ultraviolet spectrometry, and fluorescence spectrometry. Among them, fluorescence spectrometry using probe technology stands out due to the advantages of good selectivity, high sensitivity, convenience, and low cost, becoming a hotspot in environmental analysis and biomedical research.3,14−18 In addition, ultraviolet spectroscopy is highly respected because of its high sensitivity and simple operation.19−21 Furthermore, combining the two methods above can effectively improve the detection accuracy. After absorbing visible light or ultraviolet light, fluorescent dyes can convert the absorbed light into visible fluorescence with a longer wavelength and emit it, showing a bright fluorescent color.22−24 Moreover, the properties of fluorescent dyes can be finely adjusted by chemical means to satisfy various application scenarios.25 In addition, near-infrared fluorescent dyes are preferred fluorescent dyes in the field of biological fluorescence sensing.26−28 For the assay of Fe3+, fluorescent dye-based probes have been widely investigated. However, most commercial near-infrared fluorescent dyes have low fluorescence quantum yield and poor photostability. Therefore, it is particularly important to select dyes reasonably for the detection of Fe3+.
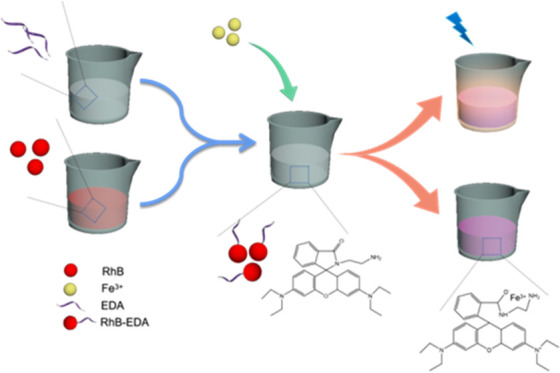
Rhodamine (Rh) dye is a kind of fluorescent dye that can emit dazzling fluorescent color under the irradiation of ultraviolet light with high fluorescence quantum yield, good light stability, low photobleaching degree, easily available material source, and low cost.29−33 Based on these advantages, various rhodamine-based fluorescent probes for the detection of Fe3+ have been investigated. For example, Sun et al. designed a rhodamine–pyridine conjugated spectroscopic probe for Fe3+, which displayed a distinct pale pink colorimetric and “turn-on” fluorescent response.33 Therefore, we focused on developing a rhodamine derivative for the selective sensing of Fe3+. Herein, a novel rhodamine B-ethylenediamine (RhB-EDA) fluorescent probe was prepared by coupling an EDA molecule to RhB via an amidation reaction for high recognition for Fe3+ in the water environment. Under the induction of metal ions, the spirolactam matrix of the fluorescent probe would open the ring, which would cause a change in the fluorescence spectrum. Meanwhile, the color of the mixed solution gradually deepened toward pink. Therefore, dual spectral detection and naked-eye observation of Fe3+ were realized. The RhB-EDA fluorescent probe is simple and accurate and provides a good method for the detection of Fe3+.
2. Results and Discussion
2.1. Characterization of the RhB-EDA Fluorescent Probe
In general, the absorption or reflection intensity of substance molecules to monochromatic radiation in the ultraviolet–visible band range (150–800 nm) is different, so qualitative analysis and molecular structure analysis of various chemical substances can be carried out according to the intensity of absorption and reflection. Therefore, RhB and RhB-EDA were characterized by the ultraviolet spectrum, as shown in Figure 1. It can be clearly observed that pure RhB had an ultraviolet peak bulge between 500 and 600 nm, while RhB-EDA had a very flat peak shape at the same position, indicating that the internal structure of the RhB molecule had changed after the coupling with EDA. In addition, the color of the solution had changed from pink to colorless under sunlight when RhB reacted with EDA to form RhB-EDA. At the same time, the synthesis and structure of RhB-EDA were also characterized and analyzed by the fluorescence spectrum. When the excitation wavelength was 560 nm, RhB had an obvious fluorescence emission peak at about 590 nm, while RhB-EDA had almost no peak, which was basically consistent with the ultraviolet spectrum, further confirming the successful synthesis of RhB-EDA. Mass spectrometry stands out among various analytical methods to verify the composition and structure of compounds because of its high specificity and sensitivity.34−36 Isotope composition, organic structure, and element composition can be analyzed according to the relevant information of mass spectrometry. Therefore, to judge the successful preparation of RhB-EDA again, we characterized it by mass spectrometry using positive ion mode. First, the raw material RhB was tested by mass spectrometry. It can be seen from Figure S1a that the spectral peak of RhB was relatively simple and there was a strong mass spectrum peak at 443.2, while for RhB-EDA, a mass spectrum peak appeared at 485.2, as shown in Figure S1b, which just corresponds to RhB-EDA after calculations.
Figure 1.

(a) Ultraviolet absorption spectra and macroscopic pictures of RHB and RhB-EDA under sunlight; (b) fluorescence emission spectra and gel images of RHB and RhB-EDA under ultraviolet light; (c) FT-IR spectra of RhB and RhB-EDA; and (d) SEM diagram and (e) TEM diagram of RhB-EDA. Photograph courtesy of “Zhihui Qin.” Copyright 2021.
Fourier transform infrared (FT-IR) spectra of raw material RhB and RhB-EDA samples were also measured, as shown in Figure 1c. As for the spectrum of RhB, the characteristic peaks at 1686 and 1644 cm–1 are attributed to the stretching vibrations of the C=O bond in the carboxylic acid group and the C–H bond in the aromatic ring, respectively, and the peak at 1508 cm–1 belongs to the C=C skeleton vibration of aromatic hydrocarbons. Compared with the FT-IR spectrum of RhB, the peak position of the stretching vibration of the C=O bond in RhB-EDA moved to 1678 cm–1, which was related to the condensation of rhodamine and ethylenediamine. The absorption peaks at 785 and 1614 cm–1 could be clearly observed, which could be traced back to the N–H out-of-plane bending vibration mode. In addition, the broad peaks in the range of 2800–3500 cm–1 are related to the stretching vibration of NH, NH2, and C–H groups. Thus, the acquired FT-IR data also demonstrated that RhB-EDA was successfully synthesized. The morphology of RhB-EDA was analyzed and characterized by SEM and TEM images. From Figure 1d, it could be seen that RhB-EDA presented a smooth block shape. In Figure 1e, the TEM image of RhB-EDA showed a thin layer stacked by small particles. By contrast, the cake masses in SEM images may be caused by the stacking of thin layers.
2.2. Recognition of Metal Ions by the RhB-EDA Fluorescent Probe
To obtain the mixed solution of RhB-EDA and metal ions, a small amount of RhB-EDA (1 × 10⁻² mol/L) was diluted to 1 × 10⁻⁴ mol/L with absolute ethyl alcohol and then mixed with various metal solutions (1 × 10⁻³ mol/L) in equal volume. Initially, RhB-EDA in absolute ethanol was colorless. Then, with the addition of Fe3+, an obvious color change in the RhB-EDA solution from colorless to pink could be clearly observed with naked eyes. In addition, the addition of Al3+ would cause a slight color change, which was relatively minor, while other metal ions did not cause a color change, as shown in Figure S2. Subsequently, the selectivity of the probe to Fe3+ was characterized by related optical instruments, as shown in Figure 2. It could be clearly seen that the mixed solution showed strong absorbance near 560 nm only when Fe3+ existed. However, in the presence of Al3+, the solution showed a weak response, while in the presence of other ions, there was almost no absorption (Figure 2a). In addition, similar situations could be clearly seen from the fluorescence spectra of the mixed solution (Figure 2c,d). Different excitation wavelengths were used for excitation, and only when Fe3+ existed, the mixed solution showed strong fluorescence near 590 nm, but the luminous intensity was different. Obviously, the fluorescence was stronger at an excitation wavelength of 560 nm, which corresponded to the ultraviolet spectrum. It could be clearly seen from Figure 2b that the fluorescence excitation spectrum of the mixed solution at 560 nm and the back-scan spectrum at 590 nm were basically mirror images. To sum up these results, it can be concluded that RhB-EDA has good selectivity for Fe3+.
Figure 2.

(a) Ultraviolet spectra of various cations mixed with RhB-EDA; (b) fluorescence excitation and emission spectrum of RhB-EDA; and fluorescence emission spectra of RhB-EDA under excitation of (c) 550 nm and (d) 560 nm, respectively.
To further study the sensing characteristics of RhB-EDA, the ion competition experiment was carried out in this work. In the presence of Fe3+, metal ions were mixed with the RhB-EDA solution and their absorbance at 560 nm was tested. To increase the reliability of the experiment, a blank control group was set up, and metal ions with the same parameters were added into the RhB-EDA solution without Fe3+, as shown in Figure 3a, in which the black column indicated the absorbance when different metal ions are mixed with RhB-EDA alone, and the red column indicated the absorbance when different metal ions are mixed with RhB-EDA in the presence of Fe3+ and various metal ions. It can be seen that in the presence of Fe3+, ultraviolet absorption intensity was obviously higher than that of the control group, and the absorbance of other coexisting ions at 560 nm was obviously weaker. From Figure 3c, it can also be clearly seen that in the presence of Fe3+, the color of the mixed solution of other metal ions and the RhB-EDA solution was the same, but the color was lighter compared with the mixed solution of the Fe3+ solution added again under the same conditions. Therefore, the interference of other coexisting ions on Fe3+ could be neglected. To verify the interaction mechanism between Fe3+ and the RhB-EDA solution, the equimolar continuous change method (Job’s method) was used. The method comprises the following steps: at experimental conditions, a series of solutions with continuously changing concentration ratios (CM/CR) were prepared while keeping the total concentration (q = CM + CR) of the solutions unchanged. Then, the absorbance was measured using an ultraviolet spectrophotometer, and the abscissa CM/CR corresponding to the highest point is the composition ratio between the two complexes. As shown in Figure 3b, the Job diagram was established using the change of absorbance intensity at 560 nm as a function of the mole fraction of Fe3+ and the RhB-EDA solution. It could be clearly seen that the maximum absorption intensity appeared when the molar fraction was 0.5, which indicated that a complex with a stoichiometric ratio of 1:1 was formed between Fe3+ and RhB-EDA. As we all know, a proper coordination structure and the ionic radius are related to the formation of the complex. In addition, the coordination of RhB-EDA with Fe3+ led to the opening of the amide spiral ring, resulting in the change of absorbance, which had been reported in previous studies,37 and the possible bonding mechanism is shown in Figure 3d.
Figure 3.

(a) Competitive analysis of Fe3+and other metal ions; (b) Job diagram of RhB-EDA and Fe3+; (c) macrographs of the RhB-EDA mixed solution in the presence of Fe3+ and different metal ions; and (d) mechanism diagram of the RHB-EDA fluorescence probe. Photograph courtesy of Zhihui Qin. Copyright 2021.
2.3. Effect of Different Factors on the RhB-EDA Fluorescent Probe for Fe3+
First, the effects of Fe3+ concentrations on the determination of the RhB-EDA fluorescent probe were studied, as shown in Figure 4. From the ultraviolet spectrum in Figure 4a, it could be clearly seen that RhB-EDA showed very good sensitivity to Fe3+. With the increase of Fe3+ concentration from 4 × 10⁻⁵ to 4 × 10⁻³ mol/L, the ultraviolet absorption increased continuously. The maximum ultraviolet absorption intensity at 560 nm was a function of Fe3+ concentration, and it was found that it had an approximate linear response in the range of 40–900 μM, as shown in Figure 4b. The working effect for the detection of Fe3+ in this work is relatively excellent compared with the detection method of Fe3+ reported in the previous literature.38−41 At the same time, the fluorescence spectrum was tested by a fluorescence photometer. It could be seen from Figure 4c that the change of concentration also caused the change of the fluorescence spectrum. Under an excitation wavelength of 560 nm, the fluorescence intensity increased with the increase of Fe3+ concentration until 2 × 10⁻³ mol/L. When the Fe3+ concentration was 4 × 10⁻³ mol/L, the decrease of fluorescence might be attributed to the fact that the dark color of the mixed solution caused the light masking or the high Fe3+ concentration quenched the emission of fluorescence.42,43 The maximum fluorescence emission peak at 590 nm as a function of Fe3+ concentration in the mixed solution is shown in Figure 4d. It could be observed that there was an approximate linear relationship in the range of 40–1000 μM. When the excitation wavelength was 550 nm, there was a similar phenomenon, as shown in Figure S3a,b. These phenomena could also be observed with naked eyes, as shown in Figure S3c. Macroscopic photos of RhB-EDA and Fe3+ solutions with different concentrations taken in sunlight showed that the color of the mixed solution became more and more obvious with the increase of Fe3+ concentration. At the same time, the gel imaging picture was taken by a gel imager, which was consistent with the macroscopic picture and related spectral information under sunlight. Subsequently, the RhB-EDA fluorescent probe for the detection of the Fe3+ solution with different anions was characterized in the same way, as shown in Figure S4. It could be seen that the mixed solution of FeCl3 and RhB-EDA showed similar phenomena with the Fe(NO3)3 and RhB-EDA mixed solution. With the increase of Fe3+ concentration, the UV absorbance and fluorescence intensity gradually increased. At the same time, the macroscopic picture under sunlight and the gel imaging picture taken by the gel imager also showed similar phenomena, which was consistent with the spectrogram.
Figure 4.

(a) Ultraviolet spectrum of the RhB-EDA solution mixed with different Fe(NO3)3 concentrations; (b) fluorescence intensity changes (560 nm) as a function of Fe3+ concentration; (c) fluorescence spectra of the RhB-EDA solution mixed with the Fe(NO3)3 solution with different concentrations; and (d) fluorescence intensity changes (590 nm) as a function of Fe3+ concentration.
Then, the influence of chelating time on the RhB-EDA fluorescent probe was explored. At first, the RhB-EDA solution with a concentration of 1 × 10⁻⁴ mol/L and the Fe(NO3)3 solution with a concentration of 1 × 10⁻³ mol/L were mixed in equal volume, and the change of ultraviolet absorbance was monitored with time. From Figure 5a,b, it could be seen that the ultraviolet absorption intensity of the mixed solution increased with the increase of time and reached equilibrium after 280 min. Fluorescence spectroscopy (Figure 5c,d) showed that the fluorescence intensity of the mixed solution increased with the increase of chelating time. The reason why the end time of fluorescence intensity enhancement is different from that of ultraviolet absorbance enhancement is that the darker color of the mixture has a certain quenching effect on fluorescence emission with the increase of time.44 At the same time, the Fe(NO3)3 solution was changed to the FeCl3 solution with the same concentration, and ultraviolet appearance was carried out under the same test conditions, as shown in Figure S5a,b. It was found that the ultraviolet absorption intensity of the mixed solution also increased with the increase of time. In Figure S5c,d, the fluorescence intensity of the mixed solution increased with the increase of time, regardless of the excitation wavelength of 550 or 560 nm, until 140 min. By comparison, it was speculated that the change of ultraviolet absorption intensity and fluorescence emission intensity of RhB-EDA was related to the chelation of the positive ion Fe3+. To further explore whether the related changes of RhB-EDA were related to cations Fe3+ or anions, the ultraviolet absorption and fluorescence emission of anions NO3– and Cl– were also tested. As it had been explored that cationic Na+ had little effect on the ultraviolet absorption and fluorescence emission of the RhB-EDA probe, NaNO3 and the NaCl solution were mixed with the RhB-EDA solution in equal volume for characterization. It could be clearly seen from Figure S6 that there was no peak at the characteristic peak of the RhB-EDA fluorescence probe in both the ultraviolet absorption spectrum and the fluorescence emission spectrum. Therefore, the influence of anions NO3– and Cl– on the sensing system could be well eliminated.
Figure 5.

(a) Ultraviolet absorption intensity of the RhB-EDA and Fe(NO3)3 mixed solution under different reaction times; (b) maximum absorbance intensity changes (560 nm) as a function of reaction time; and fluorescence spectra of the mixture of Fe(NO3)3 and RhB-EDA varied with the reaction time at excitation wavelengths of (c) 560 and (d) 550 nm.
The pH probe based on the fluorescence response signal has the advantages of convenient operation and high sensitivity and has been regarded as one of the powerful detection tools.45−47 Thus, the influence of the pH value on the RhB-EDA fluorescence probe was studied, as shown in Figure 6. When pH decreased from 3.92 to 3.36, 1.87, and 1.39, the UV absorption and fluorescence emission intensity gradually increased, while when pH was greater than 3.92, there were hardly any peaks in UV and fluorescence spectra. Under sunlight, when the pH value was less than 3.92, the color of the solution obviously changed from colorless to pink, while when the pH value was greater than 3.92, the color of the solution was still colorless, which was consistent with the spectrogram. It had been reported in the previous literature that rhodamine dye was a strong fluorescent structure with a special spiro ring, which had two interconversion structures: an opened ring and a closed ring under different temperatures, metal ions, and pH conditions.48−52 The change of color and spectrum here can be attributed to the ring-opening reaction of spirolactam in the rhodamine structure or the protonation reaction of amine functional groups and similar groups under acidic conditions.
Figure 6.

(a) Sensing mechanism, (b) ultraviolet–visible absorption spectrum, (c) macroscopic pictures under sunlight and ultraviolet light, and (d) fluorescence emission spectrum of RhB-EDA at different pH values. Photograph courtesy of Zhihui Qin. Copyright 2021.
3. Conclusions
In summary, we presented the design and synthesis of a rhodamine B-ethylenediamine (RhB-EDA) fluorescent probe by coupling an EDA molecule to RhB via an amidation reaction. The RhB-EDA probe showed excellent labeling and monitoring of Fe3+ with high selectivity and sensitivity without the interference of other cations and anions. The probe displayed obvious naked-eye color changes because the lactam ring structure of the fluorescent probe was opened when iron ions were added, which can be used as a preliminary criterion. More importantly, double detections on iron ions can be realized based on the changes of the ultraviolet and fluorescence spectra. Under optimal conditions, the fluorescence intensity was linearly proportional to the concentrations of Fe3+ in the range of 40–900 μM. In addition, the acid–base test found that both the fluorescence intensity and ultraviolet absorption gradually decreased with the increase of pH, which was also related to the lactam ring structure of the fluorescent probe, and this phenomenon can play a certain role in judging the acid–base of solution. Therefore, the RhD-EDA fluorescence probe platform will play an important role in human production and life in the future.
4. Experimental Section
4.1. Materials
Rhodamine B (RhB) and sodium hydroxide were obtained from Tianjin Aladdin Reagent Factory. Ethylenediamine (EDA) and hydrochloric acid were purchased from Tianjin No. 1 Chemical Reagent Factory and Yongfei Chemical Plant in Hebei Province, respectively. Metal ion salts such as potassium nitrate, calcium nitrate, sodium nitrate, magnesium nitrate, zinc nitrate, iron nitrate, copper nitrate, manganese nitrate, mercury nitrate, aluminum nitrate, nickel nitrate, silver nitrate, ferric chloride, etc., were provided by Sigma-Aldrich.
4.2. Preparation of RhB-EDA
First, 0.048g of RhB was added into 30 mL of absolute ethanol to form a uniform RhB ethanol solution. Then, 2 mL of EDA was slowly added dropwise into the mixed solution, and the mixture was continuously stirred at a constant speed and condensed and refluxed for 5 h until the red color of RhB disappeared. After the reaction was completed, liquid samples were collected, and some residual absolute ethanol was removed by evaporation. Finally, deionized water was added to the above samples to wash using a centrifuge many times to remove residual raw materials, and the final samples can be obtained by drying in a drying oven.
4.3. Characterization
A small amount of freeze-dried RhB-EDA samples were compacted and coated on the conductive adhesive tape with toothpicks, and the surface morphology of the samples was observed by a field emission scanning electron microscope (SEM, S-4800II, Hitachi, Japan). A transmission electron microscope (TEM, HT7700, Hitachi High-Technologies Corporation, Japan) was used to characterize the morphology of the samples. Infrared spectra of the samples were recorded using a Fourier infrared spectrometer (Nicolet Corporation) by the KBr sheet method, and the structure and composition of the sample were analyzed according to the spectrum. The UV–vis spectrum and the fluorescence spectrum of the liquid samples were obtained using a Shimadzu UV-2550 system (Shimadzu Corporation, Japan). To avoid the influence of different thicknesses on spectral measurement, a 1 cm quartz cell was used in this experiment. In addition, the related samples were tested using a gel imager, which made the observation more intuitive and rapid, playing a certain supporting role in the detection results.
4.4. Detection of Metal Ions by RhB-EDA
First, 0.01 mol/L RhB-EDA mother liquor was prepared with absolute ethanol solvent, and a 0.01 mol/L metal salt solution was prepared with deionized water. In the test, a small amount of RhB-EDA (0.01 mol/L) was taken, diluted to 1 × 10⁻⁴ mol/L, mixed with different metal salts (1 × 10⁻³ mol/L) and left to react, and then transferred to a 1 cm quartz pool for detection of ultraviolet and fluorescence spectra. Different concentrations of iron ions were detected and analyzed using the same method.
Acknowledgments
The authors greatly appreciate the financial support from the National Natural Science Foundation of China (Nos. 21872119, 22072127, and 22102139), the Natural Science Foundation of Hebei Province (Nos. B2021203001, E2021203236, and B2021203016), the Talent Engineering Training Funding Project of Hebei Province (No. A201905004), and the Special Project for Local Science and Technology Development Guided by the Central Government of China (No. 216Z1301G).
Supporting Information Available
The Supporting Information is available free of charge at https://pubs.acs.org/doi/10.1021/acsomega.1c04206.
Mass spectrometric characterization; macroscopic photos and gel imaging pictures; fluorescence spectra; and ultraviolet absorption and fluorescence spectra with the reaction time (PDF)
The authors declare no competing financial interest.
Supplementary Material
References
- Mittal H.; Babu R.; Dabbawala A. A.; Stephen S.; Alhassan S. M. Zeolite-Y Incorporated Karaya Gum Hydrogel Composites for Highly Effective Removal of Cationic Dyes. Colloid Surf., A 2020, 586, 124161 10.1016/j.colsurfa.2019.124161. [DOI] [Google Scholar]
- Shen W.; An Q. D.; Xiao Z. Y.; Zhai S. R.; Hao J. A.; Tong Y. Alginate Modified Graphitic Carbon Nitride Composite Hydrogels for Efficient Removal of Pb(Ii), Ni(Ii) and Cu(Ii) from Water. Int. J. Biol. Macromol. 2020, 148, 1298–1306. 10.1016/j.ijbiomac.2019.10.105. [DOI] [PubMed] [Google Scholar]
- Park S-H.; Kwon N.; Lee J-H.; Yoon J.; Shin I. Synthetic Ratiometric Fluorescent Probes for Detection of Ions. Chem. Soc. Rev. 2020, 49, 143–179. 10.1039/C9CS00243J. [DOI] [PubMed] [Google Scholar]
- Udhayakumari D. Detection of Toxic Fluoride Ion Via Chromogenic and Fluorogenic Sensing. A Comprehensive Review of the Year 2015-2019. Spectrochim. Acta, Part A 2020, 228, 117817 10.1016/j.saa.2019.117817. [DOI] [PubMed] [Google Scholar]
- Yu X.; Zhu P.; Chen Y.; Wang J.; An Z. Study on Preparation of Modified Nano-TiO2 and Its Application in Photocatalytic Treatment Wastewater Containing Cd2+. Adv. Mater. Res. 2012, 347, 733–737. 10.4028/www.scientific.net/AMR.446-449.733. [DOI] [Google Scholar]
- Hwang K.; Mou Q.; Lake R. J.; Xiong M.; Holland B.; Lu Y. Metal-Dependent Dnazymes for the Quantitative Detection of Metal Ions in Living Cells: Recent Progress, Current Challenges, and Latest Results on Fret Ratiometric Sensors. Inorg. Chem. 2019, 58, 13696–13708. 10.1021/acs.inorgchem.9b01280. [DOI] [PMC free article] [PubMed] [Google Scholar]
- Yi W.; He Z.; Fei J.; He X. Sensitive Electrochemical Sensor Based on Poly(L-Glutamic Acid)/Graphene Oxide Composite Material for Simultaneous Detection of Heavy Metal Ions. RSC Adv. 2019, 9, 17325–17334. 10.1039/C9RA01891C. [DOI] [PMC free article] [PubMed] [Google Scholar]
- Balusamy B.; Senthamizhan A.; Uyar T. Functionalized Electrospun Nanofibers as a Versatile Platform for Colorimetric Detection of Heavy Metal Ions in Water: A Review. Materials 2020, 13, 2421 10.3390/ma13102421. [DOI] [PMC free article] [PubMed] [Google Scholar]
- Roxby D. N.; Rivy H.; Gong C.; Gong X.; Yuan Z.; Chang G-E.; Chen Y-C. Microalgae Living Sensor for Metal Ion Detection with Nanocavity-Enhanced Photoelectrochemistry. Biosens. Bioelectron. 2020, 165, 112420 10.1016/j.bios.2020.112420. [DOI] [PubMed] [Google Scholar]
- Sharma S.; Jaiswal A.; Uttam K. N. Colorimetric and Surface Enhanced Raman Scattering (Sers) Detection of Metal Ions in Aqueous Medium Using Sensitive, Robust and Novel Pectin Functionalized Silver Nanoparticles. Anal. Lett. 2020, 53, 2355–2378. 10.1080/00032719.2020.1743715. [DOI] [Google Scholar]
- Sun Y.; Xu X.; Zhao Y.; Tan H.; Li Y.; Du J. Luminescent Metal Organic Frameworks-Based Chemiluminescence Resonance Energy Transfer Platform for Turn-on Detection of Fluoride Ion. Talanta 2020, 209, 120582 10.1016/j.talanta.2019.120582. [DOI] [PubMed] [Google Scholar]
- Wang X.; Qi Y.; Shen Y.; Yuan Y.; Zhang L.; Zhang C.; Sun Y. A Ratiometric Electrochemical Sensor for Simultaneous Detection of Multiple Heavy Metal Ions Based on Ferrocene-Functionalized Metal-Organic Framework. Sens. Actuators, B 2020, 310, 127756 10.1016/j.snb.2020.127756. [DOI] [Google Scholar]
- Zhang Y.; Feng N.; Zhou S.; Xin X. Fluorescent nanocomposites based on gold nanoclusters for metal ion detection and white light emitting diodes. Nanoscale 2021, 13, 4140–4150. 10.1039/D0NR09141C. [DOI] [PubMed] [Google Scholar]
- Shen J.; Wang Z.; Sun D.; Xia C.; Yuan S.; Sun P.; Xin X. pH-responsive nanovesicles with enhanced emission co-assembled by Ag (I) nanoclusters and polyethyleneimine as a superior sensor for Al3+. ACS Appl. Mater. Interfaces 2018, 10, 3955–3963. 10.1021/acsami.7b16316. [DOI] [PubMed] [Google Scholar]
- Shen J.; Xiao Q.; Sun P.; Feng J.; Xin X.; Yu Y.; Qi W. Self-Assembled Chiral Phosphorescent Microflowers from Au Nanoclusters with Dual-Mode pH Sensing and Information Encryption. ACS Nano 2021, 15, 4947–4955. 10.1021/acsnano.0c09766. [DOI] [PubMed] [Google Scholar]
- Alam P.; He W.; Leung N. L. C.; Ma C.; Kwok R. T. K.; Lam J. W. Y.; Sung H. H. Y.; Williams I. D.; Wong K. S.; Tang B. Z. Red Aie-Active Fluorescent Probes with Tunable Organelle-Specific Targeting. Adv. Funct. Mater. 2020, 30, 1909268 10.1002/adfm.201909268. [DOI] [Google Scholar]
- Li W.; Liu Z.; Fang B.; Jin M.; Tian Y. Two-Photon Fluorescent Zn2+ Probe for Ratiometric Imaging and Biosensing of Zn2+ in Living Cells and Larval Zebrafish. Biosens. Bioelectron. 2020, 148, 111666 10.1016/j.bios.2019.111666. [DOI] [PubMed] [Google Scholar]
- Zhang J.; Wang N.; Ji X.; Tao Y.; Wang J.; Zhao W. Bodipy-based Fluorescent Probes for Biothiols. Chem. -Eur. J. 2020, 26, 4172–4192. 10.1002/chem.201904470. [DOI] [PubMed] [Google Scholar]
- Sun P.; Wang Z.; Bi Y.; Sun D.; Zhao T.; Zhao F.; Wang W.; Xin X. Self-assembly-driven aggregation-induced emission of silver nanoclusters for light conversion and temperature sensing. ACS Appl. Nano Mater. 2020, 3, 2038–2046. 10.1021/acsanm.0c00135. [DOI] [Google Scholar]
- Sun P.; Zhang S.; Xiang Z.; Zhao T.; Sun D.; Zhang G.; Chen M.; Guo K.; Xin X. Photoluminescent sensing vesicle platform self-assembled by polyoxometalate and ionic-liquid-type imidazolium gemini surfactants for the detection of Cr3+ and MnO4– ions. J. Colloid Inter. Sci. 2019, 547, 60–68. 10.1016/j.jcis.2019.03.085. [DOI] [PubMed] [Google Scholar]
- Jiang T.; Wang K.; Guo T.; Wu X.; Zhang G. Fabrication of Z-Scheme MoO3/Bi2O4 Heterojunction Photocatalyst with Enhanced Photocatalytic Performance under Visible Light Irradiation. Chin. J. Catal. 2020, 41, 161–169. 10.1016/S1872-2067(19)63391-7. [DOI] [Google Scholar]
- Resch-Genger U.; Grabolle M.; Cavaliere-Jaricot S.; Nitschke R.; Nann T. Quantum Dots Versus Organic Dyes as Fluorescent Labels. Nat. Methods 2008, 5, 763–775. 10.1038/nmeth.1248. [DOI] [PubMed] [Google Scholar]
- Ulrich G.; Ziessel R.; Harriman A. The Chemistry of Fluorescent Bodipy Dyes: Versatility Unsurpassed. Angew. Chem., Int. Ed. 2008, 47, 1184–1201. 10.1002/anie.200702070. [DOI] [PubMed] [Google Scholar]
- Allard C.; Schu L.; Fossard F.; Recher G.; Nascimento R.; Flahaut E.; Loiseau A.; Desjardins P.; Martel R.; Gaufres E. Confinement of Dyes inside Boron Nitride Nanotubes: Photostable and Shifted Fluorescence Down to the near Infrared. Adv. Mater. 2020, 32, 2001429 10.1002/adma.202001429. [DOI] [PubMed] [Google Scholar]
- Grimm J. B.; Brown T. A.; Tkachuk A. N.; Lavis L. D. General Synthetic Method for Si-Fluoresceins and Si-Rhodamines. ACS Cent. Sci. 2017, 3, 975–985. 10.1021/acscentsci.7b00247. [DOI] [PMC free article] [PubMed] [Google Scholar]
- Ni Y.; Wu J. Far-Red and Near Infrared Bodipy Dyes: Synthesis and Applications for Fluorescent Ph Probes and Bio-Imaging. Org. Biomol. Chem. 2014, 12, 3774–3791. 10.1039/c3ob42554a. [DOI] [PubMed] [Google Scholar]
- Umezawa K.; Nakamura Y.; Makino H.; Citterio D.; Suzuki K. Bright, Color-Tunable Fluorescent Dyes in the Visible-near-Infrared Region. J. Am. Chem. Soc. 2008, 130, 1550–1551. 10.1021/ja077756j. [DOI] [PubMed] [Google Scholar]
- Grimm J. B.; Tkachuk A. N.; Xie L.; Choi H.; Mohar B.; Falco N.; Schaefer K.; Patel R.; Zheng Q.; Liu Z.; Lippincott-Schwartz J.; Brown T. A.; Lavis L. D. A General Method to Optimize and Functionalize Red-Shifted Rhodamine Dyes. Nat. Methods 2020, 17, 815–821. 10.1038/s41592-020-0909-6. [DOI] [PMC free article] [PubMed] [Google Scholar]
- Beija M.; Afonso C. A. M.; Martinho J. M. G. Synthesis and Applications of Rhodamine Derivatives as Fluorescent Probes. Chem. Soc. Rev. 2009, 38, 2410–2433. 10.1039/b901612k. [DOI] [PubMed] [Google Scholar]
- Gong J.; Liu C.; Jiao X.; He S.; Zhao L.; Zeng X. A near-Infrared Fluorescent Probe Based on a Novel Rectilinearly Pi-Extended Rhodamine Derivative and Its Applications. J. Mater. Chem. B 2020, 8, 2343–2349. 10.1039/C9TB02739D. [DOI] [PubMed] [Google Scholar]
- Gu T.; Mo S.; Mu Y.; Huang X.; Hu L. Detection of Endogenous Hydrogen Peroxide in Living Cells with Para-Nitrophenyl Oxoacetyl Rhodamine as Turn-on Mitochondria-Targeted Fluorescent Probe. Sens. Actuators, B 2020, 309, 127731 10.1016/j.snb.2020.127731. [DOI] [Google Scholar]
- Numasawa K.; Hanaoka K.; Ikeno T.; Echizen H.; Ishikawa T.; Morimoto M.; Komatsu T.; Ueno T.; Ikegaya Y.; Nagano T.; Urano Y. A Cytosolically Localized Far-Red to near-Infrared Rhodamine-Based Fluorescent Probe for Calcium Ions. Analyst 2020, 145, 7736–7740. 10.1039/D0AN01739F. [DOI] [PubMed] [Google Scholar]
- Shellaiah M.; Thirumalaivasan N.; Aazaad B.; Awasthi K.; Sun K. W.; Wu S-P.; Lin M-C.; Ohta N. Novel Rhodamine Probe for Colorimetric and Fluorescent Detection of Fe3+ Ions in Aqueous Media with Cellular Imaging. Spectrochim. Acta, Part A 2020, 242, 118757 10.1016/j.saa.2020.118757. [DOI] [PubMed] [Google Scholar]
- Mirza U. A.; Chait B. T. Effects of Anions on the Positive Ion Electrospray Ionization Mass Spectra of Peptides and Proteins. Anal. Chem. 1994, 66, 2898–2904. 10.1021/ac00090a017. [DOI] [PubMed] [Google Scholar]
- Tabb D. L.; MacCoss M. J.; Wu C. C.; Anderson S. D.; Yates J. R. 3rd. Similarity among Tandem Mass Spectra from Proteomic Experiments: Detection, Significance, and Utility. Anal. Chem. 2003, 75, 2470–2477. 10.1021/ac026424o. [DOI] [PubMed] [Google Scholar]
- Escobar E. E.; King D. T.; Serrano-Negron J. E.; Alteen M. G.; Vocadlo D. J.; Brodbelt J. S. Precision Mapping of O-Linked N-Acetylglucosamine Sites in Proteins Using Ultraviolet Photodissociation Mass Spectrometry. J. Am. Chem. Soc. 2020, 142, 11569–11577. 10.1021/jacs.0c04710. [DOI] [PMC free article] [PubMed] [Google Scholar]
- Kim H. N.; Lee M. H.; Kim H. J.; Kim J. S.; Yoon J. A New Trend in Rhodamine-Based Chemosensors: Application of Spirolactam Ring-Opening to Sensing Ions. Chem. Soc. Rev. 2008, 37, 1465–1472. 10.1039/b802497a. [DOI] [PubMed] [Google Scholar]
- Weerasinghe A. J.; Abebe F. A.; Sinn E. Rhodamine Based Turn-on Dual Sensor for Fe3+ and Cu2+. Tetrahedron Lett. 2011, 52, 5648–5651. 10.1016/j.tetlet.2011.08.092. [DOI] [Google Scholar]
- Singh M.; Senthilkumar S.; Rajput S.; Neogi S. Pore-Functionalized and Hydrolytically Robust Cd(II)-Metal-Organic Framework for Highly Selective, Multicyclic Co(2) Adsorption and Fast-Responsive Luminescent Monitoring of Fe(III) and Cr(Vi) Ions with Notable Sensitivity and Reusability. Inorg. Chem. 2020, 59, 3012–3025. 10.1021/acs.inorgchem.9b03368. [DOI] [PubMed] [Google Scholar]
- Wang L.; Li W.; Zhi W.; Huang Y.; Han J.; Wang Y.; Ren Y.; Ni L. A New Coumarin Schiff Based Fluorescent-Colorimetric Chemosensor for Dual Monitoring of Zn2+ and Fe3+ in Different Solutions: An Application to Bio-Imaging. Sens. Actuators, B 2018, 260, 243–254. 10.1016/j.snb.2017.12.200. [DOI] [Google Scholar]
- Liu Q.; Niu X.; Xie K.; Yan Y.; Ren B.; Liu R.; Li Y.; Li L. Fluorescent Carbon Dots as Nanosensors for Monitoring and Imaging Fe3+ and [HPO4] (2-) Ions. ACS Appl. Nano Mater. 2021, 4, 190–197. 10.1021/acsanm.0c02515. [DOI] [Google Scholar]
- Weng G.; Thanneeru S.; He J. Dynamic Coordination of Eu-Iminodiacetate to Control Fluorochromic Response of Polymer Hydrogels to Multistimuli. Adv. Mater. 2018, 30, 1706526 10.1002/adma.201706526. [DOI] [PubMed] [Google Scholar]
- Xie Y.; Huang W.; Zheng B.; Li S.; Liu Q.; Chen Z.; Mai W.; Fu R.; Wu D. All-in-One Porous Polymer Adsorbents with Excellent Environmental Chemosensory Responsivity, Visual Detectivity, Superfast Adsorption, and Easy Regeneration. Adv. Mater. 2019, 31, 1900104 10.1002/adma.201900104. [DOI] [PubMed] [Google Scholar]
- He Y-G.; Shi S-Y.; Liu N.; Ding Y-S.; Yin J.; Wu Z-Q. Tetraphenylethene-Functionalized Conjugated Helical Poly(Phenyl Isocyanide) with Tunable Light Emission, Assembly Morphology, and Specific Applications. Macromolecules 2016, 49, 48–58. 10.1021/acs.macromol.5b02412. [DOI] [Google Scholar]
- Lan R.; Gao Y.; Shen C.; Huang R.; Bao J.; Zhang Z.; Wang Q.; Zhang L.; Yang H. Humidity-Responsive Liquid Crystalline Network Actuator Showing Synergistic Fluorescence Color Change Enabled by Aggregation Induced Emission Luminogen. Adv. Funct. Mater. 2021, 31, 2010578 10.1002/adfm.202010578. [DOI] [Google Scholar]
- Jiang Y.; Hadjichristidis N. Diels-Alder Polymer Networks with Temperature-Reversible Cross-Linking-Induced Emission. Angew. Chem., Int. Ed. 2021, 60, 331–337. 10.1002/anie.202013183. [DOI] [PMC free article] [PubMed] [Google Scholar]
- Li Z.; Liu P.; Ji X.; Gong J.; Hu Y.; Wu W.; Wang X.; Peng H-Q.; Kwok R. T. K.; Lam J. W. Y.; Lu J.; Tang B. Z. Bioinspired Simultaneous Changes in Fluorescence Color, Brightness, and Shape of Hydrogels Enabled by Aiegens. Adv. Mater. 2020, 32, 1906493 10.1002/adma.201906493. [DOI] [PubMed] [Google Scholar]
- Kenmoku S.; Urano Y.; Kojima H.; Nagano T. Development of a Highly Specific Rhodamine-Based Fluorescence Probe for Hypochlorous Acid and Its Application to Real-Time Imaging of Phagocytosis. J. Am. Chem. Soc. 2007, 129, 7313–7318. 10.1021/ja068740g. [DOI] [PubMed] [Google Scholar]
- Xiang Y.; Tong A.; Jin P.; Ju Y. New Fluorescent Rhodamine Hydrazone Chemosensor for Cu(II) with High Selectivity and Sensitivity. Org. Lett. 2006, 8, 2863–2866. 10.1021/ol0610340. [DOI] [PubMed] [Google Scholar]
- Geng R.; Chang R.; Zou Q.; Shen G.; Jiao T.; Yan X. Biomimetic Nanozymes Based on Coassembly of Amino Acid and Hemin for Catalytic Oxidation and Sensing of Biomolecules. Small 2021, 17, 2008114 10.1002/smll.202008114. [DOI] [PubMed] [Google Scholar]
- Bai J.; Wang R.; Ju M.; Zhou J.; Zhang L.; Jiao T. Facile preparation and high performance of wearable strain sensors based on ionically cross-linked composite hydrogels. Sci. China. Mater. 2021, 64, 942–952. 10.1007/s40843-020-1507-0. [DOI] [Google Scholar]
- Wang R.; Yan X.; Ge B.; Zhou J.; Wang M.; Zhang L.; Jiao T. Facile Preparation of Self-Assembled Black Phosphorus-Dye Composite Films for Chemical Gas Sensors and Surface-Enhanced Raman Scattering Performances. ACS Sustainable Chem. Eng. 2020, 8, 4521–4536. 10.1021/acssuschemeng.9b07840. [DOI] [Google Scholar]
Associated Data
This section collects any data citations, data availability statements, or supplementary materials included in this article.