

Abstract

Demand has arisen for developing new azole antifungal agents with the growth of the resistant rate of infective fungal species to current azole antifungals in recent years. Accordingly, the present study reports the synthesis of novel fluconazole (FLC) analogues bearing urea functionality that led to discovering new azole agents with promising antifungal activities. In particular, compounds 8b and 8c displayed broad-spectrum activity and superior in vitro antifungal capabilities compared to the standard drug FLC against sensitive and resistant Candida albicans (C. albicans). The highly active compounds 8b and 8c had potent antibiofilm properties against FLC-resistant C. albicans species. Additionally, these compounds exhibited very low toxicity for three mammalian cell lines and human red blood cells. Time-kill studies revealed that our synthesized compounds displayed a fungicidal mechanism toward fungal growth. Furthermore, a density functional theory (DFT) calculation, additional docking, and independent gradient model (IGM) studies were performed to analyze their structure–activity relationship (SAR) and to assess the molecular interactions in the related target protein. Finally, in vivo results represented a significant reduction in the tissue fungal burden and improvements in the survival rate in a mice model of systemic candidiasis along with in vitro and in silico studies, demonstrating the therapeutic efficiency of compounds 8b and 8c as novel leads for candidiasis drug discovery.
Introduction
Over the past decades, morbidity and associated mortality caused by invasive fungal infections (IFIs) have been dramatically increasing worldwide, presenting a momentous threat to human health and life.1,2 Accumulative studies have indicated that Candida (albicans and non-albicans) and Aspergillus (Asp.) species account for most severe clinical fungal infections.3−5 The rise in the number of immunocompromised patients highly vulnerable to IFIs via either clinical treatment in intensive care units or the use of immunosuppressive drugs, along with the increasing prevalence of drug-resistant fungi species, poses a significant concern. Thus, the development of novel antifungal agents with low resistance and high efficacy is a priority.6,7
Among the current antifungal drugs, the azole family has the highest number of developed drugs in the clinic.8 Most current antifungal agents, such as fluconazole (FLC), are becoming less effective with emerging resistant fungal pathogens. Critical molecular mechanisms that convey resistance to azoles are point mutations in the CYP51 structure and fungal biofilm formation.9,10 Therefore, improvement of known drug structures to overcome point mutations and biofilm formation is among the important antifungal drug design strategies.11 Due to the superiority of azoles relative to other antifungal agents regarding a broader spectrum of activity, low costs, desirable pharmacokinetic, and a safety profile, these compounds are now flagship agents for combating severe resistant fungal infections.12,13 Thus, development of new azole antifungal agents with their effect on resistant IFIs is urgent and challenging.
Various studies have reported improving the current azole scaffolds by replacing one triazole ring of FLC with other heterocycles or moieties that resulted in a new azole generation, including voriconazole (VOR), albaconazole (ALB), ravuconazole (RAV), and embeconazole (EMB) (Figure 1), to help overcome the resistance and deficiencies of other azoles. The aza-heterocycles like oxadiazole, triazole, isoxazole, tetrazole, or thiazolidinedione are also of great interest to design new agents via hybridization with the main pharmacophore of azoles.14−18 So far, this new technique for novel azole antifungal drug discovery has seen great improvements in medicinal chemistry studies after introducing the typical structure–activity relationship (SAR) of the azole family8,19 (Figure 2).
Figure 1.

New generation of azole antifungals based on the fluconazole structure.
Figure 2.

Design of the target compounds 8a–r via scaffold hybridization based on typical SAR models of azole antifungals.
Inspired by the promise shown by newly approved FLC analogous structures, a series of novel FLC derivatives bearing urea functionality were synthesized accordingly (Figure 3 and Scheme 1). Our experimental design was based on and taken from recent valuable studies in the field, including references (14, 17, 18, 48), and (49). Thus, all of the synthesis compounds were evaluated for their antifungal effects against 15 azole-sensitive ones: Candida albicans, non-albicans Candida, Aspergillus, and dermatophyte species by in vitro minimum inhibitory concentration (MIC) determination. To evaluate the correlation between the structures and the biological activities, a density functional theory (DFT) was conducted. Then, the study was continued with the inhibition of biofilm formation against FLC-resistant Candida species as well as time-kill studies for the most active compounds. The study further explored the cytotoxicity of these selected compounds against three human cell lines and the hemolytic activity on human erythrocytes. Furthermore, fungal cell membrane disruption, docking, and in silico adsorption, distribution, metabolism, excretion, and toxicity (ADME) prediction were assessed. Last, a preliminary in vivo test was performed to evaluate the efficacy of our best compounds using a mouse model of systemic candidiasis.
Figure 3.

Electrostatic potentials of ligands 8a–8o. The unit is in kcal/mol. Red and blue areas represent surface local maxima and minima of ESP, respectively. The global maximum and minimum values of ESP are bolded.
Scheme 1. Synthesis of the Oxirane Intermediate (4).

Results and Discussion
Design of the Target Antifungal Compounds
The present study aimed to develop novel antifungal azoles based on the FLC structure, where key pharmacophore groups remained unchanged and one of the triazole rings was replaced by the thiadiazole and substituted phenylurea scaffold. Based on the typical SAR model and recent X-ray crystallographic studies, it was expected that the incorporation of a H-donor/acceptor group to target some fungal-specific residues, such as HIS-374 (Aspergillus fumigatus), HIS-377 (C. albicans), and SER378 in the ligand binding pocket of lanosterol 14α-demethylase (CYP51), could result in stronger binding to the active site and prevail against drug resistance.8,20 Therefore, among diverse functional groups, the urea moiety with a dual nature as a H-bond donor and an acceptor was chosen for this purpose. The urea group can improve the potency, target selectivity, and specific biological activity regulation.21−23 To complete our design, the thiadiazole ring was used as a linker to connect the phenylurea group to the main pharmacophore (Figure 2).
Chemistry
As illustrated in Scheme 1, oxirane (4) was synthesized according to the literature with minor modifications (Scheme 1).14,15 The reaction of commercially available compounds (1) with 4-amino-1,2,4-triazole gave aminotriazolium chloride (2) in refluxing 2-propanol. The desired phenacyltriazole (3) was prepared from the deamination of compound 2 in diluted hydrochloric acid and sodium nitrite.24 Oxirane (4) was synthesized by converting the carbonyl group of compound (3) to an epoxide in the presence of trimethylsulfoxonium iodide (TMSI) and NaOH 20% in toluene.
On the other hand, to obtain 1-(5-mercapto-1,3,4-thiadiazol-2-yl)-3-phenylurea derivatives (intermediates 7a–r), first, the 2-mercapto-4-amino thiadiazole (5) was prepared from the reaction between thiosemicarbazide and carbon disulfide. Next, the 2-mercapto-4-amino thiadiazole (5) was allowed to react with substituted phenyl isocyanates in 2-butanone as the solvent to afford intermediates 7a–r (Scheme 2). These compounds were then reacted with oxirane (4) in the presence of K2CO3 in acetonitrile at a reflux condition to give the target compounds 8a–8r in relatively high yields (Scheme 3). All of the structures of target compounds were confirmed by 1H NMR, 13C NMR, and electrospray mass spectrometry (ESI-MS), and further confirmation of purity was obtained by reversed-phase high-performance liquid chromatography (RP-HPLC).
Scheme 2. Synthesis of 1-(5-Mercapto-1,3,4-thiadiazol-2-yl)-3-phenylurea Derivatives (7a–r).

Scheme 3. Synthesis of the New Fluconazole Analogues (8a–r).

In Vitro Antifungal Activity
The in vitro antifungal activities of the target compounds were evaluated using the microdilution method against 15 azole-sensitive strains of C. albicans (A), Candida parapsilosis (B), Candida krusei (C), Candida glabrata (D), Candida tropicalis (E), Aspergillus nidulans (F), Aspergillus flavus (G), Asp. fumigatus (H), Aspergillus niger (I), Aspergillus terreus (J), Trichophyton rubrum (k), Microsporum gipseum (L), Trichophyton mentagrophytes (M), Trichophyton schoenleinii (N), and Microsporum canis (O). The antifungal activities were expressed as the minimum inhibitory concentration with inhibition of over 90% (MIC90) values in μg/mL, and FLC was used as a positive control for comparison.
As presented in Table 1, target compounds (8a–8r) showed potent antifungal activities (MIC range: 0.5–64 μg/mL) compared to FLC (MIC: 4–16 μg/mL) against five yeast isolates. For strains A and B (C. albicans and C. krusei), the most active compounds were 8b, 8c, and 8e with promising activities (MIC: 0.5 μg/mL) and 32-fold greater potency than that of FLC (MIC: 16 μg/mL). Compounds 8g–8i, 8k, and 8p exhibited good to high effects with an MIC range of 1–16 μg/mL compared to FLC against strains A and B. Also, for strain A, activities of compounds 8j and 8o and for strain B, activities of compounds 8a, 8d, 8m, and 8q were in a good range (MIC: 1–16 μg/mL). The obtained MIC values for the rest of the compounds against strains A and B were greater (MIC: 32–64 μg/mL) than the standard drug FLC. Compounds 8c and 8g were the most active against strains C, E, and D with high potency (MIC: 0.5 μg/mL). Compounds 8a, 8b, 8e, 8g, 8h, 8k–8m, and 8q displayed good to high activities (MIC: 1–16 μg/mL) against Cornus glabrata (C), and compounds 8b, 8c, 8h, 8k, and 8q were also good antifungals against C. parapsilosis (D). The observed activities for the other compounds against strains C, D, and E were poor to moderate (MIC > 16 μg/mL).
Table 1. In Vitro Antifungal Activity of Compounds 8a–8r (MIC90, μg·mL–1) and the Control Antifungal Agent (FLC) against Various Pathogenic Fungal Isolatesa.
| yeast
strainsb |
filamentous
fungic |
|||||||||||||||
|---|---|---|---|---|---|---|---|---|---|---|---|---|---|---|---|---|
| compd | R | A | B | C | D | E | F | G | H | I | J | K | L | M | N | O |
| 8a | 4-Cl | 32 | 1 | 4 | 8 | 32 | 16 | 8 | 1 | 4 | 8 | 2 | 8 | 16 | 8 | 2 |
| 8b | 4-OMe | 0.5 | 0.5 | 1 | 2 | 1 | 8 | 8 | 1 | 4 | 4 | 2 | 4 | 4 | 8 | 8 |
| 8c | 4-F | 0.5 | 0.5 | 0.5 | 2 | 0.5 | 16 | 16 | 0.5 | 0.5 | 0.5 | 4 | 8 | 2 | 16 | 16 |
| 8d | 4-Br | 32 | 16 | 32 | 8 | 32 | 4 | 8 | 64 | 64 | 32 | 4 | 8 | 32 | 32 | 64 |
| 8e | 4-Me | 1 | 1 | 4 | 8 | 16 | 4 | 8 | 16 | 16 | 16 | 8 | 2 | 32 | 8 | 16 |
| 8f | 3-Cl | 4 | 32 | 32 | 8 | 32 | 4 | 4 | 16 | 16 | 32 | 2 | 4 | 32 | 16 | 16 |
| 8g | 3-F | 2 | 2 | 1 | 0.5 | 16 | 8 | 4 | 16 | 16 | 32 | 4 | 4 | 16 | 8 | 8 |
| 8h | 3-OMe | 16 | 8 | 16 | 4 | 16 | 4 | 8 | 16 | 8 | 16 | 2 | 16 | 16 | 32 | 32 |
| 8i | 3-Me | 8 | 16 | 32 | 8 | 8 | 2 | 2 | 8 | 16 | 32 | 16 | 2 | 16 | 8 | 16 |
| 8j | 3-CF3 | 16 | 32 | 32 | 8 | 16 | 16 | 16 | 16 | 32 | 32 | 8 | 4 | 16 | 16 | 16 |
| 8k | 2-CF3 | 4 | 16 | 16 | 4 | 16 | 4 | 2 | 16 | 16 | 16 | 8 | 2 | 32 | 16 | 16 |
| 8l | 2-Cl | 16 | 32 | 16 | 8 | 16 | 8 | 4 | 16 | 32 | 16 | 16 | 4 | 16 | 32 | 32 |
| 8m | 2-Br | 32 | 16 | 16 | 16 | 8 | 8 | 8 | 32 | 32 | 16 | 4 | 16 | 32 | 64 | 64 |
| 8n | 2-Me | 32 | 64 | 64 | 16 | 32 | 4 | 8 | 32 | 64 | 64 | 16 | 8 | 16 | 16 | 16 |
| 8o | H | 16 | 32 | 32 | 8 | 16 | 2 | 8 | 32 | 32 | 8 | 4 | 4 | 16 | 16 | 16 |
| 8p | 2,4-DiF | 16 | 16 | 32 | 8 | 32 | 8 | 4 | 64 | 64 | 16 | 16 | 4 | 16 | 16 | 16 |
| 8q | 3,4-DiCl | 32 | 16 | 16 | 4 | 16 | 8 | 8 | 32 | 32 | 8 | 4 | 8 | 16 | 16 | 16 |
| 8r | 3-Cl-4-Me | 64 | 32 | 32 | 16 | 64 | 8 | 4 | 32 | 32 | 16 | 4 | 4 | 16 | 32 | 32 |
| FLCd | 16 | 16 | 16 | 4 | 4 | 4 | 2 | 4 | 4 | 4 | 1 | 4 | 4 | 2 | 1 | |
Each experiment was performed in triplicate.
For yeast strains: A, C. albicans (ATCC 10231); B, C. krusei (ATCC 6258); C, C. glabrata (ATCC 90030); D, C. parapsilosis (ATCC 22019); E, C. tropicalis (PTCC 5028).
Filamentous fungi: F, Asp. nidulans (PTCC 5014); G. Asp. flavus (ATCC 204304); H, Asp. fumigatus (PTCC 5009); I, Asp. niger (PTCC 5154); J, Asp. terreus (PTCC 5023); K, T. rubrum (PTCC 5143); L, Microsporum gypseum (PTCC 5070); M, T. mentagrophytes (PTCC 5054); N, T. schoenleinii (PTCC 5221); and O, M. canis (PTCC 5069).
Fluconazole.
In the case of Aspergillus isolates, the resulting MICs are slightly less potent than for yeast strains. As for strains H, I, and J, compound 8c showed excellent activity (MIC: 0.5 μg/mL) when compared to FLC (MIC: 4 μg/mL), and others are among poor to moderate antifungals (MIC > 4 μg/mL), except for compounds 8a and 8b, both against Asp. fumigatus and Asp. niger and 8b against Asp. tereus with good activities (MIC: 2–4 μg/mL). On the other hand, eight compounds (8d, 8e, 8f, 8h, 8i, 8k, 8n, 8o) against Asp. nidulans and seven compounds (8f, 8g, 8i, 8k, 8l, 8p, 8r) against Asp. flavus possessed good activities based on MIC values (MIC: 2–4 μg/mL).
The spectra of antifungal activities for the majority of the synthesized compounds 8a–8d, 8f–8h, 8m, 8o, 8q, and 8r against isolate K and compounds 8b, 8e, 8f, 8g, 8i-8l, 8o, 8p, and 8r against isolate L were good (MIC: 2–4 μg/mL). Compounds 8b and 8c against T. mentagrophytes (M) and compound 8a against M. canis (O) were decent antidermatophytes. The rest of the compounds had poor to moderate activities (MIC > 4 μg/mL) when compared to the standard drug FLC (MIC: 1–4 μg/mL).
Overall, the primary in vitro assay against 15 different pathogenic fungal isolates suggests a potent and broad-spectrum profile of the designed compounds, in which compounds 8b and 8c exhibited remarkable activities and were the most active antifungals against the majority of tested C. albicans and non-albicans as well as various Aspergillus isolates. Further investigations focused on antifungal effects of compounds 8b and 8c against Candida species as the most frequent cause of IFIs and the primary fungal pathogens, leading to substantial morbidity and mortality in hospitalized patients.
Structure–Activity Relationship (SAR) Studies
In this study, we synthesized a series of novel FLC–urea hybrids to achieve a new scaffold for antifungal drug discovery. To further study the SAR of this new scaffold, we attached an aryl part to the urea moiety to analyze the effects of adding different substituents on the phenyl ring on the antifungal activity profile.
In the overall view, introducing different types of substituents on the phenyl ring (compounds 8a–8n) in comparison with the nonsubstituted compound 8o resulted in diverse activities. Among them, the activity inherently increased and a broad-spectrum activity was observed for halogenated derivatives, especially in the case of fluorine. The replacement of fluorine (8c and 8g) with chlorine and bromine in compounds 8a, 8d, and 8f resulted in lowering the activity to a great extent against most of the fungal isolates. Also, the chlorine on the phenyl ring is more preferred than bromine substituents (compounds 8d and 8m). Furthermore, adding a second chlorine or fluorine to the phenyl ring showed no advantages for compounds 8p and 8q than compounds 8a and 8c. Thus, in this study, monosubstituent compounds provided superior activities in comparison to disubstituent derivatives.
In the category of electron-donating substituents, the 4-methoxylated compound 8b exhibited better antifungal effects than 4-methyl (8e), but alteration of methyl (8i) to methoxy (8h) in the meta position resulted in equivalent or lower activities. Accordingly, substitutions on the para position improved the activity when compared to meta and ortho positions (8e and 8b vs 8h, 8i, and 8n) as observed, against all of the tested fungal species.
Density Functional Theory (DFT)-Based Analysis of SAR
With the aim of rationalizing the antifungal activities and providing more straightforward evidence on why the nature and position of different substituents on the phenyl ring affect the activities of our compounds, density functional theory calculations at the B3LYP/6-311++g(d,p) level of theory were carried out.
On the basis of molecular electrostatic potential (ESP), we can conduct a relationship between the electron distribution of compounds and their binding activities. Previous studies showed that ESP has a key role in the interpretation, prediction, and analysis of noncovalent interactions.25,26 The ESP analysis helps us find negative and positive regions of the electrostatic potential with high (blue color) and low (red color) electron densities, respectively (Figure 3). The molecular electrostatic potential maps of compounds 8a–8o are demonstrated in Figure 3. The quantitative molecular electrostatic potential analysis was performed on the optimized ground-state geometries. The ESP range varies from −41 to +75 kcal/mol. The disubstituted derivatives are ignored since none of them showed acceptable activity.
It can be seen that in all compounds, there are positive potential regions (red color) on the hydrogen atoms due to the lower electronegativity of these atoms. The negative potential regions (blue color) are located on electronegative atoms such as F, N, and O. The regions with moderate values of electron density are shown with white color. There are many common features in the ESP map of the synthesized compounds due to their high similarity. For all compounds, the most positive region is located on the van der Waals (vdW) surfaces of the hydrogen atoms related to the N atoms of the phenylurea moiety. It can be predicted that there is a strong attraction between the most positive region of these compounds and the negative region of the target protein. The most negative region is located around the triazole ring. This substantial negative region can also form a strong interaction with the positive region of the target.
Among different halogenated substitutions on 2 and 4 positions of the phenyl ring, there are moderate electron densities and smaller minimum values near Cl and Br atoms with a low electronegativity compared to the F atom with a high electronegativity, which led to reduction of the activity. This implies that the difference in charge distribution could well be responsible for reduction of the activities in Br and Cl substituents at 2 and 4 positions. Additionally, this behavior is valid for halogen substitution at the 3 position except for compound 8j. For compound 8j, there are three minimum domains around the meta position, and it seems that such charge distribution at this position might bring out a reduction of activity for compound 8j.
In the case of substituents bearing electron-donating groups on the phenyl ring, the substitution at the para position shows more activity than that at ortho and meta positions. It can be seen from Figure 3 that there is a positive region at the front of hydrogen atoms in compounds with methyl and alkoxy substituents. By changing the position of the methyl group from para to meta and ortho positions, 8e vs 8i and 8n, the positive regions related to the methyl group locate closer to the most positive region (protons of urea) and the activity reduces. The reduction in the activity may be caused by the disturbance of the hydrogen bond in the most positive region. The oxygen atom of the methoxy group attracts electrons due to its high electronegativity. Therefore, the nature of the substituent can change the distribution of charge around the phenyl ring. The effect of this factor on the activity of compounds is more distinct at the para position than at other positions.
For compound 8o with no substitution, there is a higher/lower electron density compared to compounds with electron-withdrawing and electron-donating substituents, respectively. In other words, the ESP values around the phenyl ring are less negative for compounds with electron-withdrawing substitution compared to electron-donating ones.
Taken together, this analysis successfully reveals how the nature and position of substituents have direct effects on the related antifungal activities for our compounds through altering the electron distribution around and at each position of the phenyl ring.
Antifungal Activity against the FLC-Resistant Candida Species
Since drug resistance emerges in many of the Candida species and restricts clinicians’ therapeutic choices, we investigated the antifungal effects of the most active compounds 8b and 8c against a series of seven FLC-resistant clinical Candida isolates (R1–R7).27−29 The results were presented as planktonic minimum inhibitory (PMIC) values in Table 2. Compounds 8b and 8c effectively inhibited the growth of all of the resistance forms of Candida isolates at the concentrations of 0.25–2 μg/mL, significantly lower than that of FLC (MIC ≥ 64 μg/mL).
Table 2. In Vitro Antifungal Activities of the Target Compounds against Seven FLC-Resistant Candida Isolates (PMIC90, μg/mL).
|
resistant Candida isolatesa |
|||||||
|---|---|---|---|---|---|---|---|
| compd | strain R1 | strain R2 | strain R3 | strain R4 | strain R5 | strain R6 | strain R7 |
| 8b | 0.25 | 0.5 | 2 | 1 | 2 | 2 | 1 |
| 8c | 0.5 | 1 | 2 | 2 | 2 | 2 | 2 |
| FLC | >64 | >64 | >64 | >64 | >64 | >64 | >64 |
Antibiofilm Assays
The ability to form biofilms is considered one of the critical reasons for the evolution of severe drug-resistant fungal infections. Fungal biofilms are the self-expanding extracellular polymeric substances of one or more species surrounded in an extracellular polymeric material and attached both to one another and to a solid surface. Candida cells, once embedded and shielded within biofilm layers, are often unreachable for antifungal agents, and the immune system fails to attack them.30
Thus, the antibiofilm activities of compounds 8b and 8c and FLC were evaluated against the FLC-resistant clinical C. albicans isolates (R1) and (R2) after biofilm formation by the MTT reduction assay31,32 (Table 3). As observed in Table 3, compound 8b showed sessile minimum inhibitory concentration (SMIC) values of 0.5 and 1 μg/mL for the resistant strains of R1 and R2, respectively, indicating its high antifungal effect and antibiofilm activity. In addition, compound 8c with a slightly less SMIC value could inhibit the biofilm formation of the resistant strains R1 and R2. The obtained results confirmed that the tested compounds 8b and 8c could eliminate the preformed biofilms of the FLC-resistant C. albicans isolates in vitro.
Table 3. Antibiofilm Activity of Compounds 8b, 8c, and FLC against C. albicans (Strains R1 and R2) Biofilms (SMICb90, μg/mL)a.
| compd | strain R1 | strain R2 |
|---|---|---|
| 8b | 0.5 | 1 |
| 8c | 1 | 1 |
| FLC |
Each test was performed in triplicate.
SMIC90: Sessile minimum inhibitory concentration that reduced the metabolic activity of biofilms by 90%.
Furthermore, a scanning electron microscope (SEM) (AIS2100, Seron Technology, South Korea) was used to observe the morphological changes of the FLC-resistant C. albicans (R1) in the biofilm structure exposed to compounds 8b and 8c (Figure 4). The biofilm architecture of the FLC-resistant C. albicans (R1) control (untreated) was spherical or oval-shaped blastoconidia, highly heterogeneous, and composed of a dense layer of yeasts (Figures 4A1,B1). After exposure to compounds 8b and 8c, the preformed biofilms exhibited fewer yeasts (Figure 4A2,B2; 5000× magnification). In 9000× magnification, abnormal morphology, pores, and distorted membranes appeared in the yeasts (red arrows). The cell membrane lost its smoothness and resulted in unusual surface bulges, suggesting impairment of the cell membrane integrity (Figure 4A3,B3).
Figure 4.

SEM images of the FLC-resistant C. albicans (R1) biofilm treated with compounds 8b and 8c. (A1, B1): Untreated C. albicans biofilm; the red arrow indicates the smooth cell membrane of normal yeast. (A2, A3): C. albicans biofilm treated with compound 8b; 5000 and 9000× magnification. (B2, B3): C. albicans biofilm treated with compound 8c; 5000 and 9000× magnification.
Time-Kill Assays
Time-kill tests over a 24 h period were performed against C. albicans (ATCC 10231) to determine the fungicidal or fungistatic activity of the new compounds 8b and 8c (Figure 5). No-drug control and FLC at MIC (16 μg/mL) and 4 × MIC (64 μg/mL) were used as controls.14
Figure 5.
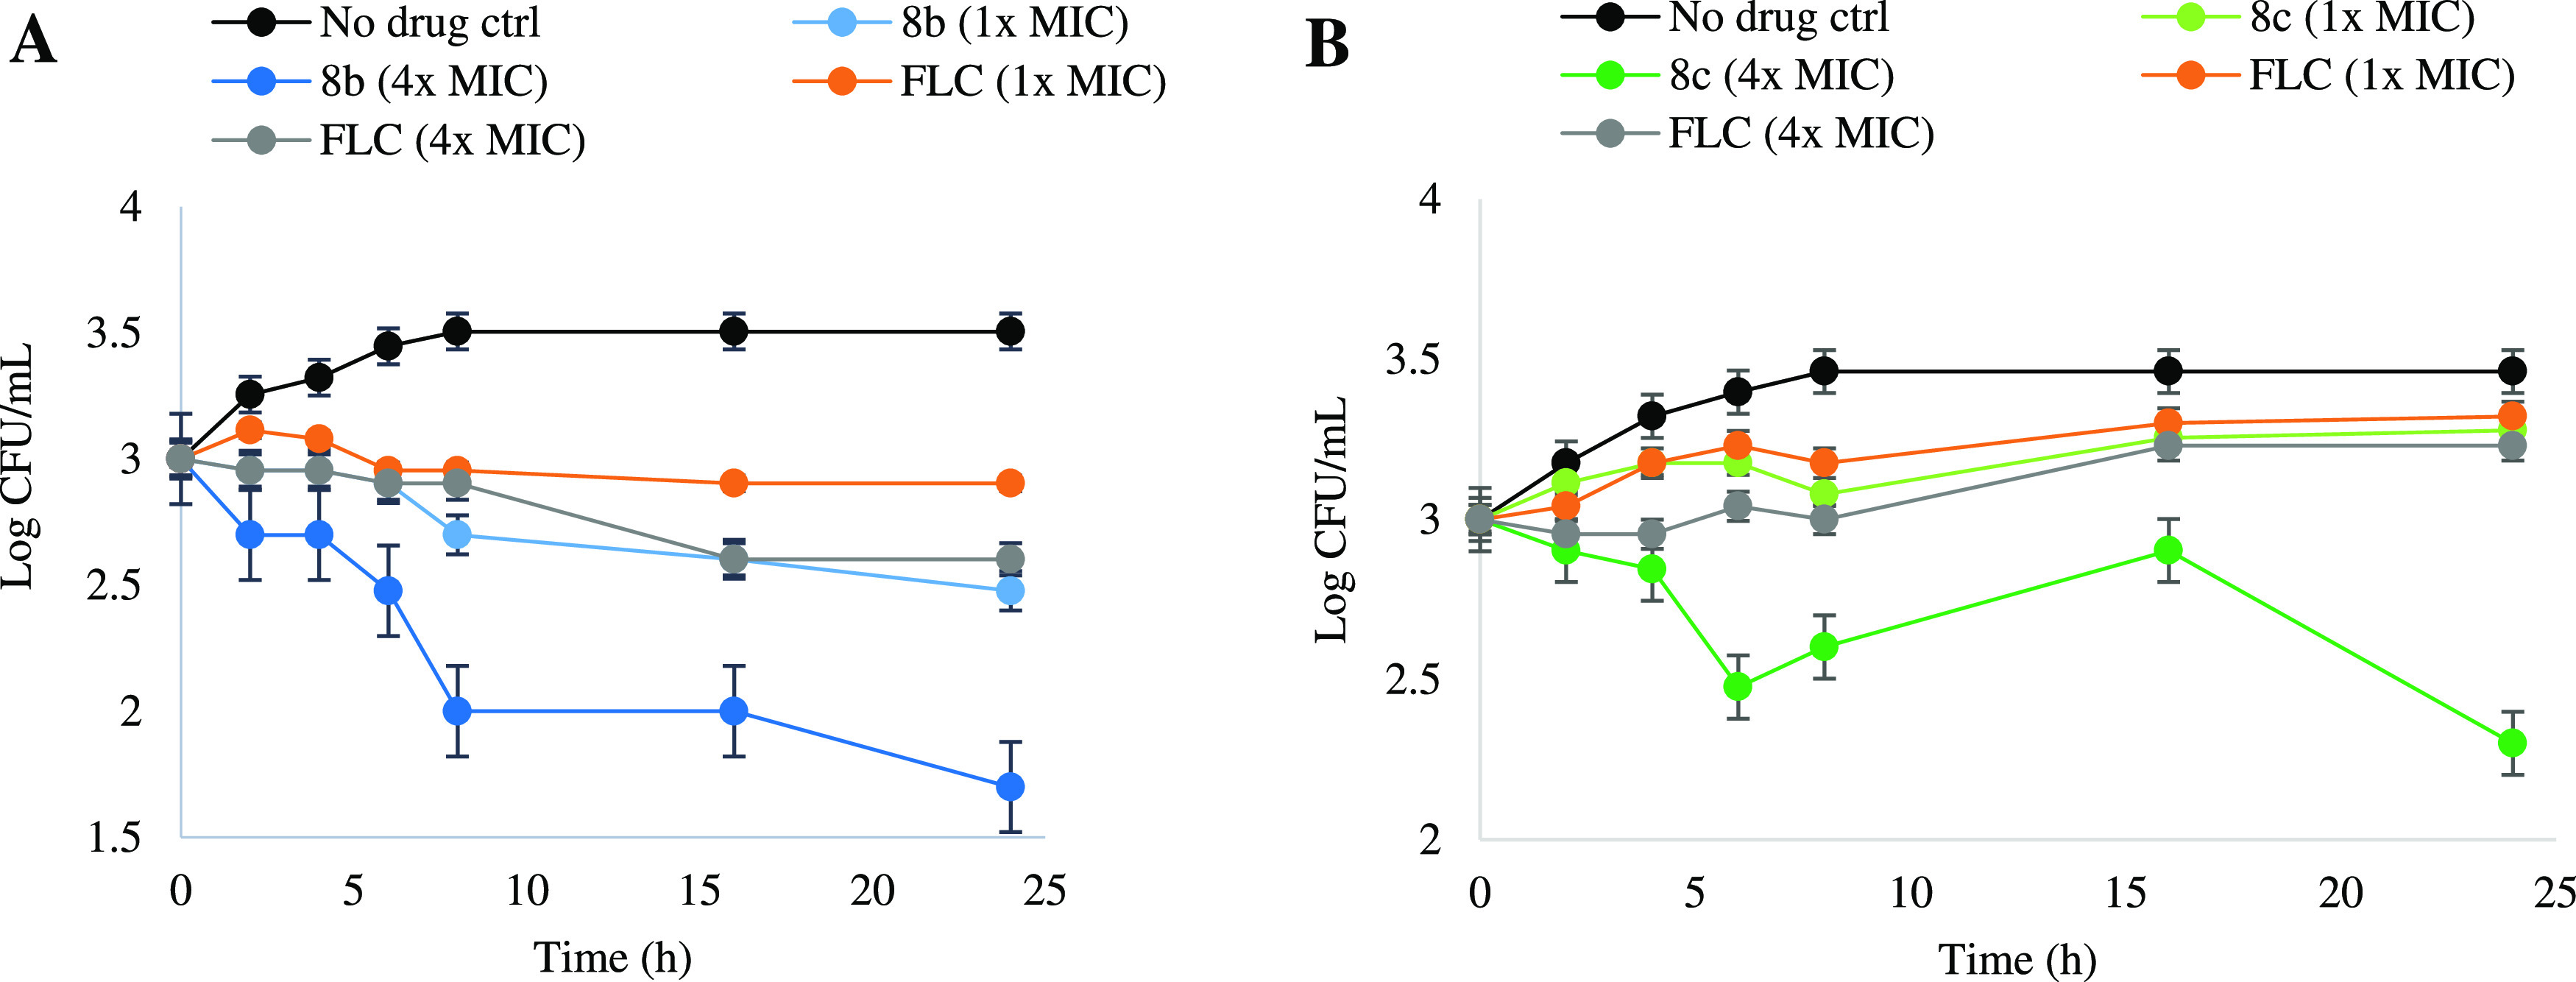
Time-kill curves obtained using an initial inoculum of 103 CFU/mL of the aliquot isolate. CFUs/mL were determined after 0, 5, 10, 15, 20, and 24 h of incubation. (A) No drug, different concentration of compound 8b, and FLC against C. albicans (ATCC 10231). (B) No drug, different concentration of compound 8c, and FLC against C. albicans (ATCC 10231). Each test was performed in triplicate.
As shown in Figure 5A, compound 8b showed a fungicidal effect at MIC (0.5 μg/mL) greater than FLC at MIC (16 μg/mL) and similar to FLC at 4 × MIC (64 μg/mL). When the concentration was increased to 4 × MIC (2 μg/mL), the fungicidal activity of compound 8b significantly enhanced and the fungi colony-forming unit was reduced to a very low amount of 101.7 CFU/mL. For compound 8c (Figure 5B) at MIC (0.5 μg/mL), there was a fungistatic effect similar to FLC at 16 μg/mL and 64 μg/mL. Interestingly, a high fungicidal effect was observed at 2 μg/mL (4 × MIC) of compound 8c and a decreased fungal growth to a large extent. Overall, time-kill assay results demonstrated a significant reduction in fungal growth against C. albicans (ATCC 10231) with high fungicidal dose-dependent killing effects for the new compounds at 4 × MIC (2 μg/mL), where FLC (4 × MIC) had no significant effect.
Hemolysis Assay
We conducted a hemolysis assay to assess the safety profile of our promising compounds 8b and 8c. The most active compounds were tested at different concentrations (10, 20, 40, 60, and 100 μg/mL) compared to the standard antifungal agent FLC and the positive control Triton X-100 against human red blood cells (hRBCs). As illustrated in Figure 6, compounds 8b and 8c displayed limited hemolysis at the concentration of 100 μg/mL, compared to the positive control, producing 86.2% hemolysis. Therefore, our synthesized compounds 8b and 8c revealed no significant toxicity against human erythrocytes at concentrations higher than the MIC values reported for these compounds.
Figure 6.

hRBC lysis activities of the most active compounds 8b and 8c and FLC are shown in a three-dimensional bar chart. The cells were treated and incubated for 2 h at 37 °C with each compound at concentrations ranging from 10 to 100 μg/mL. Each test was performed in triplicate.
In Vitro Cytotoxicity Assays
According to the eukaryotic nature of fungi, it is essential to check the selectivity of new antifungal structures against fungi cells and the proper safety profile to prevent toxicity to mammalian cells.33 Hence, active compounds 8b and 8c were tested against three different cell lines, including human pancreatic cancer (PANC-1), epidermoid carcinoma (A-431), and human dermal fibroblast (HDF) normal cells with FLC as the standard drug (Figure 7).
Figure 7.

Representative cytotoxicity assays of compounds 8b and 8c against three human cell lines: PANC-1 (solid pink squares), A-431 (solid blue squares), and HDF (solid green squares). Cells were treated with various concentrations of the compounds and FLC. The positive control contained cells treated with cisplatin (<10% cell survival, not shown). The negative control contained cells treated with DMSO (no drug). Each test was performed in triplicate. A P-value of less than 0.05 was considered significant. *P < 0.05; **P < 0.01 compared to the positive control group.
Against PANC-1, compounds 8b and 8c exhibited no toxicity at 30 and 60 μg/mL. However, compound 8c showed some toxicity levels (>40% cell survival) at a concentration of 100 μg/mL (200-fold of its overall MIC value) against the PANC-1 cancer cell line. As illustrated in Figure 7, the viability of A-431 cancer cells for compound 8b was affected by less than 50%, even at the concentration of 100 μg/mL. Similarly, compound 8c presented no toxicity at up to 60 μg/mL against A-431 and demonstrated some toxicity levels at 100 μg/mL, 200-fold higher than the MIC value reported for this compound. Interestingly, none of the active compounds displayed toxicity against the HDF normal cell line up to 100 μg/mL. When considering these compounds’ extremely low MIC values against specific fungal strains, these cytotoxicity data are encouraging and provide a rational therapeutic window.
Membrane Permeabilization Assay
The interruption of the fungal cell membrane was investigated to identify the possible mechanism of action for our new FLC analogues. The propidium iodide (PI) dye was considered as a probe since it can only enter the membrane-compromised cells and be detected under a fluorescence microscope due to binding to nucleic acid and fluoresces.14 In addition, compounds 8b and 8c were tested with AMB as the positive control.34 Based on the results, none of our compounds 8b and 8c (at 1 × MIC, 2 × MIC, or 4 × MIC) induced the cellular uptake of the PI dye into C. albicans (ATCC 10231), unlike the positive control AMB (MIC = 1 μg/mL) that increased the PI dye uptake by C. albicans ATCC 10231 (Figure 8). The obtained data from this test revealed that the antifungal mechanism of our compounds was not membrane disruption.
Figure 8.


Effect of the controls no drug (negative control) and AMB (positive control) as well as compounds 8b and 8c on the cell membrane integrity of C. albicans (ATCC 10231). From the top to bottom, the columns are as follows: propidium iodide (PI) dye uptake by yeast cells without drug, with AMB (1 μg/mL), with compound 8b (0.5 μg/mL), compound 8b (1 μg/mL), with compound 8b (2 μg/mL), and with compound 8c at 0.5, 1, and 2 μg/mL. Experiments were performed in duplicate.
Docking and Noncovalent Interaction (NCI) Studies
The docking analysis was conducted based on the cocrystal structure of C. albicans CYP51 as the main target of azole antifungals complexed with VT-1161 (5TZ1 with 2.0 Å resolution)35 to offer a perspective on the mode of action for the synthesized compounds 8b and 8c.
The docking results (Figures 9 and 10) showed that the FLC analogues were positioned into the hydrophobic region similar to VT-1161 and the triazole ring was coordinated to the iron (Fe) of the heme. As depicted in Figure 9, there were two important hydrogen-bonding interactions between the carbonyl side chain of the fungal-specific residue SER378 and the protons on the two nitrogens of the urea group for both compounds 8b and 8c. This observation successfully proved the primary hypothesis regarding predicting the H-bond interactions of the urea group with the active site. Furthermore, π–π interactions were observed between the thiadiazole ring of the molecule and TYR118 (for both compounds) and between the 4-fluorophenyl ring of 8c with PHE233, along with many other vdW/aromatic interactions.
Figure 9.

Three-dimensional (3D) binding patterns of compounds 8b (A) and 8c (B) in the active site of CYP51-C. albicans (5TZ1.pdb). Hydrogen bonds and π–π interactions are indicated as green and orange lines, respectively.
Figure 10.

Two-dimensional (2D) diagram of compounds 8b (A) and 8c (B) in the active site of CYP51-C. albicans (5TZ1.pdb). Hydrogen bonds and π–π interactions are indicated as green and orange lines, respectively.
In general, the most active compounds displayed encouraging interactions with the CYP51 enzyme, which confirm in vitro assays and are in complete agreement with the typical SAR model of azole antifungal drugs (Figure 2).
Furthermore, to clarify the interactions between the most potent active compounds 8b and 8c at the modified region and the target protein, the independent gradient model (IGM) was used based on the promolecular density. The IGM analysis was performed on the best poses of ligands obtained by molecular docking calculations (Figure 11). There are several vdW forces between the ligand and surrounding residues in the active site of the target protein, including HIS-377, TYR-505, VAL-510, SER-507, VAL-509, MET-508 and HIS-377, SER- 507, MET-508, PRO-230, PHE233 for compounds 8b and 8c, respectively. The green and blue regions represent the vdW forces and strong attraction, respectively. It is noteworthy to mention that the vdW forces play a key role in the stabilization of complexes of potent compounds and the target protein.
Figure 11.

NCI analysis using the IGM method for complexes 8b (A) and 8c (B) in the active site of CYP51-C. albicans (5TZ1.pdb). The blue and green colors represent strong attraction and vdW forces, respectively.
In Silico Screening of ADMET
In silico models are preliminary screening tests to determine the drug-likeness and ADMET properties for new bioactive chemicals.36,37 Thus, we calculated some of the important ADMET parameters for our new compounds and some known antifungal drugs for better comparison (Table 4). All of the predicted ADMET information was computed using SwissADME and PreADMET web-based tools.38,39 According to Table 4, the predicted drug-likeness scores were within the limits and were confirmed by Lipinski’s rule, with only one violation (MW > 500). Based on human intestinal absorption (HIA), the CYP3A4 substrate, the bioavailability score, and plasma protein binding showed desirable results compared to standard drugs. In the case of bioavailability, according to obtained bioavailability scores from the SwissADME database, compounds 8b and 8c had scores similar to FLC and RAV and could be distinguished as orally bioavailable agents.
Table 4. Predicted Drug-Likeness and ADMET Properties for Compounds 8b, 8c, and Standard Drugs Fluconazole (FLC), Ravuconazole (RAV), and Itraconazole (ITR).
| cmpd | drug-likenessa | HIAb | bioavailability scorecC | PPBd | hERG inhibitione | CYP3A4 substratee | carcinogenicitye | water solubilitycC |
|---|---|---|---|---|---|---|---|---|
| 8b | yes | 91.8 | 0.55 | 98.9 | medium risk | weakly | negative | moderately soluble |
| 8c | yes | 92.95 | 0.55 | 99.9 | medium risk | substrate | negative | moderately soluble |
| FLC | yes | 95.7 | 0.55 | 55.15 | medium risk | substrate | negative | soluble |
| RAV | yes | 95.58 | 0.55 | 91.44 | medium risk | substrate | negative | moderately soluble |
| ITR | no | 96.6 | 0.17 | 95.3 | medium risk | substrate | negative | poorly soluble |
Lipinski’s rule of 5: MW < 500 Dalton, Log P < 5, hydrogen-bond donors < 5, hydrogen-bond acceptors < 10, rotatable bonds < 10.
Human intestinal absorption (%), calculated by PreADMET.
alculated by SwissADME.
Plasma protein binding, calculated by PreADMET.
Calculated by PreADMET.
Also, there was a medium risk for hERG inhibition, and no carcinogenicity was observed for all of the compounds. Another important physicochemical property is the water solubility; the predicted data indicated the moderate solubility of the synthesized compounds. The in silico model results demonstrated favorable ADMET and physicochemical parameters for our most active compounds 8b and 8c compared to standard drugs.
In Vivo Antifungal Assay
According to the promising in vitro antifungal activity shown by our new compounds 8b and 8c, a murine model of the systemic Candida infection was developed to demonstrate the in vivo efficacy of the compounds compared to that of FLC and VOR and untreated control groups. According to the previously described methods, the murine model of systemic candidiasis was established with some modifications.40
All mice were immunosuppressed by the IP injection of cyclophosphamide and infected by an IP injection of FLC-susceptible C. albicans (ATCC 10231) (1 × 10⁶ CFU). The mice were assigned to five groups, which were treated by compound 8b (15 mg/kg), compound 8c (15 mg/kg), FLC (15 mg/kg), VOR (15 mg/kg), and the vehicle by oral gavage administration. The treatment was performed for 5 days after inoculation, and then, observations were continued until day 25 when all control mice were dead. In the FLC group, a 60% survival rate was observed. In contrast to the control and FLC groups, mice in the 8b, 8c, and VOR groups showed a 100% survival rate at the end of the study (Figure 12). Next, the mice were euthanized, and their left kidneys were harvested and homogenized to evaluate renal fungal burden.
Figure 12.

Survival curve of treated groups with compounds 8b, 8c, and VOR on systemic candidiasis in neutropenic mice (n = 5) via oral gavage. ***P < 0.001 compared to the control group.
As illustrated in Table 5, there was a significant decrease in the kidney fungal burden (CFU/g of the tissue) for compound 8b (414 CFU/g) and compound 8c (438 CFU/g) compared to the vehicle (779 CFU/g) (P < 0.01) (Table 5) and superior to FLC (512 CFU/g) and comparable to that of VOR (318 CFU/g). In conclusion, the synthesized compounds 8b and 8c showed in vivo efficiency against a murine model of systemic infection caused by C. albicans.
Table 5. Effect of Treatment with Compounds 8b, 8c, FLC, and VOR (15 mg/kg) on Systemic Candidiasis in Neutropenic Mice (n = 5) via Oral Gavage and Resulting Kidney Fungal Burden Values in Each Group.
| treatment | CFU/ga | CFU/g range |
|---|---|---|
| Ctrl | 779 ± 39.6 | 700–920 |
| 8b | 414 ± 67.7b | 220–580 |
| 8c | 438 ± 54.8b | 310–600 |
| FLC | 512 ± 63.5b | 450–690 |
| VOR | 318 ± 66.5b | 180–520 |
Mean ± standard deviation (SD) of triplicate samples of colony-forming units/gram of the left kidney tissue.
P < 0.01 compound-treated vs untreated mice.
Conclusions
In summary, some new FLC analogues were designed and synthesized as novel antifungal lead compounds. Among them, compounds 8b and 8c presented superior activity against a series of susceptible and resistant C. albicans compared to FLC. To explore the SAR of new compounds, DFT calculations were successfully performed and showed that the distribution of charge around the phenyl ring is responsible for the separation between the active and inactive compounds. The most active compounds 8b and 8c exhibited potent antibiofilm activity on resistant C. albicans isolates. Also, the time-kill assay demonstrated the fungicidal effects of our synthesized compounds, and cytotoxic investigation revealed that they had very low toxicity for the three mammalian cell lines and human red blood cells, even at concentrations higher than the related MICs. The membrane permeabilization assay showed that the compounds did not disrupt the fungal cell membrane. Moreover, molecular modeling displayed significant H-bond, π–π, and vdW interactions between the thiadiazole-phenylurea scaffold and fungal-specific residues in the active site of C. albicans CYP51. The in silico model prediction results revealed favorable ADMET and druglike properties. Finally, a mice model of systemic candidiasis was conducted to further confirm the antifungal efficiency of the compounds. The results showed a significant increase in the survival rate and a significant reduction in the fungal kidney burden for mice treated with compounds 8b and 8c. Further mechanistic studies and structural optimization for these promising antifungal leads are still ongoing and will be reported in the future.
Experimental Section
Chemistry
All commercially available reagents and solvents were used without further purification and were purchased from Sigma or Merck companies. 1H and 13C NMR were carried out with a Bruker FT-500 MHz spectrometer using CDCl3 or DMSO-d6 as the solvent and TMS as the internal standard. Chemical shifts and coupling constants are reported in δ ppm and J Hz, respectively. All of the reactions were monitored through TLC (plastic sheets silica gel 60 F254). Melting points were determined with a Kofler hot-plate microscope apparatus and are uncorrected. Synthesized compounds were purified by column chromatography with a silica gel 230–400 mesh. Mass spectra were obtained by HP Agilent Technologies 5937 at an ionization potential of 70 eV. Known compounds (2, 3, 4, 5, and 7) were synthesized (as previously reported) and characterized by 1H NMR, and the results are in agreement with previous literature samples.14,41 Further confirmation of purity for the target azole molecules was achieved by RP-HPLC (Agilent Technologies 1260 Infinity HPLC system) and was determined to be ≥95% pure; it was performed with the following chromatographic conditions: flow rate = 1.0 mL/min; λ = 280 nm; column = ODS (C18) column for chromatography (250 mm × 4.6 mm, 5 μm). Eluents: A = 0.1 M phosphate buffer, pH 3.0, B = MeCN; column temperature: 35 °C; injection volume: 20 μL; run time: 40 min. Gradient profile, starting from 70% (v/v) A and 30% (v/v) B until 30 min and after that decreasing from 70% (v/v) A to 10% (v/v) A and increasing from 30% (v/v) B to 90% (v/v) B for 5 min and then increasing to 70% (v/v) A and decreasing to 30% (v/v) B from 36 to 40 min.
General Procedure for the Preparation of Compounds 2, 3, 4, and 5
4-Amino-1-(2-(2,4-difluorophenyl)-2-oxoethyl)-1H-1,2,4-triazol-4-ium Chloride (2)
To a solution of 2-chloro-2′,4′-difluoroacetophenone (1 g, 4.46 mmol) in refluxing 2-propanol (6 mL), 4-amino-1,2,4-triazole (300 mg, 3.56 mmol) was added. Upon completion, the solvent was evaporated, and CH2Cl2 (6 mL) was added to the crude product and stirred for half an hour. The precipitated product was collected by filtration and washed with CH2Cl2 (2 × 6 mL) to give the pure compound 2 (1.91 g, 85%) as a white solid.141H NMR (500 MHz, DMSO-d6, which matches the lit.36) δ 9.1 (s, 1H), 8.81 (s, 1H), 7.89 (m, 1H), 7.32 (m, 1H), 6.96 (m, 1H), 5.01 (s, 2H).
2,4-Diflouro-2-(1H-1,2,4-triazo-1-yl)acetophenone (3)
To a cold solution of compound 2 (1.9 g, 6.18 mmol) in water (20 mL), conc HCl (0.63 mL) and NaNO2 (470 mg, 6.8 mmol) were added. The reaction mixture was then stirred for 2 h at room temperature. After completion of the reaction, a saturated solution of NaHCO3 was added to the reaction mixture for neutralizing, and the solid formed. After that, the residue was purified by flash column chromatography (SiO2, 1:9 MeOH/CH2Cl2) to give compound 3 (715 mg, 60%) as a yellow solid.141H NMR (500 MHz, CDCl3, which matches the lit.36) δ 8.49 (s, 1H), 7.81 (s, 1H), 7.79 (m, 1H), 7.12 (m, 1H), 6.66 (m, 1H), 4.91 (s, 2H).
1-[[2-(2,4-Difluorophenyl)-2-oxiranyl]methyl]-1H-1,2,4-triazole (4)
To a solution of 2,4-difuoro-2-(1H-1,2,4-triazo-1-yl)acetophenone (0.5 g, 2.24 mmol) in toluene (8 mL), trimethylsulfoxonium iodide (0.59 g, 2.7 mmol) and 0.8 mL of 20% (v/v) NaOH were added. Then, the reaction mixture was stirred at 60 °C for 4 h. Upon completion, the mixture was diluted with EtOAc (10 mL), washed with water (2 × 10 mL) and brine (15 mL), and then dried over MgSO4. The organic layer was evaporated under reduced pressure, and the residue was purified by flash column chromatography (SiO2, 3:2 EtOAc/hexanes) to give compound 4 (290 mg, 55%) as a light-brown oil.241H NMR (500 MHz, DMSO-d6, which matches the lit.37) δ 8.41 (s, 1H), 7.79 (s, 1H), 7.56 (m, 1H), 7.12 (m, 1H), 6.76 (m, 1H), 4.91 (d, J = 14.8 Hz, 1H), 4.53 (d, J =14.8 Hz, 1H), 2.91 (d, J = 4.6 Hz, 1H), 2.79 (d, J = 4.6 Hz, 1H).
5-Amino-1,3,4-thiadiazole-2-thiol (5)
Thiosemicarbazide (5 g, 54.94 mmol) and Na2CO3 (5.76 g, 54.94 mmol) were dissolved in dry EtOH, and the reaction mixture was heated to 60 °C for 30 min. CS2 (8.35 g, 109.88 mmol) in dry ethanol was added dropwise and then refluxed overnight. Upon completion, the solvent was evaporated under reduced pressure. The crude product was diluted with H2O (100 mL), and then, concentrated HCl solution was added dropwise to give compound 5 (6.2 g in 84%) as a yellow solid.41 mp: 233–235 °C; 1H NMR (500 MHz, DMSO-d6, which matches the lit.47) δ: 13.11 (s, 1H, NH), 7.05 (s, 2H, NH2); 13C NMR (125 MHz, DMSO-d6) δ: 180.93 161.48.
General Procedure for the Preparation of 1-(5-Mercapto-1,3,4-thiadiazol-2-yl)-3-phenylurea Derivatives (7a–r)
5-Amino-1,3,4-thiadiazole-2-thiol (1 mmol) was dissolved in 2-butanone (5 mL) and stirred at room temperature for 0.5 h. Then, the appropriate phenyl isocyanate derivative (1 mmol) was added dropwise with continuous stirring. The obtained mixture was stirred at room temperature overnight. The resulting precipitated solid was collected and washed with Et2O to give intermediates 7a–r as white solids.41 The products were used for the next step without any further purification.
General Procedure for the Preparation of 1-(5-((2-(2,4-Difluorophenyl)-2-hydroxy-3-(1H-1,2,4-triazol-1-yl)propyl)thio)-1,3,4-thiadiazol-2-yl)-3-phenylurea Derivatives (8a–r)
To a solution of compound 1-(5-mercapto-1,3,4-thiadiazol-2-yl)-3-phenylurea derivatives (7) (0.63 mmol) in acetonitrile (15 mL), K2CO3 (4 mmol) and 1-((2-(2,4-difluorophenyl)oxiran-2-yl)methyl)-1H-1,2,4-triazole (4) (1 mmol) were added. The reaction mixture was heated under reflux for 4–8 h, and progress of the reaction was monitored by TLC (1:10 MeOH/ethyl acetate). Upon completion, the solvent was evaporated, and the crude was dissolved and stirred in hot EtOH (15 mL). After that, the mixture was filtered and the filtrate was removed under reduced pressure. The crude product was washed with Et2O or CH2Cl2 to obtain the desired product, which was purified by recrystallization from water/ethanol.
1-(4-Chlorophenyl)-3-(5-((2-(2,4-difluorophenyl)-2-hydroxy-3-(1H-1,2,4-triazol-1-yl)propyl)thio)-1,3,4-thiadiazol-2-yl)urea (8a)
Light-brown solid; yield: 75%; mp: 145–150 °C; 1H NMR (500 MHz, DMSO-d6, Supporting Information, Figure S1) δ: 8.83 (s, 1H), 8.56 (s, 1H), 8.39 (s, 1H), 7.74 (s, 1H), 7.6 (d, J = 8.4 Hz, 2H), 7.43 (m, 1H), 7.21 (m, 1H), 7.18 (s, 1H), 7.15 (d, J = 8.5 Hz, 2H), 6.96 (m, 1H), 4.65 (d, J = 15 Hz, 1H), 4.62 (d, J = 15 Hz, 1H), 3.73 (d, J = 14 Hz, 1H), 3.58 (d, J = 14 Hz, 1H). 13C NMR (125 MHz, DMSO-d6, Supporting Information, Figure S2) δ: 164.4, 160.1 (dd, JC-F = 248.2 and 12.3 Hz), 158.11 (dd, JC-F = 246.1 and 12 Hz), 153.5, 151.5, 145.4, 136.3, 133.4, 133.1, 129.2 1 (d, JC-F = 13.1 Hz), 125.1 (d, JC-F = 8.3 Hz), 120.8 (2C), 114.4 (2C), 111.6 (dd, JC-F = 20.2 and 3.3 Hz), 103.9 (t, JC-F = 26.9 Hz), 74.0, 57.1, 43.5. ESI-MS m/z: calcd for C20H16 ClF2N7O2S2 523.0, found 524.0 [M + H]+. Purity of the compound was further confirmed by RP-HPLC. Rt = 19.68 min (97% pure; Supporting Information, Figure S3).
1-(5-((2-(2,4-Difluorophenyl)-2-hydroxy-3-(1H-1,2,4-triazol-1-yl)propyl)thio)-1,3,4-thiadiazol-2-yl)-3-(4-methoxyphenyl)urea (8b)
Light-brown solid; yield: 78%; mp: 146–150 °C; 1H NMR (500 MHz, DMSO-d6, Supporting Information, Figure S4) δ: 9.97 (s, 1H), 9.7 (s, 1H), 8.32 (s, 1H), 7.78 (s, 1H), 7.53 (d, J = 8.4 Hz, 2H), 7.42 (m, 1H), 7.14 (m, 1H), 6.96 (m, 1H), 6.89 (d, J = 8.5 Hz, 2H), 6.55 (s, 1H), 4.7 (d, J = 14.4 Hz, 1H), 4.65 (d, J = 14.4 Hz, 1H), 3.92 (d, J = 13.8 Hz, 1H), 3.78 (d, J = 13.8 Hz, 1H), 3.72 (s, 3H). 13C NMR (125 MHz, DMSO-d6, Supporting Information, Figure S5) δ: 164.4, 162.1 (dd, JC-F = 247.5 and 12.03 Hz), 158.1, 156.5 (dd, JC-F = 243.7 and 12.2 Hz), 155.7, 154.4, 151.8, 145.4, 133.1, 131.6 (d, JC-F = 13.6 Hz), 125.1 (d, JC-F = 7.9 Hz), 121.0 (2C), 114.4 (2C), 111.9 (dd, JC-F = 21.3 and 3.2 Hz), 104.9 (t, JC-F = 27.2 Hz), 74.1, 56.3, 55.3, 43.5. ESI-MS m/z: calcd for C21H19 F2N7O3S2 519.0, found 520 [M + H]+. Purity of the compound was further confirmed by RP-HPLC. Rt = 18.85 min (98% pure; Supporting Information, Figure S6).
1-(5-((2-(2,4-Difluorophenyl)-2-hydroxy-3-(1H-1,2,4-triazol-1-yl)propyl)thio)-1,3,4-thiadiazol-2-yl)-3-(4-fluorophenyl)urea (8c)
Light-brown solid; yield: 69%; mp: 143–149 °C; 1H NMR (500 MHz, DMSO-d6, Supporting Information, Figure S7) δ: 10.19 (s, 1H), 8.93 (s, 1H), 8.33 (s, 1H), 7.78 (s, 1H), 7.45 (m, 3H), 7.13 (m, 3H), 6.99 (m, 1H), 6.75 (s, 1H), 4.72 (d, J = 14.5 Hz, 1H), 4.68 (d, J = 14.5 Hz, 1H), 3.92 (d, J = 13.8 Hz, 1H), 3.78 (d, J = 13.8 Hz, 1H). 13C NMR (125 MHz, DMSO-d6, Supporting Information, Figure S8) δ: 164.1, 162.9 (d, JC-F = 245.7 Hz), 159 (dd, JC-F = 246.3 and 12.3 Hz), 158.2 (dd, JC-F = 244.7 and 12.4 Hz), 157.3, 154.5, 151.9, 145.3, 136, 131.4 (dd, JC-F = 12.7 and 3.2 Hz), 125.1 (d, JC-F = 8.2 Hz), 120 (d, 2C, JC-F = 20.5 Hz), 115.1 (d, 2C, JC-F = 7.5 Hz), 112 (d, JC-F = 20.9 Hz), 104.9 (t, JC-F = 27.3 Hz), 74.0, 56.6, 43.5. ESI-MS m/z: calcd for C20H16 F3N7O2S2 523.0, found 524.0 [M + H]+. Purity of the compound was further confirmed by RP-HPLC. Rt = 18.18 min (98% pure; Supporting Information, Figure S9).
1-(4-Bromophenyl)-3-(5-((2-(2,4-difluorophenyl)-2-hydroxy-3-(1H-1,2,4-triazol-1-yl)propyl)thio)-1,3,4-thiadiazol-2-yl)urea (8d)
Brown solid; yield: 70%; mp: 155–160 °C; 1H NMR (500 MHz, DMSO-d6, Supporting Information, Figure S10) δ: 10.65 (s, 1H), 10.11 (s, 1H), 8.34 (s, 1H), 7.83 (s, 1H), 7.68 (d, J = 9.13 Hz, 2H), 7.46 (d, J = 9.13 Hz, 2H), 7.41 (m, 1H), 7.14 (m, 1H), 6.99 (m, 1H), 6.62 (s, 1H), 4.72 (d, J = 15 Hz, 1H), 4.67 (d, J = 15.1 Hz, 1H), 3.93 (d, J = 14 Hz, 1H), 3.78 (d, J = 14 Hz, 1H). 13C NMR (125 MHz, DMSO-d6) δ: 165.4, 159.8 (dd, JC-F = 249.2 and 12.3 Hz), 156.11 (dd, JC-F = 249.9 and 11.9 Hz), 153.8, 152.1, 145.8, 135.8, 132.1, 131.9, 130.01 (d, JC-F = 13.8 Hz), 126.0 (d, JC-F = 8.5 Hz), 121.2 (2C), 115.5 (2C), 110.7 (dd, JC-F = 21.1 and 3.7 Hz), 104.2 (t, JC-F = 27.2 Hz), 73.0, 58.1, 42.9. ESI-MS m/z: calcd for C20H16 BrF2N7O2S2 566.9, found 567.8 [M + H]+.
1-(5-((2-(2,4-Difluorophenyl)-2-hydroxy-3-(1H-1,2,4-triazol-1-yl)propyl)thio)-1,3,4-thiadiazol-2-yl)-3-(p-tolyl)urea (8e)
Light-brown solid; yield: 60%; mp: 145–150 °C; 1H NMR (500 MHz, DMSO-d6, Supporting Information, Figure S11) δ: 10.38 (s, 1H), 9.46 (s, 1H), 8.32 (s, 1H), 7.78 (s, 1H), 7.56 (d, J = 8.5 Hz, 2H), 7.42 (m, 1H), 7.15 (m, 1H), 7.09 (d, J = 8.5 Hz, 2H), 6.99 (m, 1H), 6.62 (s, 1H), 4.7 (d, J = 14.5 Hz, 1H), 4.66 (d, J =14.5 Hz, 1H), 3.92 (d, J = 13.8 Hz, 1H), 3.78 (d, J = 13.8 Hz, 1H), 2.25 (s, 3H). 13C NMR (125 MHz, DMSO-d6, Supporting Information, Figure S12) δ: 162.1, 161.0 (dd, JC-F = 247.1 and 12.3 Hz), 158.1 (dd, JC-F = 244.1 and 12.5 Hz), 155.5, 152.1, 151.7, 147.2, 145.5, 137.1, 131.94 (dd, JC-F = 12.9 and 4.02 Hz), 131.1 (d, JC-F = 9.1 Hz), 129.01 (2C), 119.1 (2C), 111.0 (d, JC-F = 21.3 Hz), 104.6 (t, JC-F = 28.0 Hz), 74, 56.2, 45.1, 21.2. ESI-MS m/z: calcd for C21H19 F2N7O2S2 503.10, found 504.1 [M + H]+. Purity of the compound was further confirmed by RP-HPLC. Rt = 18.81 min (97% pure; Supporting Information, Figure S13).
1-(3-Chlorophenyl)-3-(5-((2-(2,4-difluorophenyl)-2-hydroxy-3-(1H-1,2,4-triazol-1-yl)propyl)thio)-1,3,4-thiadiazol-2-yl)urea (8f)
Light-brown solid; yield: 60%; mp: 148–155 °C; 1H NMR (500 MHz, DMSO-d6, Supporting Information, Figure S14) δ: 8.92 (s, 1H), 8.36 (s, 1H), 7.83 (s, 1H), 7.76 (s, 1H), 7.44 (m, 1H), 7.38 (d, J = 8.75 Hz, 1H), 7.21–7.11 (m, 2H), 7.01–6.92 (m, 1H), 6.77 (d, J = 8.71 Hz, 1H), 4.6 (m 2H), 3.72 (d, J =13.7 Hz, 1H), 3.61 (d, J =14 Hz, 1H). 13C NMR (125 MHz, DMSO-d6) δ: 163.1, 158.9 (dd, JC-F = 243.3 and 11.1 Hz), 160.2 (dd, JC-F = 240.8 and 12.5 Hz), 157.1, 156.3, 154.2, 151, 147.1, 143.4, 129.8 (d, JC-F = 12.5 Hz), 1128.5 (d, JC-F = 8 Hz), 126.3, 115.4, 112.4, 111.8, 107.5 (d, JC-F = 21.1 Hz), 103.5 (t, JC-F = 27.1 Hz), 67.0, 56.9, 43.5. ESI-MS m/z: calcd for C20H16 ClF2N7O2S2 523.1, found 524.1 [M + H]+.
1-(5-((2-(2,4-Difluorophenyl)-2-hydroxy-3-(1H-1,2,4-triazol-1-yl)propyl)thio)-1,3,4-thiadiazol-2-yl)-3-(3-fluorophenyl)urea (8g)
Light-brown solid; yield: 56%; mp: 150–153 °C; 1H NMR (500 MHz, DMSO-d6, Supporting Information, Figure S15) δ: 9.52 (s, 1H), 9.0 (s, 1H), 8.38 (s, 1H), 7.78 (s, 1H), 7.71 (s, 1H), 7.65 (m, 1H), 7.45 (m, 1H), 7.23 (m, 1H), 7.19–7.12 (m, 2H), 6.99 (m, 1H), 6.55 (m, 1H), 4.67 (d, J = 14.5 Hz, 1H), 4.64 (d, J = 14.5 Hz, 1H), 3.77 (d, J = 14 Hz, 1H), 3.62 (d, J = 14 Hz, 1H). 13C NMR (125 MHz, DMSO-d6, Supporting Information, Figure S16) δ: 172.4, 164.5 (d, JC-F = 240.8 Hz), 162.5 (dd, JC-F = 246.8 and 12.5 Hz), 161.4 (dd, JC-F = 245.1 and 12.1 Hz), 158.6, 152.3, 149.6, 148.4, 146 (d, JC-F = 11.0 Hz), 145.1 (dd, JC-F = 12.1 and 2.9 Hz), 131.2 (d, JC-F = 9.3 Hz), 130.1 (d, JC-F = 8.3 Hz), 114.1, 112 (d, JC-F = 21.3 Hz), 106.2 (d, JC-F = 24.3 Hz), 104.5 (d, JC-F = 21.1 and 12.3 Hz), 74.0 (t, JC-F = 27.1 Hz), 57, 56.2, 43.5. ESI-MS m/z: calcd for C20H16 F3N7O2S2 507.0, found 508.1 [M + H]+. Purity of the compound was further confirmed by RP-HPLC. Rt = 17.65 min (97% pure; Supporting Information, Figure S17).
1-(5-((2-(2,4-Difluorophenyl)-2-hydroxy-3-(1H-1,2,4-triazol-1-yl)propyl)thio)-1,3,4-thiadiazol-2-yl)-3-(3-methoxyphenyl)urea (8h)
Light-brown solid; yield: 60%; mp: 140–145 °C; 1H NMR (500 MHz, DMSO-d6, Supporting Information, Figure S18) δ: 10.73 (s, 1H), 8.72 (s, 1H), 8.31 (s, 1H), 7.77 (s, 1H), 7.48–7.37 (m, 2H), 7.29 (d, J = 8.1 Hz, 1H), 7.19 (d, J = 8.1 Hz, 1H), 7.18–7.12 (m, 2H), 6.99 (m, 1H), 6.56 (s, 1H), 4.7 (d, J = 14.8 Hz, 1H), 4.65 (d, J = 14.8 Hz, 1H), 3.93 (d, J = 13.8 Hz, 1H), 3.77 (d, J = 13.8 Hz, 1H), 3.75 (s, 3H). 13C NMR (125 MHz, DMSO-d6, Supporting Information, Figure S19) δ: 164.1, 161, 160.2 (dd, JC-F = 245.03 and 12.6 Hz), 158 (dd, JC-F = 247.1 and 12.3 Hz), 157.9, 155.3, 151.9, 145.4, 141.2, 131.3 (d, JC-F = 13.3 Hz), 130.1, 126.3 (dd, JC-F = 9.1 and 5.3 Hz), 115.1, 113, 110 (dd, JC-F = 20.1 and 3.1 Hz), 107.2, 104.1 (dd, JC-F = 27.1 and 28.3 Hz), 74.0, 57.1, 55.2, 43.6. ESI-MS m/z: calcd for C21H19 F2N7O3S2 519.09, found 520.1 [M + H]+. Purity of the compound was further confirmed by RP-HPLC. Rt = 20.33 min (96% pure; Supporting Information, Figure S20).
1-(5-((2-(2,4-Difluorophenyl)-2-hydroxy-3-(1H-1,2,4-triazol-1-yl)propyl)thio)-1,3,4-thiadiazol-2-yl)-3-(m-tolyl)urea (8i)
Light-brown solid; yield: 65%; mp: 138–145 °C; 1H NMR (500 MHz, DMSO-d6, Supporting Information, Figure S21) δ: 10.73 (s, 1H), 8.72 (s, 1H), 8.32 (s, 1H), 7.78 (s, 1H), 7.41 (m, 1H), 7.29 (d, J = 8.01 Hz, 1H), 7.19 (d, J =8 Hz, 1H), 7.18–7.12 (m, 2H), 6.99 (m, 1H), 6.72 (s, 1H), 6.56 (s, 1H), 4.7 (d, J = 15 Hz, 1H), 4.66 (d, J =15 Hz, 1H), 3.92 (d, J =14 Hz, 1H), 3.77 (d, J =14 Hz, 1H), 2.25 (s, 3H). 13C NMR (125 MHz, DMSO-d6, Supporting Information, Figure S22) δ: 164.3, 161.2 (dd, JC-F = 246.3 and 12.3 Hz), 160.2 (dd, JC-F = 243.9 and 12.7 Hz), 158.1, 157.8, 155.5, 152, 145.5, 141.3, 131.4 (d, JC-F = 12.8 Hz), 130 (d, JC-F = 8.1 Hz), 126.2, 115.0, 113.2, 111.4, 107.1 (d, JC-F = 20.3 Hz), 103.9 (t, JC-F = 27.4 Hz), 67.0, 56.9, 43.5, 24.5. ESI-MS m/z: calcd for C21H19 F2N7O2S2 503.1, found 504.1 [M + H]+. Purity of the compound was further confirmed by RP-HPLC. Rt = 20.63 min (98% pure; Supporting Information, Figure S23).
1-(5-((2-(2,4-Difluorophenyl)-2-hydroxy-3-(1H-1,2,4-triazol-1-yl)propyl)thio)-1,3,4-thiadiazol-2-yl)-3-(3-(trifluoromethyl)phenyl)urea (8j)
Pale-yellow solid; yield: 69%; mp: 125–130 °C; 1H NMR (500 MHz, DMSO-d6, Supporting Information, Figure S24) δ: 11.3 (s, 1H), 9.25 (s, 1H), 8.33 (s, 1H), 8.28 (s, 1H), 7.99 (d, J = 8.1, 1H), 7.79 (s, 1H), 7.55 (m, 1H), 7.43 (dd, J = 8.1, J = 7.9 Hz,1H), 7.33 (d, J =7.8 Hz, 1H), 7.15 (m, 1H), 6.99 (m, 1H), 6.59 (s, 1H), 4.75 (d, J = 14.5 Hz, 1H), 4.69 (d, J = 14.5 Hz,1H), 4.01 (d, J = 13.5 Hz, 1H), 3.83 (d, J =13.5 Hz, 1H). 13C NMR (125 MHz, DMSO-d6, Supporting Information, Figure S25) δ: 161.2, 160.4 (dd, JC-F = 246.6 and 12.5 Hz), 158.1 (dd, JC-F = 242.7 and 13.1 Hz), 156.1, 155.9, 151.8, 145, 141.1, 130.7 (q, JC-F = 16.6 Hz), 129.9 (d, JC-F = 12.9 Hz), 125.9 (d, JC-F = 8.6 Hz), 124.9, 123.6 (q, JC-F = 3.7 Hz), 122.2, 118.3 (q, JC-F = 236.7 Hz), 114.7 (q, JC-F = 2.3 Hz), 111.4 (d, JC-F = 20.7 Hz), 104.7 (t, JC-F = 25.9 Hz), 74.7, 56.8, 42.5. ESI-MS m/z: calcd for C21H16 F5N7O2S2 557.0, found 558.0 [M + H]+. Purity of the compound was further confirmed by RP-HPLC. Rt = 21.38 min (95% pure; Supporting Information, Figure S26).
1-(5-((2-(2,4-Difluorophenyl)-2-hydroxy-3-(1H-1,2,4-triazol-1-yl)propyl)thio)-1,3,4-thiadiazol-2-yl)-3-(2-(trifluoromethyl)phenyl)urea (8k)
Brown solid; yield: 43%; mp: 120–125 °C; 1H NMR (500 MHz, DMSO-d6, Supporting Information, Figure S27) δ: 10.35 (s, 1H), 9.36 (s, 1H), 8.35 (s, 1H), 7.79 (s, 1H), 7.47–7.37 (m, 2H), 7.30–7.22 (m, 2H), 7.20–7.10 (m, 2H), 7.02–6.92 (m, 2H), 4.75 (d, J = 14.5 Hz, 1H), 4.69 (d, J = 14.5 Hz,1H), 3.83 (d, J = 13.6 Hz, 1H), 3.64 (d, J = 13.6 Hz, 1H). 13C NMR (125 MHz, DMSO-d6, Supporting Information, Figure S28) δ: 161.4, 160.5 (dd, JC-F = 245.9 and 12.4 Hz), 158.3 (dd, JC-F = 243.1 and 12.8 Hz), 156.2, 151.7, 145.4, 141.1, 130.6, 129.8 (d, JC-F = 13.1 Hz), 127.5 (q, JC-F = 4.4 Hz), 125.2 (d, JC-F = 8.3 Hz), 123.6 (q, JC-F = 3.1 Hz), 119.9 (q, JC-F = 241.2 Hz), 118.3, 116.7 (q, JC-F = 19.5 Hz), 114.8, 111.5 (d, JC-F = 19.7 Hz), 104.6 (t, JC-F = 24.8 Hz), 74.6, 56.6, 42.5. ESI-MS m/z: calcd for C21H16 F5N7O2S2 557.0, found 558.0 [M + H]+. Purity of the compound was further confirmed by RP-HPLC. Rt = 22.2 min (98% pure; Supporting Information, Figure S29).
1-(2-Chlorophenyl)-3-(5-((2-(2,4-difluorophenyl)-2-hydroxy-3-(1H-1,2,4-triazol-1-yl)propyl)thio)-1,3,4-thiadiazol-2-yl)urea (8l)
Light-brown solid; yield: 45%; mp: 125–130 °C; 1H NMR (500 MHz, DMSO-d6, Supporting Information, Figure S30) δ: 8.35 (s, 1H), 8.18 (d, J =8.3, 1H) 7.79 (s, 1H), 7.49–7.39 (m, 2H), 7.30–7.22 (m, 1H), 7.20–7.10 (m, 1H), 7.05–6.95 (m, 2H), 6.8 (bs, 1H), 4.75 (d, J = 14.5 Hz, 1H), 4.69 (d, J = 14.5 Hz,1H), 3.83 (d, J = 13.6 Hz, 1H), 3.64 (d, J = 13.6 Hz, 1H). 13C NMR (125 MHz, DMSO-d6, Supporting Information, Figure S31) δ: 164, 162 (dd, JC-F = 246.3 and 12.4 Hz), 158 (dd, JC-F = 244.7 and 12.4 Hz), 155.5, 155, 151, 145, 136.2, 131.2 (dd, JC-F = 12.6 and 3.7 Hz), 130.1, 128.1, 125.2 (dd, JC-F = 8.9 and 5.1 Hz), 123.5, 122, 121.4, 111.6 (dd, JC-F = 20.3 and 3.3 Hz), 104 (dd, JC-F = 26.1 and 27.3 Hz), 74, 56.3, 42. ESI-MS m/z: calcd for C20H16 ClF2N7O2S2 523.0, found 524.0 [M + H]+. Purity of the compound was further confirmed by RP-HPLC. Rt = 23.14 min (97% pure; Supporting Information, Figure S32).
1-(2-Bromophenyl)-3-(5-((2-(2,4-difluorophenyl)-2-hydroxy-3-(1H-1,2,4-triazol-1-yl)propyl)thio)-1,3,4-thiadiazol-2-yl)urea (8m)
Brown solid; yield: 48%; mp: 157–163 °C; 1H NMR (500 MHz, DMSO-d6, Supporting Information, Figure S33) δ: 11.61 (s, 1H), 10.62 (s, 1H), 8.37 (s, 1H), 8.2 (d, J =8.1, 1H), 7.81 (s, 1H), 7.45 (m, 2H), 7.27 (m, 1H), 7.16 (m, 1H), 7.01 (m, 2H), 6.79 (bs, 1H), 4.73 (d, J = 14.5 Hz, 1H), 4.67 (d, J = 14.5 Hz,1H), 3.81 (d, J = 13.6 Hz, 1H), 3.65 (d, J = 13.6 Hz, 1H). 13C NMR (125 MHz, DMSO-d6) δ: 162, 161 (dd, JC-F = 240.2 and 12.1 Hz), 157.5 (dd, JC-F = 245.3 and 12.3 Hz), 156.1, 154, 150, 144, 135.9, 131.4 (dd, JC-F = 12.0 and 4.1 Hz), 131.2, 128.3, 124.7 (dd, JC-F = 8.7 and 5.1 Hz), 123.6, 122, 123.6, 112.0 (dd, JC-F = 21.1 and 3.5 Hz), 105.2 (dd, JC-F = 26.3 and 26.9 Hz), 73.5, 57, 42. ESI-MS m/z: calcd for C20H16 BrF2N7O2S2 566.9, found 567.8 [M + H]+.
1-(5-((2-(2,4-Difluorophenyl)-2-hydroxy-3-(1H-1,2,4-triazol-1-yl)propyl)thio)-1,3,4-thiadiazol-2-yl)-3-(o-tolyl)urea (8n)
Light-brown solid; yield: 56%; mp: 135–138 °C; 1H NMR (500 MHz, DMSO-d6, Supporting Information, Figure S34) δ: 9.61 (s, 1H), 8.73 (s, 1H), 8.33 (s, 1H), 7.8 (s, 1H), 7.73 (d, J = 8.9 Hz, 1H), 7.46–7.39 (dd, J = 9 Hz, 1H), 7.22–7.12 (m, 3H), 7.04–6.97 (m, 2H), 6.59 (bs, 1H), 4.68 (d, J = 14.2 Hz, 1H), 4.63 (d, J = 14.2 Hz, 1H), 3.93 (d, J = 13.3 Hz, 1H), 3.76 (d, J = 13.3 Hz, 1H), 2.25 (s, 3H). 13C NMR (125 MHz, DMSO-d6, Supporting Information, Figure S35) δ: 156.5, 153.4 (dd, JC-F = 246.1 and 12.03 Hz), 151.4 (dd, JC-F = 244.1 and 11.9 Hz), 148.7, 145.6, 137, 130.7, 129.1, 126.3, 124 (dd, JC-F = 12.5 and 3.7 Hz), 122.8, 115.3 (dd, JC-F = 8.7 and 4.8 Hz), 111.8, 111.4, 105.1, 104.7 (dd, JC-F = 20.2 and 3.5 Hz), 104.3 (dd, JC-F = 26.1 and 27.3 Hz), 74.5, 56.5, 43.5, 18.6. ESI-MS m/z: calcd for C21H19 F2N7O2S2 503.1, found 504.1 [M + H]+. Purity of the compound was further confirmed by RP-HPLC. Rt = 22.12 min (97% pure; Supporting Information, Figure S36).
1-(5-((2-(2,4-Difluorophenyl)-2-hydroxy-3-(1H-1,2,4-triazol-1-yl)propyl)thio)-1,3,4-thiadiazol-2-yl)-3-phenylurea (8o)
Light-brown solid; yield: 80%; mp: 132–140 °C; 1H NMR (500 MHz, DMSO-d6, Supporting Information, Figure S37) δ: 10.5 (s, 1H), 8.6 (s, 1H), 8.35 (s, 1H), 7.8 (s, 1H), 7.72 (d, J = 8 Hz, 2H), 7.49–7.39 (m, 1H), 7.36–7.25 (dd, J = 7.8, J = 8, 2H), 7.2–7.13 (m, 1H), 7.05–6.97 (m, 2H), 6.6 (s, 1H), 4.68 (d, J = 14.5 Hz, 1H), 4.63 (d, J =14.5 Hz,1H), 3.93 (d, J =13.5 Hz, 1H), 3.76 (d, J =13.5 Hz, 1H). 13C NMR (125 MHz, DMSO-d6, Supporting Information, Figure S38) δ: 164.2, 161.1 (dd, JC-F = 248.1 and 12.4 Hz), 159 (dd, JC-F = 245.8 and 12.2 Hz), 153.3, 152.1, 145.9, 140.5, 133, 131.5 (d, JC-F = 12.9 Hz), 129.7 (d, JC-F = 8.2 Hz), 125, 122.4, 119, 112.1 (dd, JC-F = 20.1 and 2.8 Hz), 103.9 (t, JC-F = 27.1 Hz), 74.5, 56.3, 43.5. ESI-MS m/z: calcd for C20H17F2N7O2S2 489.0, found 490.0 [M + H]+. Purity of the compound was further confirmed by RP-HPLC. Rt = 20.60 min (98% pure; Supporting Information, Figure S39).
1-(2,4-Difluorophenyl)-3-(5-((2-(2,4-difluorophenyl)-2-hydroxy-3-(1H-1,2,4-triazol-1-yl)propyl)thio)-1,3,4-thiadiazol-2-yl)urea (8p)
Brown solid; yield: 65%; mp: 150–155 °C; 1H NMR (500 MHz, DMSO-d6, Supporting Information, Figure S40) δ: 11.1 (s, 1H), 10.1 (s, 1H), 8.92 (s, 1H), 8.46 (s, 1H), 7.63–7.51 (m, 2H), 7.48 (m, 1H), 7.31–7.22 (m, 2H), 7.01 (m, 1H), 6.52 (s, 1H), 4.67 (d, J = 14.89 Hz, 1H), 4.61 (d, J = 15.2 Hz, 1H), 3.71 (d, J = 13.8 Hz, 1H), 3.6 (d, J = 14.1 Hz, 1H). 13C NMR (125 MHz, DMSO-d6) δ: 162.7, 161.0, 157.9, 156.1, 153.5, 152.0, 146.6, 140.1, 135.3, 131.7, 130.2, 128.8, 125.3, 119.6, 117.1, 112.2, 104.7, 75, 57.1, 44.4. ESI-MS m/z: calcd for C20H15 F4N7O2S2 525.0, found 526.0 [M + H]+.
1-(3,4-Dichlorophenyl)-3-(5-((2-(2,4-difluorophenyl)-2-hydroxy-3-(1H-1,2,4-triazol-1-yl)propyl)thio)-1,3,4-thiadiazol-2-yl)urea (8q)
Brown solid; yield: 65%; mp: 153–160 °C; 1H NMR (500 MHz, DMSO-d6, Supporting Information, Figure S41) δ: 9.88 (s, 1H), 8.34 (s, 1H), 8.08 (s, 1H), 7.77 (s, 1H), 7.54 (d, J = 8.6, 1H), 7.47–7.42 (m, 1H), 7.39 (d, J = 8.57, 1H), 7.20–7.13 (m, 1H), 7.1 (s, 1H), 6.98 (m, 1H), 4.96–4.57 (m, 2H), 3.83 (d, J =J = 14.3 Hz, 1H), 3.66 (d, J = 14.43 Hz, 1H). 13C NMR (125 MHz, DMSO-d6) δ: 165.2, 162.7 (dd, JC-F = 247.2 and 13.5 Hz), 159.6 (dd, JC-F = 250.3 and 12.6 Hz), 157.2, 155.2, 152.7, 143.6, 140.4, 135.2, 134.01, 133.3 (d, JC-F = 14.2 Hz), 130.2, 127.3 (d, JC-F = 7.84 Hz), 119.2, 1172, 110.6 (dd, JC-F = 20.3 and 3.2 Hz), 105.9 (t, JC-F = 27.2 Hz), 75, 57.8, 44.5. ESI-MS m/z: calcd for C20H15 Cl2F2N7O2S2 557.0, found 558.0 [M + H]+.
1-(3-Chloro-4-methylphenyl)-3-(5-((2-(2,4-difluorophenyl)-2-hydroxy-3-(1H-1,2,4-triazol-1-yl)propyl)thio)-1,3,4-thiadiazol-2-yl)urea (8r)
Light-brown solid; yield: 75%; mp: 140–145 °C; 1H NMR (500 MHz, DMSO-d6, Supporting Information, Figure S42) δ: 10.6 (s, 1H), 9 (s, 1H), 8.35 (s, 1H), 7.9 (s, 1H), 7.8 (s, 1H), 7.49 (d, J = 8.2, 1H), 7.43 (m, 1H), 7.26 (d, J = 8.2, 1H), 7.15 (m, 1H), 7 (m, 1H), 6.56 (s, 1H), 4.65 (d, J = 15 Hz, 1H), 4.62 (d, J = 15 Hz, 1H), 3.73 (d, J = 14 Hz, 1H), 3.58 (d, J = 14 Hz, 1H), 2.3 (s, 3H). 13C NMR (125 MHz, DMSO-d6, Supporting Information, Figure S43) δ: 164.1, 162.0 (dd, JC-F = 246.4 and 12.6 Hz), 158.1 (dd, JC-F = 244.8 and 12.5 Hz), 157.2, 153.1, 151.9, 146.6, 139.5, 134.1, 132.9, 132 (d, JC-F = 13 Hz), 128.4, 125.1 (d, JC-F = 8.7 Hz), 118.0, 117.3, 111.4 (dd, JC-F = 20.3 and 3.2 Hz), 104.2 (t, JC-F = 27.2 Hz), 74, 56.4, 43.6, 19.3. ESI-MS m/z: calcd for C21H18 ClF2N7O2S2 537.0, found 538.0 [M + H]+. Purity of the compound was further confirmed by RP-HPLC. Rt = 19.16 min (96% pure; Supporting Information, Figure S44).
Biological Studies
Antifungal Drug
Fluconazole, voriconazole, and amphotericin B were purchased from Sigma-Aldrich.
MIC90 Determination
The MIC90 values of the synthesized compounds 8a–8r against fungal cells were determined in 96-well plates as recommended by the Clinical and Laboratory Standards Institute (CLSI) M27-A3 and M27-S4 documents.40,42 For Candida spp, suspensions were prepared in an RPMI 1640 medium (Sigma) supplemented with 0.165 M morpholinopropanesulfonic acid (MOPS, Sigma), 2% glucose, and antibiotics and adjusted to achieve OD600 of 0.12 (∼1 × 10⁶ CFU/mL); 100 μL of Candida suspension was added to the wells of 96-well microtiter plates that contained 64–0.125 μg/mL of compounds 8a–8r and the standard drug and incubated at 37 °C for 24 h. Drug-free and cell-free controls were included. Each test was performed in triplicate. The minimal inhibitory concentration (MIC90) is the concentration that inhibited 90% of the cell growth when compared to the growth control. These data are presented in Tables 1 and 2. Similarly, for filamentous fungi, spores were harvested from sporulating cultures on potato dextrose agar (PDA) and were counted using a hemocytometer to acquire the desired inoculum size. Drugs were diluted in DMSO and further in a culture medium with a similar range for yeast spp and incubated for 48 h at 37 °C. Each test was performed in triplicate.
Antibiofilm Assay
For biofilm formation, two fluconazole-resistant clinical C. albicans isolates (R1–R2) from the laboratory archive27 were first cultured on Sabouraud dextrose agar media (SDA, Difco) at 37 °C for 48 h.31 After incubation, a full loop of each colony was inoculated in Sabouraud dextrose broth (SDB) and then incubated for 72 h at 37 °C. Centrifugation (3000g, 5 min) was carried out for cell harvest, washed two times with sterile phosphate-buffered saline (PBS), and suspended in 10 mL of RPMI 1640 medium (Sigma-Aldrich, St. Louis). The optical density 600 value (OD600 = 1.0) was adjusted to approximately 106 CFU/mL suspension. Subsequently, 100 μL of Candida suspension was transferred to 96-well microtiter plates (Suzhou Conrem Biomedical Technology Co., Ltd, China) and incubated at 37 °C for 96 h. Then, the biomass quantification was assessed by MTT (Sigma) reduction.43 Each isolate was tested in triplicate. For antifungal susceptibility testing, effects of the compounds on the biofilm of fluconazole-resistant C. albicans isolates were determined using the 3-(4,5-dimethylthiazol-2-yl)-2,5-diphenyltetrazolium bromide (MTT) assay.44 A total of 200 μL of Roswell Park Memorial Institute medium (RPMI, Sigma-Aldrich) containing two compounds (64–0.125 μg/mL) was added to each well containing the Candida biofilm, and the plates were then incubated at 30 °C for 24 h, shaking at 1000g. Then, 25 μL of RPMI 1640 medium containing 5 mg of MTT (Sigma-Aldrich) was applied to the well and the plates were incubated at 37 °C for 3 h. Then, plates were centrifuged at 1000g for 10 min and supernatant solutions were aspirated. For dissolving formazan crystals, 0.1 mL of acid isopropanol was added to the plates and shaken for 5 min. To assess the viability of the C. albicans cells, the amount of formazan OD was measured at 550 nm via a microplate reader (BioRad). As background controls, wells containing Candida cell and acid propanol without menadione-formazan were prepared.31 These data are presented in Table 3.
Scanning Electron Microscopy (SEM)
The C. albicans strain biofilm was grown on disks. After 24 h of growth, disks were washed with PBS, and compounds 8b and 8c were added to their respective disks in well microplates and were incubated for 48 h at 35 °C. After incubation, the disks with covering biofilms were washed with PBS and fixed for a minimum of 3 h in 2.5% (v/v) glutaraldehyde (100 mM phosphate buffer solution, pH 7.2), followed by 1% (w/v) osmium tetraoxide for 1 h. Dehydration of the agar blocks was carried out via a graded series of ethanol (30, 50, 60, 70, 80, 90, 95, and 100%; each level was applied twice for 15 min each time) and ethanol/isoamyl acetate (3:1, 1:1, 1:3, and 100% isoamyl acetate twice for 30 min). A critical-point dryer (Sc7620, Emitech, England) was used with liquid CO2 to dry the agar blocks, and a gold-coater was applied to coat the agar blocks for 5 min. The coated samples were visualized with an accelerating voltage of 9 kV.45 These data are presented in Figure 4.
Time-Kill Studies
Time-kill assays over 24 h periods were performed to determine the fungicidal activity of the best compounds (8b and 8c). Two compounds and FLC as the positive control were tested against the fungal strain C. albicans (ATCC 10231).14 A total of 103 CFU/mL of two aliquot isolates was coated in Sabouraud dextrose agar (SDA) media and incubated at time points 0, 2, 4, 8, 16, and 24 h at 37 °C with or without two compounds at MIC values (1×, 4 × MIC). Values were mean ± SD indicative of the experiments (Figure 5). The experiments were performed in triplicate.
Hemolytic Activity Assay
The hemolytic activities of compounds 8b, 8c, and FLC were determined using previously described methods with minor modifications.14 Fresh whole human blood was collected into dipotassium EDTA-coated Vacutainer tubes and centrifuged at 500g for 5 min. The red blood cell pellets were washed in phosphate-buffered saline (PBS) (three times). The washed erythrocytes were rediluted in PBS (1:25). Then, different concentrations of compounds were prepared in DMSO and an aliquot (10 μL) of each concentration was added to diluted erythrocytes (190 μL) in a 96-well plate to achieve a final concentration of compounds ranging from 10 to 100 μM. Microcells with DMSO and Triton X-100 (2% v/v) also served as negative and positive controls, respectively. The plate was incubated at 37 °C for 120 min, and cell suspensions were centrifuged at 1000g. After collecting each supernatant (100 μL), their absorbance was measured at 500 nm. The percentage of hemolysis was calculated using the following equation: % hemolysis = [(absorbance of sample) – (absorbance of blank)] × 100/(absorbance of positive control). These data are presented in Figure 6. The experiments were performed in triplicate.
In Vitro Cytotoxicity Assays
Cytotoxicity assays were performed using the previously described MTT assay methods with minor modifications.31,46 To evaluate the cytotoxic effects of the final compounds, three mammalian cancer cell lines PANC-1, A-431, and HDF were used provided by the National Cell Bank of Iran (Pastor Institute, Tehran, Iran). Other materials and reagents were purchased from Sigma. All of the cells were cultured in RPMI 1640 medium and DMEM containing 10% FBS (Gibco, Milano, Italy). Then, a cell suspension of 8000 cells was poured into a 96-well plate and incubated in a humidified incubator containing 5% CO2 at 37 °C for 24 h. Subsequently, different concentrations (30, 60, and 100 μg/mL) of the compounds and FLC dissolved in DMSO were added to these plates and incubated for 48 h under the above conditions. Then, 0.1% DMSO and cisplatin served as negative and positive controls, respectively. After incubation, the solution containing 5% 3-(4,5-dimethyl-2-thiazolyl)-2,5-diphenyl-2H-tetrazolium bromide (MTT) was added to all of the wells and then incubated for another 4 h. Color intensity was recorded at 570 nm by a BioRad microplate reader (model 680), and the percentage of live cells was obtained by the following equation: % cell survival = [OD of sample/ OD of positive control] × 100. The experiments were performed in triplicate. These data are presented in Figure 7. For comparison between two groups, the Student t test was used with P <0.05 as statistically significant.
Membrane Permeabilization Assay
Propidium iodide (PI) dye was used as a probe because it requires compromised membranes to gain access to nucleic acids and emits fluorescence, which can be observed under a fluorescence microscope. A total of 1 × 10⁶ cells/mL C. albicans (ATCC 10231) were exposed to different concentrations (0.5, 1, and 2 μg/mL) of the two compounds at MIC values (1×, 2×, 4× MIC). The untreated cells and AMB (MIC =1 μg/mL) served as the negative and positive controls, respectively. After exposure, they were incubated for 3 h at 28 °C with constant shaking (120 rpm). The suspension was incubated with the PI solution (50 μg/mL) again for 15 min at 25 °C in the dark and then washed in phosphate-buffered saline (PBS). The microscopic analysis was carried out using fluorescence microscopy (SMZ25, Nikon, Tokyo, Japan) (excitation and emission wavelengths of 535 and 617 nm, respectively).34,47 The images were also postprocessed utilizing automatic contrast and brightness setting in Microsoft PowerPoint 2016. These data are presented in Figure 8.
In Vivo Studies
Male mice aged 6–8 weeks old and weighing within a range of 20–25 g were stored in groups of five per cage under a 12/12 hourly light–dark cycle with free access to food and water. They were kept in an animal room with about 25 °C temperature. All experiments were performed in accordance with the Guide for the Care and Use of Laboratory Animals (National Institutes of Health Publication No. 80–23, revised 2011) and were approved by the Research and Ethics Committee of Tehran University of Medical Sciences (Code: IR.TUMS.VCR.REC.1397.912).48−50 The mice were immunodepressed by IP injection of 100 mg/kg cyclophosphamide (Endoxan) in saline one day before inoculation. On day 1, the mice were infected (100 μL) with a suspension of fluconazole susceptible C. albicans (ATCC 10231) (1 × 10⁶ CFU) via IP root. One hour after infection, they were randomly divided into five groups and were treated via oral gavage once daily with freshly prepared 15 mg/kg body weight of compounds 8b, 8c, FLC, and VOR suspended in 40% DMSO, 25% tween80, and 35% olive oil (100 μL) as the vehicle. Treatment started from day 1 and continued until day 5. The control group received 100 μL of 40% DMSO, 25% tween80, and 35% olive oil. Survival was monitored for 30 days post inoculation. At the end of the study, all of the active mice were euthanized and dissected, keeping in mind all ethical considerations. The left kidneys of mice were harvested and weighed. Tissues were homogenized and serially diluted 10- to 1000-fold in sterile saline and then plated onto SDA. After incubation for 48 h, the number of colonies on each medium plate was counted to determine the number of colony-forming units (CFUs). Tissue fungal burden was calculated as CFU/gram of tissue. Differences in mean CFUs in kidneys among groups were analyzed using one-way ANOVA with a post hoc Tukey test with a P <0.05 as statistically significant for survival rate and kidney burden tests. These data are presented in Figure 12 and Table 5.
Docking Study
To investigate the best poses and possible interactions of active compounds 8b and 8c in the active site of the receptor, a molecular docking study was performed using the AutoDoc 4.2.1 program.51 The crystallographic structure of the C. albicans lanosterol 14α-demethylase (CYP51) receptor with VT-1161 (5TZ1) was retrieved from the RCSB Protein Data Bank (www.pdb.org). Marvin Sketch 15.8.1, 2015, was used for preparation and optimization of ligands. In the next step, the molecules of water and ligand were removed from macromolecules, using Discovery Studio software. Subsequently, polar hydrogens and electric charges were added to the PDB file in the auto dock program. To define the active site for docking, the receptor grid was generated with a grid box size of 40 × 40 × 40 with a spacing value of 0.375. Other parameters were chosen as default. The results of docking are analyzed based on the free energy of binding and best binding modes. The molecular visualizations were executed with the help of the Discovery Studio program 3.5 client and are presented in Figures 9 and 10.
DFT Study
The geometrical structures of all studied compounds were optimized at the B3LYP/ 6-311++g(d,p) level of theory by GAMESS software.52 The vibrational frequency calculations were performed to ensure that all structures are at the ground state. The quantitative molecular electrostatic potential analysis and independent gradient model53 were done using the Multiwfn 3.3.6 code.54
Acknowledgments
This work was supported by a grant from the research council of Tehran University of Medical Sciences (grant no: 98-02-33-42922).
Glossary
Abbreviations
- FLC
fluconazole
- VOR
voriconazole
- RAV
ravuconazole
- AMB
amphotericin B
- ATCC
American Type Culture Collection
- CLSI
Clinical and Laboratory Standards Institute
- hRBCs
human red blood cells
- PI
propidium iodide
- SAR
structure–activity relationship
- MTT
(3-(4,5-dimethylthiazol-2-yl)-2,5-diphenyltetrazolium bromide
- CFU
colony-forming unit
- SDA
Sabouraud dextrose agar
- PDA
potato dextrose agar
- SDB
Sabouraud dextrose broth
- SEM
scanning electron microscope
- ADMET
adsorption, distribution, metabolism, excretion, and toxicity
- DFT
density functional theory
- ESP
electrostatic potential
- vdW
van der Waals
- NCI
noncovalent interaction
- IGM
independent gradient model
Supporting Information Available
The Supporting Information is available free of charge at https://pubs.acs.org/doi/10.1021/acsomega.1c04016.
1H, 13C NMR, and HPLC spectra of the synthesized compounds (Figures S1–S44) (PDF)
The authors declare no competing financial interest.
Supplementary Material
References
- Pappas P. G.; Kauffman C. A.; Andes D. R.; Clancy C. J.; Marr K. A.; Ostrosky-Zeichner L.; Reboli A. C.; Schuster M. G.; Vazquez J. A.; Walsh T. J.; Zaoutis T. E.; Sobel J. D. Clinical Practice Guideline for the Management of Candidiasis: 2016 Update by the Infectious Diseases Society of America. Clin. Infect. Dis. 2016, 62, e1–e50. 10.1093/cid/civ933. [DOI] [PMC free article] [PubMed] [Google Scholar]
- Ji C.; Liu N.; Tu J.; Li Z.; Han G.; Li J.; Sheng C. Drug Repurposing of Haloperidol: Discovery of New Benzocyclane Derivatives as Potent Antifungal Agents against Cryptococcosis and Candidiasis. ACS Infect. Dis. 2019, 6, 768–786. 10.1021/acsinfecdis.9b00197. [DOI] [PubMed] [Google Scholar]
- Enoch D. A.; Yang H.; Aliyu S. H.; Micallef C.. Human Fungal Pathogen Identification; Springer: New York, 2017; Vol. 1508. [Google Scholar]
- Allen D.; Wilson D.; Drew R.; Perfect J. Azole Antifungals: 35 Years of Invasive Fungal Infection Management. Expert Rev. Anti-Infect. Ther. 2015, 13, 787–798. 10.1586/14787210.2015.1032939. [DOI] [PubMed] [Google Scholar]
- Li Z.; Liu N.; Tu J.; Ji C.; Han G.; Sheng C. Discovery of Simplified Sampangine Derivatives with Potent Antifungal Activities against Cryptococcal Meningitis. ACS Infect. Dis. 2019, 5, 1376–1384. 10.1021/acsinfecdis.9b00086. [DOI] [PubMed] [Google Scholar]
- Su H.; Han L.; Huang X. Potential Targets for the Development of New Antifungal Drugs. J. Antibiot. 2018, 71, 978–991. 10.1038/s41429-018-0100-9. [DOI] [PubMed] [Google Scholar]
- Montoya M. C.; Didone L.; Heier R. F.; Meyers M. J.; Krysan D. J. Antifungal Phenothiazines: Optimization, Characterization of Mechanism, and Modulation of Neuroreceptor Activity. ACS Infect. Dis. 2018, 4, 499–507. 10.1021/acsinfecdis.7b00157. [DOI] [PMC free article] [PubMed] [Google Scholar]
- Shafiei M.; Peyton L.; Hashemzadeh M.; Foroumadi A. History of the Development of Antifungal Azoles: A Review on Structures, SAR, and Mechanism of Action. Bioorg. Chem. 2020, 104, 104240 10.1016/j.bioorg.2020.104240. [DOI] [PubMed] [Google Scholar]
- Monk B. C.; Keniya M. V.; Sabherwal M.; Wilson R. K.; Graham D. O.; Hassan H. F.; Chen D.; Tyndall J. D. A. Azole Resistance Reduces Susceptibility to the Tetrazole Antifungal VT-1161. Antimicrob. Agents Chemother. 2019, 63, 1–19. 10.1128/AAC.02114-18. [DOI] [PMC free article] [PubMed] [Google Scholar]
- Parente-Rocha J. A.; Bailão A. M.; Amaral A. C.; Taborda C. P.; Paccez J. D.; Borges C. L.; Pereira M. Antifungal Resistance, Metabolic Routes as Drug Targets, and New Antifungal Agents: An Overview about Endemic Dimorphic Fungi. Mediators Inflammation 2017, 2017, 1–16. 10.1155/2017/9870679. [DOI] [PMC free article] [PubMed] [Google Scholar]
- Lee Y.; Puumala E.; Robbins N.; Cowen L. E. Antifungal Drug Resistance: Molecular Mechanisms in Candida Albicans and Beyond. Chem. Rev. 2020, 121, 3390–3411. 10.1021/acs.chemrev.0c00199. [DOI] [PMC free article] [PubMed] [Google Scholar]
- Peyton L. R.; Gallagher S.; Hashemzadeh M. Triazole Antifungals: A Review. Drugs Today 2015, 51, 705–718. 10.1358/dot.2015.51.12.2421058. [DOI] [PubMed] [Google Scholar]
- Howard K. C.; Dennis E. K.; Watt D. S.; Garneau-Tsodikova S.. A Comprehensive Overview of the Medicinal Chemistry of Antifungal Drugs: Perspectives and Promise; Royal Society of Chemistry, 2020; Vol. 49. 10.1039/c9cs00556k. [DOI] [PubMed] [Google Scholar]
- Thamban Chandrika N.; Shrestha S. K.; Ngo H. X.; Tsodikov O. V.; Howard K. C.; Garneau-Tsodikova S. Alkylated Piperazines and Piperazine-Azole Hybrids as Antifungal Agents. J. Med. Chem. 2018, 61, 158–173. 10.1021/acs.jmedchem.7b01138. [DOI] [PMC free article] [PubMed] [Google Scholar]
- Emami S.; Ghobadi E.; Saednia S.; Hashemi S. M. Current Advances of Triazole Alcohols Derived from Fluconazole: Design, in Vitro and in Silico Studies. Eur. J. Med. Chem. 2019, 170, 173–194. 10.1016/j.ejmech.2019.03.020. [DOI] [PubMed] [Google Scholar]
- Choi J. Y.; Podust L. M.; Roush W. R. Drug Strategies Targeting CYP51 in Neglected Tropical Diseases. Chem. Rev. 2014, 114, 11242–11271. 10.1021/cr5003134. [DOI] [PMC free article] [PubMed] [Google Scholar]
- Thamban Chandrika N.; Shrestha S. K.; Ngo H. X.; Howard K. C.; Garneau-Tsodikova S. Novel Fluconazole Derivatives with Promising Antifungal Activity. Bioorg. Med. Chem. 2018, 26, 573–580. 10.1016/j.bmc.2017.12.018. [DOI] [PMC free article] [PubMed] [Google Scholar]
- Shrestha S. K.; Garzan A.; Garneau-Tsodikova S. Novel Alkylated Azoles as Potent Antifungals. Eur. J. Med. Chem. 2017, 133, 309–318. 10.1016/j.ejmech.2017.03.075. [DOI] [PubMed] [Google Scholar]
- Sheng C.; Zhang W.; Ji H.; Zhang M.; Song Y.; Xu H.; Zhu J.; Miao Z.; Jiang Q.; Yao J.; Zhou Y.; Zhu J.; Lü J. Structure-Based Optimization of Azole Antifungal Agents by CoMFA, CoMSIA, and Molecular Docking. J. Med. Chem. 2006, 49, 2512–2525. 10.1021/jm051211n. [DOI] [PubMed] [Google Scholar]
- Keniya M. V.; Sabherwal M.; Wilson R. K.; Woods M. A.; Sagatova A. A.; Tyndall J. D. A. Crystal Structures of Full-Length Lanosterol 14α-Demethylases of Prominent Fungal Pathogens Candida Albicans and Candida Glabrata Provide Tools for Antifungal Discovery. Antimicrob. Agents Chemother. 2018, 62, e01134-18. 10.1128/AAC.01134-18. [DOI] [PMC free article] [PubMed] [Google Scholar]
- Kumari S.; Carmona A. V.; Tiwari A. K.; Trippier P. C. Amide Bond Bioisosteres: Strategies, Synthesis, and Successes. J. Med. Chem. 2020, 63, 12290–12358. 10.1021/acs.jmedchem.0c00530. [DOI] [PMC free article] [PubMed] [Google Scholar]
- Ghosh A. K.; Brindisi M. Urea Derivatives in Modern Drug Discovery and Medicinal Chemistry. J. Med. Chem. 2020, 63, 2751–2788. 10.1021/acs.jmedchem.9b01541. [DOI] [PMC free article] [PubMed] [Google Scholar]
- Konduri S.; Bhargavi D.; Prashanth J.; Krishna V. S.; Sriram D.; Rao K. P. Design and Synthesis of “Chloropicolinate Amides and Urea Derivatives” as Novel Inhibitors for Mycobacterium Tuberculosis. ACS Omega 2021, 6, 1657–1667. 10.1021/acsomega.0c05690. [DOI] [PMC free article] [PubMed] [Google Scholar]
- Hashemi S. M.; Badali H.; Faramarzi M. A.; Samadi N.; Afsarian M. H.; Irannejad H.; Emami S. Novel Triazole Alcohol Antifungals Derived from Fluconazole: Design, Synthesis, and Biological Activity Design, Synthesis, and Biological Activity. Mol. Diversity 2014, 19, 15–27. 10.1007/s11030-014-9548-0. [DOI] [PubMed] [Google Scholar]
- McCaughan J. A.; Turner D. M.; Battle R. K. Electrostatic Potential Change in a Paired Epitope: A Novel Explanation for Bw4 Antibodies in Patients with B13 (Bw4) Antigens. Transplantation 2016, 100, e32–e34. 10.1097/TP.0000000000001193. [DOI] [PubMed] [Google Scholar]
- Krzywik J.; Aminpour M.; Janczak J.; Maj E.; Moshari M.; Mozga W.; Wietrzyk J.; Tuszyński J. A.; Huczyński A. An Insight into the Anticancer Potential of Carbamates and Thiocarbamates of 10-Demethoxy-10-Methylaminocolchicine. Eur. J. Med. Chem. 2021, 215, 113282. 10.1016/j.ejmech.2021.113282. [DOI] [PubMed] [Google Scholar]
- Mardani M.; Abolghasemi S.; Darvishnia D.; Lotfali E.; Ghasemi R.; Rabiei M. M.; Fattahi A. Oral Candidiasis in Hematological Malignancy Patients: Identification and Antifungal Susceptibility Patterns of Isolates. Jundishapur J. Microbiol. 2020, 13, 1–6. 10.5812/jjm.103290. [DOI] [Google Scholar]
- Lotfali E.; Abolghasemi S.; Gatmirimotahhari F. S.; Alizadeh M.; Arab-Mazar Z. Complicated Bilateral Fungal Emphysematous Pyelonephritis in a 55-Year-Old Diabetic Female: A Case Report and Review of Literature. Curr. Med. Mycol. 2018, 4, 32–35. 10.18502/cmm.4.2.61. [DOI] [PMC free article] [PubMed] [Google Scholar]
- Lotfali E.; Firooz A.; Fattahi A.; Borzouie M.; Chalaki B.; Ghasemi R.; Rabiei M. M.; Farhadi S.; Esteghamat S. A.; Habibollahi M. Multidrug Resistant Candida Glabrata in an Oral Lichen Planus Patient. Iran. J. Dermatology 2020, 23, 120–124. 10.22034/ijd.2020.111551. [DOI] [Google Scholar]
- Wang S.; Wang Y.; Liu W.; Liu N.; Zhang Y.; Dong G.; Liu Y.; Li Z.; He X.; Miao Z.; Yao J.; Li J.; Zhang W.; Sheng C. Novel Carboline Derivatives as Potent Antifungal Lead Compounds: Design, Synthesis, and Biological Evaluation. ACS Med. Chem. Lett. 2014, 5, 506–511. 10.1021/ml400492t. [DOI] [PMC free article] [PubMed] [Google Scholar]
- Meletiadis J.; Meis J. F. G. M.; Mouton J. W.; Donnelly J. P.; Verweij P. E. Comparison of NCCLS and 3-(4,5-Dimethyl-2-Thiazyl)-2,5-Diphenyl-2H-Tetrazolium Bromide (MTT) Methods of in Vitro Susceptibility Testing of Filamentous Fungi and Development of a New Simplified Method. J. Clin. Microbiol. 2000, 38, 2949–2954. 10.1128/jcm.38.8.2949-2954.2000. [DOI] [PMC free article] [PubMed] [Google Scholar]
- Modiri M.; Khodavaisy S.; Barac A.; Akbari Dana M.; Nazemi L.; Aala F.; Salehi M.; Rezaie S. Comparison of Biofilm-Producing Ability of Clinical Isolates of Candida Parapsilosis Species Complex. J. Mycol. Med. 2019, 29, 140–146. 10.1016/j.mycmed.2019.02.003. [DOI] [PubMed] [Google Scholar]
- Fuentefria A. M.; Pippi B.; Dalla Lana D. F.; Donato K. K.; de Andrade S. F. Antifungals Discovery: An Insight into New Strategies to Combat Antifungal Resistance. Lett. Appl. Microbiol. 2018, 66, 2–13. 10.1111/lam.12820. [DOI] [PubMed] [Google Scholar]
- Seyedjavadi S. S.; Khani S.; Eslamifar A.; Ajdary S.; Goudarzi M.; Halabian R.; Akbari R.; Zare-Zardini H.; Imani Fooladi A. A.; Amani J.; Razzaghi-Abyaneh M. The Antifungal Peptide MCh-AMP1 Derived From Matricaria Chamomilla Inhibits Candida Albicans Growth via Inducing ROS Generation and Altering Fungal Cell Membrane Permeability. Front. Microbiol. 2020, 10, 3150. 10.3389/fmicb.2019.03150. [DOI] [PMC free article] [PubMed] [Google Scholar]
- Hargrove T. Y.; Friggeri L.; Wawrzak Z.; Qi A.; Hoekstra W. J.; Schotzinger R. J.; York J. D.; Peter Guengerich F.; Lepesheva G. I. Structural Analyses of Candida Albicans Sterol 14α-Demethylase Complexed with Azole Drugs Address the Molecular Basis of Azole-Mediated Inhibition of Fungal Sterol Biosynthesis. J. Biol. Chem. 2017, 292, 6728–6743. 10.1074/jbc.M117.778308. [DOI] [PMC free article] [PubMed] [Google Scholar]
- Durán-Iturbide N. A.; Díaz-Eufracio B. I.; Medina-Franco J. L. In Silico ADME/Tox Profiling of Natural Products: A Focus on BIOFACQUIM. ACS Omega 2020, 5, 16076–16084. 10.1021/acsomega.0c01581. [DOI] [PMC free article] [PubMed] [Google Scholar]
- Kamat V.; Santosh R.; Poojary B.; Nayak S. P.; Kumar B. K.; Sankaranarayanan M.; Faheem; Khanapure S.; Barretto D. A.; Vootla S. K. Pyridine- And Thiazole-Based Hydrazides with Promising Anti-Inflammatory and Antimicrobial Activities along with Their in Silico Studies. ACS Omega 2020, 5, 25228–25239. 10.1021/acsomega.0c03386. [DOI] [PMC free article] [PubMed] [Google Scholar]
- Daina A.; Michielin O.; Zoete V. SwissADME: A Free Web Tool to Evaluate Pharmacokinetics, Drug-Likeness and Medicinal Chemistry Friendliness of Small Molecules. Sci. Rep. 2017, 7, 42717 10.1038/srep42717. [DOI] [PMC free article] [PubMed] [Google Scholar]
- Irannejad H.; Emami S.; Mirzaei H.; Hashemi S. M. In Silico Prediction of ATTAF-1 and ATTAF-2 Selectivity towards Human/Fungal Lanosterol 14α-Demethylase Using Molecular Dynamic Simulation and Docking Approaches. Inf. Med. Unlocked 2020, 20, 100366 10.1016/j.imu.2020.100366. [DOI] [Google Scholar]
- Van Dijck P.; Sjollema J.; Cammue B. P. A.; Lagrou K.; Berman J.; d’Enfert C.; Andes D. R.; Arendrup M. C.; Brakhage A. A.; Calderone R.; Cantón E.; Coenye T.; Cos P.; Cowen L. E.; Edgerton M.; Espinel-Ingroff A.; Filler S. G.; Ghannoum M.; Gow N. A. R.; Haas H.; Jabra-Rizk M. A.; Johnson E. M.; Lockhart S. R.; Lopez-Ribot J. L.; Maertens J.; Munro C. A.; Nett J. E.; Nobile C. J.; Pfaller M. A.; Ramage G.; Sanglard D.; Sanguinetti M.; Spriet I.; Verweij P. E.; Warris A.; Wauters J.; Yeaman M. R.; Zaat S. A. J.; Thevissen K. Methodologies for in Vitro and in Vivo Evaluation of Efficacy of Antifungal and Antibiofilm Agents and Surface Coatings against Fungal Biofilms. Microb. Cell 2018, 5, 300–326. 10.15698/mic2018.07.638. [DOI] [PMC free article] [PubMed] [Google Scholar]
- Faraji A.; Bakhshaiesh T. O.; Hasanvand Z.; Motahari R.; Nazeri E.; Boshagh M. A.; Firoozpour L.; Mehrabi H.; Khalaj A.; Esmaeili R.; Foroumadi A. Design, Synthesis and Evaluation of Novel Thienopyrimidine-Based Agents Bearing Diaryl Urea Functionality as Potential Inhibitors of Angiogenesis. Eur. J. Med. Chem. 2020, 112942 10.1016/j.ejmech.2020.112942. [DOI] [PubMed] [Google Scholar]
- Wayne P.Clinical and Laboratory Standards Institute: Reference Method for Broth Dilution Antifungal Susceptibility Testing of Yeasts; Approved Standard; 2008, Vol. 28.
- Mosmann T. Rapid Colorimetric Assay for Cellular Growth and Survival: Application to Proliferation and Cytotoxicity Assays. J. Immunol. Methods 1983, 65, 55–63. 10.1016/0022-1759(83)90303-4. [DOI] [PubMed] [Google Scholar]
- Bizerra F. C.; Nakamura C. V.; De Poersch C.; Estivalet Svidzinski T. I.; Borsato Quesada R. M.; Goldenberg S.; Krieger M. A.; Yamada-Ogatta S. F. Characteristics of Biofilm Formation by Candida Tropicalis and Antifungal Resistance. FEMS Yeast Res. 2008, 8, 442–450. 10.1111/j.1567-1364.2007.00347.x. [DOI] [PubMed] [Google Scholar]
- Lotfali E.; Toreyhi H.; Sharabiani K. M.; Fattahi A.; Soheili A.; Ghasemi R.; Keymaram M.; Rezaee Y.; Iranpanah S. Comparison of Antifungal Properties of Gold, Silver, and Selenium Nanoparticles against Amphotericin b-Resistant Candida Glabrata Clinical Isolates. Avicenna J. Med. Biotechnol. 2020, 13, 47–50. 10.18502/ajmb.v13i1.4578. [DOI] [PMC free article] [PubMed] [Google Scholar]
- Eghtedari M.; Azimzadeh Arani M.; Sarrafi Y.; Shafiei M.; Alimohammadi K.; Safari F.; Foroumadi A. Synthesis and Antitumor Activity Evaluation of Novel Pyrimidoquinoline Derivatives. Polycyclic Aromat. Compd. 2021, 1–15. 10.1080/10406638.2021.1892778. [DOI] [Google Scholar]
- Wang K.; Dang W.; Xie J.; Zhu R.; Sun M.; Jia F.; Zhao Y.; An X.; Qiu S.; Li X.; Ma Z.; Yan W.; Wang R. Antimicrobial Peptide Protonectin Disturbs the Membrane Integrity and Induces ROS Production in Yeast Cells. Biochim. Biophys. Acta, Biomembr. 2015, 1848, 2365–2373. 10.1016/j.bbamem.2015.07.008. [DOI] [PubMed] [Google Scholar]
- Montoir D.; Guillon R.; Gazzola S.; Ourliac-Garnier I.; Soklou K. E.; Tonnerre A.; Picot C.; Planchat A.; Pagniez F.; Le Pape P.; Logé C. New Azole Antifungals with a Fused Triazinone Scaffold. Eur. J. Med. Chem. 2020, 189, 112082. 10.1016/j.ejmech.2020.112082. [DOI] [PubMed] [Google Scholar]
- Han G.; Liu N.; Li C.; Tu J.; Li Z.; Sheng C. Discovery of Novel Fungal Lanosterol 14α-Demethylase (CYP51)/Histone Deacetylase Dual Inhibitors to Treat Azole-Resistant Candidiasis. J. Med. Chem. 2020, 63, 5341–5359. 10.1021/acs.jmedchem.0c00102. [DOI] [PubMed] [Google Scholar]
- Garber J. C.Guide for the Care and Use of Laboratory Animals Eighth Edition, 8th ed.; Garber J. C., Ed.; The National Academies Press, 2011; Vol. 21. [Google Scholar]
- Allouche A. Software News and Updates Gabedit — A Graphical User Interface for Computational Chemistry Softwares. J. Comput. Chem. 2011, 32, 174–182. 10.1002/jcc.21600. [DOI] [PubMed] [Google Scholar]
- Schmidt M. W.; Baldridge K. K.; Boatz J. A.; Elbert S. T.; Gordon M. S.; Jensen J. H.; Koseki S.; Matsunaga N.; Nguyen K. A.; Su S.; Windus T. L.; Dupuis M.; Montgomery J. A. General Atomic and Molecular Electronic Structure System. J. Comput. Chem. 1993, 14, 1347–1363. 10.1002/jcc.540141112. [DOI] [Google Scholar]
- Lefebvre C.; Rubez G.; Khartabil H.; Boisson J. C.; Contreras-García J.; Hénon E. Accurately Extracting the Signature of Intermolecular Interactions Present in the NCI Plot of the Reduced Density Gradient: Versus Electron Density. Phys. Chem. Chem. Phys. 2017, 19, 17928–17936. 10.1039/c7cp02110k. [DOI] [PubMed] [Google Scholar]
- Lu T.; Chen F. Multiwfn: A Multifunctional Wavefunction Analyzer. J. Comput. Chem. 2012, 33, 580–592. 10.1002/jcc.22885. [DOI] [PubMed] [Google Scholar]
Associated Data
This section collects any data citations, data availability statements, or supplementary materials included in this article.