

Abstract
Different types of tissue injury, such as inflammatory and neuropathic conditions, cause modality-specific alternations on temperature perception. There are profound changes in peripheral sensory neurons after injury, but how patterned neuronal activities in the CNS encode injury-induced sensitization to temperature stimuli is largely unknown. Using in vivo calcium imaging and mouse genetics, we show that formalin- and prostaglandin E2-induced inflammation dramatically increase spinal responses to heating and decrease responses to cooling in male and female mice. The reduction of cold response is largely eliminated on ablation of TRPV1-expressing primary sensory neurons, indicating a crossover inhibition of cold response from the hyperactive heat inputs in the spinal cord. Interestingly, chemotherapy medication oxaliplatin can rapidly increase spinal responses to cooling and suppress responses to heating. Together, our results suggest a push–pull mechanism in processing cold and heat inputs and reveal a synergic mechanism to shift thermosensation after injury.
SIGNIFICANCE STATEMENT In this paper, we combine our novel in vivo spinal cord two-photon calcium imaging, mouse genetics, and persistent pain models to study how tissue injury alters the sensation of temperature. We discover modality-specific changes of spinal temperature responses in different models of injury. Chemotherapy medication oxaliplatin leads to cold hypersensitivity and heat hyposensitivity. By contrast, inflammation increases heat sensitivity and decreases cold sensitivity. This decrease in cold sensitivity results from the stronger crossover inhibition from the hyperactive heat inputs. Our work reveals the bidirectional change of thermosensitivity by injury and suggests that the crossover inhibitory circuit underlies the shifted thermosensation, providing a mechanism to the biased perception toward a unique thermal modality that was observed clinically in chronic pain patients.
Keywords: crossover inhibition, in vivo calcium imaging, injury, spinal cord, thermosensation
Introduction
Thermosensation is essential for survival. Activation of nociceptors in the thermosensory system signals acute pain, a warning of extreme temperatures that may cause tissue damage (Bokiniec et al., 2018; Viana and Voets, 2019). Upon injury, this system is sensitized, attracting animal's attention to prevent further damage to injured tissue. However, the sensitization can persist, leading to chronic pain, which imposes tremendous psychological and socioeconomic burdens (Basbaum et al., 2009; Viana and Voets, 2019).
Injury causes thermal allodynia (pain evoked by normally innocuous stimuli) and hyperalgesia (exaggerated pain by noxious stimuli) via both peripheral and central mechanisms (Julius and Basbaum, 2001; Basbaum et al., 2009; Latremoliere and Woolf, 2009; Zeilhofer et al., 2012; Braz et al., 2014; Prescott et al., 2014; Vriens et al., 2014). Peripheral sensitization has been shown to underlie thermal hypersensitivity (Basbaum et al., 2009; Emery et al., 2011; Abd-Elsayed et al., 2015; Emery et al., 2016; Yarmolinsky et al., 2016; Viana and Voets, 2019; MacDonald et al., 2020). For example, heat burn injury and treatment with a chemotherapeutic agent, oxaliplatin, have been shown to sensitize heat- and cold-sensitive primary afferents, respectively (Yarmolinsky et al., 2016; MacDonald et al., 2020). This includes both an increase in responsiveness of neurons that detect thermal stimuli under physiological conditions and the unmasking of novel neuronal ensembles that are normally insensitive to temperature. Moreover, these and other recent studies have demonstrated the power of using in vivo calcium imaging to reveal changes in patterned activities in persistent pain condition (Ma, 2010, 2012; Prescott and Ratte, 2012; Prescott et al., 2014; Emery et al., 2016; Chisholm et al., 2018).
In contrast to our growing knowledge on the peripheral changes under persistent pain condition, relatively little is known about how population activities in the spinal cord change after injury. The dorsal horn of the spinal cord is the initial stage where integration of somatosensory information occurs and has a complex circuit architecture (Spike et al., 2003; Ross et al., 2010; Todd, 2010; Duan et al., 2014; Bourane et al., 2015; Cui et al., 2016; Hachisuka et al., 2016; Abraira et al., 2017; Cheng et al., 2017; Koch et al., 2018). In the superficial laminae of the dorsal horn (i.e., lamina I and lamina II), >95% of the neurons are local interneurons (Spike et al., 2003; Todd, 2010). This feature indicates that the superficial spinal dorsal horn may underlie intensive interactions between distinct sensory pathways (Ma, 2010; Ross et al., 2010; Todd, 2010; McCoy et al., 2013; Duan et al., 2014; Cui et al., 2016; Cheng et al., 2017; Sun et al., 2017; Koch et al., 2018), and the plasticity occurs under persistent pain conditions (Woolf, 1983, 2011; Basbaum et al., 2009; Ross et al., 2010; Todd, 2010; Zheng et al., 2010; Prescott and Ratte, 2012; McCoy et al., 2013; Braz et al., 2014; Duan et al., 2014; Peirs et al., 2015; Cui et al., 2016; Kuner and Flor, 2017; Hughes and Todd, 2020; Peirs et al., 2021). Consistent with this notion, clinical and psychophysical studies show that differing types of injury cause sensitization of different modalities. The acute/semi-chronic stage of inflammatory pain is characterized by elevated sensitivity to heat, whereas neuropathic pain patients and people suffering from ciguatera complain of cold allodynia (Bagnis et al., 1979; Jorum et al., 2003; Huang et al., 2006; Vetter et al., 2012; Zimmermann et al., 2013; Viana and Voets, 2019). In one human psychophysical study, hypersensitivity to heat and hyposensitivity to cold are reported after ultraviolet B radiation, whereas in vivo mouse DRG imaging using the same model reveals a nonspecific increase in responsiveness to both cold and heat at the periphery (Gustorff et al., 2013; Chisholm et al., 2018). These studies indicate that information from distinct population of primary sensory neurons may undergo intense interactions in the CNS to generate biased perception toward unique modalities. Recording of population neuronal activities in the spinal cord holds the key to understanding the altered processing and interactions of somatosensory modalities after injury (Prescott et al., 2014; Ran and Chen, 2019).
In this study, using in vivo two-photon calcium imaging, we examined how the spinal responses to thermal stimuli change in different persistent pain models. We find that inflammation dramatically sensitizes responses to heating, whereas responses to cooling are actually suppressed. This decrease in cold sensitivity is largely because of a crossover inhibition from the increased activities from the heat inputs. By contrast, injection of chemotherapy medication oxaliplatin into the skin induces cold hypersensitivity and heat hyposensitivity. Together, our data suggest a push–pull balance of heat/cold sensitivity in the spinal cord, which is altered under pathologic conditions.
Materials and Methods
Animals
Young adult female (4-8 weeks) WT (C57BL/6J), Gad2Cre/+, ROSA26CAG-loxP-STOP-loxP-tdTomato, Trpv1-Dtr BAC transgenic mice (back-crossed to C57BL/6J WT mice for at least six generations) and their littermates were used for all imaging experiments (Madisen et al., 2010; Taniguchi et al., 2011; Pogorzala et al., 2013; Ran et al., 2016). Adult male (8 weeks) C57BL/6J were used for the behavioral experiment. All procedures were in accordance with the National Institutes of Health's Guide for the care and use of laboratory animals and were approved by Stanford University's Administrative Panel on Laboratory Animal Care.
Diphtheria toxin (DT) treatment
DT treatment was performed as described previously (Pogorzala et al., 2013; Ran et al., 2016). Briefly, 0.2 ml DT (1 mg/L in PBS, Sigma) solution was intraperitoneally delivered to 4-week-old Trpv1-Dtr mice daily for 5 d, followed by 2 d off, for 3 weeks. Imaging experiments were performed between 6 and 10 d after DT administration. Data from untreated WT mice, and DT-treated littermate controls were combined as no significant difference was observed between the two groups.
Surgery
Mice were anesthetized with urethane (2 mg/g, two i.p. injections, separated by 30 min). Surgery started 30 min after the second urethane injection. Corneal reflex was examined throughout the experiment, and up to 0.6 mg/g additional urethane might be given to animals with corneal reflex response. The right hindlimb was depilated with hair removal cream. Paravertebral muscles at vertebrae level T10-L1 were retracted, and spinal clamps (STS-A, Narishige) were used to stabilize the preparation by clamping the exposed vertebral column. A dorsal laminectomy was performed at vertebra level T12 to expose the spinal cord. A custom-designed plastic chamber was placed around the vertebrae and was sealed with 2% agarose to create a watertight compartment for the use of water immersion objective. The exposed spinal cord was kept at stable temperature with normal Ringer's solution (in mm as follows: 135 NaCl, 5.4 KCl, 5 HEPES, 1.8 CaCl2, pH 7.2, 30°C-32°C). The dura mater was removed, and the animal was rotated around the longitudinal axis by ∼30 degrees for imaging. Blood flow through the central vessel was closely monitored as an indicator of tissue health throughout the experiment.
Dye injections
Oregon Green 488 BAPTA-1 AM (OGB, Invitrogen, 1 mm) was dissolved in Ca2+/Mg2+ free pipette solution (in mm as follows: 150 NaCl, 2.5 KCl, 10 HEPES, pH 7.4) containing 50 μm AlexaFluor-594, 10% DMSO, and 2% (w/v) Pluronic F-127. The dye solution was filtered with 0.22 μm centrifuge filter (Millipore) and was loaded into a glass pipette. The pipette tip was targeted 70-130 μm below the surface of the spinal cord, ∼200 μm lateral to the central vessel. Superficial dorsal horn neurons were bulk-loaded for a period of 3 min by applying 900-1100 ms pulses of 15-25 psi to the pipette to pressure eject the dye at 2 or 3 sites ∼200 μm apart from each other. After dye injection, the imaging site was covered with a No. 0 glass coverslip precut to fit inside the custom chamber, sealed with 2% agarose in Ringer's solution.
Two-photon imaging
Calcium imaging experiments were performed as described previously with a two-photon microscope (Prairie Technologies) using a Nikon 16× water-immersion objective (IR, N.A. = 0.8) with 2× optical zoom (Ran et al., 2016). This provided a 438 × 438 μm FOV that was scanned at 2 Hz and recorded as a series of 256 × 256 pixel images. A Ti:Sapphire laser (Chameleon, Coherent) was tuned to 810 nm, and fluorescence emission was filtered with a 580 dcxr dichroic and hq525/70 m-2p bandpass filter, except Figure 3F, in which the tdTomato signal was imaged at 950 nm. The depilated right hindlimb was placed in a custom-designed stimulation container. The fifth digit was glued onto the bottom of the container to maintain the limb slightly stretched during stimulation. Water at the adaptation temperature (AT) was infused into the stimulation container at a flow rate of 5 ml/s. Stimulation temperature was monitored and recorded using a microprobe thermometer (BAT-12, Physitemp) with a Type-K thermocouple at 20 Hz. As is shown previously, no difference was found when the tip of the thermocouple was placed at different positions in the stimulation container (Ran et al., 2016). For each trial, the spinal cord was imaged for 20 s at the AT to obtain baseline fluorescence and noise. Then, the flow was switched to water that was preincubated at various stimulation temperatures with the same flow rate. This switch led to rapid changes of temperature in stimulation container for 15 s before the flow was switched back to AT for at least another 70 s before the next trial. The electric valves that control the switch of water flow were triggered by TriggerSync plugin (Prairie Technologies) and synchronized with the image acquisition system.
Figure 3.
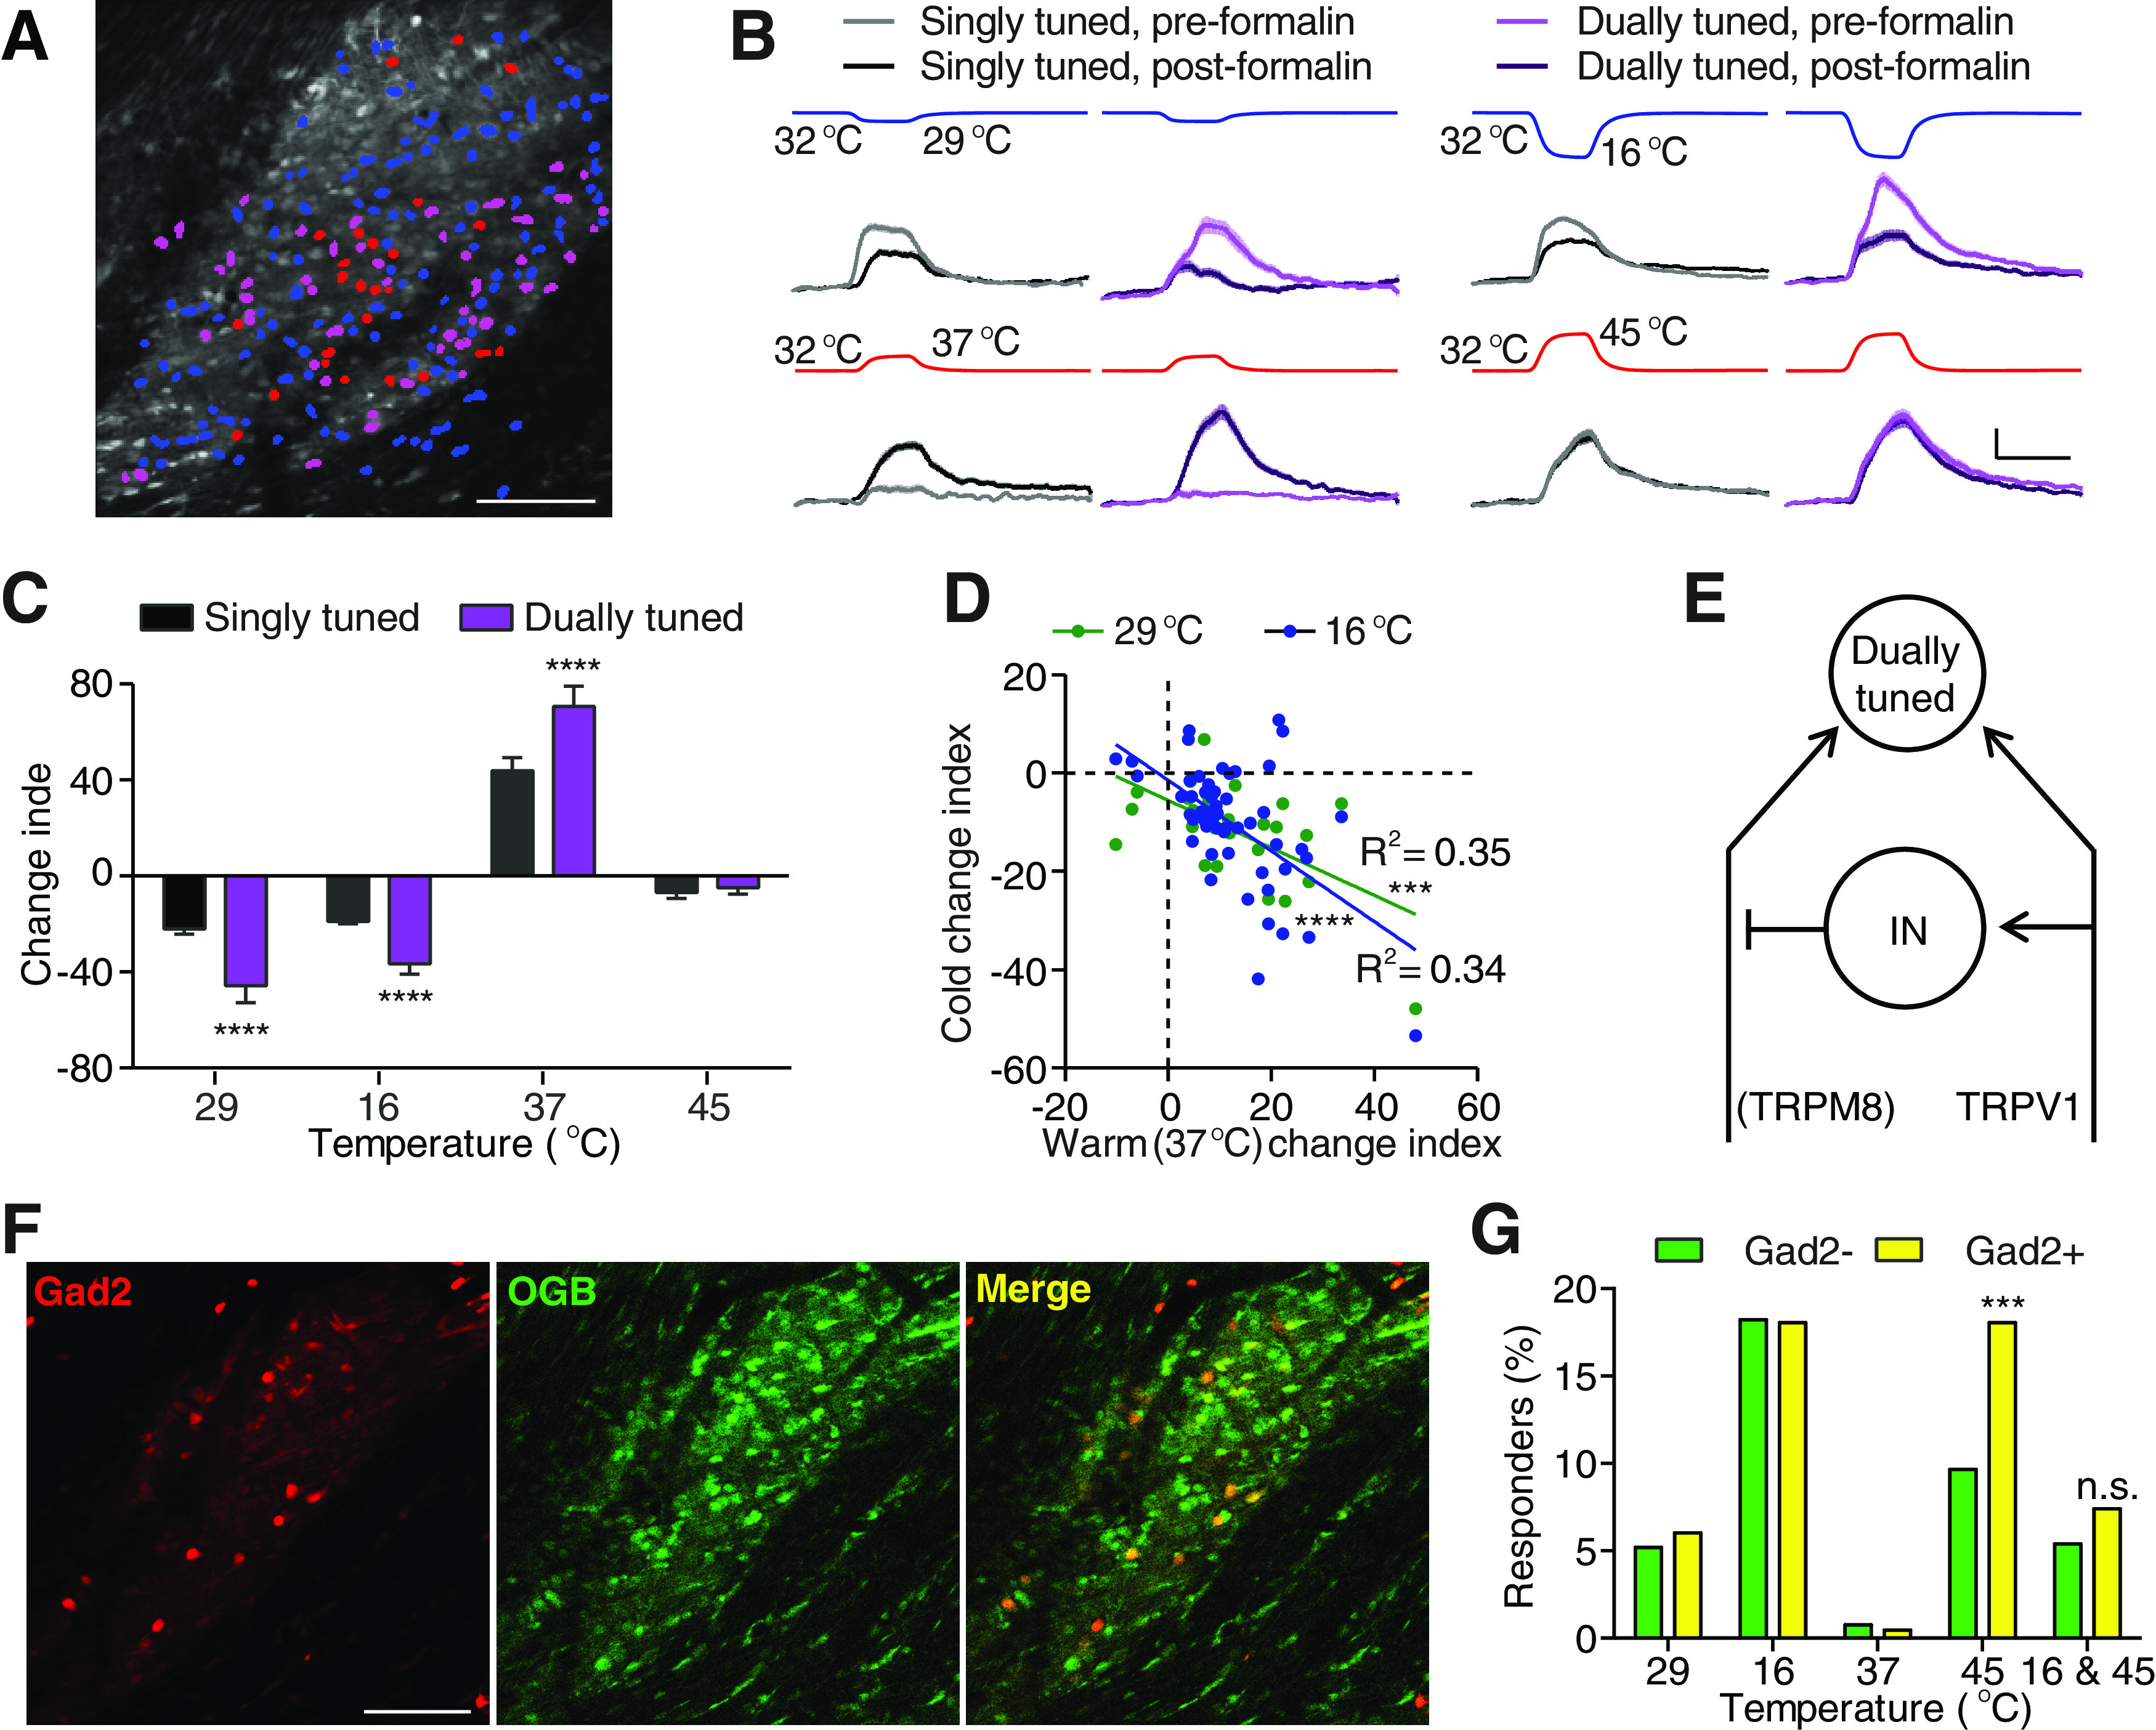
Formalin-induced thermosensory changes largely occur in dually tuned neurons. A, An example FOV image showing neurons activated by cooling to 16°C (blue), heating to 45°C (red), or both (magenta). Scale bar, 100 μm. B, Responses averaged from all singly (black) and dually (purple) tuned neurons that showed positive response to the four corresponding stimuli (recorded temperature traces shown on top) before (light traces) and after (dark traces) formalin injection. nsingle, 29°C = 94 neurons, ndual, 29°C = 45 neurons, nsingle, 16°C = 267 neurons, ndual, 16°C = 87 neurons, nsingle, 37°C = 36 neurons, ndual, 37°C = 55 neurons, nsingle, 37°C = 95 neurons, ndual, 37°C = 87 neurons, N = 6 mice. Scale bar, 20 s, 5% ΔF/F. Shaded area represents SEM. C, Quantification of response changes of neurons in B. Data are mean ± SEM. ****p < 0.0001 (Holm–Sidak's multiple comparisons test). D, Correlations between each neuron's formalin-induced change of responses to warmth (37°C) and to two cold temperatures (green represents 29°C; blue represents 16°C). Neurons that show positively responded to cold before formalin injection and to warmth before or after formalin injection were included in this analysis (P29°C = 0.0008, P16°C < 0.0001). E, A schematic summary of the spinal circuit underlying formalin-induced change of responses to cold and heat. IN: interneuron. F, An example FOV showing the labeling of tdTomato and Oregon Green 488 BAPTA-1 AM (OGB) in a Gad2Cre/+ ROSA26CAG-loxP-STOP-loxP-tdTomato mouse. Left, tdTomato labeling, indicating the expression of GAD2. Middle, OGB labeling in the same mouse. Right, Colabeling of tdTomato and OGB. Scale bar, 100 μm. G, Quantification of the percentage of Gad– (green) and Gad+ (yellow) neurons that show positive responses to one of the four temperature stimuli or to 16°C and 45°C (dually tuned) in 5 mice. ***p < 0.001 (χ2 test).
Drug injection
To assess the effects of persistent pain on responses to temperature in the spinal cord, the following drugs were intradermally injected: formalin (5%), prostaglandin E2 (PGE2, 0.1 g/L, Sigma and Cayman), oxaliplatin (4 g/L, Cayman), and saline (Rosland et al., 1990; McNamara et al., 2007; Emery et al., 2011; Deuis et al., 2013). A total volume of 5 injections (20 μl each) were made through the right hindlimb. Post-injection calcium imaging started 20 min after drug injection, and individual neurons' post-injection responses to the same stimuli were compared with their pre-injection responses.
Imaging analysis
The imaging data were analyzed as described previously (Ran et al., 2016): first, corrected lateral motion artifacts using the TurboReg plugin in ImageJ, and averaged the corrected images dataset across the entire t-series to generate a template that was used to delineate the outline of the neurons in the imaging FOV. Cell bodies were semiautomatically detected using a fast-normalized cross-correlation routine. Briefly, the averaged images were cross-correlated against a kernel with a size approximating that of an average cell; this image map was threshold to generate a binary mask that demarcated the cell bodies. The mask was then visually examined, and errors were corrected manually; ∼300 cells were detected in a typical FOV. Stimulation temperature was decimated to 1-2 Hz, generating a t-series of recorded temperature. The onset and offset of the stimulation were determined when the difference in temperature between two consecutive recorded time points exceeded 10% and 15% of the maximum/minimum difference of the t-series, respectively. Cellular fluorescence intensity (Ft) was calculated for individual neurons at each time point by averaging the intensity of pixels falling within the cell boundaries. Baseline fluorescence (F0) was assigned to each cell by averaging Ft over the 9 s period before stimulation onset. ΔF/F was calculated as ΔF/F = (Ft – F0)/F0, and the SD of the prestimulus baseline was determined (σ0). Neurons were considered responders when the maximum ΔF/F of each individual trial exceeded 5% and 2.5 times of σ0 above F0 of each individual trial, and the maximum ΔF/F of the averaged and smoothed response exceeded 5% and 3 times σ0 above F0 of the response averaged from all the trials of the same stimulus. Raw images and individual neurons' responses were visually examined, and experiments or neurons with failed image registration and irregular motion artifacts (typically thermal stimulus-induced reflex paw movement because of insufficient anesthesia) were excluded. Change index (CI) was defined as follows:
to depict the change of the responses of each neuron to the same stimulus after drug injection. All neurons that showed positive responses either before or after drug injection are included in the heatmaps and quantification.
Cold plantar assay
Behavioral responses to a cold stimulus were measured using the cold plantar test using a previously established protocol with minor modifications (Brenner et al., 2012). Briefly, mice were acclimated to the testing chamber, and 8 μl of PGE2 (0.1 g/L) or saline was injected into the plantar side of the right forepaw. Mice were returned to the testing chamber. A cold probe, made of powdered dry ice packed into a modified syringe, was applied underneath the center of the injected paw through the Plexiglas chamber floor (5.6 mm thickness). The withdrawal latency was measured by an experimenter that was blind to the treatments.
Statistics
For calcium imaging analysis, no assumptions concerning normality of equal variances were made; thus, all statistical tests used in the manuscript were nonparametric. Dunn's multiple comparison test was used for nonparametric multiple comparisons. t test was used for behavior analysis (see Fig. 4G).
Figure 4.

PGE2 sensitizes responses to warmth and desensitizes responses to cold. A, Stimulation temperature traces and heat maps showing neuronal responses evoked by the corresponding heat stimuli. Neuronal responses to 37°C (top) and 45°C (bottom) stimuli are pooled from 3 PGE2-injected mice. In each set of heat maps, neurons in the heat map with more responders are rank-ordered by their maximum response amplitudes to heat stimuli, and each row represents responses from the same neuron to the same stimuli before and after injection. Any neuron that shows a positive response either before or after injection is included in the analysis. Scale bar, 20 s. B, Scatter plots comparing maximum ΔF/F of neurons in A in response to 37°C (top) and 45°C (bottom) stimuli before and after injection. Each dot represents maximum ΔF/F before (x axis) or after (y axis) injections of saline (black) or PGE2 (red). Dashed line is diagonal, indicating no change after injection. C, Quantification of A. Data are mean ± SEM. *p < 0.05 (Mann–Whitney test). D, Stimulation temperature traces and heat maps showing neuronal responses evoked by the corresponding cold stimuli. Neuronal responses to 29°C (top) and 16°C (bottom) stimuli are pooled from 3 PGE2-injected mice. In each set of heat maps, neurons in the heat map with more responders are rank-ordered by their maximum response amplitudes to cold stimuli, and each row represents responses from the same neuron to the same stimuli before and after injection. Any neuron that shows a positive response either before or after injection is included in the analysis. Scale bar, 20 s. E, Scatter plots comparing maximum ΔF/F of neurons in D in response to 29°C (top) and 16°C (bottom) stimuli before and after injection. Each dot represents maximum ΔF/F before (x axis) or after (y axis) injections of saline (black) or formalin (blue). Dashed line is diagonal, indicating no change after injection. F, Quantification of D. Data are mean ± SEM. ****p < 0.0001 (Mann–Whitney test). G, Paw withdrawal latency in the cold plantar assay measured after intraplantar injection of saline or PGE2 (7 mice per group, mean ± SEM). *p < 0.05 (t test).
Results
In vivo calcium imaging reveals formalin-induced sensitization of spinal responses to heat
To investigate the change of population activities in the spinal cord after inflammation, we used our recently developed in vivo two-photon spinal cord calcium imaging system, which permits simultaneous recordings of hundreds of spinal neurons in anesthetized mice (Fig. 1A) (Johannssen and Helmchen, 2010; Ran et al., 2016). Precisely controlled thermal stimulation was delivered to the mouse's right hindlimb by altering flowing water's temperature from the physiological skin temperature (32°C) to various target temperatures. Robust neuronal activation in response to temperature change was observed (Ran et al., 2016). We induced inflammatory pain by intradermal formalin injection, a well-established inflammatory pain model with fast onset (Rosland et al., 1990; McNamara et al., 2007; Mogil, 2009; Shields et al., 2010; Minett et al., 2012). Peripherally, formalin injection predominantly acts via TRPA1 channel in a subset of TRPV1-expressing neurons (McNamara et al., 2007; Shields et al., 2010). Central sensitization induced by formalin injection occurs ∼15 min after injection. This fast onset and rapid engagement of central mechanisms by formalin offered an unique opportunity for us to examine the thermal sensory responses from same populations of spinal neurons before and after induction of pain (Fig. 1A) (McNamara et al., 2007; Minett et al., 2012).
Figure 1.
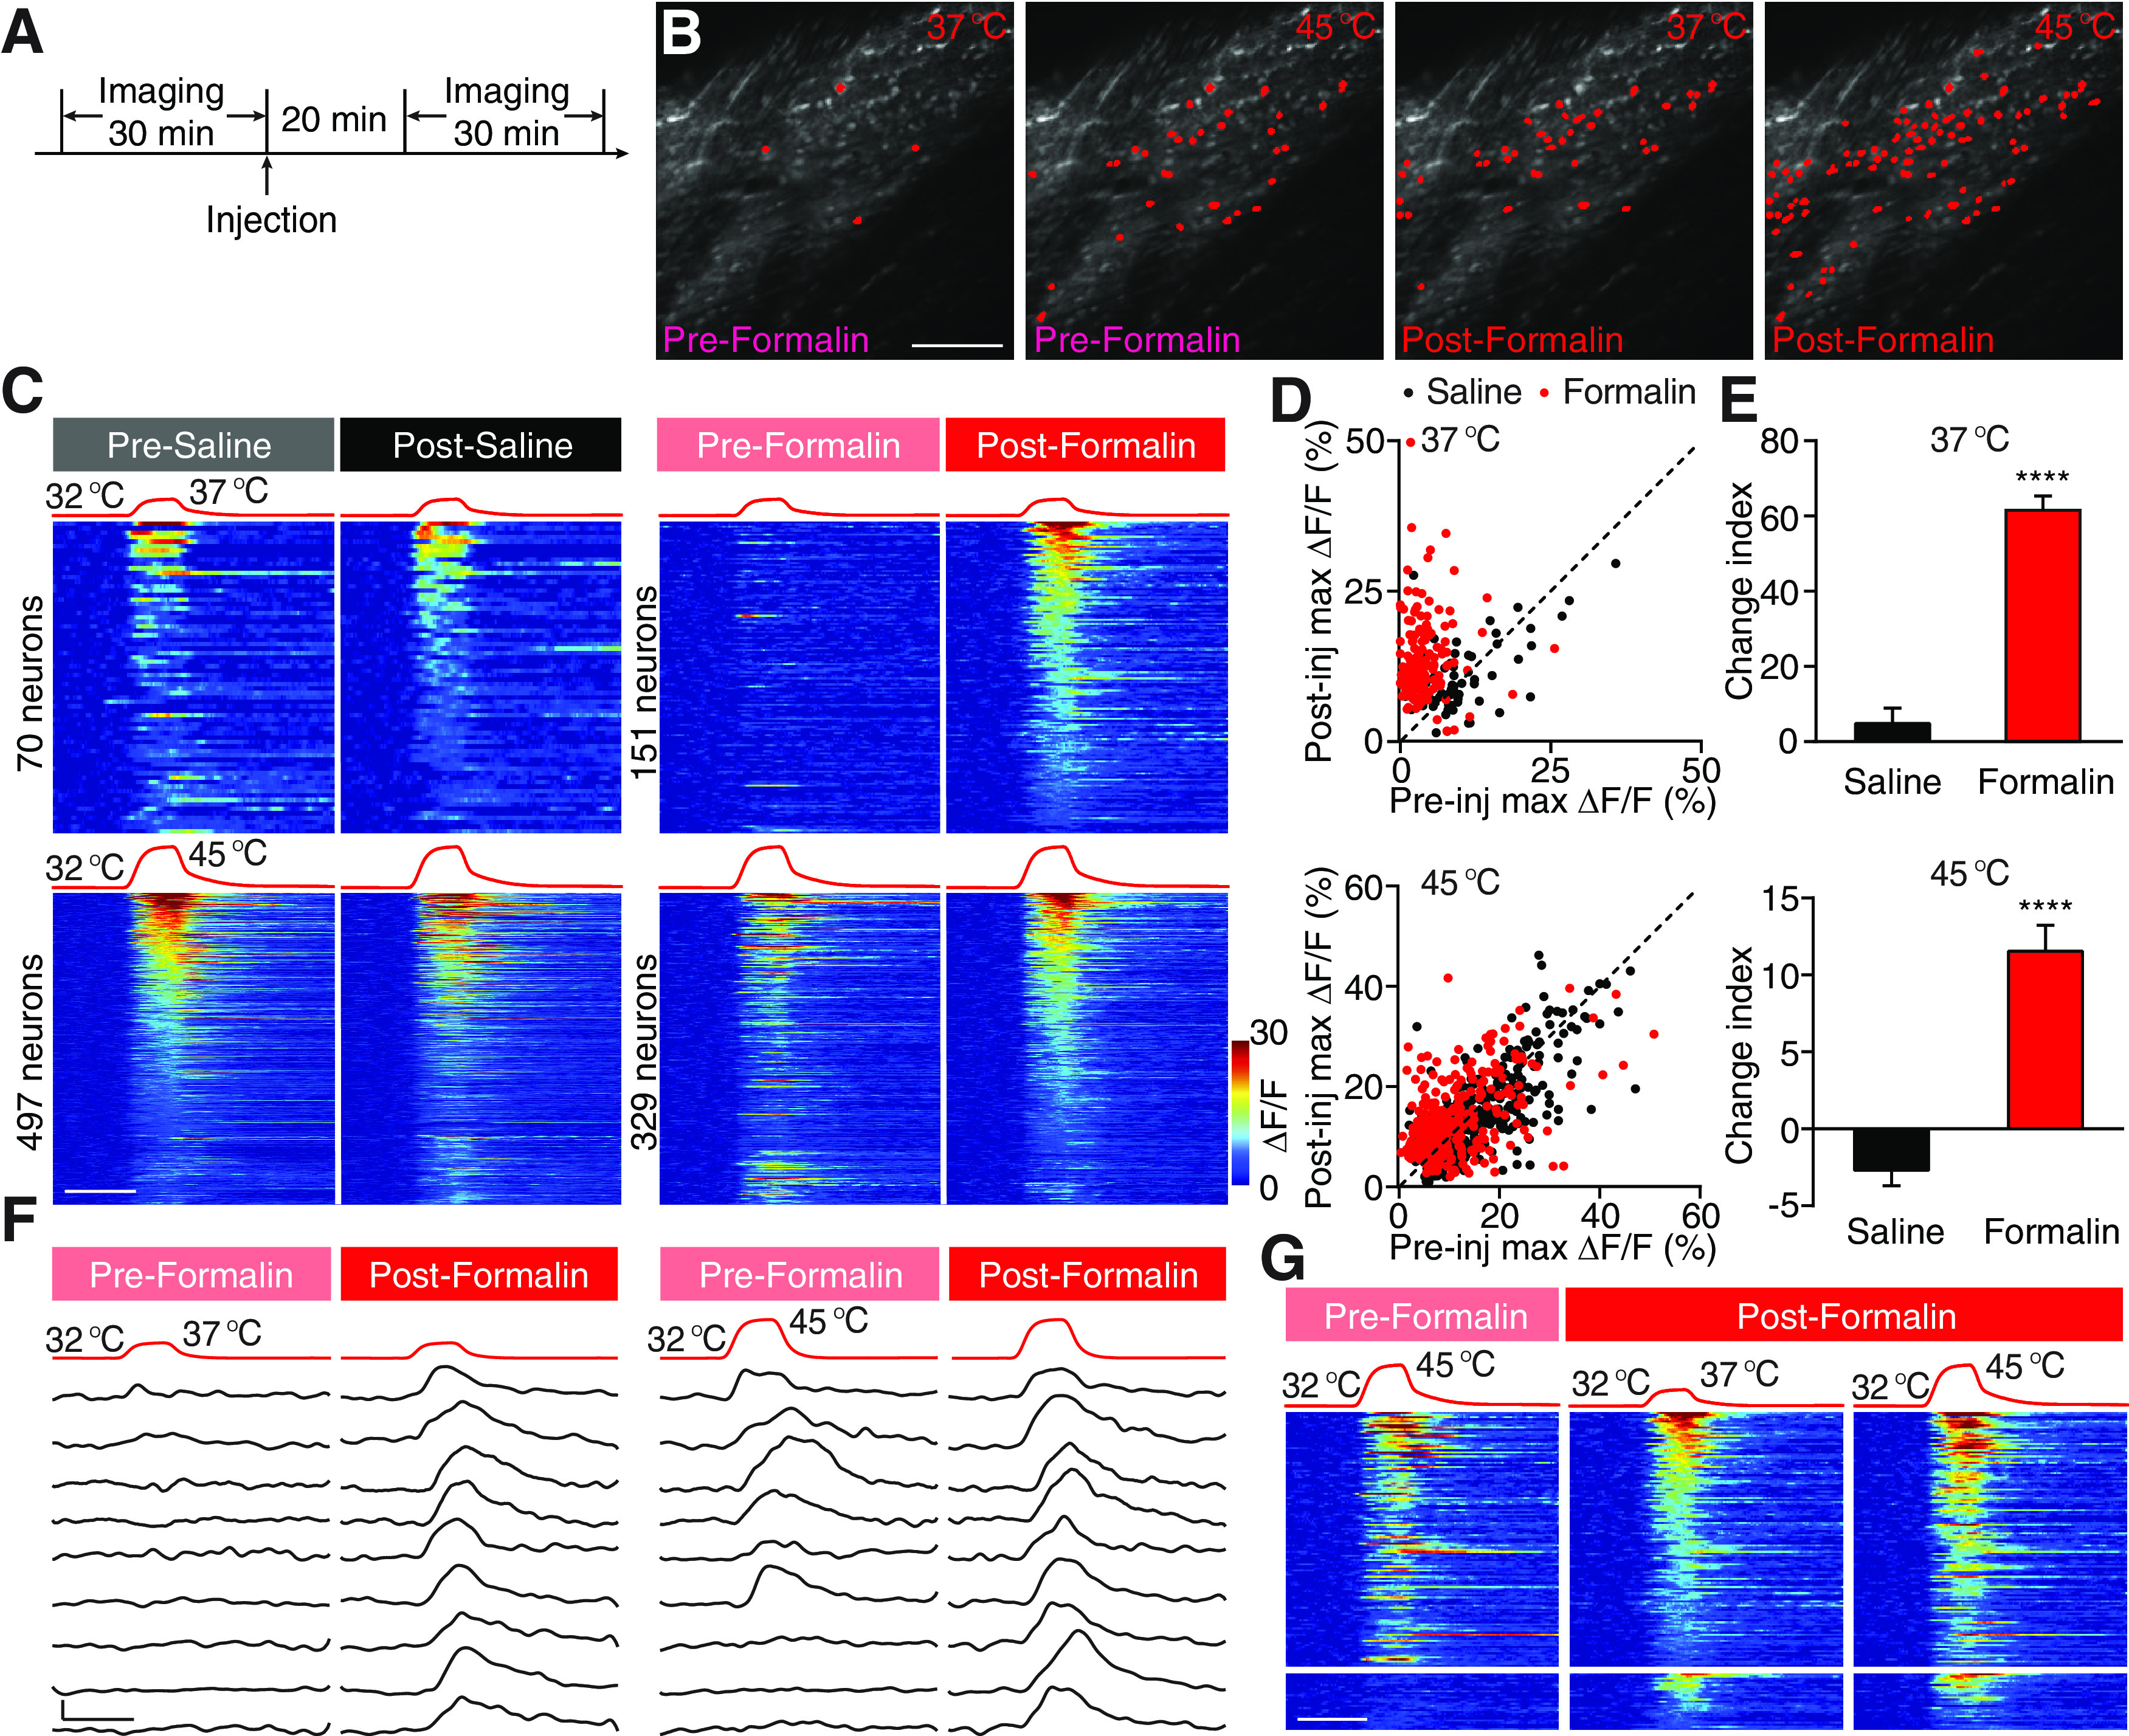
Formalin-induced heat hypersensitivity. A, Experimental schematic. B, Example fields of view (FOVs) showing neurons activated by two heat stimuli (to 37°C and 45°C) before and after formalin injection. Scale bar, 100 μm. C, Four sets of stimulation temperature traces and heat maps showing neuronal responses evoked by the corresponding stimuli. Left, Neuronal responses to 37°C (top) and 45°C (bottom) stimuli are pooled from 8 saline-injected mice. Right, Neuronal responses to the same two stimuli are pooled from 6 formalin-injected mice. In each set of heat maps, neurons in the heat map with more responders are rank-ordered by their maximum response amplitudes to heat stimuli, and each row represents responses from the same neuron to the same stimuli before and after injection. Any neuron that shows a positive response either before or after injection is included in the analysis. The averaged response amplitudes of responders to 37°C and 45°C stimuli do not differ between pre-formalin and pre-saline groups (Extended Data Figure 1-1). Scale bar, 20 s. D, Scatter plots comparing maximum ΔF/F of neurons in C in response to 37°C (top) and 45°C (bottom) stimuli before and after injection. Each dot represents maximum ΔF/F before (x axis, pre-injection) or after (y axis, post-injection) injections of saline (black) or formalin (red). Dashed line is diagonal, indicating no change after injection. E, Quantification of C. Data are mean ± SEM. The response change of each neuron by injection is depicted by a CI defined as CI = 100 × log10 (ΔF/Fmax, post-injection/ΔF/Fmax, pre-injection). ****p < 0.0001 (Mann–Whitney test). F, Stimulation temperature traces (top) and responses (bottom) of nine example neurons in response to 37°C and 45°C before (left) and after (right) formalin injection. Responses in each row are from the same neuron. The bottom three rows are example responses from silent nociceptive neurons that did not respond to 45°C (a heat stimulus) before formalin injection but responded to 37°C (a warm stimulus) after injection. Scale bar, 20 s, 10% ΔF/F. G, Left, Responses to 45°C before formalin injection. Middle, Responses to 37°C after formalin injection. Right, Responses to 45°C after formalin injection. Neurons are rank-ordered by their maximum response amplitudes to 37°C stimuli after formalin injection. Each row across the three heat maps represents responses from the same neuron. Responses from the bottom heat maps are from silent nociceptive neurons (n = 27 neurons from 6 mice). Scale bar, 20 s.
Neuronal responses to heat/warm stimuli are similar between mice before saline or formalin injections. Baseline responses to warm/heat do not significantly differ between pre-formalin and pre-saline groups. Maximum ΔF/F to 37°C (left) and 45°C (right) stimuli are pooled all neurons that showed positive responses to the respective stimuli before injections in eight saline-injected and six formalin-injected mice. Data are mean ± SEM. Download Figure 1-1, EPS file (1.2MB, eps) .
We first examined formalin-induced change of spinal responses, to 37°C and 45°C, which are perceived as warmth and noxious heat, respectively, by comparing neural response before and after formalin treatment. We defined a CI to quantify the change of the response of individual neuron to each stimulus after formalin injection (see Materials and Methods). A positive CI indicates an increase in response after formalin injection, whereas a negative CI corresponds to a decrease in response. Intradermal injection of saline did not alter neuronal responses to thermal stimuli (which was composed of similar percentages, 56% and 44%, of neurons that slightly increased and decreased their responses to the repeated stimulation, respectively; Figs. 1C, 2A). By contrast, intradermal injection of formalin dramatically increased spinal responses to 37°C, leading to a 13 times higher CI compared with that in saline-injected mice (Fig. 1B–F); 95% of responsive neurons were sensitized by formalin treatment, many of which only responded to 45°C in normal condition but acquired robust response to 37°C after treatment. This transformation in responses provides an explanation for injury induced allodynia to warm temperatures. In addition, we also observed a class of neurons (27 of 151) that were unresponsive to 45°C under normal condition became responsive to 37°C after formalin injection (Fig. 1F,G). This result is consistent with the notion that “silent” nociceptors that are only activated after tissue injury (Schmidt et al., 1995; Li and Zhuo, 1998; Smith-Edwards et al., 2016; MacDonald et al., 2020). Although the effect was smaller, we noticed that the vast majority (70%) of spinal neurons that normally respond to 45°C also exhibited significant increased activity after formalin injection, suggesting potential mechanism for heat hyperalgesia (Fig. 1B–E).
Figure 2.
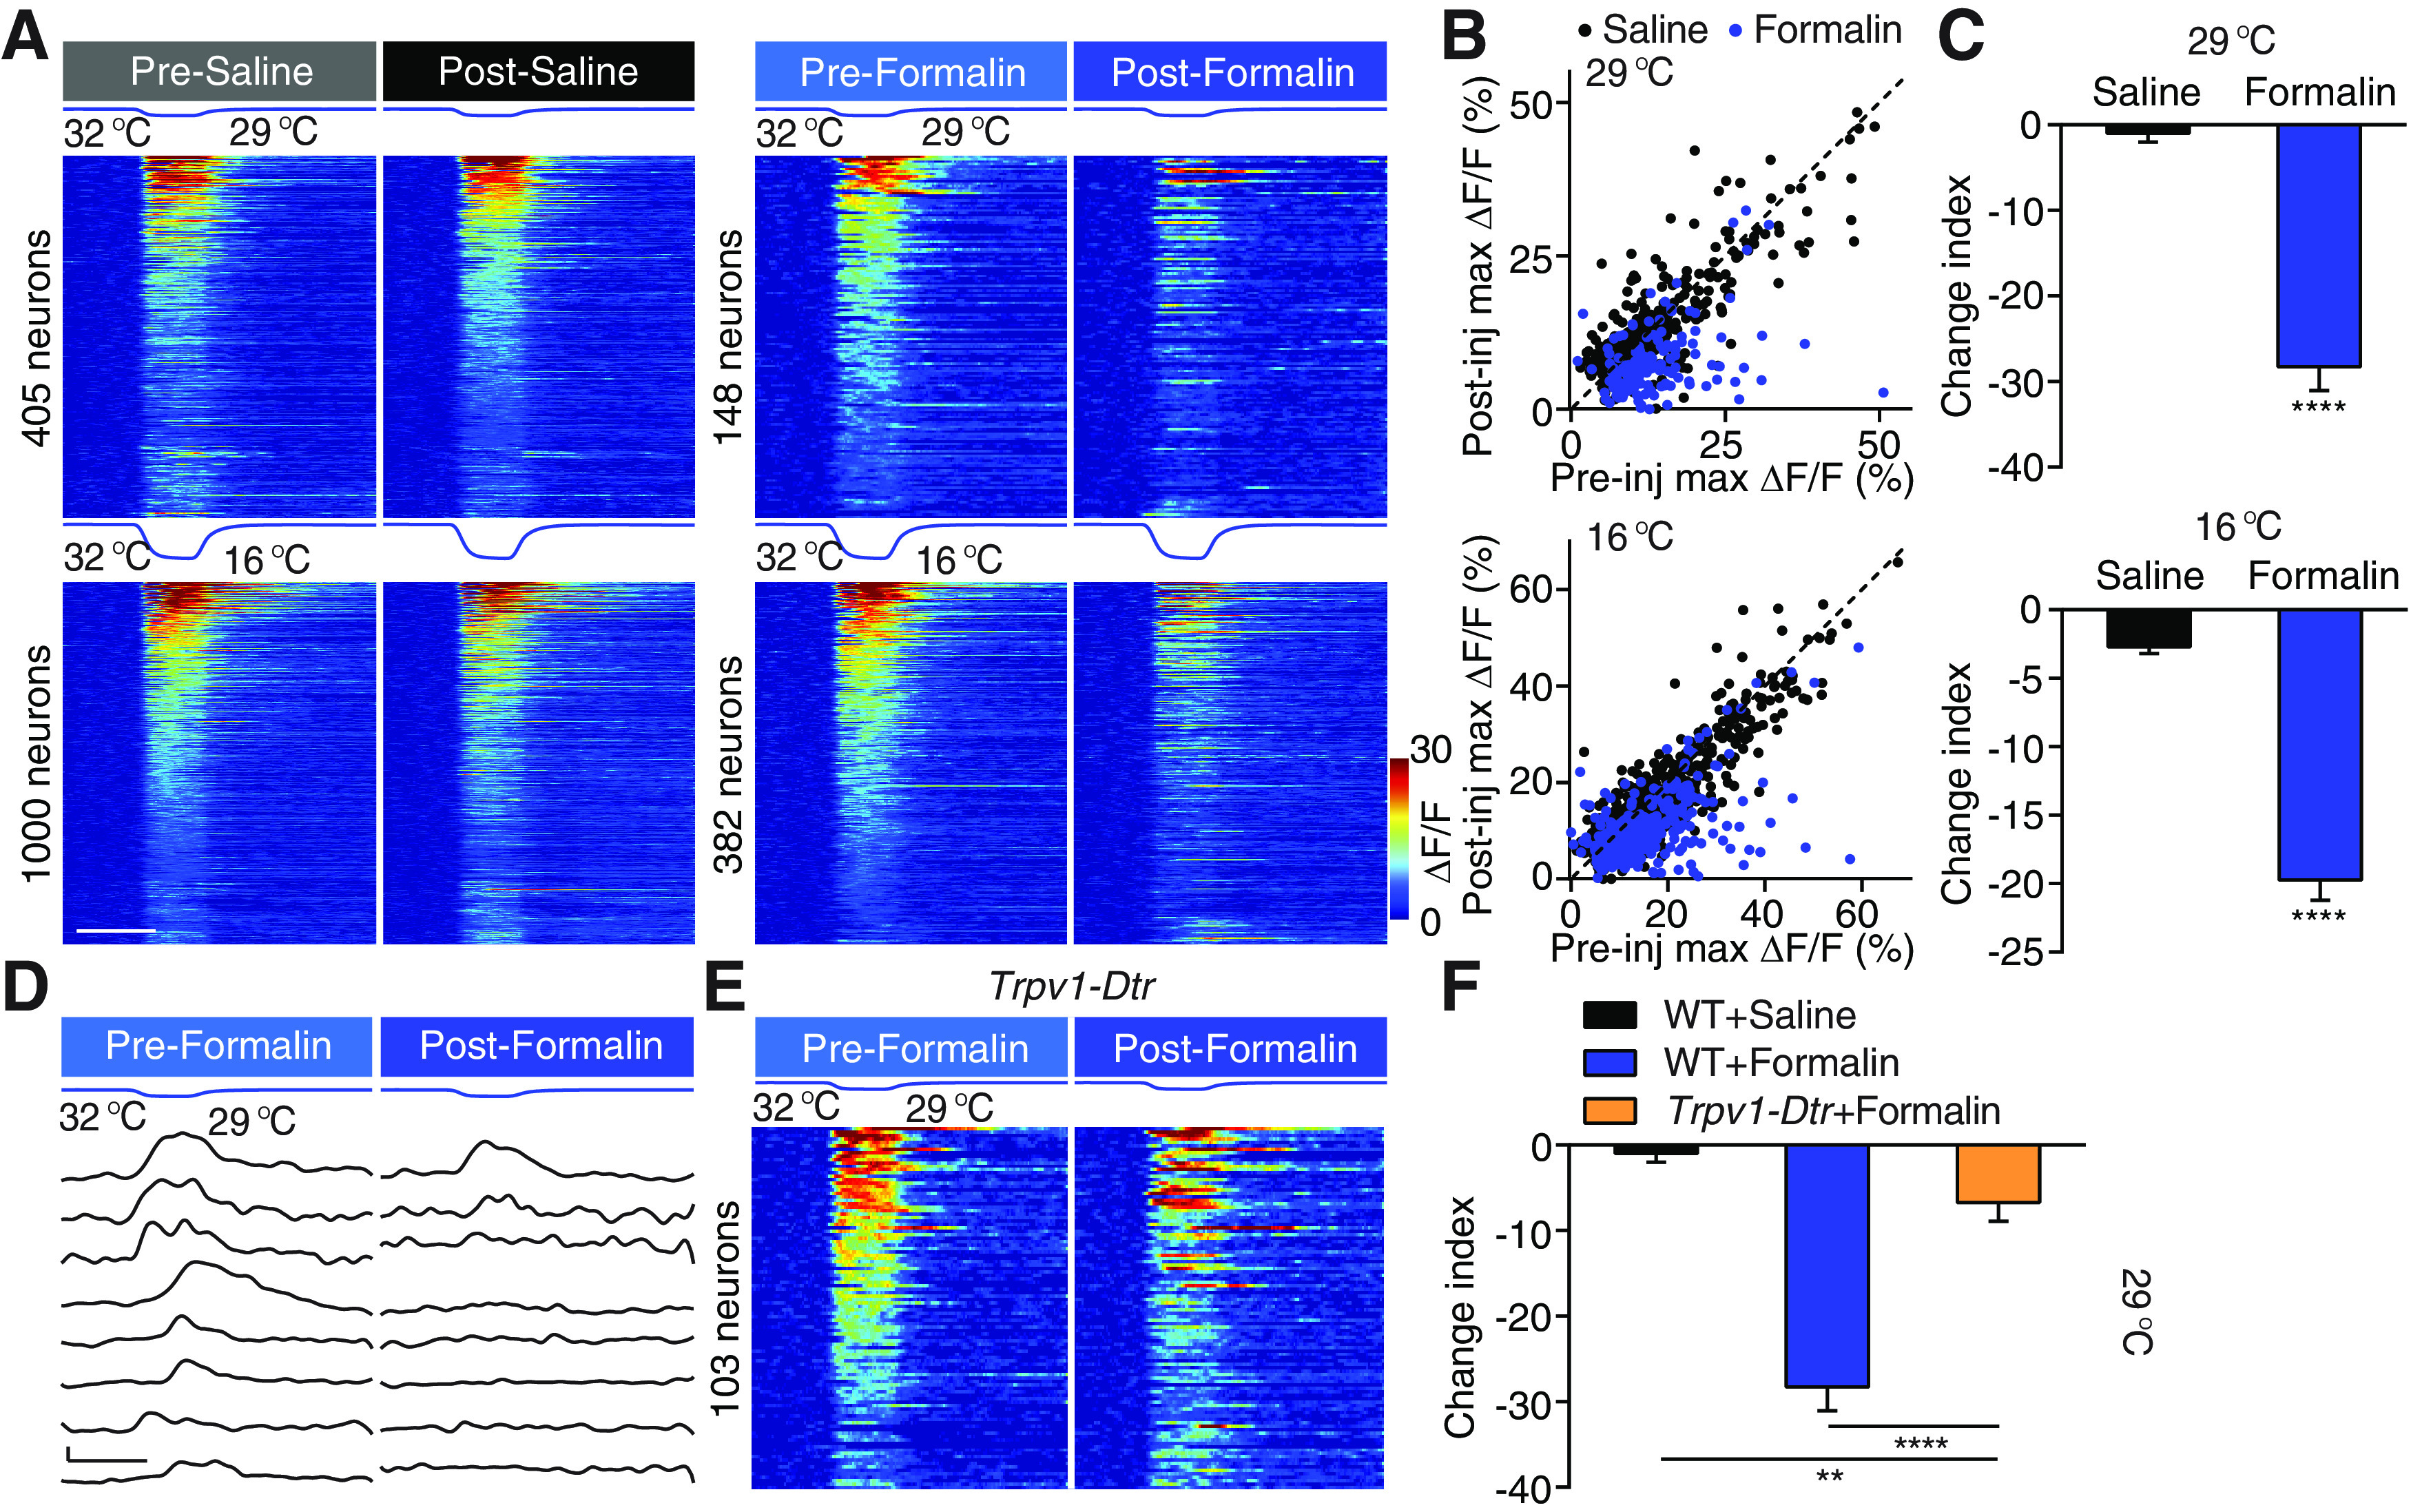
Formalin-induced cold hyposensitivity. A, Four sets of stimulation temperature traces and heat maps showing neuronal responses evoked by the corresponding stimuli. Left, Neuronal responses to 29°C (top) and 16°C (bottom) stimuli are pooled from 8 saline-injected mice. Right, Neuronal responses to the same two stimuli are pooled from 6 formalin-injected mice. In each set of heat maps, neurons in the heat map with more responders are rank-ordered by their maximum response amplitudes to cold stimuli, and each row represents responses from the same neuron to the same stimuli before and after injection. Any neuron that shows a positive response either before or after injection is included in the analysis. Scale bar, 20 s. B, Scatter plots comparing maximum ΔF/F of neurons in A in response to 29°C (top) and 16°C (bottom) stimuli before and after injection. Each dot represents maximum ΔF/F before (x axis) or after (y axis) injections of saline (black) or formalin (red). Dashed line is diagonal, indicating no change after injection. C, Quantification of A. Data are mean ± SEM. ****p < 0.0001 (Mann–Whitney test). D, Stimulation temperature traces and responses of eight example neurons in response to 29°C before and after formalin injection. Responses in each row are from the same neuron. Scale bar, 20 s, 10% ΔF/F. E, Temperature traces and heat maps showing neuronal responses evoked by cooling to 29°C before and after formalin injection in 3 Trpv1-Dtr mice. Neurons are rank-ordered by their maximum response amplitudes to the cold stimulus before formalin injection. Each row represents responses from the same neuron. Scale bar, 20 s. F, Quantification of E. WT saline and WT formalin data are the same as in Figure 2C. **p < 0.01, ****p < 0.0001; Dunn's multiple comparisons test.
Ablation of TRPV1-expressing DRG neurons eliminates formalin-induced desensitization of cold response
Contrary to well-documented changes in heat sensitization, the effects of tissue inflammation on cold sensitivity are less well characterized. Thus, we investigated effects of formalin injection on spinal responses to cold using calcium imaging. Surprisingly, formalin injection robustly suppressed rather than increased spinal response to cold (Fig. 2A–D); 86% of all cold responsive neurons were desensitized by formalin administration, leading to a 28 times lower CI at 29°C than that seen in saline-injected mice. The percentage of neurons desensitized (83%) and changes in magnitude to cold challenges at 16°C were slightly smaller but still highly significant (Fig. 2A,C). Together, these results reveal a decrease in sensitivity to cold after inflammation and suggest a modality-specific effect of tissue inflammation on temperature sensation.
What is the mechanism underlying the decreased responsiveness to cold stimuli after formalin injection? The cold-sensitive ion channel, TRPM8 channel, can be modulated directly by pro-inflammatory compounds such that its sensitivity is decreased, which in turn reduces peripheral cold inputs onto spinal neurons (Zhang et al., 2012). Alternatively, the enhanced activities in the heat pathway by formalin could exert stronger crossover inhibition onto cold-responding spinal neurons. Only in the latter case, ablation of the heat-sensing inputs should abolish the formalin-induced cold hyposensitivity. TRPV1-expressing DRG neurons provide the major afferent heat input to the spinal cord (Cavanaugh et al., 2009; Pogorzala et al., 2013; Ran et al., 2016). This population also contains TRPA1-expressing DRG neurons and serves as a major target of formalin and many other pro-inflammatory factors (McNamara et al., 2007; Shields et al., 2010). We injected DT into transgenic mice in which DT receptor is expressed specifically in TRPV1-expressing neurons (Trpv1-Dtr mice). This treatment specifically ablated TRPV1-expressing primary sensory neurons without affecting TRPM8-expressing cold-sensitive neurons, resulting in dramatically reduced spinal neuronal response and behavioral response to heat (Pogorzala et al., 2013; Ran et al., 2016). We examined the change of response to the 29°C stimulus, as ablation of TRPV1-expressing DRG neurons has no effect on spinal response to 29°C under physiological condition (Ran et al., 2016). However, we found that formalin-induced cold desensitization was significantly reduced after ablating TRPV1+ neurons (Fig. 2D,E). This result supports the hypothesis that the reduced sensitivity to cold is largely mediated by TRPV1+ heat pathway. Compared with saline controls, formalin still slightly decreased cold sensitivity in Trpv1-Dtr mice (Fig. 2D,E). This may be because of a direct suppression of the cold response in the DRG neurons or to the crossover inhibition by the TRPV1-independent heat pathway that is also sensitized by formalin injection. Together, these data suggest that inflammation-induced suppression of spinal response to cold is largely mediated by the increased crossover inhibition onto cold-sensitive neurons by formalin-induced hyperactivity of the heat input pathway.
Formalin-induced thermosensory changes largely occur in the dually tuned spinal neurons
Next, we set out to investigate the identity of spinal neurons that mediate the effect of formalin injection. The spinal cord contains singly tuned thermosensory neurons (which respond to only heat or cold) intermingled with dually tuned neurons (which respond to both heat and cold) (Fig. 3A) (Ran et al., 2016). When comparing formalin-induced change of thermosensory responses in singly versus dually tuned neurons, we found that increases in heat sensitivity and decreases in cold sensitivity in dually tuned neurons were ∼2 times larger in dually tuned neurons than in singly tuned neurons (Fig. 3B,C). Interestingly, neurons that were more sensitized to heat were the ones that were most desensitized to cold (Fig. 3D). Together, these results indicate the dually tuned neurons not only integrate heat and cold inputs under normal conditions but also are more sensitive to the plasticity changes of these two inputs after injury.
We next set out to identify the cell type of these dually tuned neurons. In the visual, olfactory, and auditory systems, inhibitory interneurons are more broadly tuned, compared with excitatory neurons (Wu et al., 2008; Kerlin et al., 2010; Isaacson and Scanziani, 2011; Liu et al., 2011; Kato et al., 2013; Miyamichi et al., 2013). Thus, we crossed Gad2Cre/+ mice with ROSA26CAG-loxP-STOP-loxP-tdTomato reporter mice (Madisen et al., 2010; Taniguchi et al., 2011). This allows us to label the vast majority of the inhibitory interneurons in the superficial dorsal horn (Fig. 3F) (Mackie et al., 2003; Zeilhofer et al., 2012). When comparing the responses of the tdTomato+ OGB+ inhibitory interneurons with the responses of tdTomato-negative, putative excitatory neurons in the same mouse, we found the percentage of dually tuned neurons did not differ across the two populations (Fig. 3F,G). Thus, the dually tuned spinal neurons were composed of both inhibitory and excitatory neurons, consistent with the heterogeneous composition of molecularly defined spinal cell types that respond to distinct types of thermal stimuli (Ran and Chen, 2019).
PGE2 sensitizes heat response and desensitizes cold response in the spinal cord
Next, we tested whether the plasticity observed after formalin was also seen in other more physiologically relevant models of inflammatory pain. PGE2 is one of the endogenous factors in the “inflammatory soup” that is released at the injury site (Smith et al., 2000; Julius and Basbaum, 2001; Smith-Edwards et al., 2016). Interestingly, a recent in vivo calcium imaging study of primary sensory neurons revealed a robust increase in their responsiveness to heat and a modest increase in its response to cold after PGE2 treatment (Emery et al., 2016). However, intradermal injection of PGE2 significantly sensitized warmth response and suppressed cold response in the spinal cord (Fig. 4A–F). This markable difference of the effects of PGE2 between DRG and spinal neurons again suggests that interaction in the spinal cord underlies the hyposensitivity to cold (Emery et al., 2016). Consistent with our imaging data, in the cold plantar assay (Brenner et al., 2012), intraplantar injection of PGE2 significantly decreased withdrawal latency to a cold stimulus applied to the injected paw (Fig. 4G). Together, our data suggest that endogenous inflammatory factor alters the spinal representations of temperature similar to formalin.
Oxaliplatin desensitizes heat response and sensitizes cold response in the spinal cord
In contrast to the warm allodynia and heat hyperalgesia under inflammatory conditions, neuropathic pain often led to cold allodynia (Jorum et al., 2003; Viana and Voets, 2019). This is one of the major side effects of platinum-based chemotherapeutic agents, such as oxaliplatin (Wilson et al., 2002; Attal et al., 2009; Descoeur et al., 2011; Forstenpointner et al., 2018; MacDonald et al., 2020). We next examined the change in spinal representations of temperatures after intradermal injection of oxaliplatin, a model that mimics the rapid onset of cold allodynia in patients (Deuis et al., 2013; MacDonald et al., 2020). Consistent with the clinical observation of rapid onset cold allodynia, we found a drastic increase in response to a strong cold (16°C) in 71% of all 16°C responders, but a small decrease in response to mild cold temperature (29°C) (Fig. 5A–C) (Wilson et al., 2002). Interestingly, this increase in response to strong cold was accompanied with a significant decrease in response to warmth (37°C) and heat (45°C) in 82% and 75% of all responsive neurons, respectively (Fig. 5D–F). These data suggest that oxaliplatin treatment causes simultaneous cold hypersensitivity and heat hyposensitivity. Notably, the heat hyposensitivity by oxaliplatin is absent in primary sensory neurons (MacDonald et al., 2020), strongly suggesting that a crossover inhibitory circuit in the spinal cord mediates the reduction of heat sensitivity after oxaliplatin treatment. Together, our results show that inflammation and oxaliplatin cause antagonistic effects on spinal response to temperature, suggesting a push–pull mechanism in processing cold and heat, the balance of which is altered under different pain conditions (Fig. 5G).
Figure 5.

Oxaliplatin sensitizes responses to strong cold and desensitizes responses to warmth and heat. A, Stimulation temperature traces and heat maps showing neuronal responses evoked by the corresponding cold stimuli. Neuronal responses to 29°C (top) and 16°C (bottom) stimuli are pooled from 5 oxaliplatin-injected mice. In each set of heat maps, neurons in the heat map with more responders are rank-ordered by their maximum response amplitudes to cold stimuli, and each row represents responses from the same neuron to the same stimuli before and after injection. Any neuron that shows a positive response either before or after injection is included in the analysis. Scale bar, 20 s. B, Scatter plots comparing maximum ΔF/F of neurons in A in response to 29°C (top) and 16°C (bottom) stimuli before and after injection. Each dot represents maximum ΔF/F before (x axis) or after (y axis) injections of saline (black) or oxaliplatin (red). Dashed line is diagonal, indicating no change after injection. C, Quantification of B. Data are mean ± SEM. *p < 0.05, ****p < 0.0001; Mann–Whitney test. D, Stimulation temperature traces and heat maps showing neuronal responses evoked by the corresponding heat stimuli. Neuronal responses to 37°C (top) and 45°C (bottom) stimuli are pooled from 5 oxaliplatin-injected mice. In each set of heat maps, neurons in the heat map with more responders are rank-ordered by their maximum response amplitudes to heat stimuli, and each row represents responses from the same neuron to the same stimuli before and after injection. Any neuron that shows a positive response either before or after injection is included in the analysis. Scale bar, 20 s. E, Scatter plots comparing maximum ΔF/F of neurons in D in response to 37°C (top) and 45°C (bottom) stimuli before and after injection. Each dot represents maximum ΔF/F before (x axis) or after (y axis) injections of saline (black) or oxaliplatin (blue). Dashed line is diagonal, indicating no change after injection. F, Quantification of E. Data are mean ± SEM. ****p < 0.0001 (Mann–Whitney test). G, A schematic summary of the spinal circuit showing the reciprocal crossover inhibition between the heat and cold pathways. IN: interneuron.
Discussion
Here we recorded population activities of spinal neurons in different animal models of pain using in vivo two-photon calcium imaging and observed modality-specific alternations of neural responses to thermal stimuli. Importantly, we found antagonism between response to heat and cold; when responses to heat increased, responses to cold decreased, and vice versa. Although hypersensitivity to one thermal modality may be partly explained by peripheral mechanisms (Emery et al., 2016; Yarmolinsky et al., 2016; MacDonald et al., 2020), the reduced sensitivity to the other modality is notably absent at the level of primary sensory neurons, using some of the exact same injury models (Emery et al., 2016; MacDonald et al., 2020). Thus, the push–pull modulation of thermosensory responses is likely implemented by the crossover inhibition between heat and cold sensory pathways in the spinal cord. Therefore, our results provide a circuit mechanism of the co-occurrence of thermal hyperalgesia and hypoesthesia that is often observed clinically (Huge et al., 2008).
Although heat and cold are two distinct modalities and are sensed by different molecular detectors in primary sensory neurons, temperature is a one-dimensional physical quantity. Stronger heat means less cold, and vice versa. It is possible that the CNS compares the activities from the heat- and cold-sensitive primary afferents to generate a one-dimensional perception. In Drosophila central thermosensory system, this computation is generated such that the warm-responding neurons receive crossover inhibition from the cool sensing inputs (Liu et al., 2015; Alpert et al., 2020). In mice, a previous study has shown that ablation of calcitonin gene-related peptide (CGRP)-expressing DRG neurons increases spinal response to cold (McCoy et al., 2013). However, it is worth noticing that CGRP is expressed not only by a subset of heat-sensitive thermoreceptors but also by cold-sensitive thermoreceptors, mechanoceptors, and pruriceptors, and most of the CGRP-expressing neurons do not express TRPV1 (Cavanaugh et al., 2009, 2011; McCoy et al., 2012; Yarmolinsky et al., 2016). Therefore, it remains inconclusive regarding the interactions between the heat and cold pathways by results of ablating CGRP-expressing primary afferents. In the current study, our results reveal a tonic crossover inhibition between two thermosensory pathways, suggesting a push–pull mechanism that maintains the normal thermosensory function. After injury, stronger hypersensitivity in one input pathway overweighs the other one. Mediated by the crossover inhibitory circuit, it shifts the sensitized perception toward one temperature modality. Indeed, it is a common practice to put a bag of ice on injured area to reduce pain and inflammation, suggesting that restoring the balance between heat and cold pathways through this push–pull circuity architecture can ease thermal allodynia and hyperalgesia.
Footnotes
The authors declare no competing financial interests.
This work was supported by the Whitehall Foundation, Terman Scholarship, Firmenich Scholarship, and National Institutes of Health Grant R21 NS101407 to X.C. We thank Liqun Luo for generous support during the entire project; Mark Hoon for supplying reagents; and Mark Hoon, Liqun Luo, Gregory Nachtrab, and Qian Wang for comments on the manuscript.
References
- Abd-Elsayed AA, Ikeda R, Jia Z, Ling J, Zuo X, Li M, Gu JG (2015) KCNQ channels in nociceptive cold-sensing trigeminal ganglion neurons as therapeutic targets for treating orofacial cold hyperalgesia. Mol Pain 11:45. 10.1186/s12990-015-0048-8 [DOI] [PMC free article] [PubMed] [Google Scholar]
- Abraira VE, Kuehn ED, Chirila AM, Springel MW, Toliver AA, Zimmerman AL, Orefice LL, Boyle KA, Bai L, Song BJ, Bashista KA, O'Neill TG, Zhuo J, Tsan C, Hoynoski J, Rutlin M, Kus L, Niederkofler V, Watanabe M, Dymecki SM, et al. (2017) The cellular and synaptic architecture of the mechanosensory dorsal horn. Cell 168:295–310.e219. 10.1016/j.cell.2016.12.010 [DOI] [PMC free article] [PubMed] [Google Scholar]
- Attal N, Bouhassira D, Gautron M, Vaillant JN, Mitry E, Lepere C, Rougier P, Guirimand F (2009) Thermal hyperalgesia as a marker of oxaliplatin neurotoxicity: a prospective quantified sensory assessment study. Pain 144:245–252. 10.1016/j.pain.2009.03.024 [DOI] [PubMed] [Google Scholar]
- Alpert MH, Frank DD, Kaspi E, Flourakis M, Zaharieva EE, Allada R, Para A, Gallio M (2020) A circuit encoding absolute cold temperature in drosophila. Curr Biol 30:2275–2288 e2275. [DOI] [PMC free article] [PubMed] [Google Scholar]
- Bagnis R, Kuberski T, Laugier S (1979) Clinical observations on 3,009 cases of ciguatera (fish poisoning) in the South Pacific. Am J Trop Med Hyg 28:1067–1073. 10.4269/ajtmh.1979.28.1067 [DOI] [PubMed] [Google Scholar]
- Basbaum AI, Bautista DM, Scherrer G, Julius D (2009) Cellular and molecular mechanisms of pain. Cell 139:267–284. 10.1016/j.cell.2009.09.028 [DOI] [PMC free article] [PubMed] [Google Scholar]
- Bokiniec P, Zampieri N, Lewin GR, Poulet JF (2018) The neural circuits of thermal perception. Curr Opin Neurobiol 52:98–106. 10.1016/j.conb.2018.04.006 [DOI] [PMC free article] [PubMed] [Google Scholar]
- Bourane S, Duan B, Koch SC, Dalet A, Britz O, Garcia-Campmany L, Kim E, Cheng L, Ghosh A, Ma Q, Goulding M (2015) Gate control of mechanical itch by a subpopulation of spinal cord interneurons. Science 350:550–554. 10.1126/science.aac8653 [DOI] [PMC free article] [PubMed] [Google Scholar]
- Braz J, Solorzano C, Wang X, Basbaum AI (2014) Transmitting pain and itch messages: a contemporary view of the spinal cord circuits that generate gate control. Neuron 82:522–536. 10.1016/j.neuron.2014.01.018 [DOI] [PMC free article] [PubMed] [Google Scholar]
- Brenner DS, Golden JP, Gereau RW (2012) A novel behavioral assay for measuring cold sensation in mice. PLoS One 7:e39765. 10.1371/journal.pone.0039765 [DOI] [PMC free article] [PubMed] [Google Scholar]
- Cavanaugh DJ, Lee H, Lo L, Shields SD, Zylka MJ, Basbaum AI, Anderson DJ (2009) Distinct subsets of unmyelinated primary sensory fibers mediate behavioral responses to noxious thermal and mechanical stimuli. Proc Natl Acad Sci USA 106:9075–9080. 10.1073/pnas.0901507106 [DOI] [PMC free article] [PubMed] [Google Scholar]
- Cavanaugh DJ, Chesler AT, Braz JM, Shah NM, Julius D, Basbaum AI (2011) Restriction of transient receptor potential vanilloid-1 to the peptidergic subset of primary afferent neurons follows its developmental downregulation in nonpeptidergic neurons. J Neurosci 31:10119–10127. 10.1523/JNEUROSCI.1299-11.2011 [DOI] [PMC free article] [PubMed] [Google Scholar]
- Cheng L, Duan B, Huang T, Zhang Y, Chen Y, Britz O, Garcia-Campmany L, Ren X, Vong L, Lowell BB, Goulding M, Wang Y, Ma Q (2017) Identification of spinal circuits involved in touch-evoked dynamic mechanical pain. Nat Neurosci 20:804–814. 10.1038/nn.4549 [DOI] [PMC free article] [PubMed] [Google Scholar]
- Chisholm KI, Khovanov N, Lopes DM, La Russa F, McMahon SB (2018) Large scale in vivo recording of sensory neuron activity with GCaMP6. eNeuro 5:ENEURO.0417-17.2018. 10.1523/ENEURO.0417-17.2018 [DOI] [PMC free article] [PubMed] [Google Scholar]
- Cui L, Miao X, Liang L, Abdus-Saboor I, Olson W, Fleming MS, Ma M, Tao YX, Luo W (2016) Identification of early RET+ deep dorsal spinal cord interneurons in gating pain. Neuron 91:1137–1153. 10.1016/j.neuron.2016.07.038 [DOI] [PMC free article] [PubMed] [Google Scholar]
- Descoeur J, Pereira V, Pizzoccaro A, Francois A, Ling B, Maffre V, Couette B, Busserolles J, Courteix C, Noel J, Lazdunski M, Eschalier A, Authier N, Bourinet E (2011) Oxaliplatin-induced cold hypersensitivity is due to remodelling of ion channel expression in nociceptors. EMBO Mol Med 3:266–278. 10.1002/emmm.201100134 [DOI] [PMC free article] [PubMed] [Google Scholar]
- Deuis JR, Zimmermann K, Romanovsky AA, Possani LD, Cabot PJ, Lewis RJ, Vetter I (2013) An animal model of oxaliplatin-induced cold allodynia reveals a crucial role for Nav1.6 in peripheral pain pathways. Pain 154:1749–1757. 10.1016/j.pain.2013.05.032 [DOI] [PMC free article] [PubMed] [Google Scholar]
- Duan B, Cheng L, Bourane S, Britz O, Padilla C, Garcia-Campmany L, Krashes M, Knowlton W, Velasquez T, Ren X, Ross S, Lowell BB, Wang Y, Goulding M, Ma Q (2014) Identification of spinal circuits transmitting and gating mechanical pain. Cell 159:1417–1432. 10.1016/j.cell.2014.11.003 [DOI] [PMC free article] [PubMed] [Google Scholar]
- Emery EC, Luiz AP, Sikandar S, Magnusdottir R, Dong X, Wood JN (2016) In vivo characterization of distinct modality-specific subsets of somatosensory neurons using GCaMP. Sci Adv 2:e1600990. 10.1126/sciadv.1600990 [DOI] [PMC free article] [PubMed] [Google Scholar]
- Emery EC, Young GT, Berrocoso EM, Chen L, McNaughton PA (2011) HCN2 ion channels play a central role in inflammatory and neuropathic pain. Science 333:1462–1466. 10.1126/science.1206243 [DOI] [PubMed] [Google Scholar]
- Forstenpointner J, Oberlojer VC, Naleschinski D, Hoper J, Helfert SM, Binder A, Gierthmuhlen J, Baron R (2018) A-fibers mediate cold hyperalgesia in patients with oxaliplatin-induced neuropathy. Pain Pract 18:758–767. 10.1111/papr.12670 [DOI] [PubMed] [Google Scholar]
- Gustorff B, Sycha T, Lieba-Samal D, Rolke R, Treede RD, Magerl W (2013) The pattern and time course of somatosensory changes in the human UVB sunburn model reveal the presence of peripheral and central sensitization. Pain 154:586–597. 10.1016/j.pain.2012.12.020 [DOI] [PubMed] [Google Scholar]
- Hachisuka J, Baumbauer KM, Omori Y, Snyder LM, Koerber HR, Ross SE (2016) Semi-intact ex vivo approach to investigate spinal somatosensory circuits. Elife 5:e22866. 10.7554/Elife.22866 [DOI] [PMC free article] [PubMed] [Google Scholar]
- Huang J, Zhang X, McNaughton PA (2006) Inflammatory pain: the cellular basis of heat hyperalgesia. Curr Neuropharmacol 4:197–206. 10.2174/157015906778019554 [DOI] [PMC free article] [PubMed] [Google Scholar]
- Huge V, Lauchart M, Forderreuther S, Kaufhold W, Valet M, Azad SC, Beyer A, Magerl W (2008) Interaction of hyperalgesia and sensory loss in complex regional pain syndrome type I (CRPS I). PLoS One 3:e2742. 10.1371/journal.pone.0002742 [DOI] [PMC free article] [PubMed] [Google Scholar]
- Hughes DI, Todd AJ (2020) Central nervous system targets: inhibitory interneurons in the spinal cord. Neurotherapeutics 17:874–885. 10.1007/s13311-020-00936-0 [DOI] [PMC free article] [PubMed] [Google Scholar]
- Isaacson JS, Scanziani M (2011) How inhibition shapes cortical activity. Neuron 72:231–243. 10.1016/j.neuron.2011.09.027 [DOI] [PMC free article] [PubMed] [Google Scholar]
- Johannssen HC, Helmchen F (2010) In vivo Ca2+ imaging of dorsal horn neuronal populations in mouse spinal cord. J Physiol 588:3397–3402. 10.1113/jphysiol.2010.191833 [DOI] [PMC free article] [PubMed] [Google Scholar]
- Jorum E, Warncke T, Stubhaug A (2003) Cold allodynia and hyperalgesia in neuropathic pain: the effect of N-methyl-D-aspartate (NMDA) receptor antagonist ketamine—a double-blind, cross-over comparison with alfentanil and placebo. Pain 101:229–235. 10.1016/S0304-3959(02)00122-7 [DOI] [PubMed] [Google Scholar]
- Julius D, Basbaum AI (2001) Molecular mechanisms of nociception. Nature 413:203–210. 10.1038/35093019 [DOI] [PubMed] [Google Scholar]
- Kato HK, Gillet SN, Peters AJ, Isaacson JS, Komiyama T (2013) Parvalbumin-expressing interneurons linearly control olfactory bulb output. Neuron 80:1218–1231. 10.1016/j.neuron.2013.08.036 [DOI] [PMC free article] [PubMed] [Google Scholar]
- Kerlin AM, Andermann ML, Berezovskii VK, Reid RC (2010) Broadly tuned response properties of diverse inhibitory neuron subtypes in mouse visual cortex. Neuron 67:858–871. 10.1016/j.neuron.2010.08.002 [DOI] [PMC free article] [PubMed] [Google Scholar]
- Koch SC, Acton D, Goulding M (2018) Spinal circuits for touch, pain, and itch. Annu Rev Physiol 80:189–217. 10.1146/annurev-physiol-022516-034303 [DOI] [PMC free article] [PubMed] [Google Scholar]
- Kuner R, Flor H (2017) Structural plasticity and reorganisation in chronic pain. Nat Rev Neurosci 18:113. 10.1038/nrn.2016.162 [DOI] [PubMed] [Google Scholar]
- Latremoliere A, Woolf CJ (2009) Central sensitization: a generator of pain hypersensitivity by central neural plasticity. J Pain 10:895–926. 10.1016/j.jpain.2009.06.012 [DOI] [PMC free article] [PubMed] [Google Scholar]
- Li P, Zhuo M (1998) Silent glutamatergic synapses and nociception in mammalian spinal cord. Nature 393:695–698. 10.1038/31496 [DOI] [PubMed] [Google Scholar]
- Liu BH, Li YT, Ma WP, Pan CJ, Zhang LI, Tao HW (2011) Broad inhibition sharpens orientation selectivity by expanding input dynamic range in mouse simple cells. Neuron 71:542–554. 10.1016/j.neuron.2011.06.017 [DOI] [PMC free article] [PubMed] [Google Scholar]
- Liu WW, Mazor O, Wilson RI (2015) Thermosensory processing in the Drosophila brain. Nature 519:353–357. 10.1038/nature14170 [DOI] [PMC free article] [PubMed] [Google Scholar]
- Ma Q (2010) Labeled lines meet and talk: population coding of somatic sensations. J Clin Invest 120:3773–3778. 10.1172/JCI43426 [DOI] [PMC free article] [PubMed] [Google Scholar]
- Ma Q (2012) Population coding of somatic sensations. Neurosci Bull 28:91–99. 10.1007/s12264-012-1201-2 [DOI] [PMC free article] [PubMed] [Google Scholar]
- MacDonald DI, Luiz AP, Millet Q, Emery EC, Wood JN (2020) Silent cold-sensing neurons drive cold allodynia in neuropathic pain states. bioRxiv 2020.2005.2002.073999. [DOI] [PMC free article] [PubMed] [Google Scholar]
- Mackie M, Hughes DI, Maxwell DJ, Tillakaratne NJ, Todd AJ (2003) Distribution and colocalisation of glutamate decarboxylase isoforms in the rat spinal cord. Neuroscience 119:461–472. 10.1016/S0306-4522(03)00174-X [DOI] [PubMed] [Google Scholar]
- Madisen L, Zwingman TA, Sunkin SM, Oh SW, Zariwala HA, Gu H, Ng LL, Palmiter RD, Hawrylycz MJ, Jones AR, Lein ES, Zeng H (2010) A robust and high-throughput Cre reporting and characterization system for the whole mouse brain. Nat Neurosci 13:133–140. 10.1038/nn.2467 [DOI] [PMC free article] [PubMed] [Google Scholar]
- McCoy ES, Taylor-Blake B, Zylka MJ (2012) CGRPalpha-expressing sensory neurons respond to stimuli that evoke sensations of pain and itch. PLoS One 7:e36355. 10.1371/journal.pone.0036355 [DOI] [PMC free article] [PubMed] [Google Scholar]
- McCoy ES, Taylor-Blake B, Street SE, Pribisko AL, Zheng J, Zylka MJ (2013) Peptidergic CGRPalpha primary sensory neurons encode heat and itch and tonically suppress sensitivity to cold. Neuron 78:138–151. 10.1016/j.neuron.2013.01.030 [DOI] [PMC free article] [PubMed] [Google Scholar]
- McNamara CR, Mandel-Brehm J, Bautista DM, Siemens J, Deranian KL, Zhao M, Hayward NJ, Chong JA, Julius D, Moran MM, Fanger CM (2007) TRPA1 mediates formalin-induced pain. Proc Natl Acad Sci USA 104:13525–13530. 10.1073/pnas.0705924104 [DOI] [PMC free article] [PubMed] [Google Scholar]
- Minett MS, Nassar MA, Clark AK, Passmore G, Dickenson AH, Wang F, Malcangio M, Wood JN (2012) Distinct Nav1.7-dependent pain sensations require different sets of sensory and sympathetic neurons. Nat Commun 3:791. 10.1038/ncomms1795 [DOI] [PMC free article] [PubMed] [Google Scholar]
- Miyamichi K, Shlomai-Fuchs Y, Shu M, Weissbourd BC, Luo L, Mizrahi A (2013) Dissecting local circuits: parvalbumin interneurons underlie broad feedback control of olfactory bulb output. Neuron 80:1232–1245. 10.1016/j.neuron.2013.08.027 [DOI] [PMC free article] [PubMed] [Google Scholar]
- Mogil JS (2009) Animal models of pain: progress and challenges. Nat Rev Neurosci 10:283–294. 10.1038/nrn2606 [DOI] [PubMed] [Google Scholar]
- Peirs C, Williams SP, Zhao X, Walsh CE, Gedeon JY, Cagle NE, Goldring AC, Hioki H, Liu Z, Marell PS, Seal RP (2015) Dorsal horn circuits for persistent mechanical pain. Neuron 87:797–812. 10.1016/j.neuron.2015.07.029 [DOI] [PMC free article] [PubMed] [Google Scholar]
- Peirs C, Williams SP, Zhao X, Arokiaraj CM, Ferreira DW, Noh MC, Smith KM, Halder P, Corrigan KA, Gedeon JY, Lee SJ, Gatto G, Chi D, Ross SE, Goulding M, Seal RP (2021) Mechanical allodynia circuitry in the dorsal horn is defined by the nature of the injury. Neuron 109:73–90.e77. 10.1016/j.neuron.2020.10.027 [DOI] [PMC free article] [PubMed] [Google Scholar]
- Pogorzala LA, Mishra SK, Hoon MA (2013) The cellular code for mammalian thermosensation. J Neurosci 33:5533–5541. 10.1523/JNEUROSCI.5788-12.2013 [DOI] [PMC free article] [PubMed] [Google Scholar]
- Prescott SA, Ratte S (2012) Pain processing by spinal microcircuits: afferent combinatorics. Curr Opin Neurobiol 22:631–639. 10.1016/j.conb.2012.02.010 [DOI] [PMC free article] [PubMed] [Google Scholar]
- Prescott SA, Ma Q, De Koninck Y (2014) Normal and abnormal coding of somatosensory stimuli causing pain. Nat Neurosci 17:183–191. 10.1038/nn.3629 [DOI] [PMC free article] [PubMed] [Google Scholar]
- Ran C, Chen X (2019) Probing the coding logic of thermosensation using spinal cord calcium imaging. Exp Neurol 318:42–49. 10.1016/j.expneurol.2019.04.009 [DOI] [PMC free article] [PubMed] [Google Scholar]
- Ran C, Hoon MA, Chen X (2016) The coding of cutaneous temperature in the spinal cord. Nat Neurosci 19:1201–1209. 10.1038/nn.4350 [DOI] [PMC free article] [PubMed] [Google Scholar]
- Rosland JH, Tjølsen A, Mæhle B, Hole K (1990) The formalin test in mice: effect of formalin concentration. Pain 42:235–242. 10.1016/0304-3959(90)91167-H [DOI] [PubMed] [Google Scholar]
- Ross SE, Mardinly AR, McCord AE, Zurawski J, Cohen S, Jung C, Hu L, Mok SI, Shah A, Savner EM, Tolias C, Corfas R, Chen S, Inquimbert P, Xu Y, McInnes RR, Rice FL, Corfas G, Ma Q, Woolf CJ, et al. (2010) Loss of inhibitory interneurons in the dorsal spinal cord and elevated itch in Bhlhb5 mutant mice. Neuron 65:886–898. 10.1016/j.neuron.2010.02.025 [DOI] [PMC free article] [PubMed] [Google Scholar]
- Schmidt R, Schmelz M, Forster C, Ringkamp M, Torebjork E, Handwerker H (1995) Novel classes of responsive and unresponsive C nociceptors in human skin. J Neurosci 15:333–341. 10.1523/JNEUROSCI.15-01-00333.1995 [DOI] [PMC free article] [PubMed] [Google Scholar]
- Shields SD, Cavanaugh DJ, Lee H, Anderson DJ, Basbaum AI (2010) Pain behavior in the formalin test persists after ablation of the great majority of C-fiber nociceptors. Pain 151:422–429. 10.1016/j.pain.2010.08.001 [DOI] [PMC free article] [PubMed] [Google Scholar]
- Smith JA, Davis CL, Burgess GM (2000) Prostaglandin E2-induced sensitization of bradykinin-evoked responses in rat dorsal root ganglion neurons is mediated by cAMP-dependent protein kinase A. Eur J Neurosci 12:3250–3258. 10.1046/j.1460-9568.2000.00218.x [DOI] [PubMed] [Google Scholar]
- Smith-Edwards KM, DeBerry JJ, Saloman JL, Davis BM, Woodbury CJ (2016) Profound alteration in cutaneous primary afferent activity produced by inflammatory mediators. Elife 5:e20527. 10.7554/Elife.20527 [DOI] [PMC free article] [PubMed] [Google Scholar]
- Spike RC, Puskar Z, Andrew D, Todd AJ (2003) A quantitative and morphological study of projection neurons in lamina I of the rat lumbar spinal cord. Eur J Neurosci 18:2433–2448. 10.1046/j.1460-9568.2003.02981.x [DOI] [PubMed] [Google Scholar]
- Sun S, Xu Q, Guo C, Guan Y, Liu Q, Dong X (2017) Leaky gate model: intensity-dependent coding of pain and itch in the spinal cord. Neuron 93:840–853.e845. 10.1016/j.neuron.2017.01.012 [DOI] [PMC free article] [PubMed] [Google Scholar]
- Taniguchi H, He M, Wu P, Kim S, Paik R, Sugino K, Kvitsiani D, Fu Y, Lu J, Lin Y, Miyoshi G, Shima Y, Fishell G, Nelson SB, Huang ZJ (2011) A resource of Cre driver lines for genetic targeting of GABAergic neurons in cerebral cortex. Neuron 71:995–1013. 10.1016/j.neuron.2011.07.026 [DOI] [PMC free article] [PubMed] [Google Scholar]
- Todd AJ (2010) Neuronal circuitry for pain processing in the dorsal horn. Nat Rev Neurosci 11:823–836. 10.1038/nrn2947 [DOI] [PMC free article] [PubMed] [Google Scholar]
- Vetter I, Touska F, Hess A, Hinsbey R, Sattler S, Lampert A, Sergejeva M, Sharov A, Collins LS, Eberhardt M, Engel M, Cabot PJ, Wood JN, Vlachová V, Reeh PW, Lewis RJ, Zimmermann K (2012) Ciguatoxins activate specific cold pain pathways to elicit burning pain from cooling. EMBO J 31:3795–3808. 10.1038/emboj.2012.207 [DOI] [PMC free article] [PubMed] [Google Scholar]
- Viana F, Voets T (2019) Heat pain and cold pain. In: The Oxford handbook of the neurobiology of pain (Wood JN, ed). Oxford: Oxford UP. [Google Scholar]
- Vriens J, Nilius B, Voets T (2014) Peripheral thermosensation in mammals. Nat Rev Neurosci 15:573–589. 10.1038/nrn3784 [DOI] [PubMed] [Google Scholar]
- Wilson RH, Lehky T, Thomas RR, Quinn MG, Floeter MK, Grem JL (2002) Acute oxaliplatin-induced peripheral nerve hyperexcitability. J Clin Oncol 20:1767–1774. 10.1200/JCO.2002.07.056 [DOI] [PubMed] [Google Scholar]
- Woolf CJ (1983) Evidence for a central component of post-injury pain hypersensitivity. Nature 306:686–688. 10.1038/306686a0 [DOI] [PubMed] [Google Scholar]
- Woolf CJ (2011) Central sensitization: implications for the diagnosis and treatment of pain. Pain 152:S2–S15. 10.1016/j.pain.2010.09.030 [DOI] [PMC free article] [PubMed] [Google Scholar]
- Wu GK, Arbuckle R, Liu BH, Tao HW, Zhang LI (2008) Lateral sharpening of cortical frequency tuning by approximately balanced inhibition. Neuron 58:132–143. 10.1016/j.neuron.2008.01.035 [DOI] [PMC free article] [PubMed] [Google Scholar]
- Yarmolinsky DA, Peng Y, Pogorzala LA, Rutlin M, Hoon MA, Zuker CS (2016) Coding and plasticity in the mammalian thermosensory system. Neuron 92:1079–1092. 10.1016/j.neuron.2016.10.021 [DOI] [PMC free article] [PubMed] [Google Scholar]
- Zeilhofer HU, Wildner H, Yevenes GE (2012) Fast synaptic inhibition in spinal sensory processing and pain control. Physiol Rev 92:193–235. 10.1152/physrev.00043.2010 [DOI] [PMC free article] [PubMed] [Google Scholar]
- Zhang X, Mak S, Li L, Parra A, Denlinger B, Belmonte C, McNaughton PA (2012) Direct inhibition of the cold-activated TRPM8 ion channel by Galphaq. Nat Cell Biol 14:851–858. 10.1038/ncb2529 [DOI] [PMC free article] [PubMed] [Google Scholar]
- Zheng J, Lu Y, Perl ER (2010) Inhibitory neurones of the spinal substantia gelatinosa mediate interaction of signals from primary afferents. J Physiol 588:2065–2075. 10.1113/jphysiol.2010.188052 [DOI] [PMC free article] [PubMed] [Google Scholar]
- Zimmermann K, Deuis JR, Inserra MC, Collins LS, Namer B, Cabot PJ, Reeh PW, Lewis RJ, Vetter I (2013) Analgesic treatment of ciguatoxin-induced cold allodynia. Pain 154:1999–2006. 10.1016/j.pain.2013.06.015 [DOI] [PubMed] [Google Scholar]
Associated Data
This section collects any data citations, data availability statements, or supplementary materials included in this article.
Supplementary Materials
Neuronal responses to heat/warm stimuli are similar between mice before saline or formalin injections. Baseline responses to warm/heat do not significantly differ between pre-formalin and pre-saline groups. Maximum ΔF/F to 37°C (left) and 45°C (right) stimuli are pooled all neurons that showed positive responses to the respective stimuli before injections in eight saline-injected and six formalin-injected mice. Data are mean ± SEM. Download Figure 1-1, EPS file (1.2MB, eps) .