Abstract
The hippocampal formation (HF) is a neuroanatomical region essential for learning and memory. As one of the earliest regions to display the histopathological hallmarks of Alzheimer’s disease (AD), determining the specific mechanisms of the HF’s vulnerability is of capital importance. Reelin, a glycoprotein crucial in cortical lamination during embryonic neurogenesis, has an uncommon expression pattern within the HF and has been implicated in both learning and AD pathogenesis. We hypothesized that Reelin deficiency would expedite behavioral impairments which accompany normal aging. Additionally, we hypothesized that Reelin deficiency in the presence of mutated human microtubule associated protein tau (MAPT) would further impair hippocampal function. To test our hypothesis, we utilized cohorts of aged mice, aged mice with Reelin conditional knockout (RcKO), and adult mice with both RcKO and MAPT in the Barnes maze and Trace fear conditioning. Consistent with prior literature, increased age in wild-type mice was sufficient to reduce spatial searching in the Barnes maze. Increased age both exacerbated spatial impairments and altered context learning in RcKO mice. Lastly, adult mice with both RcKO and the MAPT transgene displayed both the lowest age-of-onset and most severe spatial learning deficits. In conclusion, Reelin deficiency when combined with AD risk-factors produced consistent impairments in spatial memory tasks. Furthermore, our results further implicate Reelin’s importance in both HF homeostasis and AD pathogenesis.
Keywords: Aging, Reelin, PS19, Alzheimer’s Disease, Barnes Maze, Trace Fear Conditioning
1. Introduction
The hippocampal formation (HF) is a neuroanatomical region which includes the cornua ammonis in the hippocampus proper, the dentate gyrus, and the entorhinal cortex. When lesioned, the HF produces a behavioral phenotype unique to the subregion damaged. For example, hippocampal damage or lesion manifests in a mnemonic phenotype impacting contextual and spatial memory [1–4] while attention, motivation, and motor-based tasks are generally unaffected [5]. Indeed, research describing the spatial properties of “grid cells” present in layer II of the medial entorhinal cortex [6] received great recognition in 2014. Moreover, additional studies have identified pathways within the HF specifically implicated in consolidation of context memory [7–9].
Derivative of its crucial importance in the healthy brain, neurodegeneration in the HF has severe consequences. For example, Alzheimer’s disease (AD) preferentially degenerates the HF [10,11] and does so in cell-type specific manner [11–13]. The vulnerable neurons, known as Pre-α [11] or entorhinal cortex layer-II stellates [14], are characterized by an abnormal propensity to accumulate lipofuscin [11] and are among the few populations of excitatory neurons in the adult brain which express Reelin [14–16].
Reelin, a 388 kDa [17] glycoprotein essential for normal development of the embryonic nervous system, has been implicated in biomechanisms of learning and memory [18,19]. In electrophysiological recordings of the murine hippocampus, the acute application of Reelin induces enhanced long-term potentiation [20,21]. Furthermore, Reelin deficiencies have been correlated to higher clinical dementia rating in AD patients [22] and cognitive decline in rats [23]. Given the localization of these Reelin expressing neurons and their implication in AD, we sought to investigate whether Reelin deficiency in adult mice in conjunction with known AD risk-factors produced a behavioral phenotype using the HF-dependent tasks trace fear conditioning (TFC) and the Barnes maze (BM) [24–28].
While aged rodents have a well-documented association with spatial memory impairments [25,26,28–31], the conjoined effect of Reelin deficiency and age has not been well characterized. Doubtless, this is in part due to the severe phenotype which results from Reelin knockout during development. In mice the Reelin knockout phenotype is characterized by the inversion of cortical layering, lack of foliation of the cerebellum, and early lethality [32]. In order to bypass the aforementioned consequences, we utilized a Reelin conditional knockout (RcKO) model. In this model, mice develop normally until 2-months-of-age where they receive tamoxifen injections for a period of one week which induces the cre-recombinase silencing of the Reelin gene. This silencing of Reelin persists for the life of the mouse and is characterized by >95% reduction in Reelin levels [32] (Fig. S1). Behaviorally, RcKO mice have been assessed at 3-months-of-age and are indistinguishable from controls in learning and motor tasks [32]. Additionally, the cross of RcKO into the Alzheimer’s mouse model Tg2576(APPSwe) produces a spatial impairment in adult mice [32]. Given the results from the RcKO cross with the amyloid model, we hypothesized that a similar cross with a tauopathy model would produce a similar phenotype. To test this, the mutated human PS19 transgenic mouse model was utilized [33]. Mice of this line are hemizygotes for human tau with a P301S point mutation and the expression of the human tau is approximately 5-fold higher than endogenous mouse tau [33]. PS19 mice are characterized by diffuse astrogliosis and progressive microglial activation within the HF [33]. After 6-months the phenotype becomes more severe involving neuronal loss in the both the cerebral cortex and hippocampus and is frequently paralleled by a progressive paralysis between 7 and 10-months-of-age [33]. In order to minimize potential confounds, we utilized mice at 6-months-of-age which is before the reported neuronal loss. Additionally, because motor impairment would likely preclude results in the Morris Water Maze (MWM), the dry-land BM was used for spatial learning assessment.
The characterization of HF-dependent learning and memory in the PS19 line is often inconsistent in published works. Although fear conditioning at 6 months-of-age appears normal [34–36], reports of a spatial phenotype vary widely. Some authors find no impact of PS19 [34], others [37] claim specifically learning phase changes, and still others report only tendencies with males of one background in the BM, but significant differences with females of a different background in the MWM [35]. Aging beyond 6-months not only increases the variability in reports of a spatial phenotype [34,38–45] but also obfuscates the fear conditioning phenotype with changes in only context tests [38,46,47], changes in only cued tests [39], and no changes found [41] all being reported.
We hypothesized that Reelin deficiency would expedite behavioral impairments which accompany normal aging. Additionally, we hypothesized that Reelin deficiency in the presence of PS19 would impair HF-dependent learning and memory. Given the controversy surrounding the PS19 line, a two-pronged approach was used to mitigate potential confounds. First, mice from the PS19 background were tested at approximately 6-months-of-age when the fear conditioning phenotype is consistent. Second, an augmented battery of measurements for spatial learning was recorded and reported in order to exhaustively characterize any phenotype observed. A comprehensive list of terms used in the spatial analytical battery is provided in Table 1.
Table 1. Definition of Terms for Spatial Learning/Memory Analysis.
A list of terms used in this paper for spatial learning/memory analysis is provided along with definitions and associated attributes.
| Term | Definition | Tests | Performance Measures | Change Indications | Questions Answered | Disadvantages | Figures |
|---|---|---|---|---|---|---|---|
| Acquisition Efficiency | Rate or timeliness of task-learning | Time-valued Learning | Latency/Speed, Distance | Left/Right shifts of learning curve | Is learning occurring? Is learning occurring faster? | Require larger n | Fig. 1,5,9 Panels A,C,E |
| Acquisition Proficiency | Overall aptitude of task-learning after a given period of time or training | Cumulative Learning | Latency/Speed, Distance | Up/Down shifts of learning curve | Is performance different? | Not necessarily indicate learning | Fig. 1,5,9 Panels B,D,F |
| Extinction Efficiency | Rate or timeliness at which a learned behavior ceases in the learned context in the absence of reinforcement | Time-valued Memory | Average Distance from Goal (Probe Trial) | Left/Right shifts of extinction curve | Is extinction occurring? Is extinction occurring faster? | Require larger n; Susceptible to outliers | Fig. 2,6,10 Panel B |
| Retention Proficiency | The extent to which a learned behavior is performed in the learned context after a given time period without reinforcement | Cumulative Memory | Average Distance from Goal (Probe Trial) | Up/Down shifts of extinction curve | Is retention different? | Susceptible to outliers | Fig. 2,6,10 Panel B |
| Adaptation Efficiency | Rate or timeliness at which task-completion methods change | Time-valued Learning | Strategy | Left/Right shifts task-completion method probabilities | Is learning occurring? Can acquisition outliers be explained? | Require larger n; Classification criterion can vary | Fig. 3,7,11 Panel A |
| Adaptation Proficiency | The extent to which task-completion methods are used after a given time period | Cumulative Learning | Strategy | Up/Down shifts task-completion method probabilities | Is learning different? | Classification criterion can vary | Fig. 3,7,11 Panel B |
2. Material and Methods
2.1. Animals
The wild-type mice were on a hybrid (Sv129/BL6) background identical to the Reelinfl/fl-CAGCreERT2+/− [32] line. All mice were group-housed (maximum of 5 per cage) on a 12-h day/night cycle in a room kept at 21±2C at 50±5% humidity. Food and water were provided ad libitum. The conditional knockout of Reelin in each line was achieved by five days of consecutive intraperitoneal either tamoxifen (Sigma, S5007) (125 mg/kg) or vehicle injections at 8 weeks-of-age ± 1wk. Prior to injection, tamoxifen was dissolved (18mg/ml) in sunflower oil (Sigma, T5648) and 10% EtOH. Henceforth, RcKO mice will be identified as either control (Cntrl) or RcKO and by the age of the cohort (3-month or 12-month).
PS19 (JAX #008169) [33] hemizygotes on a B6C3F1/J background were crossed with the Reelin cKO line [32] on a Sv129/BL6 background thereby creating a mouse line in which Reelinfl/fl is combined with the optional presence of both the PS19 trans-gene and CAGCreERT2. Subsequently, the line was maintained on a Sv129/BL6 background. In experiments utilizing this line, MAPT−:Reelinfl/fl-CAGCreERT2− (WT) represents the control condition with MAPT+:Reelinfl/fl-CAGCreERT2− (MAPT), MAPT−:Reelinfl/fl-CAGCreERT2+ (Reelin cKO), and MAPT+:Reelinfl/fl-CAGCreERT2+ (MAPT:cKO) composing the remaining conditions. Because a sexual dimorphism exists in rodent spatial learning and memory tasks [48, 49] and the majority of age-related decline in spatial memory performance has been collected from male mice [48], only male mice were tested in the following experiments in order to make our results more comparable to previously published material.
In addition to genotyping which takes place prior to weaning, verification of recombination was done after behavioral testing. For this purpose, performed RT-qPCR on the cerebellar lysates (Fig. S1). Notably, the cerebellum is reported to have the highest Reelin expression levels in the brain [50,51]. Given the compelling efficacy of the conditional knockout as demonstrated both within our data (>95% decrease in Reelin mRNA expression) and the evidence that this generalizes throughout the brain [32], we conclude that Reelin is knocked-out not only in the hippocampus but also the entire brain.
All experimental procedures on mice were performed according to the approved guidelines and standard operating procedures of the Institutional Animal Care and Use Committee (IACUC) and Animal Resource Center (ARC) at the University of Texas Southwestern Medical Center at Dallas.
2.2. Behavior
At least 24 hours prior to any behavioral test each mouse was checked for obvious health issues and its tail was marked with a non-toxic Sharpie® for ease of recognition. On the day of any behavioral experiment, each cage of mice was removed from the housing room and transported to an intermediate location neighboring the behavioral apparatus. Each cage was then left undisturbed for at least 1 hour before beginning testing. Cages which completed the BM had subsequent TFC training within 2 weeks. In the event the BM was not performed, a brief handling period prior to tail marking preceded TFC.
2.2.1. Barnes Maze
The BM apparatus consists of an elevated (50cm) circular platform (diameter (d) = 120cm) containing 18 evenly placed circular holes (d = 7.5cm) with each having its outermost edge 7.5cm interior from the rim of the platform. One of two hole locations contained a suspended goal box (15 × 15 × 8.5cm; length × width × height) composed of red semi-transparent plastic and containing a textured ramp of the same material. This goal box was filled to a height of ~2.5cm with sawdust similar to the home cage. Other objects include: the visual cues which were suspended at platform height in each cardinal direction (N, S, E, W), a camera connected to analysis software suspended directly over the center of the apparatus, bright lights placed on the floor surrounding apparatus, and a fan at platform height (low-speed on day one and medium-speed on all subsequent days).
Each trial consisted of placing a mouse into a transfer cage of similar dimensions to the home cage via tail suspension. The transfer cage was then carried to the apparatus and, again using tail suspension, the mouse was placed into the start-chamber (a non-transparent dome with a diameter of 23.5cm and a height of 7.5cm) which was then covered. After approximately 10s, both the start-chamber and lid were removed, and the experimenter quickly retreated behind a visual barrier to observe the subject via camera-feed on the recording software. A stopwatch was used to manually record both the primary and total latency values. If the mouse failed to complete the experiment within the time allotted, the mouse was guided to the goal location using an enclosed, handled, transparent, plastic cylinder. Once the mouse entered the goal location (using a four-paw standard), the start-chamber lid was placed over the hole entrance and the mouse remained inside for approximately 20s. The goal box, which contained the mouse, was removed from the apparatus and transported to a different transfer cage. Subsequently, the goal ramp was removed and the mouse transferred by gently tilting the goal box until the mouse walked into the second transfer cage. The mouse remained in this cage while the entire surface of the apparatus was cleaned with 70% EtOH. Lastly, the second transfer cage and the tested mouse were transported back to the holding location, the next subject placed in the first transfer cage, and the tested mouse returned to the home cage.
The protocol utilized contained trials over five consecutive days. The first trial on day one was deemed the accustomization trial and had a maximum duration of 90s. Four additional trials with a maximum duration of 180s (standard trial) were subsequently conducted on day one. Days two through four consisted of four standard trials per day. On the last day (probe trial), the goal box was not attached to the apparatus and each mouse was allowed to explore for 90s.
2.2.2. Trace Fear Conditioning
The TFC protocol was performed over three consecutive days. On day one (training), each mouse (maximum two mice trained simultaneously) was transported from the preparation location (using a similar protocol to the BM) and placed in a shock chamber (25 × 32 × 33cm) cleaned with 70% EtOH for a 10 min training session. The flooring of the chamber consisted of 36 metal rods (d = 0.35cm) arranged in parallel. Each rod was 26cm long, 0.55cm from neighboring rods, and individually connected to the shock-generator. Two minutes after being placed in the chamber, the following tone-shock pairing sequence elapsed. Namely, 20s of a tone (80 dB, 7000 Hz) was followed by a 20s trace period and a subsequent 2s, 0.5 mA foot shock. Two additional tone-shock pairings were performed and, identical to the first paring, two minutes elapsed between subsequent pairings. After each training session the shock chamber was thoroughly cleaned with dH2O and 70% EtOH.
On day two (Cue test), the visual, tactile, and olfactory cues were altered and the freezing response to the auditory cue was measured. Specifically, the light was changed from white to red, a plastic box containing fresh sawdust replaced the metal grate, and balsamic vinegar-soaked paper towel was placed next to each box replacing the EtOH olfactory cues during training. Process NPD® was used to clean at all timepoints during the cue test. The trial itself was composed three repetitions of a two-minute no stimulus period followed by a one-minute period of continuous tone. The last tone was followed by one minute of no stimulus before the standard cleaning and returning to home cage.
On day three (Context test), the context was identical to the training session with the absence of the tone. Each mouse was placed into the shock chamber as before and the freezing behavior recorded over the five-minute trial period.
2.3. Statistical Analysis
All data processing, statistical analysis, and graphical creation was done in RStudio [52] primarily using the base R (Ver 3.6.3) [53] and tidyverse (Ver 1.3.0) [54] packages. Data was tested for normality using the Shapiro test. Due to the overwhelming frequency of non-parametricity, the Kruskal-Wallis rank sum test and Wilcoxon Signed-rank test with Benjamini-Hochberg correction with a threshold of p< 0.05 was used to assess significance in all cases.
2.3.1. Barnes Maze Analysis
For the BM, the manually recorded total and primary latency values were entered into a spreadsheet containing each mouse’s genotype and corresponding identification number. Total/primary latency values are defined as the time required to either enter or locate the goal, respectively. In the event the mouse jumped off the platform, both the primary and total latency values were set to the maximum trial duration. The raw cartesian positional values and corresponding time values for each trial recorded by the ANY-Maze software (Version 4.99m, Stoelting Company, Wood Dale, IL, USA) were extracted and radially adjusted such that the goal locations were overlaid. These values were then used to create the choropleths using the raster package [55]. Additional values extracted included both the distance travelled and the distance from the goal during each second of each trial. Distance and mean speed measurements were calculated by taking the sum and the average respectively of the distance travelled up to either the total or primary latency value. The radius for the categorical zone occupancy was calculated as half the distance from the apparatus center to the nearest border of the goal. Search strategy classification was done blindly by plotting the primary pathing of each mouse and categorically classifying the pathing as either spatial, serial, or random. Representative examples of pathing used for strategy classifications can be found in the supplemental figures (Fig. S2).
2.3.2. Trace Fear Conditioning Analysis
Trace Fear Conditioning was manually quantified by scoring the number of seconds the mouse exhibited freezing behavior (no movement observed except slight “shivering” of torso) within each minute of each trial. Scoring was done from a recorded video taken by a camera suspended directly above the shock chamber.
2.3.3. Exclusionary Criterion
Only malfunction of the recording software or drastically atypical performance compared to other mice within the condition were used as grounds for exclusion from analysis. One mouse from each experiment was excluded from analysis in the Barnes maze. A 3-mth WT was excluded due to recording software malfunctions. Both a young control in experiment two and a WT in experiment three were excluded due to drastically atypical performance. If the cause of removal was atypical performance, the data was evaluated with and without the mouse’s inclusion to assess whether the removal caused statistical tests to shift over threshold values (i.e. shift p-values from above or below p < 0.05, 0.01, 0.001). In each circumstance this was not observed.
3. Results
3.1. Experiment 1: Aging impacts spatial memory in wild-type mice
Despite the well-established nature of rodent age-related impairment in certain memory tasks, extreme senescence is often only compared to young mice. In order to not only establish a baseline level of activity for the mouse background used throughout this paper but also to determine if there was a midlife transition in HF-dependent learning or memory, 3-, 12-, and 18-month male mice of hybrid (Sv129/BL6) background were measured in the BM and TFC.
3.1.1. 3-month mice tend to have superior acquisition proficiency
The 18-month cohort showed a significantly higher primary latency compared to the 12-month cohort and tended (p = 0.065) to be higher than the 3-month group (Fig 1A-B). The 12-month cohort had a significantly increased primary mean speed compared to both the 3- and 18-month groups (Fig. 1C-D). Although the primary distance traveled by the cohorts did not significantly differ, the 3-month cohort had a tendency to travel a shorter distance (3- vs. 12-mth: p = 0.084; 3- vs. 18-mth: p = 0.078) (Fig. 1E-F). The cumulative tendency for the 3-month cohort to have lower primary latency and distances leads us to conclude that this cohort tends to have superior acquisition proficiency (See Tab. 1). The primary pathing data for all mice separated by day of training is shown in the supplemental figures (Fig. S3).
Figure 1. Barnes Maze Primary Acquisition Measures for Aging WT cohort.
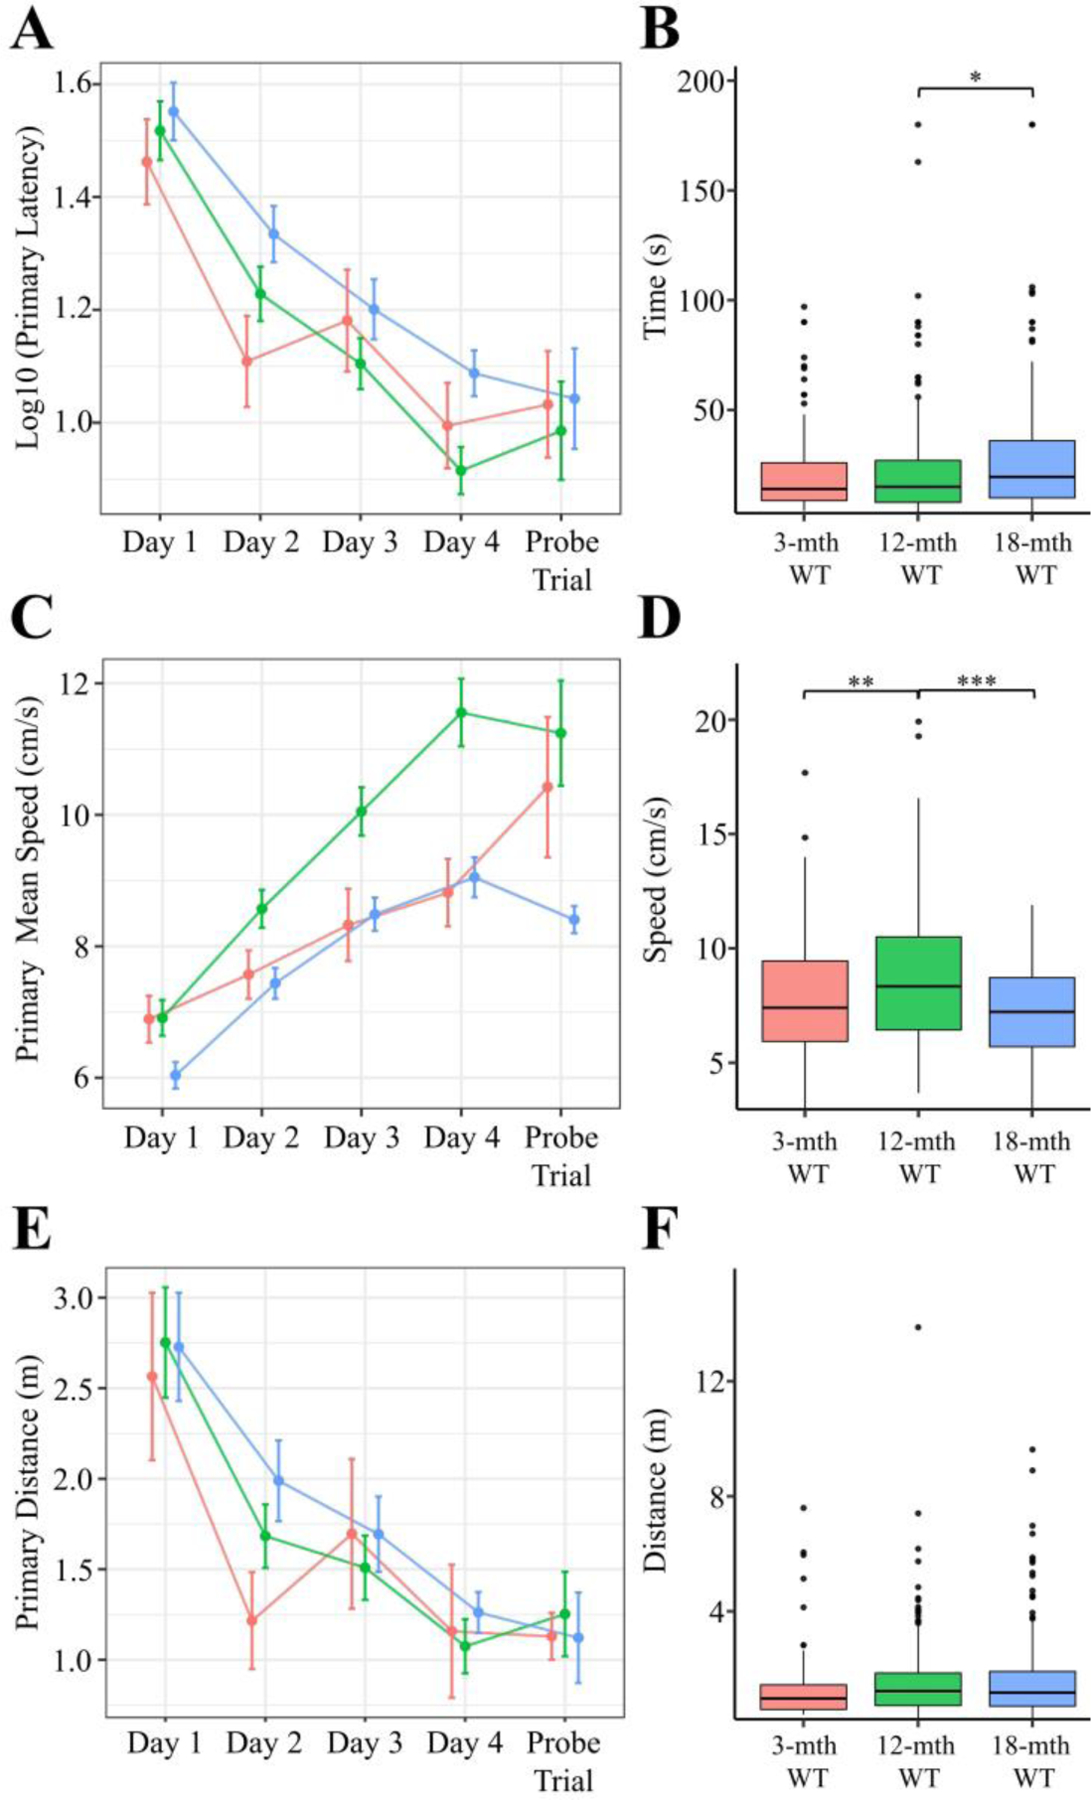
Primary (i.e. time to locate) A-F) measures were calculated for each trial. The mean ± SEM for each day A, C, E) and the boxplot for all trials B, D, F) segregated by genotype is plotted above for latency A-B), mean speed C-D), and distance E-F). In all panels color is indicative of age (3-mth WT: pink, 12-mth WT: green, 18-mth WT: blue). A-B) The primary latency significantly varied compared to age (Kruskal-Wallis rank sum test; χ2(2) = 7.616, p = 0.0222). C-D) The primary mean speed (Kruskal-Wallis rank sum test; χ2(2) = 29.32, p < 0.0001) significantly varied between age groups. E-F) The primary distance (Kruskal-Wallis rank sum test; χ2(2) = 5.342, p = 0.0692) significantly varied compared to age. Pairwise comparisons for significance were determined using the Wilcoxon ranked sum test with Benjamini-Hochberg correction and are indicated by: * p < 0.05, ** p < 0.01, *** p < 0.001. All animals were stated age±2wk males (3-mth WT: n = 4; 12-mth WT: n = 10; 18-mth WT: n = 10).
3.1.2. Young mice exhibit superior spatial memory, but TFC performance unchanged
While all mice appear to prefer the area around the trained-goal location as shown by the probe trial choropleth (Fig. 2A), the assuredness of the mice seems to vary across time. As the age of the mouse increased, the pathing data indicates older mice make larger errors by searching further from the trained-goal location (Fig. 2A). Comparing the second-by-second distance from the goal shows both the 12- and 18-month cohorts searched distant zones earlier than the 3-month cohort. This suggests the 3-month cohort had a lower extinction efficiency. The cumulative average distance from the goal revealed that the youngest cohort of mice were on average significantly closer to the goal location compared to their aged counterparts (Fig. 2B), thus indicating the 3-month cohort had a higher retention proficiency. Collectively, the lower extinction efficiency and higher retention proficiency indicate that the 3-month cohort of mice exhibited superior spatial memory compared to the 12- and 18-month cohorts.
Figure 2. Barnes Maze Extinction and Retention for Aging WT cohort.
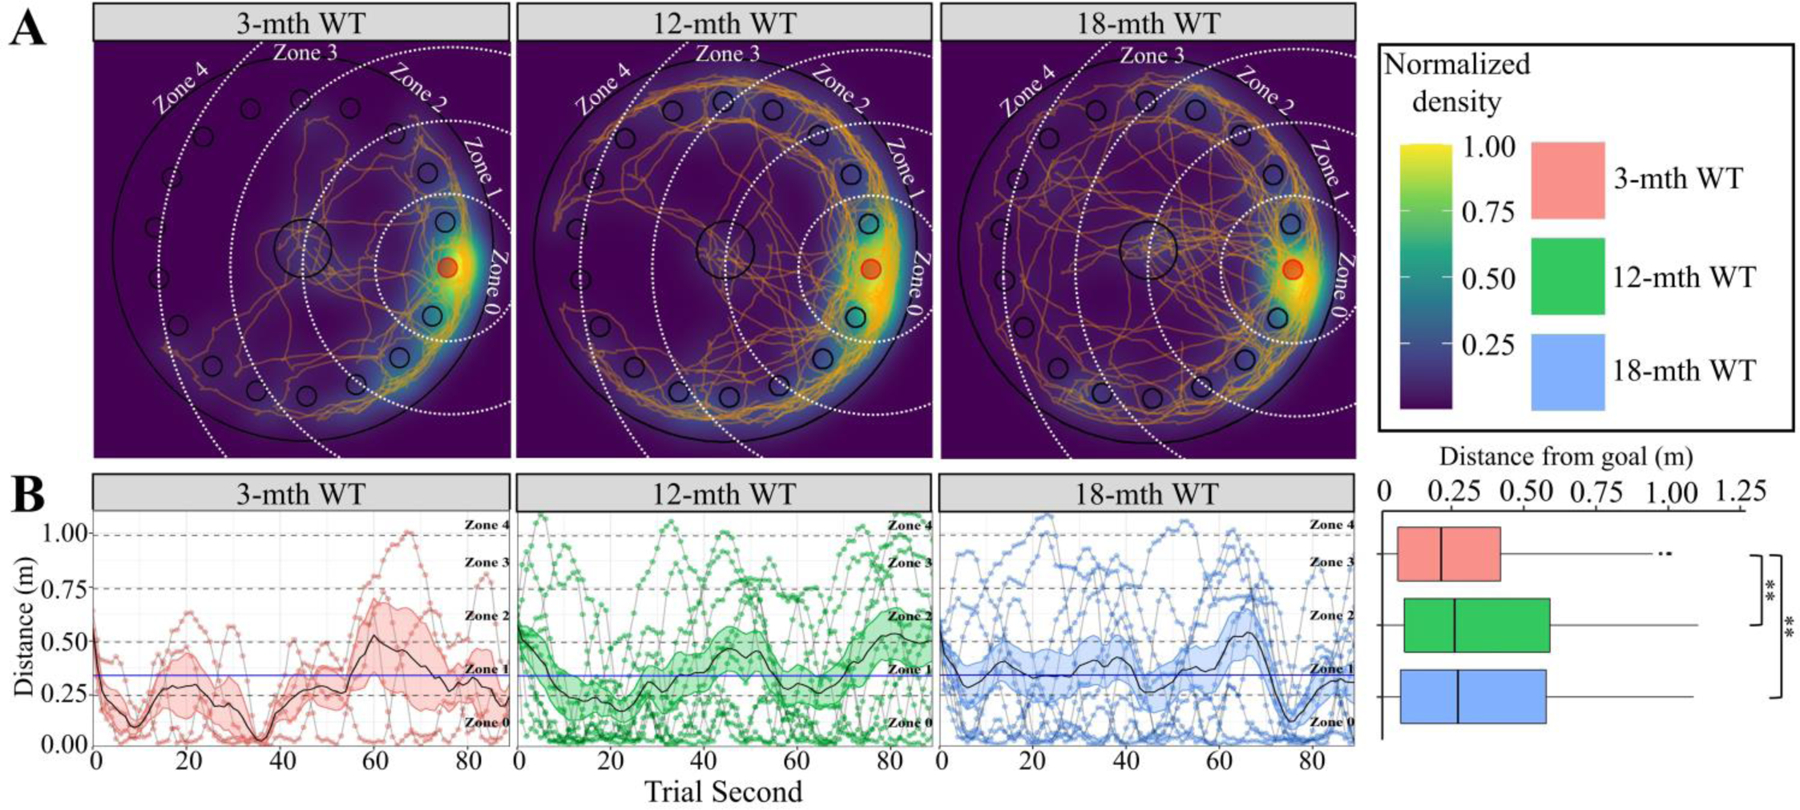
In all panels color is indicative of age (3-mth WT: pink, 12-mth WT: green, 18-mth WT: blue). A) Choropleth, cartesian positional measurements normalized to the amount of time the position was occupied and overlaid upon a schematic of the apparatus. White dashed arcs: zone boundaries. Orange lines: path-traces of each mouse during the probe trial. B) Distance of each mouse from the goal location during each second of the probe trial. Grey lines connect consecutive measurements for each mouse. Zone occupancy shown via dashed lines. Solid black line with colored ribbon: mean ± SEM for each second of each genotype/age. Solid blue line: cohort mean (irrespective of age). The cumulative data displayed in the boxplot shows significant interaction between genotype and distance from the goal (Kruskal-Wallis rank sum test; χ2(2) = 15.942, p = 0.0003). Pairwise comparisons for significance were determined using the Wilcoxon ranked sum test with Benjamini-Hochberg correction and are indicated by: * p < 0.05, ** p < 0.01, *** p < 0.001. All animals were stated age±2wk males (3-mth WT: n = 4; 12-mth WT: n = 10; 18-mth WT: n = 10).
Learning is indicated by the progressive adaptation of a spatial search strategy (Fig. 3A). Noticeably, by the second day of training approximately 75% of the 3-month cohort was using spatial strategies. Because this cohort consistently appears to utilize a superior spatial strategy earlier, we conclude that the 3-month cohort displayed a greater adaptation efficiency. This conclusion is reinforced when comparing the cumulative strategy usage. The 3-month mice were significantly more likely to utilize a spatial search strategy (Fig. 3B) and, thus we conclude that the 3-month cohort of mice displayed a higher adaptation proficiency. In contrast to the changes observed in spatial learning capacity, no significant differences were seen in either the tone or context tests during TFC (Fig. 4A-B). To summarize, the 3-month cohort displayed in this experiment showed superior acquisition proficiency, retention proficiency, adaptation efficiency, and adaptation proficiency while simultaneously having a lower extinction efficiency. Therefore, we conclude that the results of this experiment indicate that spatial learning and memory are particularly vulnerable to natural aging.
Figure 3. Barnes Maze Search Strategy for Aging WT cohort.
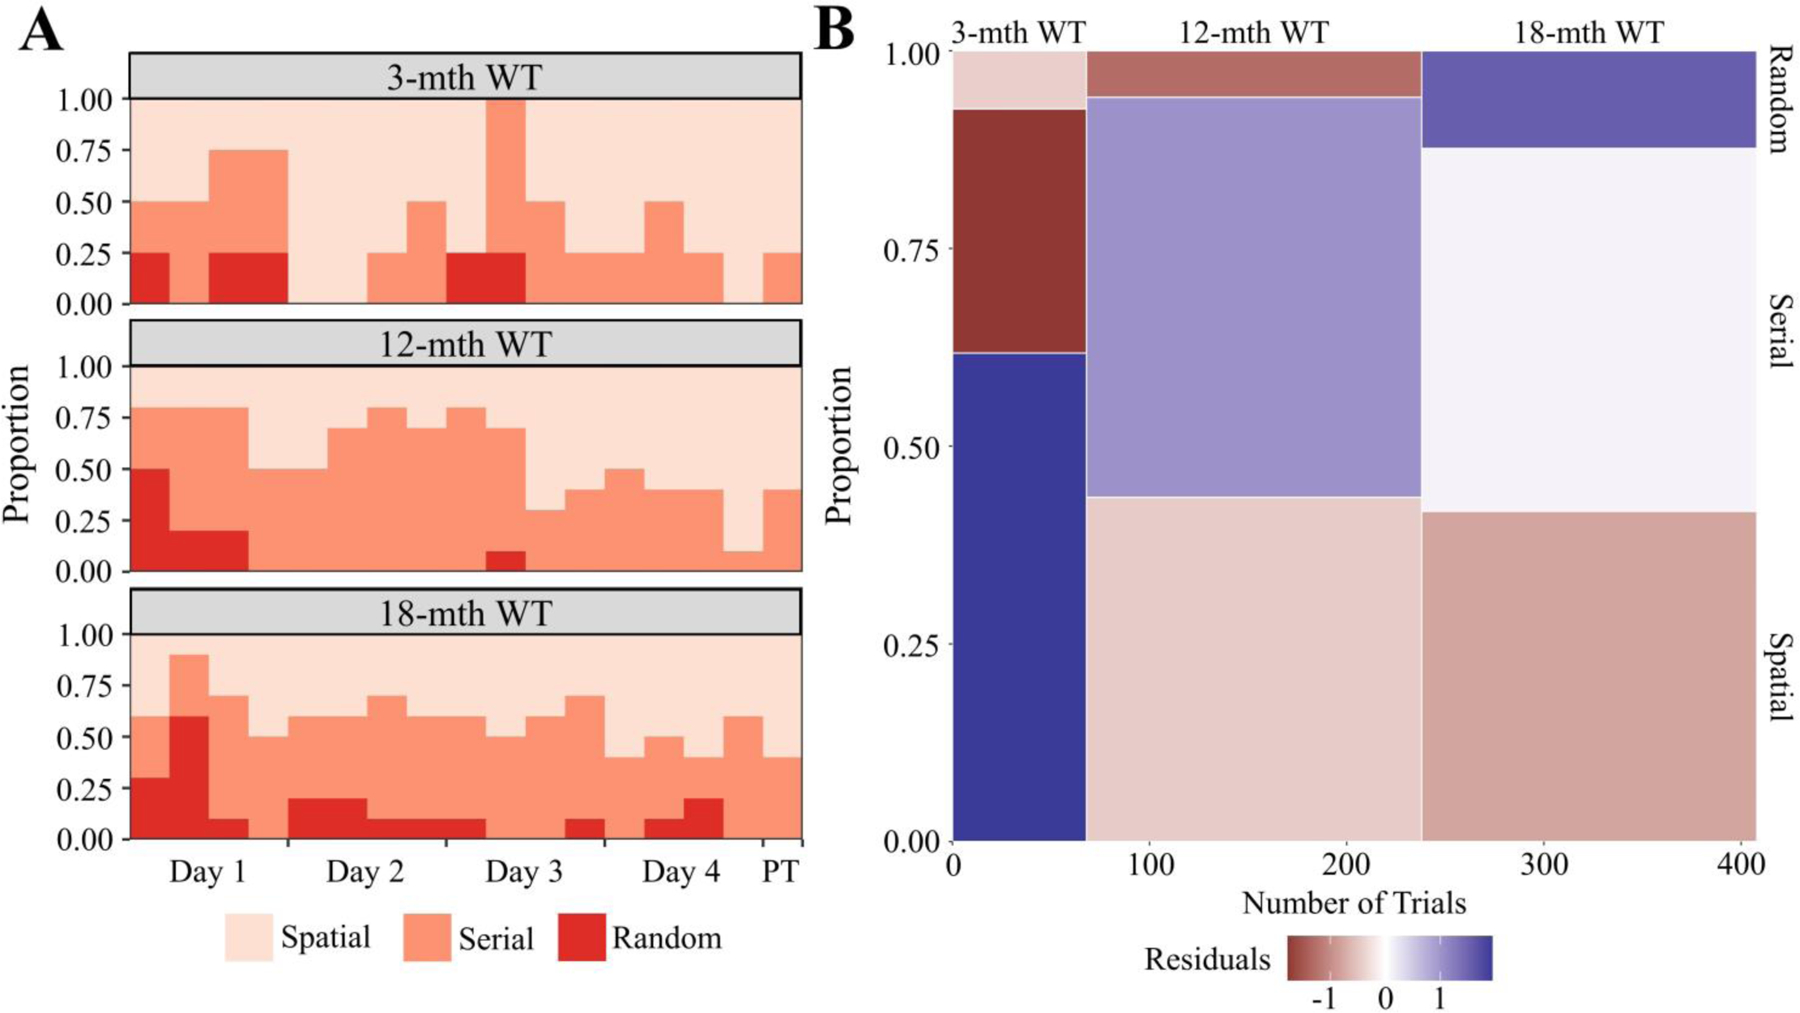
A) Relative probability diagram illustrating the proportion of animals utilizing search strategy during each trial except the initial training trial. A significant relationship was found (Kruskal-Wallis rank sum test; χ2(2) = 7.901, p = 0.0192). B) Mosaic plot visually representing χ2 test between search strategy and genotype. A significant relationship was found between genotype and search strategy (Pearson’s χ2; χ2(4, N = 408) = 12.988, p = 0.0113). The height of each bin shows cumulative proportion each genotype utilized a search strategy. The width of each bin is indicative of the number of trials used to calculate the proportion. Relative over/under-representation of a search strategy represented by continuous color scale plotting the residuals of the χ2 test. The initial training trial was excluded from this calculation. All animals were stated age±2wk males (3-mth WT: n = 4; 12-mth WT: n = 10; 18-mth WT: n = 10). Abbreviations: PT - probe trial.
Figure 4. Aged WT Trace Cumulative Fear Conditioning Time Frozen Measurements.
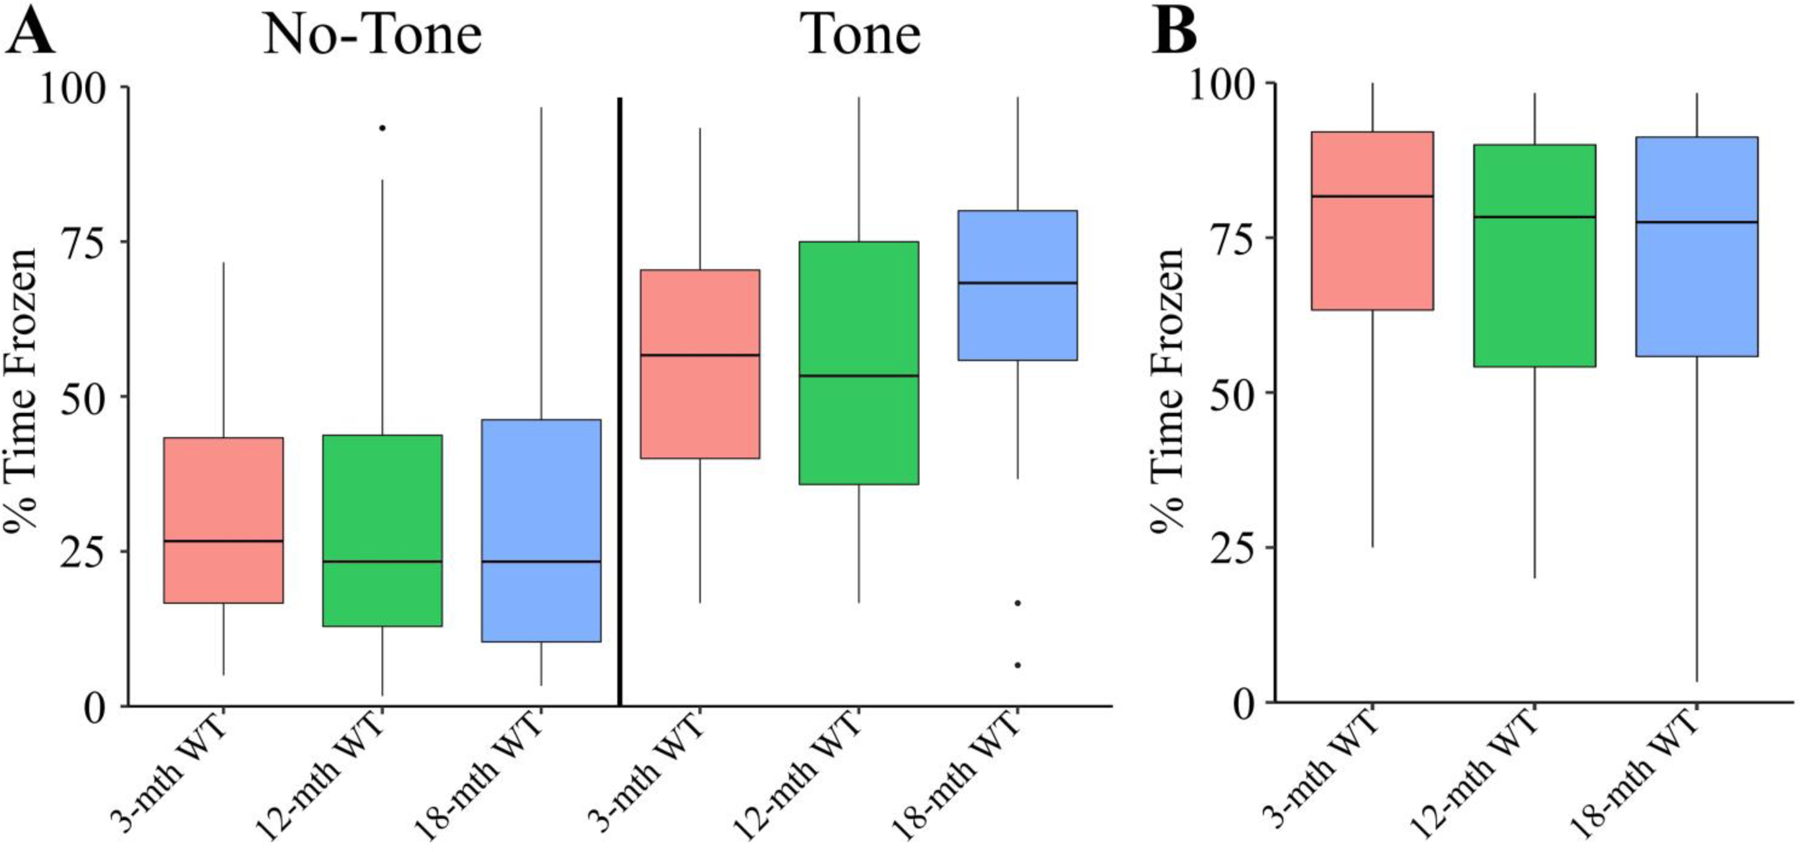
In all panels color is indicative of age (3-mth WT: pink, 12-mth WT: green, 18-mth WT: blue). A) The boxplot for the percent of time frozen during minutes either in the absence of the tone (left) or containing the tone (right). There were no significant differences detected between groups (Kruskal-Wallis rank sum test; χ2(2) = .5322, p = 0.7664). B) The boxplot for the percent of time frozen during the entire context trial. No significant differences were detected in the context test (Kruskal-Wallis rank sum test; χ2(2) = 1.571, p = 0.456. For TFC longitudinal data, see (Fig. S10). All animals were stated age±2wk males (3-mth WT: n = 12; 12-mth WT: n = 12; 18-mth WT: n = 10).
3.2. Experiment 2: Reelin cKO decreases age-of-onset for HF-dependent memory impairment
In order to determine if Reelin deficiency expedited age-related deficits in HF-dependent learning, both cohorts of 3- and 12-month mice with and without conditional knockout of Reelin (Cntrl and RcKO, respectively) were tested in BM and TFC.
3.2.1. Acquisition proficiency unchanged between groups
Across all primary measures (i.e. measured until goal located) (Fig. 5A-F), only the primary mean speed significantly varied (Fig. 5C-D). Notably, the significant increase in primary mean speed seen in the 3-month Cntrls compared to the 12-month Cntrls (Fig. 5D) is opposite to the 3- and 12-month WT cohorts in the first experiment (Fig. 1D). Although seemingly contradicting, the 3-month Cntrls in this experiment had 5 consecutive days of injections approximately 1-month prior to the BM. We consider it likely that the memory of this presumably aversive experience was sufficiently motivating to account for the speed differences observed. Nevertheless, because of the lack of observed differences we conclude that acquisition proficiency is unchanged between the groups. The primary pathing data for all mice separated by day of training is shown in the supplemental figures (Fig. S4).
Figure 5. Barnes Maze Primary Acquisition Measures for Reelin cKO cohort.
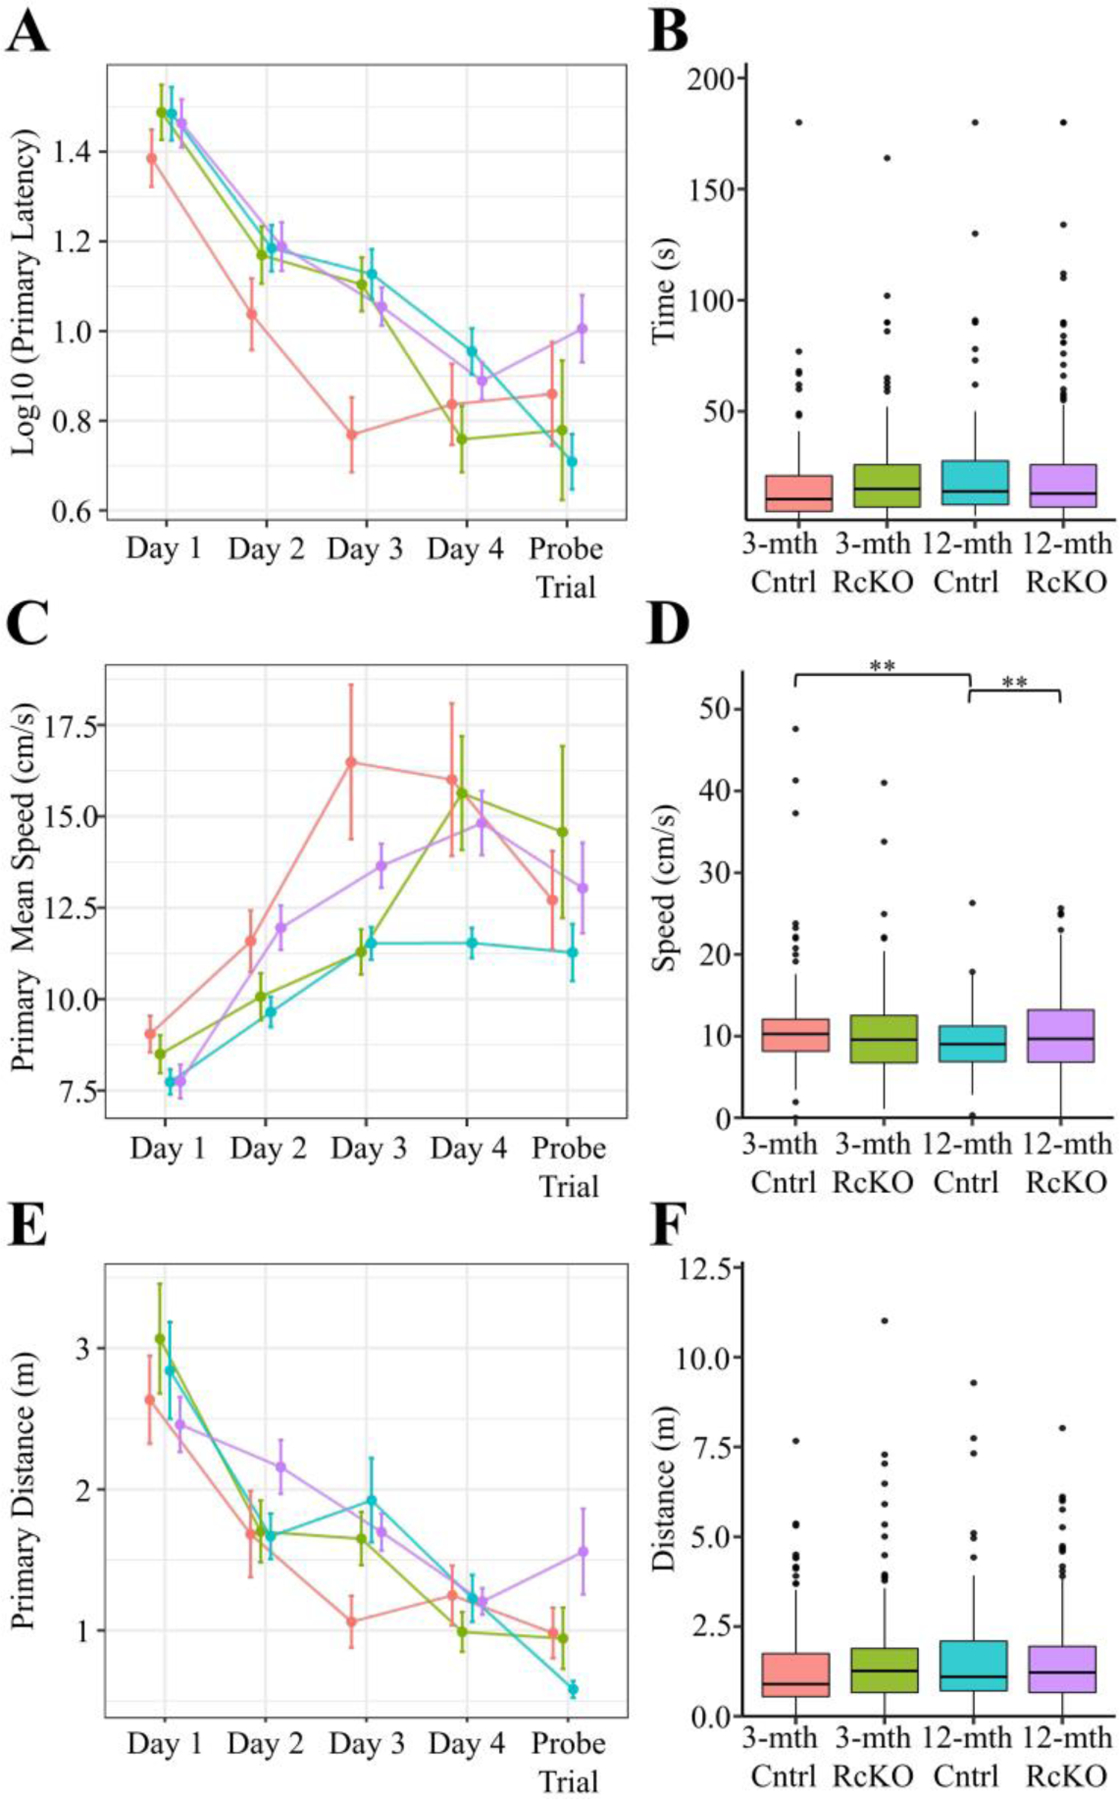
Primary (i.e time to locate) A-F) measures were calculated for each trial. The mean ± SEM for each day A, C, E) and the boxplot for all trials B, D, F) segregated by genotype is plotted above for latency A-B), mean speed C-D), and distance E-F). In all panels color is indicative of age and genotype (3-mth Cntrl: pink, 3-mth RcKO: green, 12-mth Cntrl: blue, 12-mth RcKO: violet). A-B) The primary latency showed a non-significant trend when analyzed against age and genotype (Kruskal-Wallis rank sum test; χ2(3) = 7.595, p = 0.0552). C-D) The primary mean speed (Kruskal-Wallis rank sum test; χ2(3) = 14.537, p = 0.0023) significantly varied between age/genotype groups. E-F) The primary distance (Kruskal-Wallis rank sum test; χ2(3) = 6.044, p = 0.1095) was not observed to significantly vary between genotype/age cohorts. The pairwise comparisons for significance were determined using the Wilcoxon ranked sum test with Benjamini-Hochberg correction and are indicated by: * p < 0.05, ** p < 0.01, *** p < 0.001. (3-mth Cntrl: n = 6; 3-mth RcKO: n = 7; 12-mth Cntrl: n = 7; 12-mth RcKO: n = 14).
3.2.2. 12-month RcKOs exhibit impaired spatial memory and learning
Independent of age or genotype, the most likely position for a mouse in the probe trial is surrounding the former-goal location (Fig. 6A). The 12-month RcKO mice, however, were located significantly farther from the trained-goal location compared to young mice with or without RcKO (Fig. 6B) indicating impaired retention proficiency. Simultaneously, the visual comparison of the second-by-second distance from the goal shows that the RcKOs were observed in the furthest zones from the goal even during the early stages of the trial. Therefore, we conclude that the 12-month RcKOs demonstrated a greater extinction efficiency (Tab. 1). Despite all other groups gradually eliminating the use of a random search strategy, the 12-month RcKO group persistently utilized this strategy (Fig 7A). This indicates a lower adaption efficiency in the 12-month RcKOs. The consistent inefficiency of task-learning resulted in the cumulative probability of random search strategy for the 12-month RcKOs being nearly double that of all other groups (Fig. 7B) and indicates impaired adaptation proficiency.
Figure 6. Barnes Maze Extinction and Retention for Reelin cKO cohort.
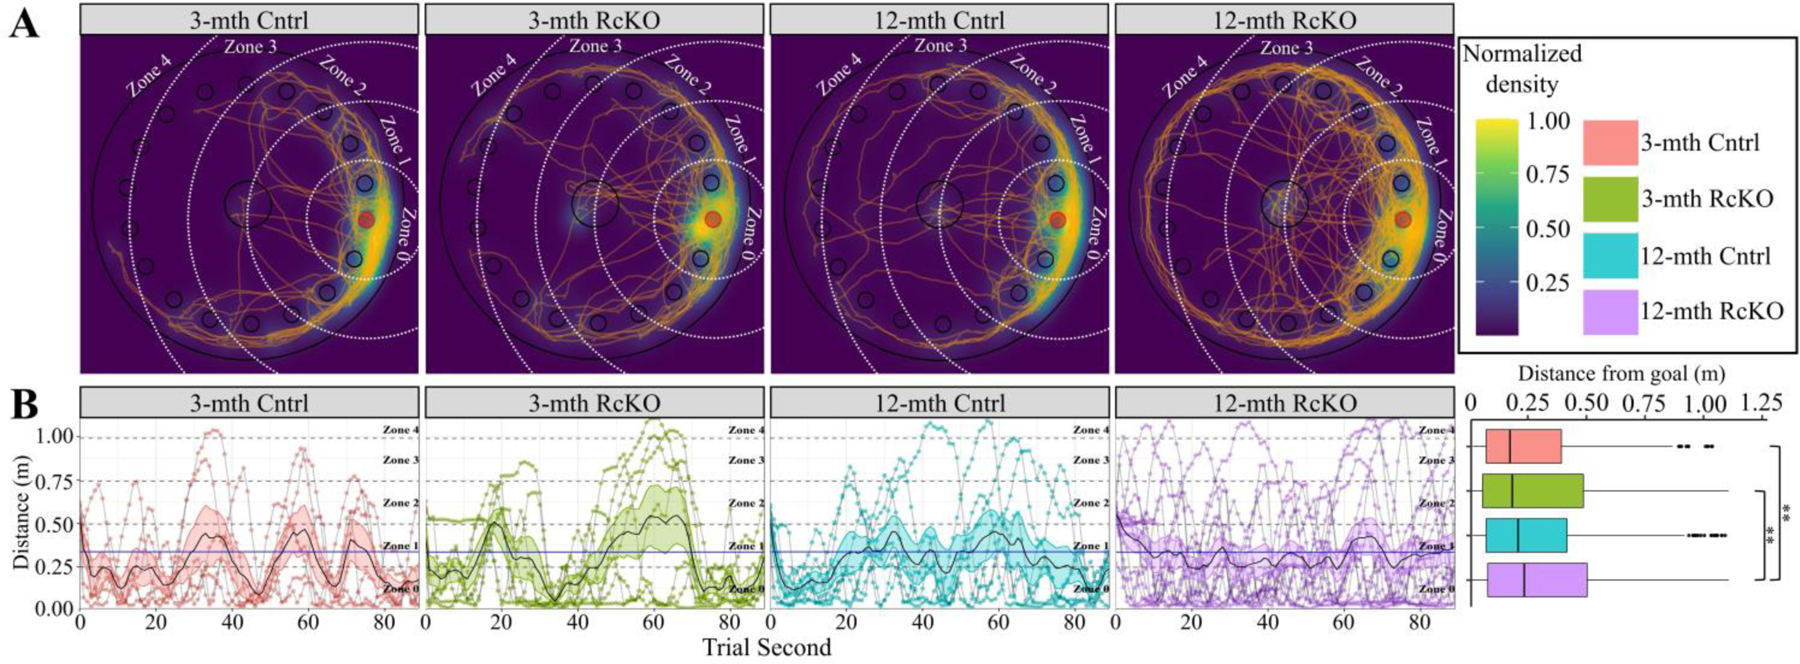
In all panels color is indicative of age and genotype (3-mth Cntrl: pink, 3-mth RcKO: green, 12-mth Cntrl: blue, 12-mth RcKO: violet). A) Choropleth, cartesian positional measurements normalized to the amount of time the position was occupied and overlaid upon a schematic of the apparatus. White dashed arcs: zone boundaries. Orange lines: path-traces of each mouse during the probe trial. B) Distance of each mouse from the goal location during each second of the probe trial. Grey lines connect consecutive measurements for each mouse. Zone occupancy shown via dashed lines. Solid black line with colored ribbon: mean ± SEM for each second of each genotype/age. Solid blue line: cohort mean (irrespective of genotype or age). The cumulative data displayed in the boxplot shows significant interaction between genotype and distance from the goal (Kruskal-Wallis rank sum test; χ2(3) = 18.081, p = 0.0004). Pairwise comparisons for significance were determined using the Wilcoxon ranked sum test with Benjamini-Hochberg correction and are indicated by: * p < 0.05, ** p < 0.01, *** p < 0.001. (3-mth Cntrl: n = 6; 3-mth RcKO: n = 7; 12-mth Cntrl: n = 7; 12-mth RcKO: n = 14).
Figure 7. Barnes Maze Search Strategy for Reelin cKO cohort.
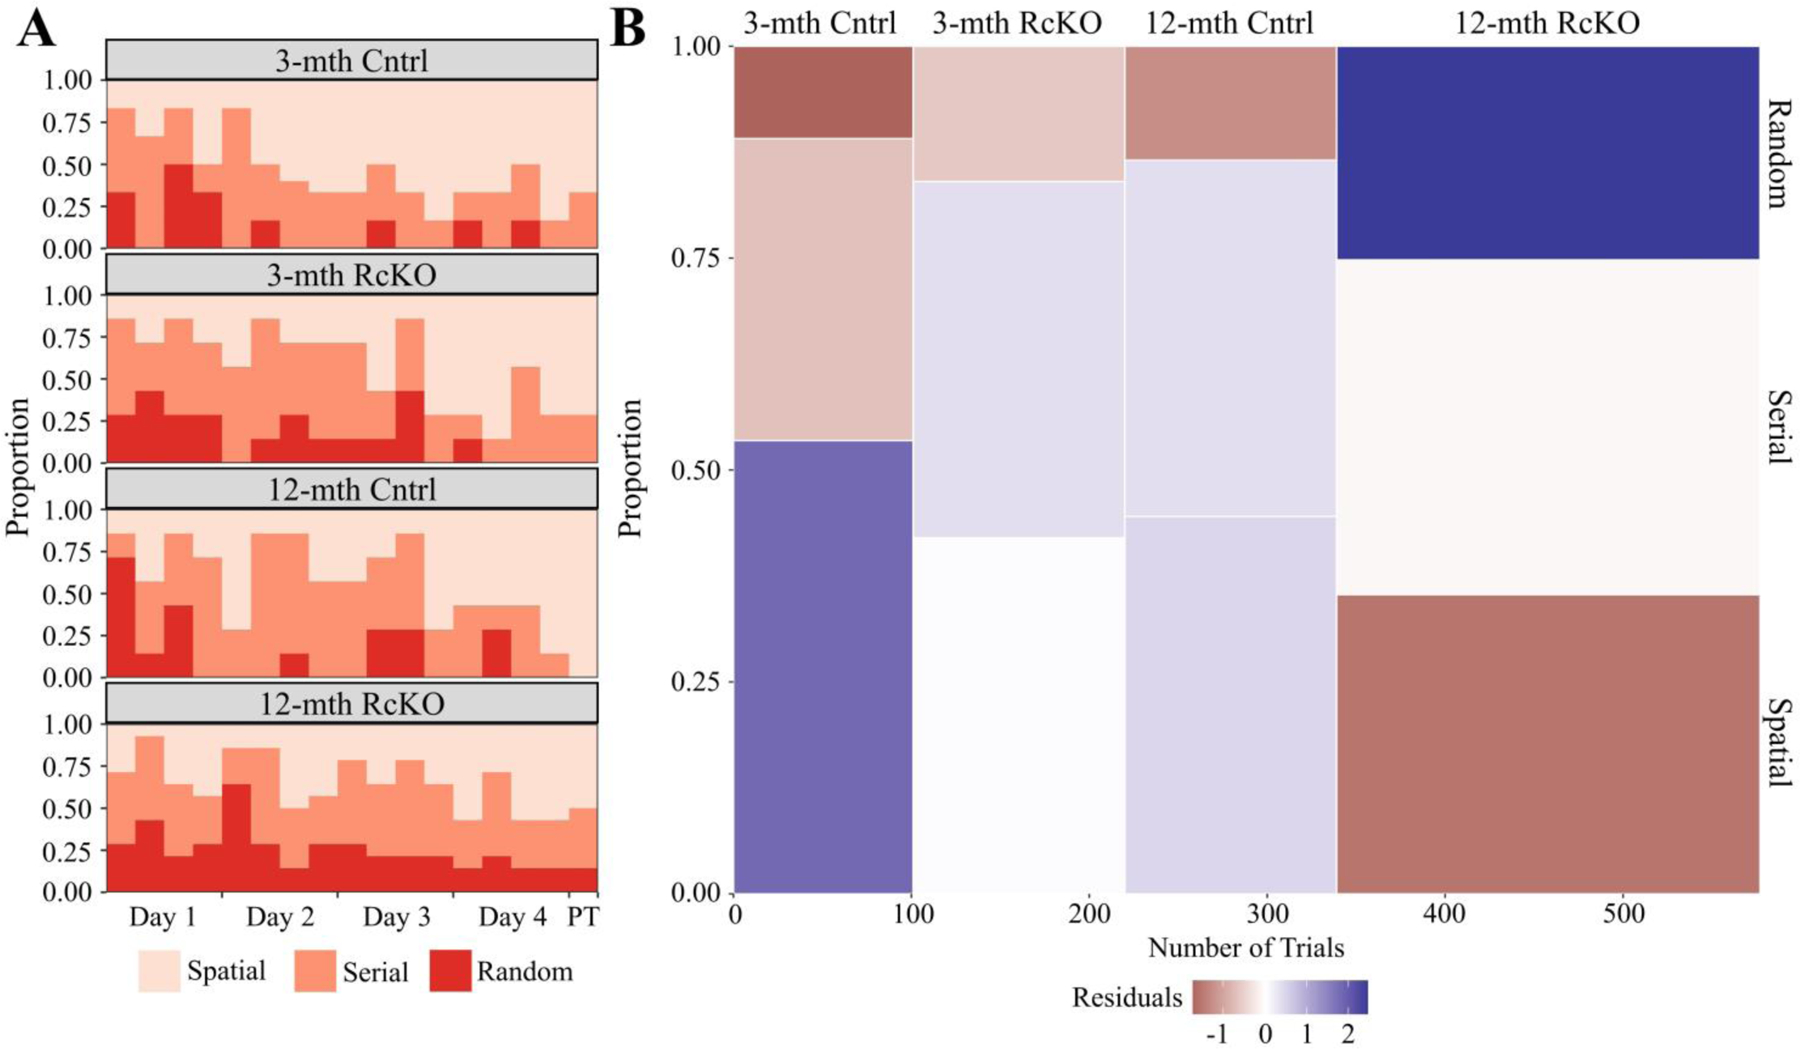
A) Relative probability diagram illustrating the proportion of animals utilizing search strategy during each trial except the initial training trial. A significant relationship was found (Kruskal-Wallis rank sum test; χ2(3) = 15.156, p = 0.0017). B) Mosaic plot visually representing χ2 test between search strategy and genotype. A significant relationship was found between genotype and search strategy (Pearson’s χ2; χ2(6, N = 578) = 17.735, p = 0.0069). The height of each bin shows cumulative proportion each genotype utilized a search strategy. The width of each bin is indicative of the number of trials used to calculate the proportion. Relative over/under-representation of a search strategy represented by continuous color scale plotting the residuals of the χ2 test. The initial training trial was excluded from this calculation. (3-mth Cntrl: n = 6; 3-mth RcKO: n = 7; 12-mth Cntrl: n = 7; 12-mth RcKO: n = 14). Abbreviations: PT - probe trial.
3.2.3. Contextual learning alterations observed in 12-month RcKOs
When mice of different ages were tested for learning ability in TFC, there were no significant changes seen in the tone test (Fig. 8A). However, performance in the context test mimicked that in the BM (Fig. 8B). Specifically, the 12-month RcKOs froze significantly more than the young-controls. This was accompanied by a non-significant trend (3-month Cntrl vs. 3-month RcKO: p = 0.072; 12-month Cntrl vs. 12-month RcKO: p = 0.072) for each RcKO condition to freeze for more time compared to its age-matched control. These results reinforce previous findings [7,9] which implicate Reelin expressing stellate cells as being important for context specific fear conditioning. Notably, learning was not ablated following the conditional knockout of reelin. However, truly superior learning in TFC would be indicated by enhanced freezing in the tone condition. Nevertheless, the non-specific associative learning indicated by the context freezing leads us to conclude that the 12-month RcKOs have altered TFC performance.
Figure 8. Aged Reelin cKO Cumulative Trace Fear Conditioning Time Frozen Measurements.
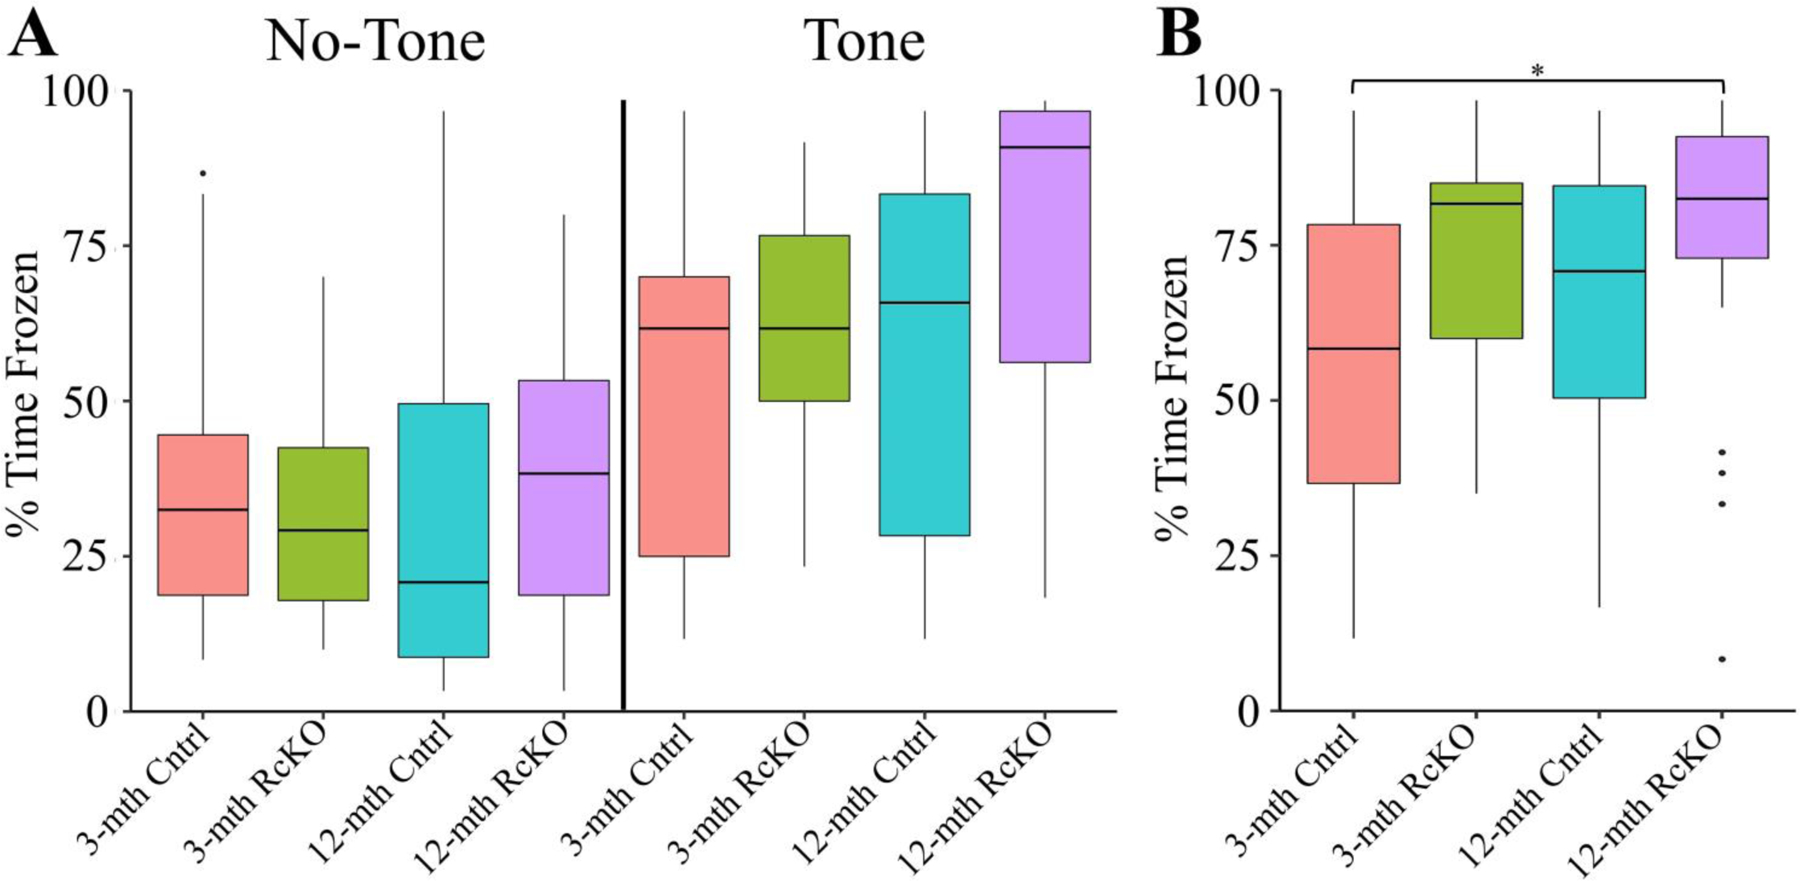
In all panels color is indicative of age and genotype (3-mth Cntrl: pink, 3-mth RcKO: green, 12-mth Cntrl: blue, 12-mth RcKO: violet). A) The boxplot for the percent of time frozen during minutes either in the absence of the tone (left) or containing the tone (right). There were no significant differences detected between groups (Kruskal-Wallis rank sum test; χ2(3) = 5.5307, p = 0.1368). B) The boxplot for the percent of time frozen during the entire context trial. Significant differences detected in the context test (Kruskal-Wallis rank sum test; χ2(3) = 9.7048, p = 0.0213). For TFC longitudinal data, see (Fig. S11). Pairwise comparisons for significance were determined using the Wilcoxon ranked sum test with Benjamini-Hochberg correction and are indicated by: * p < 0.05, ** p < 0.01, *** p < 0.001. All animals were stated age±2wk males (3-mth Cntrl: n = 5; 3-mth RcKO: n = 5; 12-mth Cntrl: n = 6; 12-mth RcKO: n = 6).
In summary, we discovered that 12-month RcKO mice displayed inferior spatial learning and memory compared to either cohort of 3-month mice as well as contextual learning changes in TFC. Therefore, we conclude that Reelin deficiency in conjunction with age can expedite HF-dependent learning deficits.
3.3. Experiment 3: MAPT:Reelin cKO severely impairs spatial learning and memory
In order to determine if Reelin deficiency in conjunction with MAPT triggered deficits in HF-dependent learning in adult mice (6-month), the RcKO and PS19 lines were crossed and subsequently tested in BM and TFC.
3.3.1. MAPT:cKO mice display impaired spatial task acquisition proficiency
MAPT:cKOs displayed an increased primary latency compared to all groups. Importantly, this difference is indicative of impaired acquisition proficiency because it was accompanied by either a corresponding increase in primary distance (vs. MAPT or Reelin cKO) or a comparable primary mean speed (vs. WT) (Fig. 9A-F). The primary pathing data for all mice separated by day of training is shown in the supplemental figures (Fig. S5). Clearly, the results indicate that the MAPT:cKOs has impaired acquisition proficiency of the spatial learning task.
Figure 9. Barnes Maze Primary Acquisition Measures for MAPT:Reelin cKO cohort.
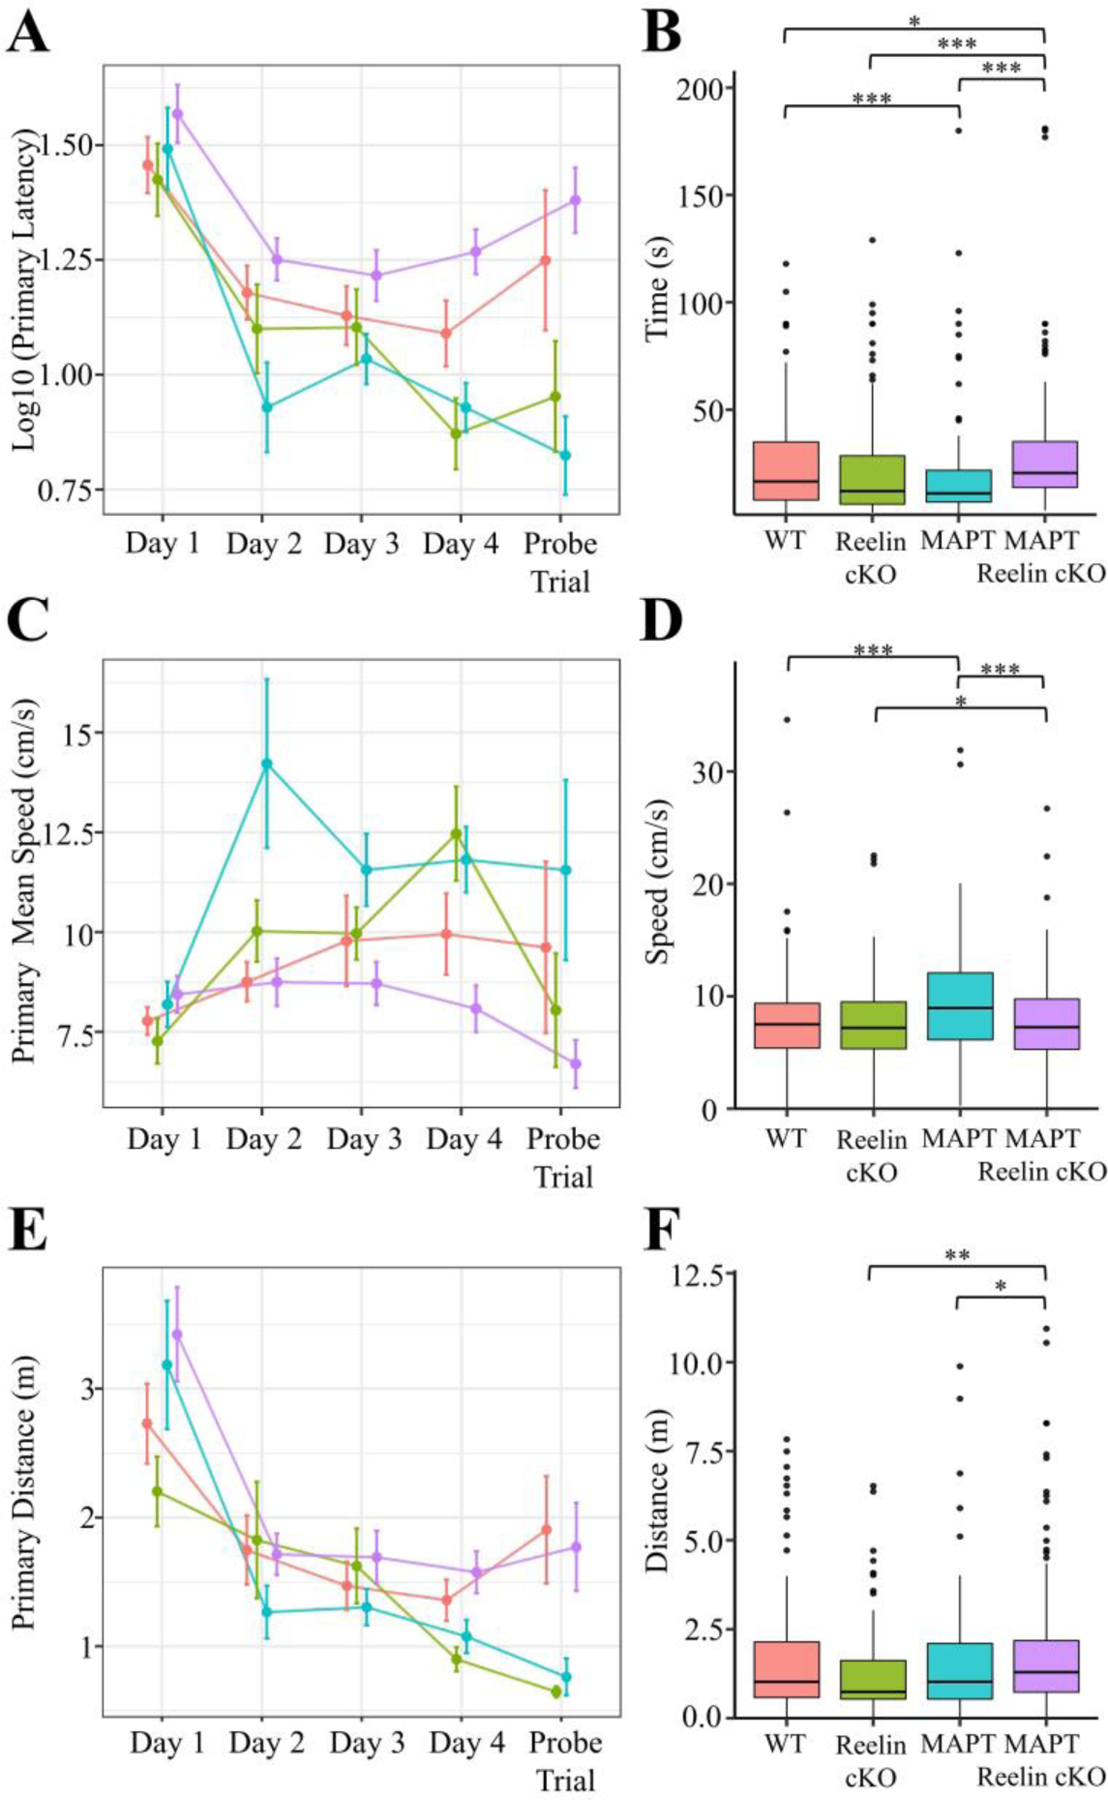
Primary (i.e. time to locate) A-F) measures were calculated for each trial. The mean ± SEM for each day A, C, E) and the boxplot for all trials B, D, F) segregated by genotype is plotted above for latency A-B), mean speed C-D), and distance E-F). In all panels color is indicative of age and genotype (WT: pink, Reelin cKO: green, MAPT: blue, MAPT Reelin cKO: violet). A-B) The primary latency showed a significant interaction with genotype (Kruskal-Wallis rank sum test; χ2(3) = 26.778, p < 0.0001). C-D) The primary mean speed (Kruskal-Wallis rank sum test; χ2(3) = 25.215, p < 0.0001) significantly varied between genotypes. E-F) The primary distance (Kruskal-Wallis rank sum test; χ2(3) = 14.108, p = 0.0028) significantly varied amongst genotypes. Pairwise comparisons for significance were determined using the Wilcoxon ranked sum test with Benjamini-Hochberg correction and are indicated by: * p < 0.05, ** p < 0.01, *** p < 0.001. All animals were 36±2week-old males. (WT: n = 8; Reelin cKO: n = 6; MAPT: n = 5; MAPT Reelin cKO: n = 9).
3.3.2. MAPT:cKO mice have inferior spatial memory and adaptation in the BM
Again, the former-goal location is preferred by all groups; however, the positional density appears more diffuse for the MAPT:cKOs (Fig. 10A). Interestingly, the MAPT:cKO group displayed a clear period of inactivity during the initial portion of the trial (an uncommon behavior in other groups) (Fig. 10B). Furthermore, the MAPT:cKOs displayed a significantly higher average distance from the goal compared to all other groups, thus indicating impaired retention proficiency. Notably, the WT group similarly displayed a higher average distance from the goal compared to the RcKO and MAPT cohorts. This observation seems to be explained by examining the search strategy utilization in the next figure (Fig. 11A). While the WT group tended to wain off random search strategies during training, during the probe trial a sudden resurgence in random strategies was observed. This atypical resurgence is likely responsible for the average distance differential and we consider it non-representative of the cohort in general. This is in contrast to the MAPT:cKOs, who throughout training had approximately 25% utilization of a random search strategy (Fig 11A). Moreover, the ~33% cumulative probability of spatial search strategies in the MAPT:cKOs (Fig 11B) is a clear indication of impaired adaptation proficiency. Therefore, because of the consistently inferior performance of the MAPT:cKOs as indicated by the adaptation and retention proficiency, we conclude this cohort has impaired spatial learning and memory.
Figure 10. Barnes Maze Extinction and Retention for MAPT:Reelin cKO cohort.
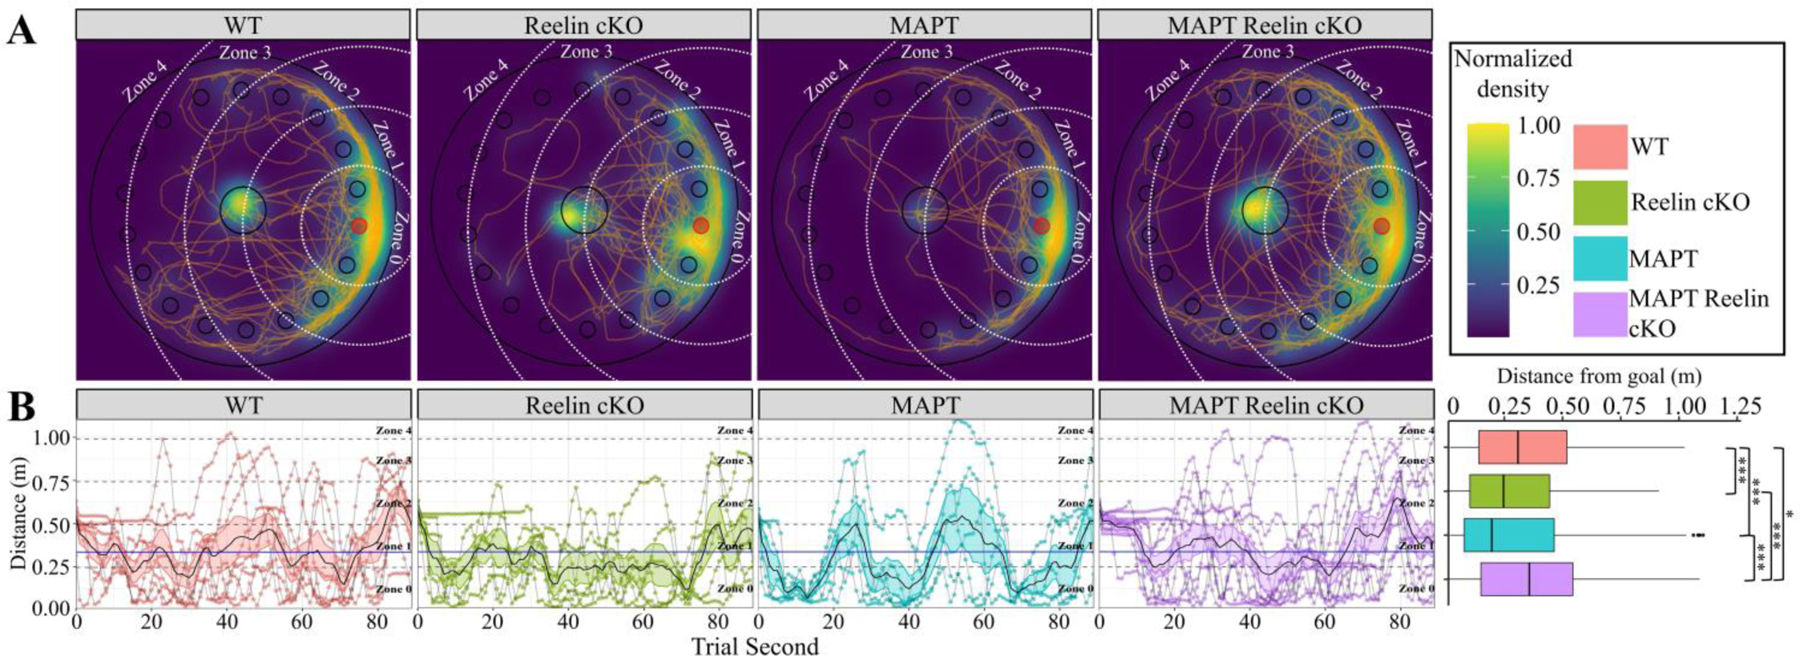
In all panels color is indicative of age and genotype (WT: pink, ReelincKO: green, MAPT: blue, MAPT Reelin cKO: violet). A) Choropleth, cartesian positional measurements normalized to the amount of time the position was occupied and overlaid upon a schematic of the apparatus. White dashed arcs: zone boundaries. Orange lines: path-traces of each mouse during the probe trial. B) Distance of each mouse from the goal location during each second of the probe trial. Grey lines connect consecutive measurements for each mouse. Zone occupancy shown via dashed lines. Solid black line with colored ribbon: mean ± SEM for each second of each genotype/age. Solid blue line: cohort mean (irrespective of genotype or age). The cumulative data displayed in the boxplot shows significant interaction between genotype and distance from the goal (Kruskal-Wallis rank sum test; χ2(3) = 61.585, p < 0.0001). Pairwise comparisons for significance were determined using the Wilcoxon ranked sum test with Benjamini-Hochberg correction and are indicated by: * p < 0.05, ** p < 0.01, *** p < 0.001. All animals were 36±2week-old males. (WT: n = 8; Reelin cKO: n = 6; MAPT: n = 5; MAPT Reelin cKO: n = 9).
Figure 11. Barnes Maze Search Strategy for MAPT:Reelin cKO cohort.
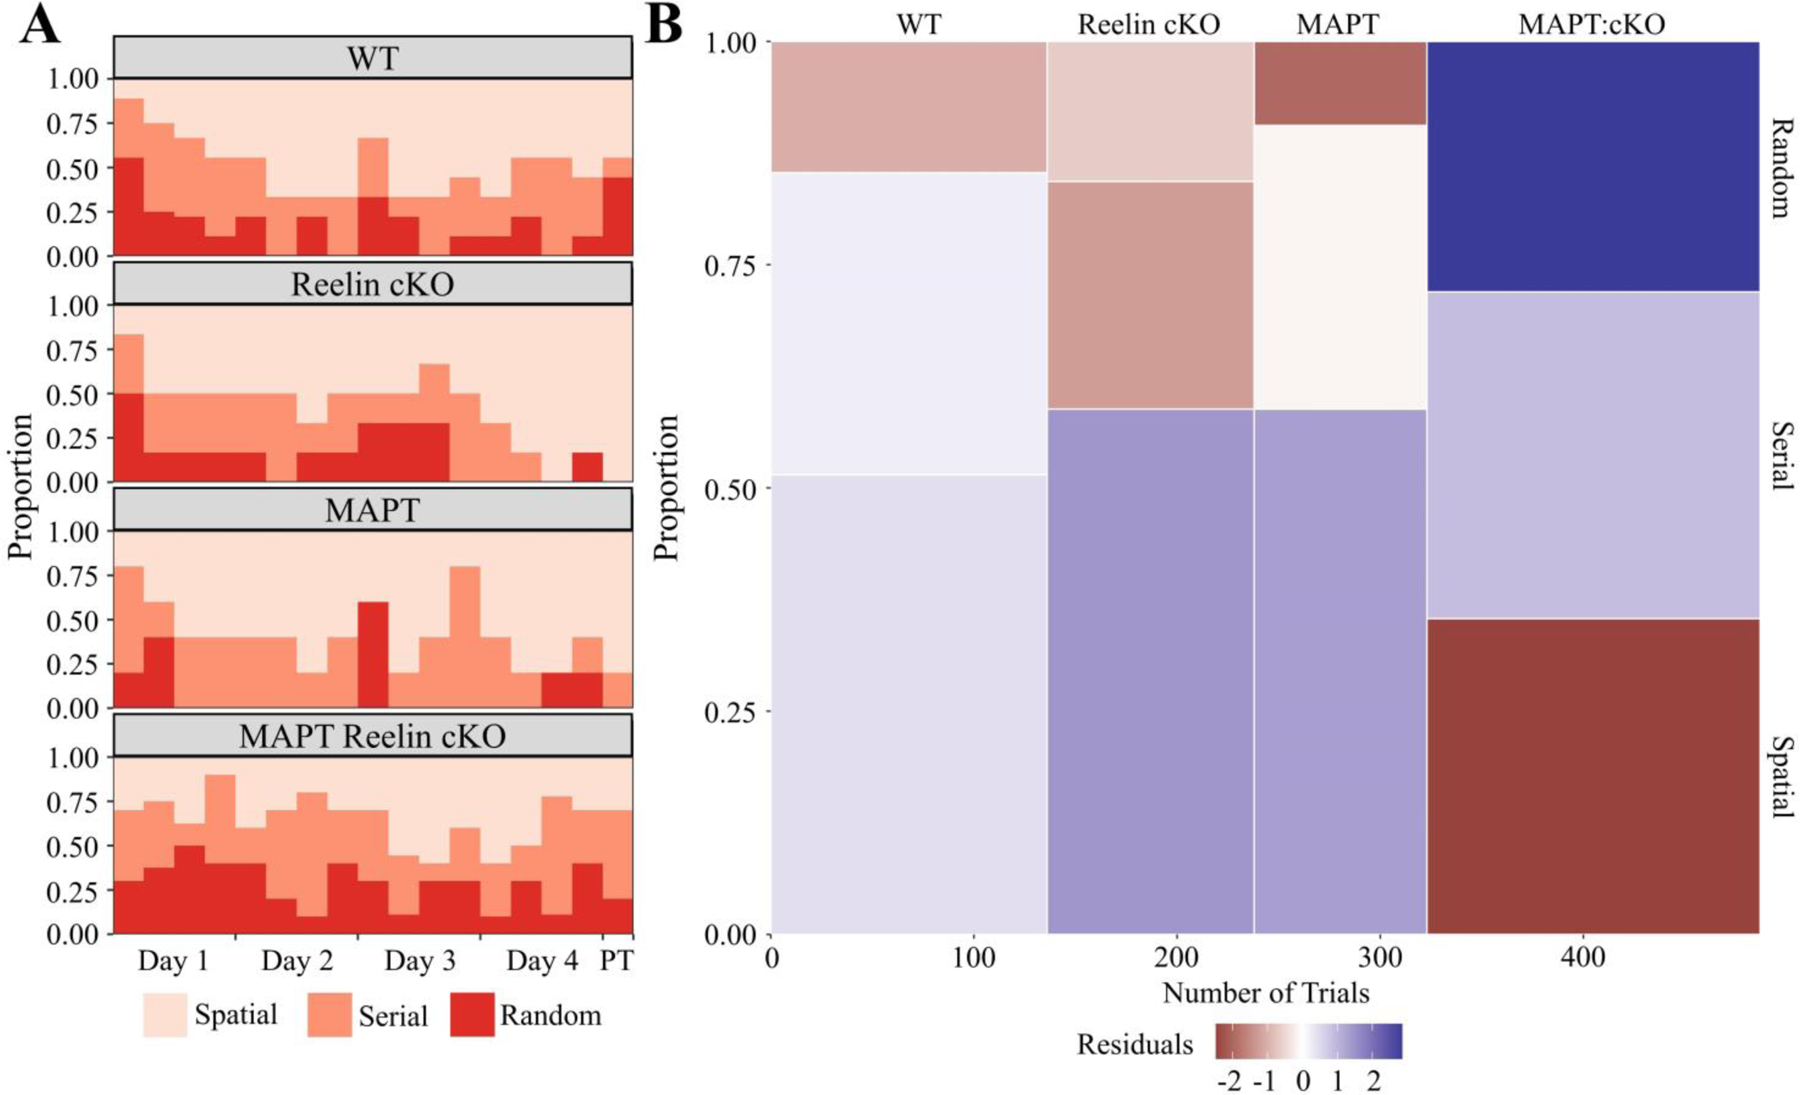
A) Relative probability diagram illustrating the proportion of animals utilizing search strategy during each trial except the initial training trial. A significant relationship was found (Kruskal-Wallis rank sum test; χ2(3) = 23.748, p < 0.0001). B) Mosaic plot visually representing χ2 test between search strategy and genotype. A significant relationship was found between genotype and search strategy (Pearson’s χ2; χ2(6, N = 493) = 25.943, p = 0.0002). The height of each bin shows cumulative proportion each genotype utilized a search strategy. The width of each bin is indicative of the number of trials used to calculate the proportion. Relative over/under-representation of a search strategy represented by continuous color scale plotting the residuals of the χ2 test. The initial training trial was excluded from this calculation. All animals were 36±2week-old males. (WT: n = 8; Reelin cKO: n = 6; MAPT: n = 5; MAPT Reelin cKO: n = 9). Abbreviations: PT - probe trial.
3.3.3. MAPT:cKO mice are prone to leaps from unadvisable heights
In eight of the 1,548 trials, a mouse abandoned the apparatus during the trial. In seven of these instances, the mouse was MAPT:cKO with the last being a WT from the same line. Given littermates’ performance making a sensory impairment unlikely, the lack of gravitational concern is likely to be phenotypically relevant. In contrast to results in the BM, no significant changes seen in either the tone or context tests during TFC (Fig. 12A-B). Altogether, the nonconcern for gravity and consistent impairments observed in the BM suggest that Reelin deficiency induces HF vulnerability to MAPT.
Figure 12. MAPT:Reelin cKO Cumulative Trace Fear Conditioning Time Frozen Measurements.
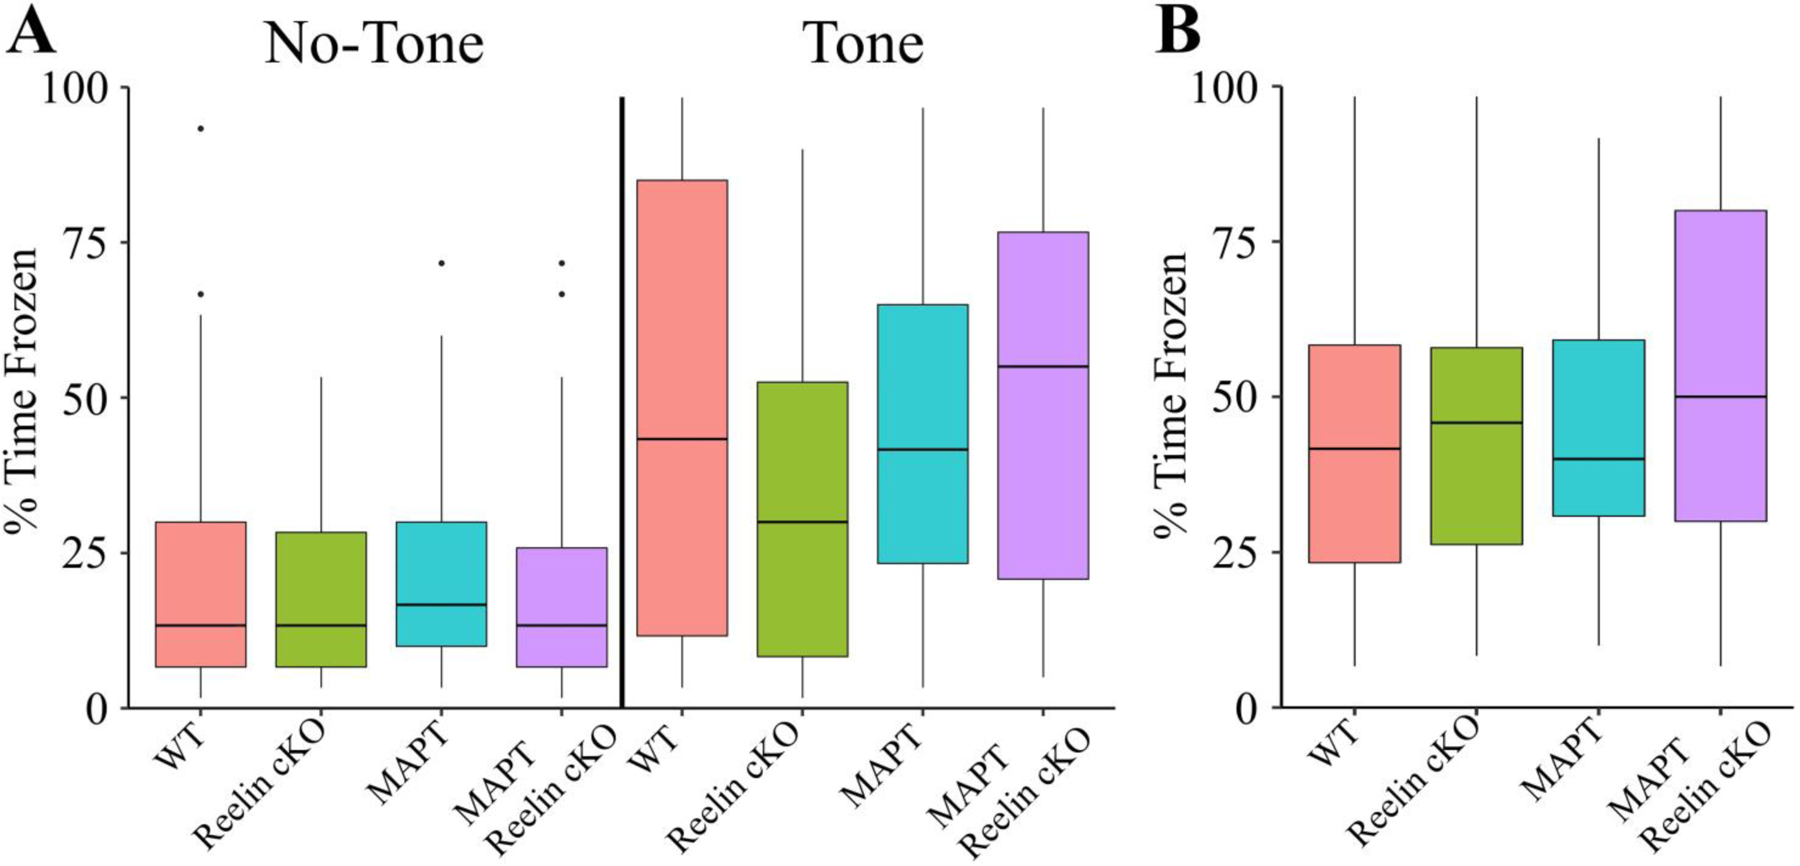
In all panels color is indicative of age and genotype (WT: pink, Reelin cKO: green, MAPT: blue, MAPT Reelin cKO: violet). A) The boxplot for the percent of time frozen during minutes either in the absence of the tone (left) or containing the tone (right). There were no significant differences detected between groups (Kruskal-Wallis rank sum test; χ2(3) = 2.217, p = 0.5286). B) The boxplot for the percent of time frozen during the entire context trial. No significant differences were detected in the context test (Kruskal-Wallis rank sum test; χ2(3) = 5.2075, p = 0.1572). For TFC longitudinal data, see (Fig. S12). All animals were 36±2wk males (WT: n = 13; Reelin cKO: n = 6; MAPT: n = 7; MAPT Reelin cKO n = 13).
4. Discussion
Briefly, the two highlights of our experiments include Reelin’s importance in HF-dependent behaviors and the analysis used to obtain this conclusion. The exhaustive analytical battery for the BM was crucial to the holistic characterization of spatial learning. Subsequently, we will first discuss how the methods used here may augment future analysis before discussing the implications of our findings.
4.1. Comments on Analytical Methods for Spatial Learning & Memory
Currently, spatial learning and memory is characterized through a myriad of different tests, measurements, and analyses. Despite these differences, the conclusions of any given study are likely condensed to: spatial impairment?: yes or no. While this simplification may be useful, it can generate confusion when conclusions compete while substantiated by different measures, tasks, etc. Here, we propose a set of terms with the aim of classifying and clarifying the nuances inherent in spatial learning tasks such as the BM (Tab. 1). These terms are intended to assist in analyzing, understanding, and interpreting of the behavioral data. Subsequently, we will discuss how these terms are used in our experiments as well as their relation to similar measures in literature.
The terms mentioned in (Tab. 1) fall into two distinct categories: time-valued (efficiency) terms or cumulative (proficiency) terms. While the terms often fail to be considered independently, we consider when learning occurs to provide valuable context for interpreting why there are differences in cumulative performance measures. Undoubtedly, the limitation of the time-valued analysis that it relies on comparisons of fractions of the obtained data and therefore requires a greater sample size compared to cumulative analysis. Nevertheless, even with small sample sizes, efficiency analysis can be effectively used to identify outliers such as those exhibited by the WT cohort during the probe trial of the third experiment. Furthermore, the inclusion of efficiency measures allows the data to be for easily screened for floor and ceiling effects which can skew interpretations of mean differences. Therefore, although efficiency analysis is not commonplace, we consider the information gained to be worth the analytical effort.
With regards to measures of proficiency, which are by-far the most common, we find it necessary to discuss cautionary notes. Particularly for acquisition proficiency measures such as latency, distance, and speed, we found that small differences in completion criterion can have drastic effects on the data. Specifically, the difference between finding and entering the goal location can greatly vary in the BM (Primary Figure vs. Total Figure: Fig. 1 vs. S6; Fig. 5 vs. S7; Fig. 9 vs. S8; Tab. S1).
Frequently, literature will report measures of “escape latency” or latency. While these terms may be fitting for tasks such as the MWM (where escape/finding the hidden platform necessarily overlaps with entering the platform), these terms may be unintentionally vague for tasks like the BM. We noticed several behaviors during the performing of the BM which drastically changed the data between the primary and total values. For example, both us and others [48] have noticed a phenomenon where a mouse who has familiarized themselves with the BM will initially go directly to the escape location, poke their head into it, and subsequently continue to explore the maze. While the mouse quickly found the escape location, without care the mouse’s latency score could reflect the total amount of time the mouse spent exploring. Therefore, we urge caution and particularly for the BM, insist that terms either be clearly defined or using terms which explicitly indicate the criterion for trial completion.
As an aside, we noticed throughout our experiments that latency variations are frequently explained by a corresponding change in speed. Because spatial tasks are not intended as dexterity tasks, it is crucial to consider the impacts which age and motivation can have upon the data. Throughout our experiments, we found the primary distance travelled to be the most consistent measure of acquisitional learning, although there were circumstances where latency changes were not accompanied by speed changes. In summation, if latency measures are to be used, they must be corroborated by speed measures to verify the change is due to proficiency and not simply due to speed.
Probe trials are generally considered the field-standard for spatial memory retention. The obvious short coming of these tests, is the entire experiment’s memory data is essentially reliant on a single trial performance. When atypical behavior occurs during this test, it can easily debunk an experiments findings and conclusions. As discussed before, we consider efficiency measurements to be useful for explaining potential oddities observed in the probe trial; however, we also consider the method of quantification to be of the utmost importance. Currently the standard quantification metric for the probe trial is the percent quadrant time. This metric, however, does not capture valuable information concerning the temporal pattern and severity of errors. For example, a mouse which spent the first half of the trial searching the opposite quadrant and the second half searching the target quadrant would have the same percent quadrant time as a mouse that did the opposite. Indeed, in a factor analysis of water maze behavior of over 1,400 mice, it was found that the percent of time in the goal quadrant was more indicative of thigmotactic behavior while the percent of time near the old goal was consistently correlated with memory [56]. Hence, we propose utilizing the distance from the goal metric. This metric, as demonstrated above, allows for classification of both extinction efficiency and retention proficiency while simultaneously ordinally representing performance for easy subsequent comparison.
Lastly, categorical search strategy classification has often been utilized as a complement to traditional statistics [57–61]. Aside from the aforementioned benefits of the adaptation efficiency, our experiments indicate that the strategy classification may be more sensitive to determining learning phenotypes. While the sensitivity aspect requires further documentation and the method is no panacea, the intuitive value gained from strategy analysis serves as an effective complement to an analytical battery of spatial learning.
Collectively, we propose the incorporation of the analytical techniques and terminology used here would effectively augment and clarify future studies investigating spatial learning and memory.
4.2. Experimental Implications
The first experiment showed an age-related spatial memory impairment while TFC performance comparable. Although it was anticipated that the oldest groups would show impairment in TFC as some authors have previously shown [62], the oldest group in the present experiment was only 18-months-of-age. More commonly in aging studies, mice are measured near 24-months-of-age and it is likely that the age differential is reflected in the current results. The results of the BM are quite reminiscent of other published literature which suggests that young mice are more likely to use a spatial search strategy [28]. Perhaps most importantly, however, the aging cohorts provided a useful frame of reference for the interpretation of subsequent experiments.
The second experiment specifically evidences the importance of Reelin in the HF. Consistently, the 12-month RcKO mice were more likely to use a random search strategy (Fig. 7). Notably, the 12-month RcKO mice also performed worse than the 18-month WT cohort of mice from an identical background (Fig. 3). The results from the TFC experiments have interesting implications. The Reelin excitatory neurons in the entorhinal cortex primarily synapse onto granule cells of the dentate gyrus [13] and this circuit has been implicated in contextual memory [9,63]. Although context learning was not ablated, Reelin deficiency significantly altered performance in aged mice suggesting abnormal functioning of the entorhinal cortex layer II-dentate gyrus pathway. Considered together, our findings indicate age sensitive pathways in the HF malfunction in the absence of Reelin.
In the final experiment RcKO in conjunction with the PS19 tauopathy model produced the most severe phenotype. MAPT:cKO mice consistently performed worse in the BM indicating that homeostatic Reelin and tau are important for spatial learning. Interestingly, there were no observed differences in TFC despite the gravitational apathy of the MAPT:cKOs. Due to the normal fear learning and unlikelihood of sensory impairment, we hypothesize that MAPT:cKO mice may have an impaired innate fear response. Furthermore, Reelin deficiency in the PS19 mice produced a severe spatial impairment. Given the vulnerability of Reelin-expressing entorhinal cortex layer II stellate cells to neurofibrillary tangle formation in AD [11,13], our findings implicate Reelin in not only spatial learning but also AD pathogenesis.
4.3. Conclusion
In conclusion, we find that Reelin deficiency combined with age or an AD tauopathy model measurably impairs performance in HF-dependent learning and memory. Moreover, our results corroborate with our original hypothesis that Reelin deficiency exacerbates behavioral impairments when comorbid with AD risk-factors. Clearly, Reelin has an important role in HF homeostasis and our findings further implicate the glycoprotein in AD pathogenesis.
Supplementary Material
Highlights.
Aging decreases spatial searching in wild-type mice.
Reelin cKO exacerbates and accelerates age-related spatial impairments.
Reelin cKO with P301S-MAPT (PS19) further accelerates and exacerbates spatial impairments.
Aged Reelin cKO mice have altered context learning in Trace Fear Conditioning
Acknowledgements
This research would not have been possible without the dedication of Tamara Terrones (mouse colony management) and the administrative support of Patricia Strackbein. Additionally, we would like to thank Isaac Rocha for his assistance in colony upkeep as well as K. Kuhbandner, D. Dixon, A. Brennan, A. Middleton, and A. Esparza for assistance in proofreading.
Funding
A.M., J.H. were supported by grants from the NHLBI (R37 HL063762), NIA (RF AG053391), the NINDS and NIA (R01 NS093382), BrightFocus A2016396S, the Bluefield Project to Cure FTD, and a Harrington Scholar Innovator Award (2019). L.C. was supported by postdoctoral fellowship grants from DFG (CA 1303/1–1).
Footnotes
Publisher's Disclaimer: This is a PDF file of an unedited manuscript that has been accepted for publication. As a service to our customers we are providing this early version of the manuscript. The manuscript will undergo copyediting, typesetting, and review of the resulting proof before it is published in its final form. Please note that during the production process errors may be discovered which could affect the content, and all legal disclaimers that apply to the journal pertain.
Declaration of Competing Interest
L.C. and J.H. are shareholders of Reelin Therapeutics Inc. L.C. and J.H. are coinventors of a patent related to anti-Reelin strategies (application number 15/763,047 and publication number 20180273637, title “Methods and Compositions for Treatment of Atherosclerosis”).
References
- [1].Jarrard LE. On the role of the hippocampus in learning and memory in the rat. Behavioral and Neural Biology. 1993; 60(1):9–26, ISSN 0163–1047, doi: 10.1016/0163-1047(93)90664-4 [DOI] [PubMed] [Google Scholar]
- [2].McEchron MD, Bouwmeester H, Tseng W, Weiss C, Disterhoft JF. Hippocampectomy disrupts auditory trace fear conditioning and contextual fear conditioning in the rat. Hippocampus. 1998; 8(6):638–646. doi: [DOI] [PubMed] [Google Scholar]
- [3].Chen C, Kim JJ, Thompson RF, Tonegawa S. Hippocampal lesions impair contextual fear conditioning in two strains of mice. Behavioral Neuroscience. 1996; 110(5):1177–1180. doi: 10.1037/0735-7044.110.5.1177 [DOI] [PubMed] [Google Scholar]
- [4].Ji J, Maren S. Differential roles for hippocampal areas CA1 and CA3 in the contextual encoding and retrieval of extinguished fear. Learn Mem. 2008; 15(4):244–251. Published 2008 Apr 3. doi: 10.1101/lm.794808 [DOI] [PMC free article] [PubMed] [Google Scholar]
- [5].Hirsh R. The hippocampus and contextual retrieval of information from memory: A theory. Behavioral Biology. 1974; 12(4):421–444, ISSN 0091–6773, doi: 10.1016/S0091-6773(74)92231-7 [DOI] [PubMed] [Google Scholar]
- [6].Hafting T, Fyhn M, Molden S, Moser MB, Moser EI. Microstructure of a spatial map in the entorhinal cortex. Nature. 2005; 436:801–806. doi: 10.1038/nature03721 [DOI] [PubMed] [Google Scholar]
- [7].Suh J, Rivest AJ, Nakashiba T, Tominaga T, Tonegawa S. Entorhinal Cortex Layer III Input to the Hippocampus Is Crucial for Temporal Association Memory. Science. 2011; 334(6061):1415–1420. doi: 10.1126/science.1210125 [DOI] [PubMed] [Google Scholar]
- [8].Kitamura T, Pignatelli M, Suh J, Kohara K, Yoshiki A, Abe K, Tonegawa S. Island Cells Control Temporal Association Memory. Science. 2014; 343(6173):896–901. Published 2014 Jan. 23 doi: 10.1126/science.1244634 [DOI] [PMC free article] [PubMed] [Google Scholar]
- [9].Kitamura T, Sun C, Martin J, Kitch LJ, Schnitzer MJ, Tonegawa S. Entorhinal Cortical Ocean Cells Encode Specific Contexts and Drive Context-Specific Fear Memory. Neuron. 2015; 87(6):1317–1331. Published 2015 Sep 23. doi: 10.1016/j.neuron.2015.08.036 [DOI] [PMC free article] [PubMed] [Google Scholar]
- [10].Solodkin A, Van Hoesen GW. Entorhinal cortex modules of the human brain. J Comp Neurol. 1996; 365(4):610–617. doi: [DOI] [PubMed] [Google Scholar]
- [11].Braak H, Braak E. Neuropathological stageing of Alzheimer-related changes. Acta Neuropathol. 1991; 82:239–259. 10.1007/BF00308809 [DOI] [PubMed] [Google Scholar]
- [12].Hyman BT, Van Hoesen GW, Damasio AR, Barnes CL. Alzheimer’s disease: cell-specific pathology isolates the hippocampal formation. Science. 1984; 225(4667):1168–1170. doi: 10.1126/science.6474172 [DOI] [PubMed] [Google Scholar]
- [13].Braak H, Del Tredici K., Schultz C, Braak E. Vulnerability of Select Neuronal Types to Alzheimer’s Disease. Annals of the New York Academy of Sciences, 2006; 924(2000): 53–61. doi: 10.1111/j.1749-6632.2000.tb05560.x [DOI] [PubMed] [Google Scholar]
- [14].Witter MP, Doan TP, Jacobsen B, Nilssen ES, Ohara S. Architecture of the Entorhinal Cortex A Review of Entorhinal Anatomy in Rodents with Some Comparative Notes. Front Syst Neurosci. 2017; 11:46. Published 2017 Jun 28. doi: 10.3389/fnsys.2017.00046 [DOI] [PMC free article] [PubMed] [Google Scholar]
- [15].Pesold C, Impagnatiello F, Pisu MG, Uzunov DP, Costa E, Guidotti A, Caruncho HJ.. Reelin is preferentially expressed in neurons synthesizing gamma-aminobutyric acid in cortex and hippocampus of adult rats. Proc Natl Acad Sci USA. 1998; 95(6):3221–3226. doi: 10.1073/pnas.95.6.3221 [DOI] [PMC free article] [PubMed] [Google Scholar]
- [16].Ramos-Moreno T, Galazo MJ, Porrero C, Martínez-Cerdeño V, Clascá F. Extracellular matrix molecules and synaptic plasticity: immunomapping of intracellular and secreted Reelin in the adult rat brain. European Journal of Neuroscience. 2006; 23:401–422. doi: 10.1111/j.1460-9568.2005.04567.x [DOI] [PubMed] [Google Scholar]
- [17].D’Arcangelo G. Reelin in the Years: Controlling Neuronal Migration and Maturation in the Mammalian Brain. Advances in Neuroscience. 2014; 2014:1–19. Article ID 597395. doi: 10.1155/2014/597395 [DOI] [Google Scholar]
- [18].Herz J, Chen Y. Reelin, lipoprotein receptors and synaptic plasticity. Nat Rev Neurosci. 2006; 7(11):850–859. doi: 10.1038/nrn2009 [DOI] [PubMed] [Google Scholar]
- [19].Ibi D, Nakasai G, Koide N, Sawahata M, Kohno T, Takaba R, Nagai T, Hattori M, Nabeshima T, Yamada K, Hiramatsu M. Reelin Supplementation Into the Hippocampus Rescues Abnormal Behavior in a Mouse Model of Neurodevelopmental Disorders. Frontiers in Cellular Neuroscience. 2020; 14:285. ISSN 1662–5102. doi: 10.3389/fncel.2020.00285 [DOI] [PMC free article] [PubMed] [Google Scholar]
- [20].Rogers JT, Rusiana I, Trotter J, Zhao L, Donaldson E, Pak DTS, Babus LW, Peters M, Banko JL, Chavis P, Rebeck GW, Hoe H, Weeber EJ. Reelin supplementation enhances cognitive ability, synaptic plasticity, and dendritic spine density. Learn Mem. 2011;18(9):558–564. Published 2011 Aug 18. doi: 10.1101/lm.2153511 [DOI] [PMC free article] [PubMed] [Google Scholar]
- [21].Durakoglugil MS, Chen Y, White CL, Kavalali ET, Herz J. Reelin signaling antagonizes β-amyloid at the synapse. Proceedings of the National Academy of Sciences. 2009; 106 (37):15938–15943. doi: 10.1073/pnas.0908176106 [DOI] [PMC free article] [PubMed] [Google Scholar]
- [22].Chin J, Massaro CM, Palop JJ, Thwin MT, Yu G, Bien-Ly N, Bender A, Mucke L. Reelin depletion in the entorhinal cortex of human amyloid precursor protein transgenic mice and humans with Alzheimer’s disease. J Neurosci. 2007; 27(11):2727–2733. doi: 10.1523/JNEUROSCI.3758-06.2007 [DOI] [PMC free article] [PubMed] [Google Scholar]
- [23].Stranahan AM, Haberman RP, Gallagher M. Cognitive Decline Is Associated with Reduced Reelin Expression in the Entorhinal Cortex of Aged Rats. Cerebral Cortex. 2011; 21(2):392–400. doi: 10.1093/cercor/bhq106 [DOI] [PMC free article] [PubMed] [Google Scholar]
- [24].Lugo JN, Smith GD, Holley AJ. Trace Fear Conditioning in Mice. J. Vis. Exp. 2014; (85), e51180. doi: 10.3791/51180 [DOI] [PMC free article] [PubMed]
- [25].Barnes CA. Aging and the physiology of spatial memory. Neurobiology of Aging. 1988; 9:563–568, ISSN 0197–4580, doi: 10.1016/S0197-4580(88)80114-3 [DOI] [PubMed] [Google Scholar]
- [26].Davis S, Markowska AL, Wenk GL, Barnes CA. Acetyl-L-carnitine: behavioral, electrophysiological, and neurochemical effects. Neurobiol Aging. 1993; 14(1):107–115. doi: 10.1016/0197-4580(93)90030-f [DOI] [PubMed] [Google Scholar]
- [27].Misane I, Tovote P, Meyer M, Spiess J, Ogren SO, Stiedl O. Time-dependent involvement of the dorsal hippocampus in trace fear conditioning in mice. Hippocampus. 2005; 15(4):418–426. doi: 10.1002/hipo.20067 [DOI] [PubMed] [Google Scholar]
- [28].Bach ME, Barad M, Son H, Zhuo M, Lu Y, Shih R, Mansuy I, Hawkins RD, Kandel ER. Age-related defects in spatial memory are correlated with defects in the late phase of hippocampal long-term potentiation in vitro and are attenuated by drugs that enhance the cAMP signaling pathway. PNAS. 1999; 96(9):5280–5285. doi: 10.1073/pnas.96.9.5280 [DOI] [PMC free article] [PubMed] [Google Scholar]
- [29].von Bohlen und Halbach O, Zacher C, Gass P, Unsicker K. Age-related alterations in hippocampal spines and deficiencies in spatial memory in mice. Journal of Neuroscience Research. 2006; 83:525–531. doi: 10.1002/jnr.20759 [DOI] [PubMed] [Google Scholar]
- [30].Murphy GG, Rahnama NP, Silva AJ. Investigation of Age-Related Cognitive Decline Using Mice as a Model System: Behavioral Correlates. The American Journal of Geriatric Psychiatry. 2006; 14(12):1004–1011. ISSN 1064–7481. doi: 10.1097/01.JGP.0000209405.27548.7b [DOI] [PubMed] [Google Scholar]
- [31].Porte Y, Buhot M, Mons N. Alteration of CREB phosphorylation and spatial memory deficits in aged 129T2/Sv mice. Neurobiology of Aging. 2008; 29(10):1533–1546. ISSN 0197–4580. doi: 10.1016/j.neurobiolaging.2007.03.023 [DOI] [PubMed] [Google Scholar]
- [32].Lane-Donovan C, Philips GT, Wasser CR, Durakoglugil MS, Masiulis I, Upadhaya A, Pohlkamp T, Coskun C, Kotti T, Steller L, Hammer RE, Frotscher M, Bock HH, Herz J. Reelin protects against amyloid β toxicity in vivo. Science Signaling. 2015; 8(384):ra67. doi: 10.1126/scisignal.aaa6674 [DOI] [PMC free article] [PubMed] [Google Scholar]
- [33].Yoshiyama Y, Higuchi M, Zhang B, Huang S, Iwata N, Saido TC, Maeda J, Suhara T, Trojanowski JQ, Lee VM. Synapse Loss and Microglial Activation Precede Tangles in a P301S Tauopathy Mouse Model. Neuron. 2007; 54(2):343–344. doi: 10.1016/j.neuron.2007.01.010 [DOI] [PubMed] [Google Scholar]
- [34].Chalermpalanupap T, Schroeder JP, Rorabaugh JM, Liles LC, Lah JJ, Levey AI, Weinshenker D. Locus Coeruleus Ablation Exacerbates Cognitive Deficits, Neuropathology, and Lethality in P301S Tau Transgenic Mice. Journal of Neuroscience. 2018; 38 (1) 74–92. doi: 10.1523/JNEUROSCI.1483-17.2017 [DOI] [PMC free article] [PubMed] [Google Scholar]
- [35].Takeuchi H, Iba M, Inoue H, Higuchi M, Takao K, Tsukita K, Karatsu Y, Iwamoto Y, Miyakawa T, Suhara T, Trojanowski JQ, Lee VM, Takahashi R. P301S mutant human tau transgenic mice manifest early symptoms of human tauopathies with dementia and altered sensorimotor gating. PLoS One. 2011; 6(6):e21050. doi: 10.1371/journal.pone.0021050 [DOI] [PMC free article] [PubMed] [Google Scholar]
- [36].Carroll JC, Iba M, Bangasser DA, Valentino RJ, James MJ, Brunden KR, Lee VM, Trojanowski JQ. Chronic Stress Exacerbates Tau Pathology, Neurodegeneration, and Cognitive Performance through a Corticotropin-Releasing Factor Receptor-Dependent Mechanism in a Transgenic Mouse Model of Tauopathy. Journal of Neuroscience. 2011; 31(40):14436–14449. doi: 10.1523/JNEUROSCI.3836-11.2011 [DOI] [PMC free article] [PubMed] [Google Scholar]
- [37].Brunden KR, Zhang B, Carroll J, Yao Y, Potuzak JS, Hogan AL, Iba M, James MJ, Xie SX, Ballatore C, Smith AB III, Lee VM, Trojanowski JQ. Epothilone D Improves Microtubule Density, Axonal Integrity, and Cognition in a Transgenic Mouse Model of Tauopathy. Journal of Neuroscience. 2010; 30(41):13861–13866. doi: 10.1523/JNEUROSCI.3059-10.2010 [DOI] [PMC free article] [PubMed] [Google Scholar]
- [38].Lasagna-Reeves CA, de Haro M, Hao S, Park J, Rousseaux MWC, Al-Ramahi I, Jafar-Nejad P, Vilanova-Velez L, See L, Maio AD, Nitschke L, Wu Z, Troncoso JC, Westbrook TF, Tang J, Botas J, Zoghbi HY. Reduction of Nuak1 Decreases Tau and Reverses Phenotypes in a Tauopathy Mouse Model. Neuron. 2016; 92(2):407–418. doi: 10.1016/j.neuron.2016.09.022 [DOI] [PMC free article] [PubMed] [Google Scholar]
- [39].Vagnozzi AN, Giannopoulos PF, Praticò D. Brain 5-lipoxygenase over-expression worsens memory, synaptic integrity, and tau pathology in the P301S mice. Aging Cell. 2018; 17:e12695. doi: 10.1111/acel.12695 [DOI] [PMC free article] [PubMed] [Google Scholar]
- [40].Nakaoku Y, Saito S, Yamamoto Y, Maki T, Takahashi R, Ihara M. The Dipeptidyl Peptidase-4 Inhibitor Linagliptin Ameliorates High-fat Induced Cognitive Decline in Tauopathy Model Mice. Int. J. Mol. Sci. 2019; 20(10): 2539. doi: 10.3390/ijms20102539 [DOI] [PMC free article] [PubMed] [Google Scholar]
- [41].Briggs DI, Defensor E, Ardestani PM, Yi B, Halpain M, Seabrook G, Shamloo M. Role of Endoplasmic Reticulum Stress in Learning and Memory Impairment and Alzheimer’s Disease-Like Neuropathology in the PS19 and APPSwe Mouse Models of Tauopathy and Amyloidosis. eNeuro. 2017; 4(4):ENEURO.0025–17.2017. Published 2017 Jul 14. doi: 10.1523/ENEURO.0025-17.2017 [DOI] [PMC free article] [PubMed] [Google Scholar]
- [42].Min S, Chen X, Tracy TE, Li Y, Zhou Y, Wang C, Shirakawa K, Minami SS, Defensor E, Mok SA, Sohn PD, Schilling B, Cong X, Ellerby L, Gibson BW, Johnson J, Krogan N, Shamloo M, Gestwicki J, Masliah E, Verdin E, Gan L. Critical role of acetylation in tau-mediated neurodegeneration and cognitive deficits. Nat Med. 2015; 21:1154–1162 doi: 10.1038/nm.3951 [DOI] [PMC free article] [PubMed] [Google Scholar]
- [43].Dumont M, Stack C, Elipenahli C, Jainuddin S, Gerges M, Starkova NN, Yang L, Starkov AA, Beal F. Behavioral deficit, oxidative stress, and mitochondrial dysfunction precede tau pathology in P301S transgenic mice. The FASEB Journal. 2011; 25:4063–4072. doi: 10.1096/fj.11-186650 [DOI] [PMC free article] [PubMed] [Google Scholar]
- [44].Giannopoulos PF, Chiu J, Praticò D. Antileukotriene therapy by reducing tau phosphorylation improves synaptic integrity and cognition of P301S transgenic mice. Aging Cell. 2018;17(3):e12759. doi: 10.1111/acel.12759 [DOI] [PMC free article] [PubMed] [Google Scholar]
- [45].Zhang B, Carroll J, Trojanowski JQ, Yao Y, Iba M, Potuzak JS, Hogan AL, Xie SX, Ballatore C, Smith AB III, Lee VM, Brunden KR. The Microtubule-Stabilizing Agent, Epothilone D, Reduces Axonal Dysfunction, Neurotoxicity, Cognitive Deficits, and Alzheimer-Like Pathology in an Interventional Study with Aged Tau Transgenic Mice. Journal of Neuroscience. 2012; 32 (11):3601–3611. doi: 10.1523/JNEUROSCI.4922-11.2012 [DOI] [PMC free article] [PubMed] [Google Scholar]
- [46].Fan Q, He W, Gayen M, Benoit MR, Luo X, Hu X, Yan R. Activated CX3CL1/Smad2 Signals Prevent Neuronal Loss and Alzheimer’s Tau Pathology-Mediated Cognitive Dysfunction. Journal of Neuroscience. 2020; 40(5):1133–1144. doi: 10.1523/JNEUROSCI.1333-19.2019 [DOI] [PMC free article] [PubMed] [Google Scholar]
- [47].Litvinchuk A, Wan Y, Swartzlander DB, Chen F, Cole A, Propson NE, Wang Q, Zhang B, Liu Z, Zheng H, Complement C3aR Inactivation Attenuates Tau Pathology and Reverses an Immune Network Deregulated in Tauopathy Models and Alzheimer’s Disease. Neuron. 2018; 100(6):1337–1353.e5. ISSN 0896–6273. doi: 10.1016/j.neuron.2018.10.031 [DOI] [PMC free article] [PubMed] [Google Scholar]
- [48].Gawel K, Gibula E, Marszalek-Grabska M, Filarowska J, Kotlinska JH, Assessment of spatial learning and memory in the Barnes maze task in rodents-methodological consideration. Naunyn-Schmiedeberg’s Archives of Pharmacology. 2019; 392:1–18. doi: 10.1007/s00210-018-1589-y [DOI] [PMC free article] [PubMed] [Google Scholar]
- [49].Markowska AL, Sex Dimorphisms in the Rate of Age-Related Decline in Spatial Memory: Relevance to Alterations in the Estrous Cycle. Journal of Neuroscience. 1999; 19(18):8122–8133. doi: 10.1523/JNEUROSCI.19-18-08122.1999 [DOI] [PMC free article] [PubMed] [Google Scholar]
- [50].Lein E, Hawrylycz M, Ao N et al. Genome-wide atlas of gene expression in the adult mouse brain. Nature. 2007; 445:168–176. doi: 10.1038/nature05453 [DOI] [PubMed] [Google Scholar]
- [51].Allan Mouse Brain Atlas. Experiment 79556624. (2009) URL: https://mouse.brain-map.org/experiment/show/79556624 [Google Scholar]
- [52].RStudio Team. RStudio: Integrated Development for R. 2020; RStudio, PBC, Boston, MA: URL: http://www.rstudio.com/. [Google Scholar]
- [53].R Core Team. R: A language and environment for statistical computing. 2019; R Foundation for Statistical Computing, Vienna, Austria. URL: https://www.R-project.org/ [Google Scholar]
- [54].Wickham H, Averick M, Bryan J, Chang W, McGowan LD, François R, Grolemund G, Hayes A, Henry L, Hester J, Kuhn M, Pedersen TL, Miller E, Bache SM, Müller K, Ooms J, Robinson D, Seidel DP, Spinu V, Takahashi K, Vaughan D, Wilke C, Woo K, Yutani H. Welcome to the tidyverse. Journal of Open Source Software. 2019; 4(43):1686, doi: 10.21105/joss.01686 [DOI] [Google Scholar]
- [55].Hijmans RJ. raster: Geographic Data Analysis and Modeling. R package version 3.1–5. 2020; URL: https://CRAN.R-project.org/package=raster
- [56].Wolfer DP, Stagljar-Bozicevic M, Errington ML, Lipp HP. Spatial Memory and Learning in Transgenic Mice: Fact or Artifact?. News Physiol Sci. 1998; 13:118–123. doi: 10.1152/physiologyonline.1998.13.3.118 [DOI] [PubMed] [Google Scholar]
- [57].Illouz T, Madar R, Clague C, Griffioen KJ, Louzoun Y, Okun E. Unbiased classification of spatial strategies in the Barnes maze. Bioinformatics. 2016; 32(21):3314–3320. doi: 10.1093/bioinformatics/btw376 [DOI] [PubMed] [Google Scholar]
- [58].Brody DL, Holtzman DM. Morris water maze search strategy analysis in PDAPP mice before and after experimental traumatic brain injury. Exp Neurol. 2006; 197(2):330–340. doi: 10.1016/j.expneurol.2005.10.020 [DOI] [PMC free article] [PubMed] [Google Scholar]
- [59].Janus C. Search strategies used by APP transgenic mice during navigation in the Morris water maze. Learn Mem. 2004; 11(3):337–346. doi: 10.1101/lm.70104 [DOI] [PMC free article] [PubMed] [Google Scholar]
- [60].Stone SSD, Teixeira CM, DeVito LM, Zaslavsky K, Josselyn SA, Lozano AM, Frankland PW. Stimulation of Entorhinal Cortex Promotes Adult Neurogenesis and Facilitates Spatial Memory. Journal of Neuroscience. 2011; 31(38):13469–13484. doi: 10.1523/JNEUROSCI.3100-11.2011 [DOI] [PMC free article] [PubMed] [Google Scholar]
- [61].Rosenfeld CS, Ferguson SA. Barnes Maze Testing Strategies with Small and Large Rodent Models. J. Vis. Exp. 2014; (84):e51194. doi: 10.3791/51194 [DOI] [PMC free article] [PubMed]
- [62].Blank T, Nijholt I, Kye M. Radulovic J, Spiess J. Small-conductance, Ca2+-activated K+ channel SK3 generates age-related memory and LTP deficits. Nat Neurosci. 2003; 6:911–912. doi: 10.1038/nn1101 [DOI] [PubMed] [Google Scholar]
- [63].Hernández-Rabaza V, Hontecillas-Prieto L, Velázquez-Sánchez C, Ferragud A, Pérez-Villaba A, Arcusa A, Barcia JA, Trejo JL, Canales JJ. The hippocampal dentate gyrus is essential for generating contextual memories of fear and drug-induced reward. Neurobiology of Learning and Memory. 2008; 90(3):553–559. ISSN 1074–7427. doi: 10.1016/j.nlm.2008.06.008. [DOI] [PubMed] [Google Scholar]
Associated Data
This section collects any data citations, data availability statements, or supplementary materials included in this article.


