



Abstract
Ionizing radiation causes DNA damage and is a mainstay for cancer treatment, but we have limited understanding of its genomic impact. We analyzed mutational spectra following radiotherapy in 190 paired primary and recurrent gliomas from the Glioma Longitudinal Analysis (GLASS) Consortium and 3,693 post-treatment metastatic tumors from the Hartwig Medical Foundation. We identified radiotherapy-associated significant increases in the burden of small deletions (1–20 bp) and large deletions (20+ bp to chromosome-arm length). Small deletions were characterized by a larger span size, lacking breakpoint microhomology and were genomically more dispersed when compared to pre-existing deletions and deletions in non-irradiated tumors. Mutational signature analysis implicated c-NHEJ-mediated DNA damage repair and APOBEC-mutagenesis following radiotherapy. A high radiation-associated deletion burden was associated with worse clinical outcomes, suggesting that effective repair of radiation-induced DNA damage is detrimental to patient survival. These results may be leveraged to predict sensitivity to radiation therapy in recurrent cancer.
INTRODUCTION
Radiation therapy or radiotherapy (RT) is used in the clinical management of more than half of all cancer patients1,2. Ionizing radiation kills cells by inducing DNA damage such as double-strand breaks (DSBs), leading to cell death if left unrepaired or repaired in a manner that inhibits subsequent replication. DNA repair pathways are activated in response to DSBs, and these pathways include the error-free homologous recombination (HR) pathway and three error-prone pathways: classical non-homologous end joining (c-NHEJ), alternative end joining (a-EJ) or single strand annealing (SSA)3. In contrast to HR, c-NHEJ, a-EJ and SSA require different lengths of microhomologous sequences present on exposed DNA ends. Whereas c-NHEJ requires no microhomologies, a-EJ uses 2–20 bp length of microhomology (also called microhomology-mediated end joining, MMEJ) and SSA uses >20 bp of (micro-)homology. These repair processes may cause changes in the post-treatment cancer genome that can be detected through sequencing. The identification of therapy-associated mutations may imply an effect of therapy on the tumor and can aid in characterization of therapy-resistance mechanisms. A well-known example of such a process is hypermutation following treatment with DNA-alkylating agents, observed across cancers4 and in particular following temozolomide (TMZ) chemotherapy of gliomas5,6. Similarly, an increased burden of small deletions has been observed in radiation-induced malignancies7. Despite these advancements, the mutational footprints of palliative and curative radiation in sporadic tumors are not well understood.
To address this gap in knowledge we analyzed pre- and post-treatment datasets from the Glioma Longitudinal Analysis (GLASS) cohort as well as post-treatment metastatic tumor datasets from the Hartwig Medical Foundation (HMF)5,8,9. We identified a significant increase of small 5–15bp deletions, large deletions and inversions (>20 bp) in response to ionizing radiation, which we genomically characterized. Finally, we observed that the identified signatures were associated with worse clinical outcomes.
RESULTS
Radiotherapy drives small deletion burden
Radiotherapy and temozolomide are the post-surgical standard of care for glioma patients10. We assessed the impact of RT and/or TMZ on the somatic mutation burden, including somatic single nucleotide variants (sSNVs) and small insertions/deletions (indels, length of 1 to 20bp), in matched pre- and post-treatment glioma samples (n = 190 patients). Of these, 119 (63%) patients received RT and TMZ, 19 (10%) received RT alone, 13 (7%) received only TMZ, and 16 (8%) received neither RT nor TMZ. For 23/190 (12%) cases, TMZ annotation was lacking with 18 of these having received RT. For each patient, we separated mutations into pre- (present in the primary tumor) and post-treatment (acquired, only present in the recurrent tumor). We then calculated the mutation burden (average mutation frequency per megabase (Mb)) of post-treatment mutations. A median of 0.68 new small deletions/Mb were acquired in recurrent RT-treated glioma which was significantly higher than the median of 0.19 new small deletions/Mb acquired in recurrent RT-naïve gliomas (Fig. 1a, P = 5.1e-03, Mann-Whitney U test), and significantly higher than the small deletion burden detected at diagnosis (Fig. 1b). RT was not associated with a significant increase in sSNV burden (Extended Data Fig. 1a, P = 4.7e-01, Mann-Whitney U test) or small insertion burden (Extended Data Fig. 1a, P = 6.7e-01, Mann-Whitney U test). The small deletion increase was particularly pronounced in gliomas marked by the presence of mutations in IDH1, a clinically relevant subtype11 predominantly consisting of grade II and III gliomas (Extended Data Fig. 1b, P = 1.4e-02, Mann-Whitney U test). The number of RT-naïve recurrent cases among IDH wild-type glioma was too small to test for differences (n = 2, vs n = 107 RT-treated cases). To ensure that these changes were not due to TMZ-associated hypermutation (>10 mut/Mb at recurrence)5, we stratified the cohort by hypermutation status. Hypermutation associated with small deletion increase independent of RT-treatment, whereas amongst non-hypermutators only RT-treated patients showed a significant increase in small deletions (Fig. 1b, P = 5.0e-11, paired Wilcoxon signed-rank test). To evaluate the independence of this finding from potential confounders, we fitted a multivariable log-linear regression model that included TMZ-treatment, glioma molecular subtype, time interval between surgeries and hypermutation. RT was independently associated with an increase in small deletions (Fig. 1c, P = 3e-03, t-test), directly attributing the observed small deletion increase to RT-treatment. Acquired small deletions were not more clonal/subclonal (Extended Data Fig. 1c, hypermutant: P = 9.3e-01, non-hypermutant: P = 8.7e-01, Mann-Whitney U test). Comparing the pre-treatment mutation burden and aneuploidy scores between high- and low- post-treatment deletion burden tumors revealed no significant differences, suggesting that these pre-RT tumor genomic characteristics are not predictive of RT-induced small deletion acquisition.
Fig. 1. Radiotherapy is associated with an increased small deletion burden.
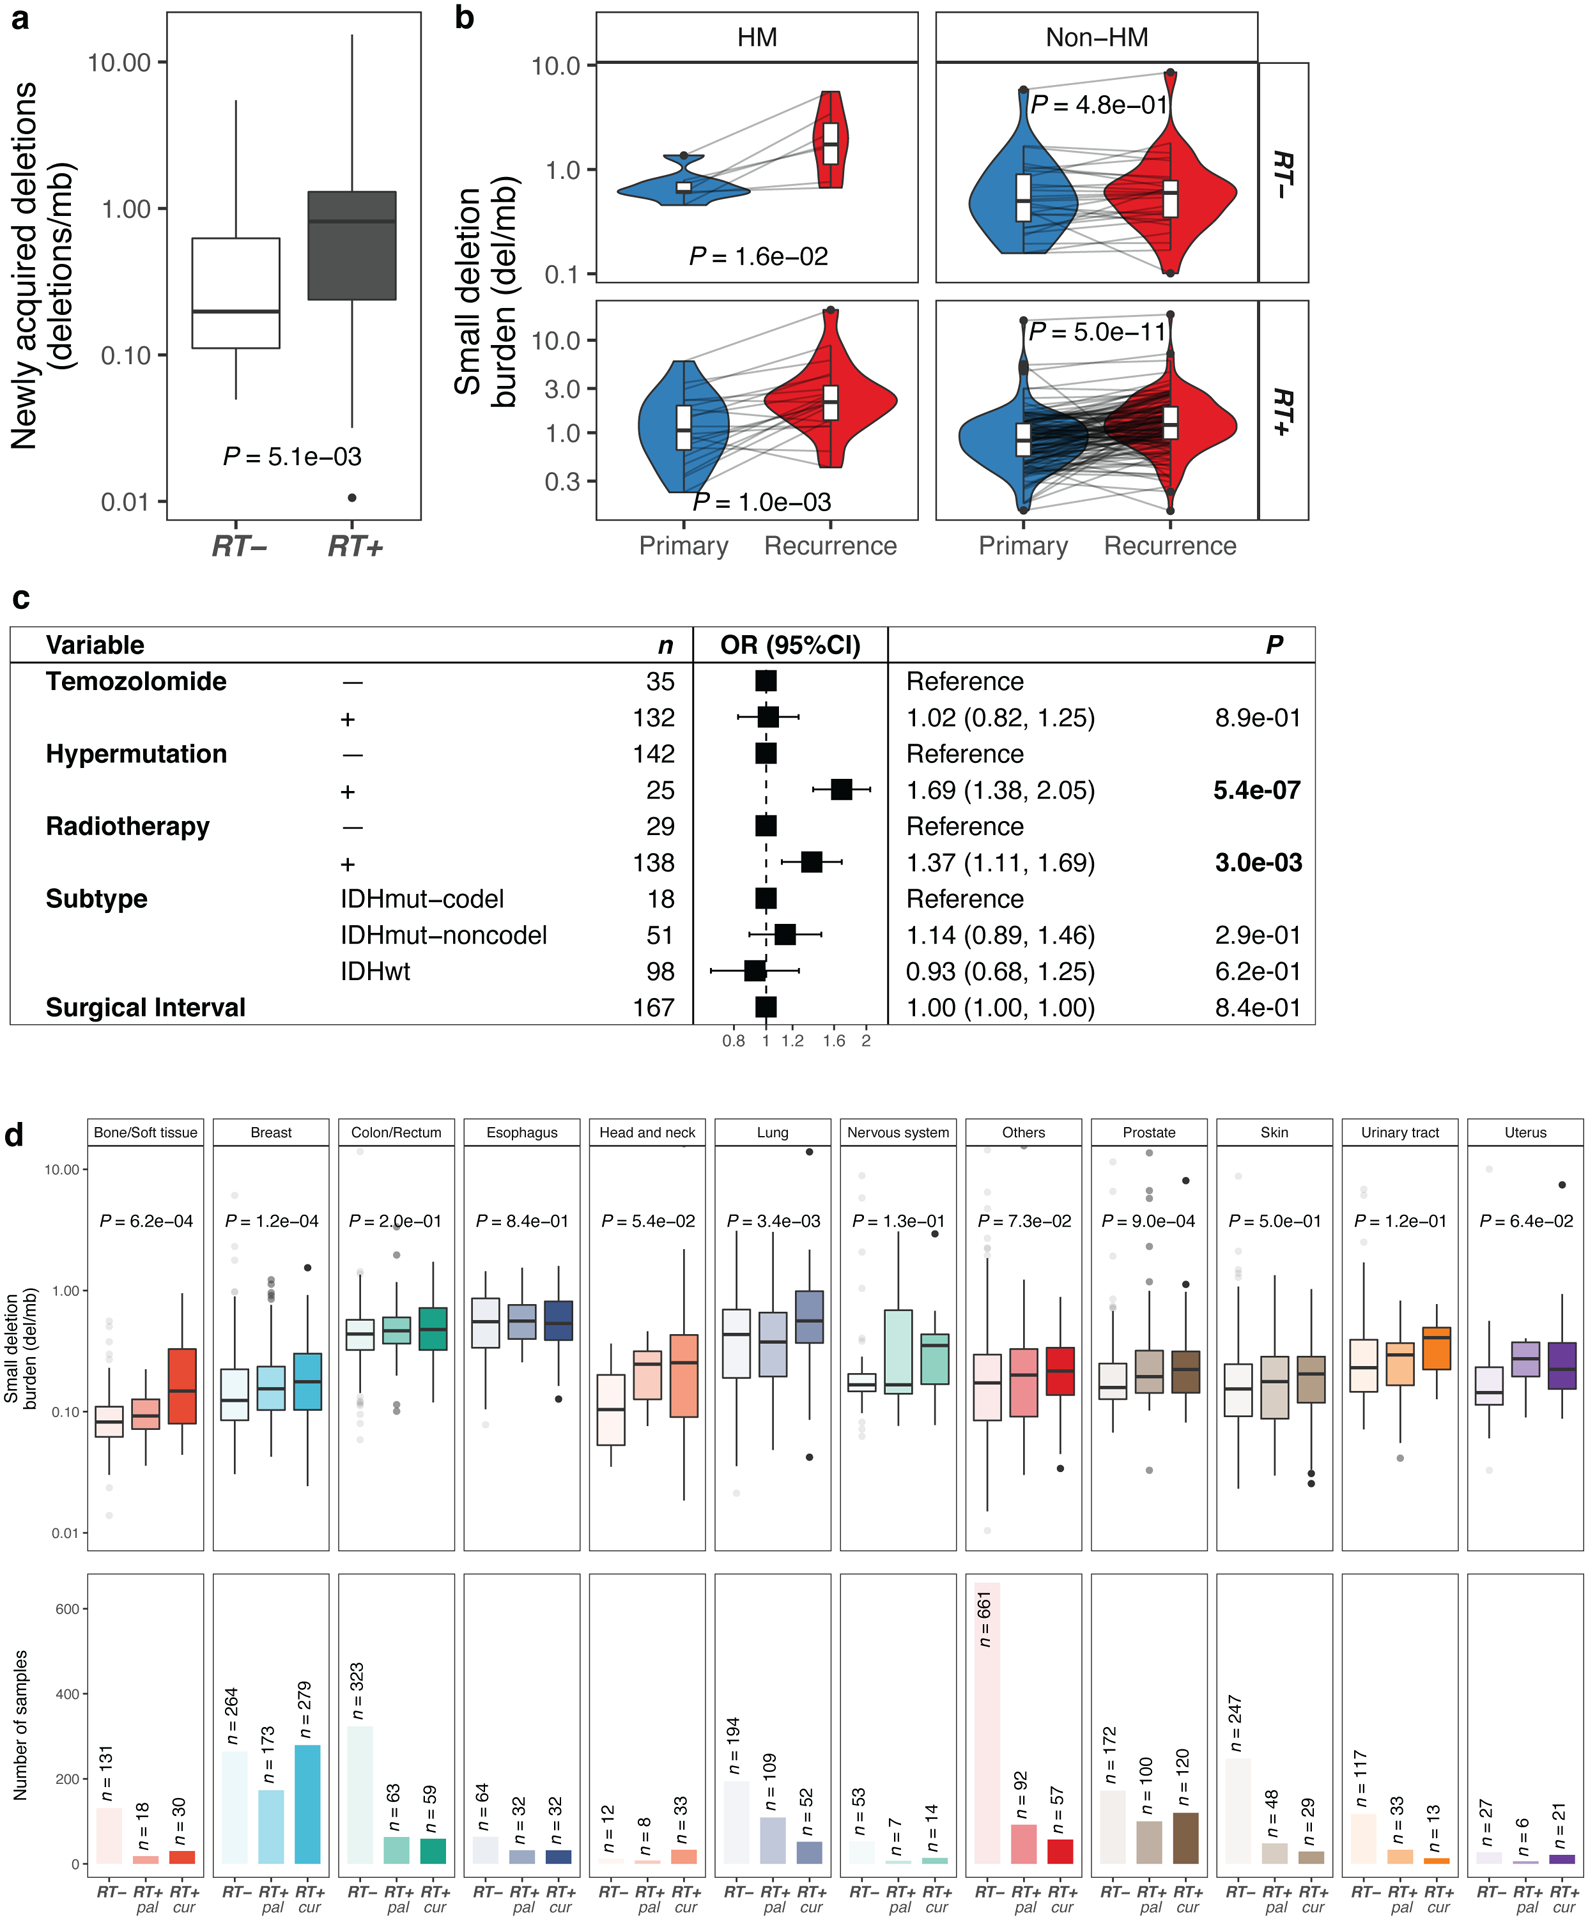
a. Boxplot (in this and all following figures: boxes span quartiles, center lines as medians, whiskers represent absolute range, excluding outliers) depicting the burden of newly acquired/post-treatment small deletions (deletions/Mb) in RT-naïve (n = 34) and RT-received (n = 156) patients from the GLASS cohort. Two-sided Mann-Whitney U test was applied for statistical testing.
b. Longitudinal comparison of small deletion burden between primary and recurrent glioma samples, separated by hypermutation (HM) and Radiotherapy (RT). Two-sided paired Wilcoxon signed-rank test was applied for statistical testing
c. Forest plot showing multivariable log-linear regression model of newly acquired small deletion burden(deletions/Mb) including 1. TMZ-treatment, 2. Hypermutation, 3. RT-treatment, 4. Molecular subtype and 5. Surgical interval (in months) as variables. Two-sided t-test was applied. OR, Odds Ratio, CI, confidence interval.
d. Top. Metastatic cohort: Boxplots depicting small deletion burden (deletions/Mb) in RT-naïve (left), RT-treated with palliative intent (RT+ pal, middle) and RT-treated with curative intent (RT+ cur, right) tumor samples separated by primary tumor location. Two-sided Kruskal-Wallis test was applied for statistical testing. Bottom. Sample sizes of metastatic cohort separated by primary tumor location.
Importantly, 30% (41/136) of non-hypermutant samples gained >1 del/Mb following radiotherapy, compared to 7% (2/27) of RT-naïve non-hypermutators (P = 1.6e-02, Fisher’s exact test). The association between RT-treatment and mutational burden was significant for small deletions but not for insertions and sSNVs. Conversely, TMZ-associated hypermutation was correlated with a significant increase in the burden of all types of mutations (Extended Data Fig. 1d).
Following these observations, we hypothesized that radiotherapy may have similar effects in other tumor types. We evaluated whole-genome sequencing-derived mutational profiles from 3693 metastatic tumors with complete treatment annotation (Extended Data Fig. 1e), available via the Hartwig Medical Foundation (HMF)8. We separated tumors by site of origin and compared the small deletion burden between RT-treated and RT-naïve tumors (Fig. 1d). RT-treated tumors were further stratified depending on whether the treatment intent was curative (RT+cur, n = 739) or palliative (RT+pal, n = 689), which differ in cumulative radiation dosage12. While this analysis was restricted to single time-point mutational profiles, we observed a significantly higher small deletion burden in RT-treated patients across multiple tumor types, including bone/soft tissue (RT+cur: median 0.15 del/Mb, RT-: median 0.08 del/Mb, P = 6.2e-04, Kruskal-Wallis test), lung (RT+cur: median 0.56 del/Mb, RT-: median 0.43 del/Mb, P = 3.4e-03, Kruskal-Wallis test), and breast (RT+cur: median 0.18 del/Mb, RT-: median 0.12 del/Mb, P = 1.2e-04, Kruskal-Wallis test) cancers (Fig. 1d). The observed patterns were present in both non-small cell and small cell lung cancer but were restricted to ER-positive breast cancer subtypes (Extended Data Fig. 1f). Tumors receiving palliative RT frequently presented an intermediate state in between the RT- and RT+cur cohorts, suggesting an association between acquired small deletion burden and RT dose.
DNA repair deficiency associates with increased mutational load4. We compared the small deletion burden between HMF tumors with and without microsatellite instability (MSI) or homologous recombination deficiency (HRD)13. Notably, HRD+ and particularly MSI+ tumors harbored significantly more small deletions compared to HRD-/MSI- samples (Extended Data Fig. 1g, P < 2.2e-16, Kruskal-Wallis test). RT-treatment was associated with a small deletion burden increase in HRD-/MSI- (Extended Data Fig. 1g, P = 6.0e-08, Mann-Whitney U test) and HRD+ tumors (P = 3.5e-02), but not in MSI+ tumors (P = 7.1e-01). To account for the possibility that HRD and MSI confounded the association between RT-treatment and the small deletion burden, we have included HRD and MSI status into a multivariable log-linear regression analysis and found that the association between RT-treatment and small deletion burden is independent of HRD/MSI status (Extended Data Fig. 1h).
Next, we assessed whether the small deletion burden was associated with mutations in selected genes (ATM, ATR, CHEK1, CHEK2, PARP1, PRKDC, TP53 and WEE1) involved in the DNA damage response (DDR). This analysis indicated that DDR mutations in these genes were universally associated with a significantly higher small deletion burden. We used log-linear regression to adjust for potential confounding variables, including age, tumor type, DNA damage repair background, DRR gene mutations and various cytotoxic treatment regimens (e.g. taxane, platinum, anthracyclines, alkylating agents) that have been previously associated with increased mutation burdens14. Results from this analysis confirmed a robust association with an increased small deletion burden for both palliative and curative radiotherapy (Extended Data Fig. 1h, RT+cur vs. RT-naïve: odds ratio = 1.25, P < 1e-03, t-test).
To verify the causal association between RT and acquired small deletions, we re-analyzed whole-genome sequencing data from 324 humaninduced pluripotent stem cells (iPSCs) exposed to various carcinogens, including two iPSCs treated with ionizing radiation15. Small deletion burden was significantly higher in the RT-treated iPSCs compared to controls (Extended Data Fig. 1i, P = 2.0e-02, Mann-Whitney U test). In contrast, there was no significant difference in small insertion burden (P = 1.8e-01). Strikingly, the ionizing radiation group showed the highest median burden of small deletions across all treatment modalities, further substantiating our results (Extended Data Fig. 1k).
RT-associated deletions harbor a specific genomic signature
Characteristics of RT-associated small deletions, such as length distribution and breakpoint microhomology, may provide insights into their etiology. We explored such features in GLASS IDH mutant gliomas (RT+, n=49; RT-, n=32) as only two GLASS IDH wild-type gliomas were not RT-treated (vs. 107 RT-treated). Small deletions in RT-treated recurrent tumor samples showed increased deletion lengths (Fig. 2a, left, RT+: P = 1.5e-04; RT-: P = 3.5e-01, paired Wilcoxon signed-rank test), which was even more pronounced in acquired deletions (Extended Data Fig. 2a, P = 1.3e-04, Mann-Whitney U test), supporting the idea that RT results in longer deletions (Fig. 2a, left). Moreover, the size distribution of RT-associated deletions shifted towards deletions of length ~5–15bp (Fig. 2a, right).
Fig. 2. Radiotherapy-associated small deletions harbor a characteristic genomic signature.
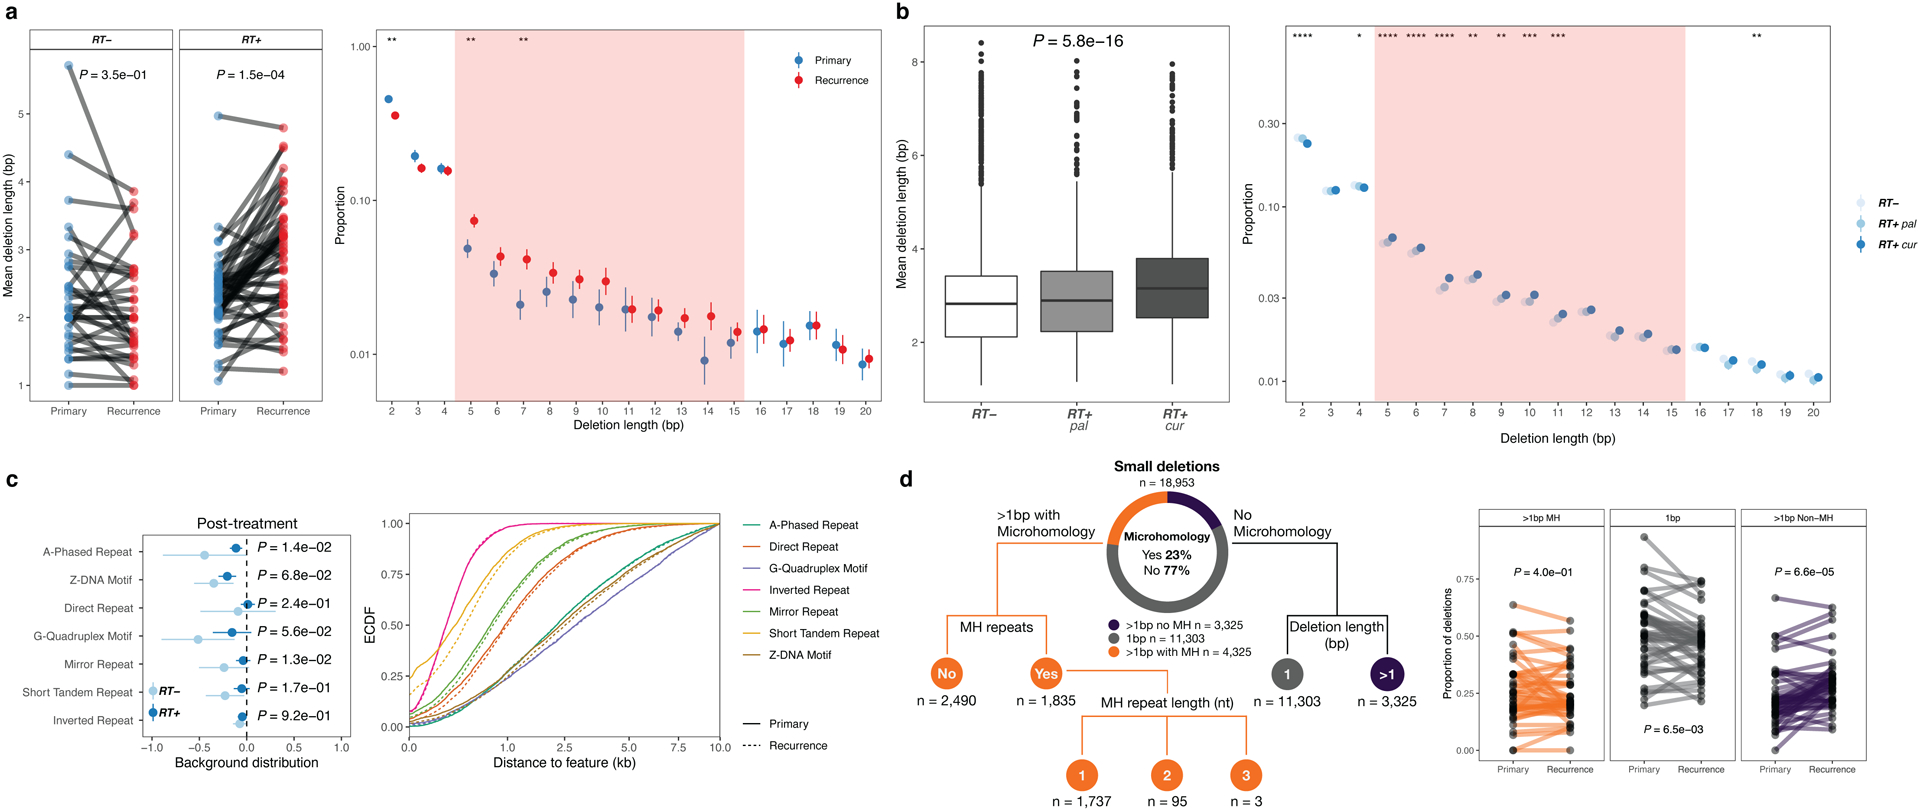
a. Length distribution in GLASS. Left: Mean deletion lengths in primary vs recurrent IDH mutant glioma (n=81), separated by RT-treatment (RT+, n=32, RT-, n=49). Two-sided paired Wilcoxon signed-rank test. Right: Y-Axis, proportion of deletions; X-Axis, deletion length >1bp. Proportions calculated for each patient, mean (point) and 95%-CI (line-range) compared longitudinally in RT-treated non-hypermutant glioma (n=44). Two-sided paired Wilcoxon signed-rank test (*=p<0.05, **=p<0.01).
Shaded area (5–15 bp): size range for which the most apparent differences were observed.
b. Length distribution in HMF. Left: Comparison of mean deletion lengths in RT-naïve vs RT+pal vs. RT+cur samples. Two-sided Kruskal-Wallis test. Right: Y-Axis, proportion of deletions; X-Axis, deletion length >1bp. Proportions calculated for each patient, mean (point) and 95%-CI (line-range) compared between RT-naïve vs. RT+pal vs. RT+cur samples. Two-sided Kruskal-Wallis test (*=p<0.05, **=p<0.01, ***=p<0.001, ****=p<0.0001).
c. Relation to genomic features in GLASS. Left: Distribution of deletions in relation to genomic features. Y-Axis: non-B DNA genomic feature, X-Axis: Log10-ratio of mean distance of non-radiation-associated and radiation-associated post-treatment deletions to genomic feature over background distribution in non-hypermutated glioma samples (n=69). Distribution of radiation-associated deletions shows little variability (narrow 95%-CI) and resemble background distribution more closely (closer to 0). Two-sided Mann-Whitney U test. Right: Empirical cumulative distribution function (ECDF, Y-Axis) of distance to non-B DNA features in kb (X-Axis) post-radiated non-hypermutated recurrent samples (n=44). Neither in hypermutated, nor in RT-naïve non-hypermutated gliomas longitudinal differences were observed (Extended Data Fig. 2c).
d. Small deletion categories in GLASS. Left: Separation of small deletions in the GLASS cohort into 3 major categories: 1bp (gray), >1bp without microhomology (purple) and >1bp with microhomology (orange) in IDH mutant gliomas (n=81). Microhomology category further classified based on the occurrence of microhomology repeat sequences and length of repeats.
Right: Comparison of proportion of deletions for each RT-treated non-hypermutated glioma sample (n=44, further comparisons in Extended Data Fig. 2e) using two-sided paired Wilcoxon signed-rank test.
Comparing RT-treated and RT-naïve metastatic tumor samples from the single time-point HMF dataset confirmed larger deletions in palliative and curative RT-treated tumors (Fig. 2b, Extended Data Fig. 2b), and a shift in deletion span from 1–4bp towards 5–15bp deletions (Fig. 2b). Deletion length was larger following curative compared to palliative RT-treatment, further substantiating a dose and exposure association. Taken together, RT drives a burden of small deletions with distinct characteristics.
B-DNA is the common right-handed, double helical formation of DNA. Non-canonical non-B-DNA structures and fragile repeat-rich DNA may be more prone to acquiring mutations16, which may include RT-induced deletions. We compared the distribution of small deletions across these genomic features against a random background distribution. In the IDH-mutant GLASS cohort, deletions following RT showed less variability and higher similarity to the random background distribution compared to non-RT-induced deletions, and larger distances to non-B DNA features (Fig. 2c, right, Extended Data Fig. 2c). The lack of or reduced association between RT-associated deletions and the analyzed genomic features, such as repeats and G-quadruplex motifs, suggests that RT-associated small deletions occur in a stochastic manner, independent from the intrinsic mutagenicity of the fragile genome regions analyzed.
We assessed whether RT-associated small deletions showed enrichment in driver genes. We computed the covariate-adjusted normalized ratio between non-synonymous and synonymous mutations (dN/dS), in order to identify selection of mutations at the level of individual genes and separately for GLASS pre- and post-treatment fractions (Extended Data Fig. 2d)17. We did not find evidence for significant selection for any genes in the post-treatment fraction following radiation therapy. In the HMF set, where pre-treatment samples are unavailable, we could not perform this analysis. Our results in IDH-mutant glioma further support the notion that RT-associated deletions do not occur at particular genomic loci.
Small deletions can be the result of error-prone DSB-repair mechanisms such as c-NHEJ and a-EJ/MMEJ3. We characterized deletions based on size, microhomology and repeat content to investigate which mechanism is used for DSB-repair following RT (Fig. 2d, Extended Data Fig. 2e). Deletions without microhomology comprised the majority of deletions in the dataset (77%, Fig. 2d). However, in non-hypermutant gliomas receiving ionizing radiation we observed a significant increase in >1bp-deletions without microhomology (Fig. 2d, P = 6.6e-05, Paired Wilcoxon signed-rank test) and conversely a decrease in 1bp-deletions (Fig. 2d, P = 6.5e-03, Paired Wilcoxon signed-rank test). Comparison of RT-treated and RT-naïve metastatic tumors from the HMF dataset demonstrated comparable results (Extended Data Fig. 2f). These data suggest that c-NHEJ is the preferred pathway for repairing radiation-induced DNA damage.
Distinct mutational signatures associated with radiotherapy
Cancer cells accumulate somatic mutations through mechanisms that may leave distinct genomic scars, termed mutational signatures18. To determine the mutational processes of radiotherapy, we compared pre-and post-treatment mutations in the GLASS dataset to previously defined mutational signatures18. The comparison of signature contributions between post-recurrence mutations in RT-treated and RT-naïve IDH mutant glioma samples revealed a strong enrichment of indel signature 8 (ID8, Fig. 3, Extended Data Fig. 3d, RT+, mean contribution = 0.22, vs. RT-, mean contribution = 0.07, P = 7.4e-05, Q = 3.8e-03, Mann-Whitney U test and false discovery rate, respectively). In RT-treated but not RT-naïve patients comparing ID8 values before and after treatment resulted in significant increases in absolute (Extended Data Fig. 3e, P = 4.5e-07, Paired Wilcoxon rank-signed test) and relative (Extended Data Fig. 3e, P = 2.3e-03) ID8 contributions, respectively. ID8 is composed of ≥5 bp deletions without microhomology and has previously been linked to DSB repair by c-NHEJ, suggesting radiation-induced DSB repair via c-NHEJ18. As expected, hypermutation due to TMZ treatment in IDH mutant gliomas was associated with indel signature 2, which is reported to be elevated in mismatch repair deficient tumors (ID2, Fig. 3, Extended Data Fig. 3a–b)18.
Fig. 3. ID8 and APOBEC-SBS signatures associated with radiotherapy.
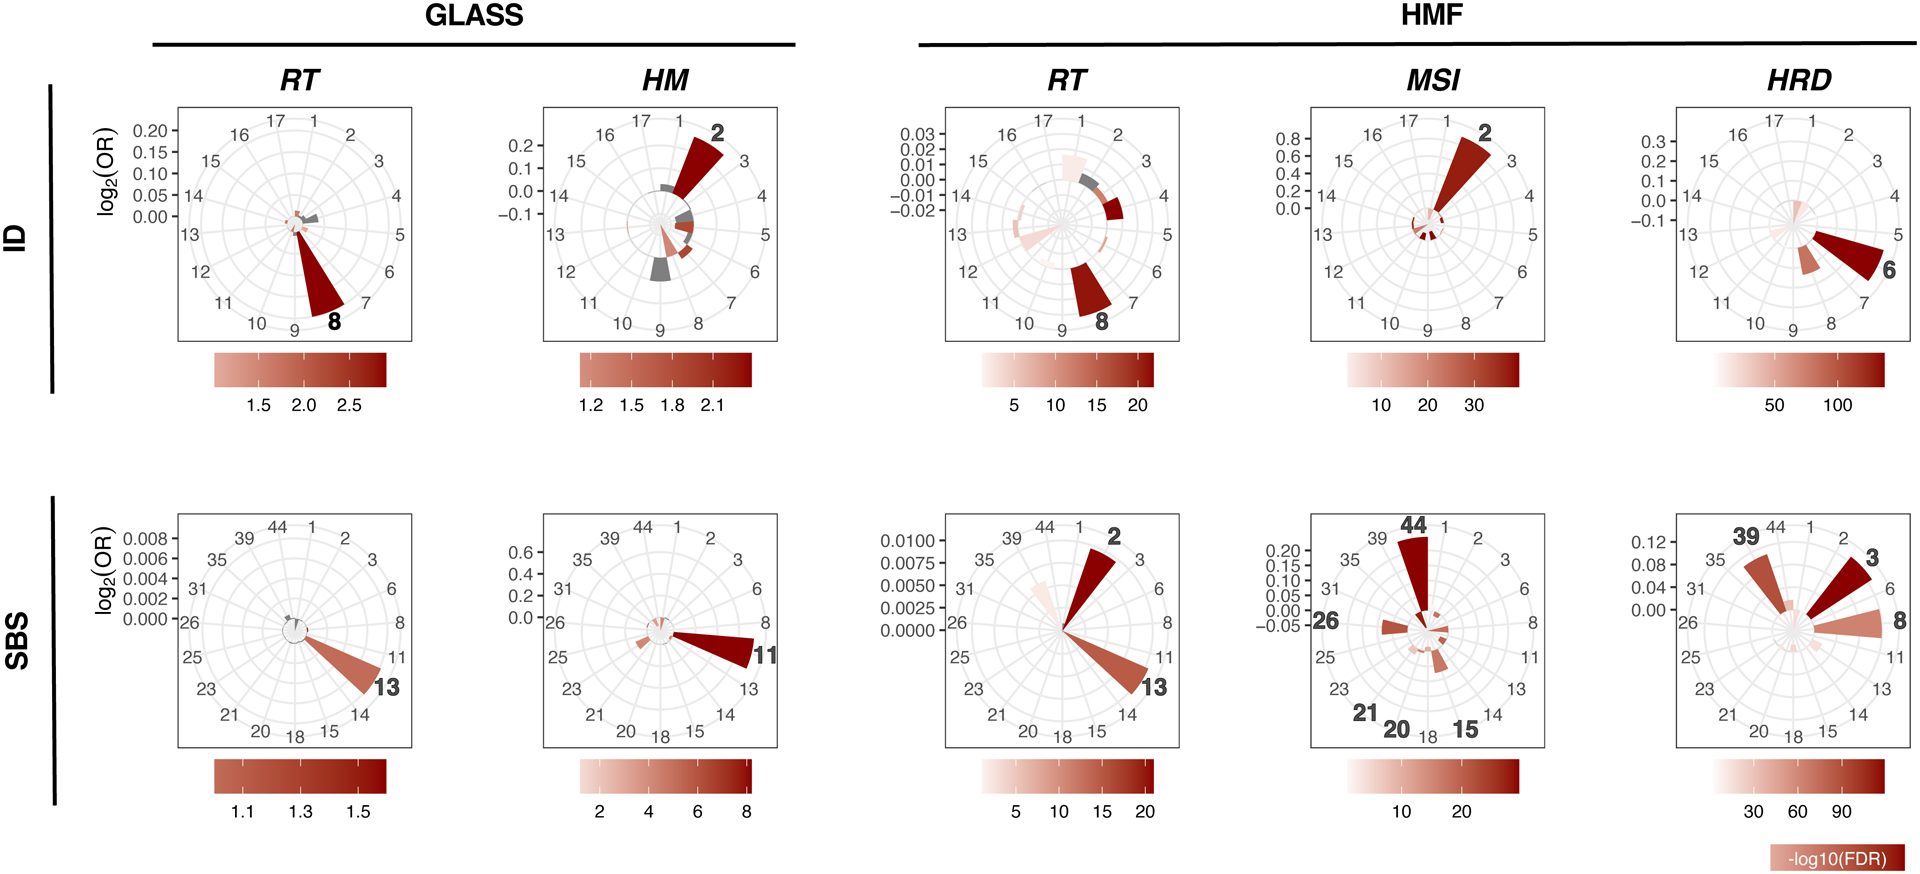
Indel (ID) and single base substitution (SBS) mutational signatures in the GLASS and HMF cohorts associated with RT (radiotherapy), Hypermutation (HM), Microsatellite instability (MSI) and homologous recombination deficiency (HRD). RT+, mean contribution = 0.22, vs. RT-, mean contribution, P = 7.4e-05, Q = 3.8e-03, two-sided Mann-Whitney U test and false discovery rate, respectively. Bars in the petal plots not reaching statistical significance (defined as FDR < 0.01) are indicated in grey.
A previous mutational signature analysis in the HMF dataset observed the strongest association between RT and ID614. Confirming our findings in the GLASS cohort, we observed the strongest association with ID8 in the HMF dataset, and significant but less pronounced for ID6 (Fig. 3). Both absolute and relative ID8 values were significantly higher in RT-treated samples when compared to RT-naïve samples, and a significant association was observed in nine of twelve tumor types (Extended Data Fig. 3f). The comparison of HRD+ and HRD− samples associated HR-deficiency with ID6. ID6 comprises > 5 bp deletions with microhomology at breakpoints and is elevated in HR-defective breast cancers19. Analogous to TMZ-associated hypermutators in GLASS, MSI samples in HMF were enriched for indel signature 2 (ID2, Fig. 3).
To summarize, while MSI leads to an increased small deletion burden due to hypermutability from impaired DNA mismatch repair at microsatellites/homopolymers, DSBs due to HRD and RT are repaired via error-prone DSB-repair mechanisms. Our results implicate the a-EJ pathway that utilizes microhomologies at breakpoints in HR-deficient samples (signature ID6) and the c-NHEJ pathway which does not require breakpoint-microhomology in RT-treated samples (signature ID8).
We sought to identify single base substitution (SBS) signature associations in both datasets. We confirmed an enrichment of SBS11 in hypermutant IDH mutant glioma samples5,20, an enrichment of signatures SBS44, SBS26, SBS21, SBS20 and SBS15 in MSI samples18 and enrichment of SBS3 and SBS8 in HRD cases18,19,21 along with a previously undescribed enrichment of SBS39 (Fig 3). In addition, in the GLASS cohort, RT-treatment was significantly associated with SBS13 and in the HMF cohort with SBS2 and SBS13. SBS2 and SBS13 are APOBEC signatures18,22. APOBEC cytosine deaminases are involved in retrovirus and retrotransposon restriction, and the enrichment of APOBEC signatures in RT-treated samples in both datasets implicated APOBEC-mediated mutagenesis in RT-associated DSB-repair23–25. Our results support the hypothesis that mutational signatures are shaped by cycles of DNA damage and DNA repair26. While radiotherapy causes DSBs that are repaired via c-NHEJ resulting in specific small deletions (ID8), APOBEC cytidine deaminases may be activated during the repair process leading to SBS2 and / or SBS13.
Radiotherapy associates with aneuploidy and larger deletions
We evaluated whether RT could be associated with other types of genomic variants. We detected large structural variants, including large deletions, duplications, inversions and translocations, in the longitudinal GLASS cohort. We observed an increase in large deletions (length > 20bp to chromosome arm length) post-therapy in RT-treated patients, compared to RT-naïve patients (Fig. 4a, P = 3.2 e-02, Fisher’s exact test). We also found a statistically significant increase in inversions (Fig. 4a, P = 2.1e-02) and no differences in translocations (Fig. 4a, P = 1) and duplications (Fig. 4a, P = 7e-01). These associations remained significant after accounting for potentially confounding factors such as TMZ treatment and molecular subtype (Extended Data Fig. 4b). While radiation-induced secondary malignancies were reported to contain increased rates of inversions7, a concomitant increase in large deletions in association with RT has not been previously observed.
Fig. 4. RT is associated with aneuploidy and larger deletions.
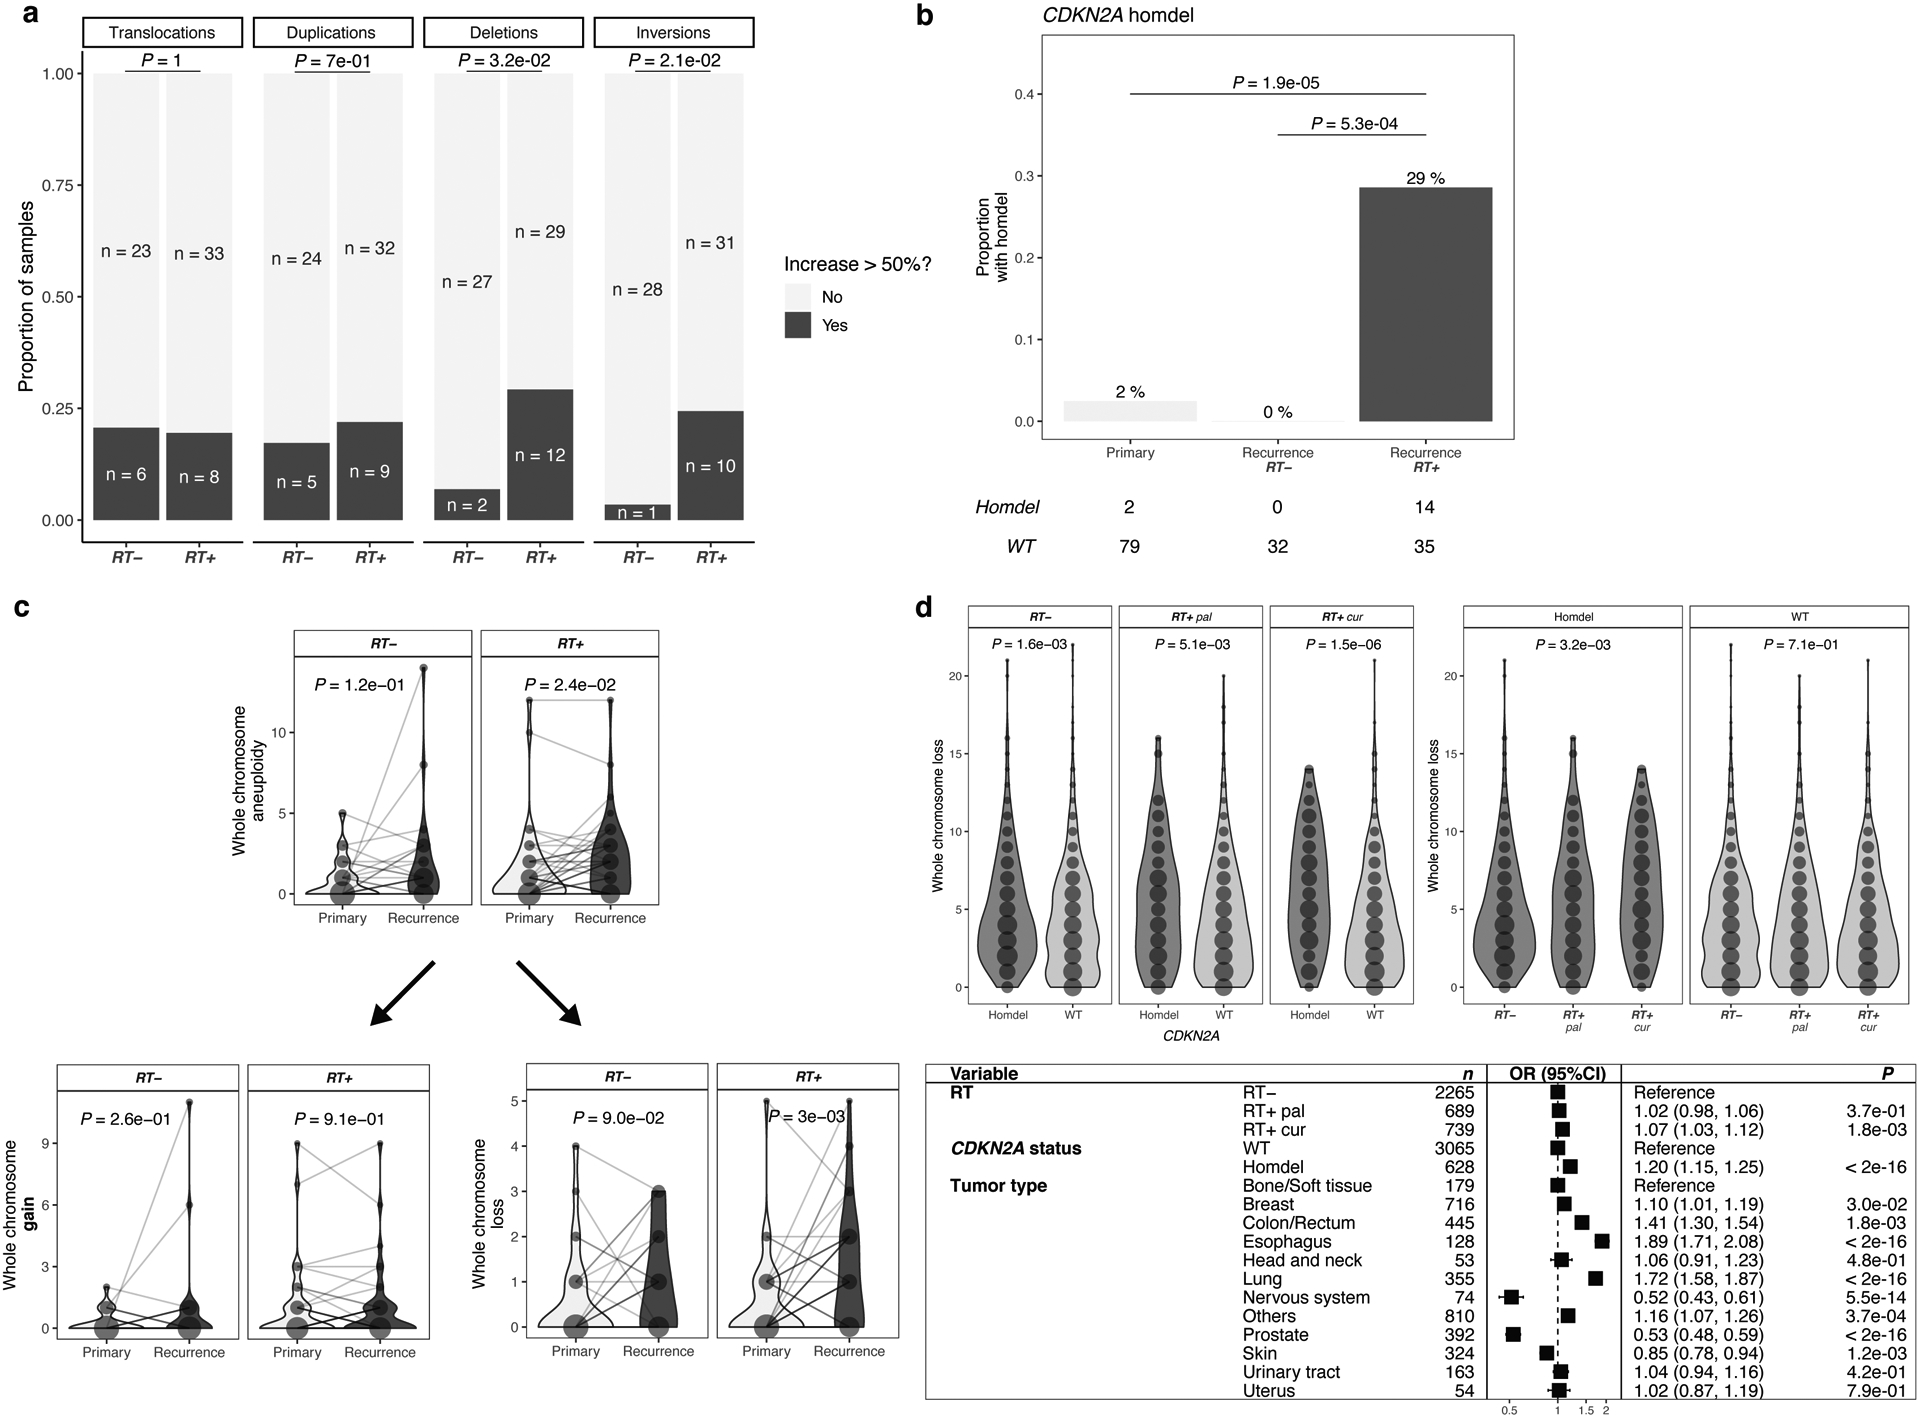
a. RT-associated increase in large deletions and inversions. Analysis of structural variants (SVs) after RT in IDHmut glioma samples with sufficient quality for calling (n = 70): Translocations, Duplications, Deletions, Inversions. For each patient, number of SVs were calculated pre-and post-treatment. Based on the distribution of percent increase from primary to recurrence, cutoff was set for > 50% increase (Extended Data Fig. 4a). Comparison of proportion of samples with/without increase of given SVs between RT-treated vs RT-naïve. Two-sided Fisher’s exact test.
b. RT-associated CDKN2A homozygous deletions. Depicted are proportions of IDHmut glioma samples (n = 81) harboring a homozygous deletion in CDKN2A. Using two-sided Fisher’s exact test, proportions were compared between RT-received recurrence (RT+) vs. RT-naïve recurrence (RT-) vs. samples prior to treatment (Primary). Detailed distributions of whole chromosome deletion scores provided in Extended Data Fig. 4f.
c. RT-associated whole chromosome aneuploidy. Upper: Longitudinal comparison of whole chromosome aneuploidy scores separated by RT-treatment for IDHmut glioma samples with sufficient quality for calling and complete treatment annotation (total n = 69, RT-treated n = 42, RT-naïve n = 27). Bottom: Separation of whole chromosome aneuploidy into whole chromosome gain (left) and whole chromosome loss (right) scores, respectively. Dots are proportional to the frequency of whole chromosome loss integer for each subgroup. Two-sided paired Wilcoxon rank-signed test.
d. Validation of SV and aneuploidy results in HMF. Upper: Comparison of whole chromosome deletion scores between RT-naïve vs RT+pal vs RT+cur and/or CDKN2A homdel vs. WT samples. Note that CDKN2A homdel is associated with higher whole chromosome deletion scores, independent of RT. Within samples with CDKN2A homdel, samples that were RT-treated with curative intent show the highest deletion scores. Dots are proportional to the frequency of whole chromosome loss integer for each subgroup. Two-sided Kruskal-Wallis test. Detailed distributions of whole chromosome deletion scores provided in Extended Data Fig. 4g. Bottom: Multivariable poisson regression model for whole chromosome deletion scores integrating RT, CDKN2A and tumor types as variables. Two-sided Wald-test was applied.
We next evaluated whether deletions at specific loci were associated with RT. In the IDH-mutant GLASS cohort, where CDKN2A loss at initial diagnosis is rare, acquired CDKN2A homozygous deletions occurred exclusively in RT-treated recurrences (Fig. 4b, 29% vs 0%, P = 5.3e-04, Fisher’s exact test)27. This result nominated acquired CDKN2A homozygous loss as a potential biomarker for RT resistance among recurrent IDH-mutant gliomas, but not in IDH-wild type gliomas where CDKN2A homozygous deletion at diagnosis is common.
Ionizing radiation can promote mitotic chromosome segregation errors through non-disjunction events causing aneuploidy28–31. We investigated the association between RT and aneuploidy, separating aneuploidy events into gains or losses of entire chromosomes, likely the result of segregation errors; and partial gains or losses, requiring additional DSBs (see Methods, Extended Data Fig. 4c). In the IDH-mutant GLASS cohort, we observed a significant association between RT and chromosome losses, but not for simple gains or complex events (Fig. 4c, Extended Data Fig. 4d), which was no longer significant after adjusting for covariates in a multivariable Poisson regression. Instead, this analysis highlighted a significant association between chromosome losses and CDKN2A deletions (Extended Data Fig. 4e), implicating that the increase in chromosome loss frequency following RT is specific to RT-associated acquired CDKN2A deletions. Using the HMF metastatic tumor cohort, we confirmed the association between CDKN2A homozygous deletions and chromosome losses (Fig. 4d, Extended Data Fig, 4f). In fact, both curative RT-treatment and CDKN2A homozygous deletions were independently associated with increased number of chromosomal losses in the HMF datasets (Fig. 4d, Extended Data Fig, 4f). However, testing for interactions between CDKN2A deletions and RT-treatment indicated a trend towards interaction between palliative/curative radiotherapy and CDKN2A deletions (Supplementary Table 1, P = 9.75e-02 and P = 4.92e-02, respectively, t-test). In summary, aneuploidy may not directly be associated with radiotherapy but through interactions with CDKN2A deletions, requiring further investigation.
RT-associated genomic changes are linked to poor survival
Finally, we wanted to ascertain whether the genomic effects of radiotherapy were relevant to patient outcomes. As expected, CDKN2A homozygous deletion at recurrence was significantly associated with worse overall survival in IDH-mutant glioma samples (Extended Data Fig. 5a, P < 1e-04, log-rank test)5. To test for a survival association of CDKN2A deletions amongst RT-treated patients in the HMF dataset we selected 958 samples that received RT and had sufficient survival information available from 11 tumor types (Extended Data Fig. 1e). Patients whose tumors harbored a CDKN2A homozygous deletions showed worse outcomes compared to patients with CDKN2A wild-type tumors (Extended Data Fig. 5b, left). Stratification of the cohort into tertiles based on genome-wide aneuploidy frequency demonstrated that low aneuploidy was linked to favorable outcomes and high aneuploidy was linked to poor outcomes (Extended Data Fig. 5b, middle). These results nominate acquired CDKN2A homozygous deletion as a biomarker of RT resistance after recurrence and support the clinical reassessment of CDKN2A status at recurrence for optimizing treatment strategies.
Independent of the poor prognostic implications of acquired CDKN2A deletions, GLASS patients with tumors carrying a high small deletion burden at recurrence (top tertile) had significantly shorter overall survival (Fig. 5a, P = 3.4e-02, log rank-test). The association remained significant when accounting for the small deletion burden as a continuous variable and possible confounding variables, indicating a robust correlation (Extended Data Fig. 5c, HR = 1.19 [95% CI: 1.01 – 1.14]; P = 4.3e-02, Wald test). Multivariable modeling using a limited subset of patients with detailed dosage information in the GLASS cohort (n=21) showed that the association between small deletion burden and survival is dose-independent (P = 2e-02). Separating the overall survival time into surgical interval and post-recurrence survival indicated that the association of high newly acquired small deletion burden with worse survival was limited to post-recurrence survival (Fig. 5a, P = 3.4e-03, log-rank test). Surgical interval times did not differ significantly between the three tertiles (Fig. 5a, P = 5.6e-01), suggesting that glioma patients may initially benefit equally from RT, but after exposure to RT and acquisition of the deletion signature, tumors may lose sensitivity to further radiotherapy. This pattern is reminiscent of the association between hypermutant glioma and temozolomide therapy20.
Fig. 5. RT-associated genomic changes are linked to poor survival.
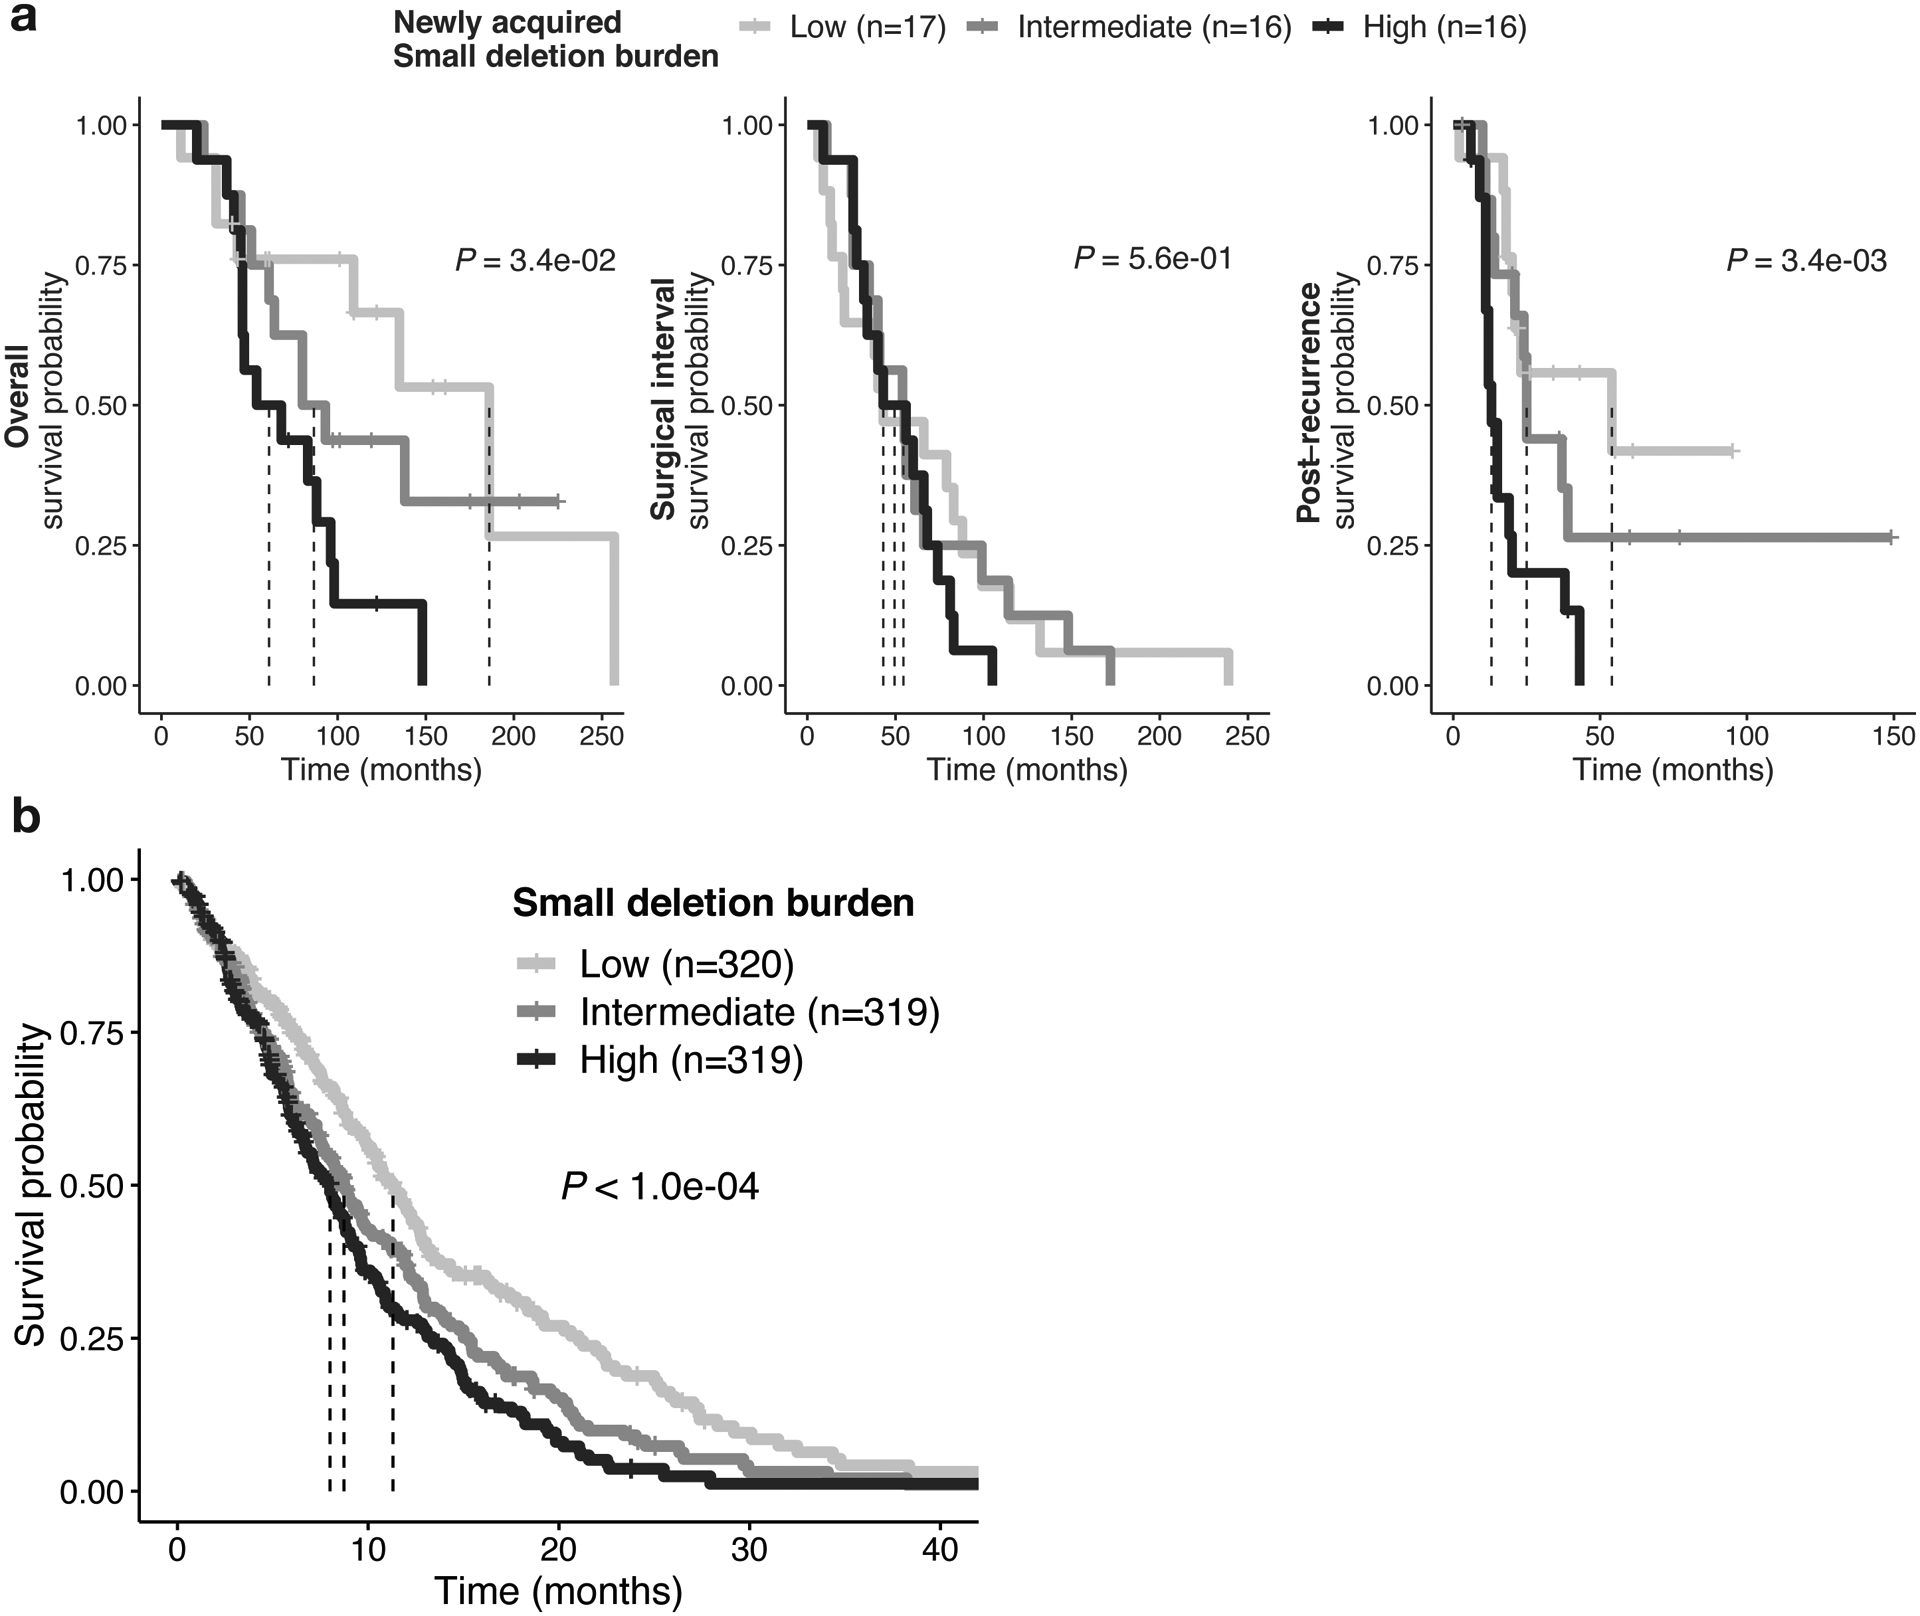
a. Association of RT-related deletions with survival in GLASS. Left: Kaplan-Meier survival plots comparing overall survival dependent on deletion burden at recurrence using log-rank test in RT-treated IDH mutant glioma samples (n = 49 with available survival information). Samples were separated into 3 tertile based on deletion burden at recurrence: High (top tertile), Intermediate (middle tertile) and Low (bottom tertile). Dotted lines indicate median overall survival times. Note the stepwise association of tertiles with survival. Middle: Kaplan-Meier survival plots comparing surgical interval/time to second surgery dependent on deletion burden at recurrence using two-sided log-rank test. Right: Kaplan-Meier survival plots comparing post-recurrence survival dependent on deletion burden at recurrence using two-sided log-rank test.
Fig. 5bAssociation of RT-related deletions with survival in HMF. Kaplan-Meier survival plots comparing survival time dependent on deletion burden at metastasis using two-sided log-rank test in RT-treated metastases (n = 958 with available survival information). Samples were separated into 3 tertiles based on deletion burden: High (top tertile), Intermediate (middle tertile) and Low (bottom tertile). Dotted lines indicate median survival times. Note the stepwise association of tertiles with survival.
In 958 RT-treated samples from the HMF cohort (Extended Data Fig. 1g), we also found that patients harboring a high small deletion burden (top tertile) had significantly shorter survival than other RT-treated cases (Fig. 5b, P < 4e-04, log rank-test). Similarly, stratifying HMF patients into tertiles by ID8 burden associated an intermediate or high ID8 burden with poor survival and a low ID8 burden with more favorable outcomes (Extended Data Fig. 5b). Therefore, the presence of a high number of RT-associated small deletions identifies a tumor that has initially responded to therapy, but which may have lost some or all of the treatment sensitivity. Combined, these results suggest that a higher deletion burden may reflect a scenario that is favorable to the tumor characterized by proficient DNA repair resulting in less tumor cell killing and decreased treatment efficacy.
DISCUSSION
Prior studies on radiation induced tumors have shown a range of genomic effects and have suggested the involvement of various DNA double strand break repair mechanisms30,32–35. We identified a unique signature of RT-associated deletions carrying characteristics of DSB-repair by canonical non-homologous end joining. This work extends our knowledge on the genomic response to radiotherapy and provides direction for the development of effective radiosensitizers.
The significant expansion of clones harboring RT-associated genomic events depends on clonal selection or drift36. Therefore, the increased small deletion burden in combination with poor outcomes may reflect the emergence of more competitive clones under RT-induced stress, innately active repair processes ensuring tumor maintenance, or a combination of these two. We found that a higher load of RT-associated deletions was linked to worse patient outcomes. Thus, additional rounds of RT in patients with recurrent or metastatic tumors containing a significant increase in small deletion burden is unlikely to further extend progression-free survival. The ability to effectively repair RT-induced damage implies that sensitivity to RT is intrinsically diminished or has progressively been lost due to for example clonal selection. Inhibiting these repair processes could potentially sensitize tumors to the tumor-killing effect of ionizing radiation. CDKN2A homozygous deletions were acquired in RT-treated IDH-mutant gliomas but not in untreated recurrent IDH-mutant gliomas, suggesting that radiotherapy-induced DNA damage promotes the acquisition of this poor prognostic marker, and implicating a convergence between RT-induced DSB repair and cell cycle checkpoints. A biomarker able to readily detect an increased small deletion burden may help reduce treatment costs and avoid RT-associated patient comorbidities and side-effects.
We note several limitations to our study. The HMF metastatic dataset comprises samples from a single time point, preventing the attribution of alterations as post-treatment. Furthermore, the treatment annotation in HMF does not precisely describe whether only the initial tumor or additionally the metastatic site were irradiated. Considering these caveats, the effects of RT described in this study might be more significant than what we have observed. Additionally, evolutionary pressures for local and distant metastases, which were analyzed homogenously in this study, might be fundamentally different37. RT may have no or a different impact on metastases that are not immediately within the field of the radiation, requiring further investigations in dedicated datasets.
Compounds that inhibit DNA repair may improve the response of cancer cells to radiotherapy. Numerous clinical and preclinical studies have shown efficacy in targeting DNA repair. Inhibitors directed at poly (ADP-ribose) polymerase (PARP) in homologous recombination-deficient tumors (synthetic lethality) were shown to be effective in the treatment of various cancer types38–40. Effective inhibitors of NHEJ have not yet been reported but may sensitize tumors to radiotherapy. Inhibitors of ATM serine/threonine kinase (ATM), a protein kinase that activates DSB repair; and DNA-dependent protein kinase catalytic subunit (DNA-PKc), a kinase that catalyzes repair at the DSB locus, were shown to be effective in pre-clinical studies and phase I trials of diffuse glioma41–44. The identification of enrichment of APOBEC associated mutational signatures may warrant further evaluation of targeting cytosine deaminases for cancer therapy45. The present study highlights the importance of effective DNA repair in therapy resistance.
MATERIALS AND METHODS
Patient cohort
We curated a cohort of 190 patients with high-quality longitudinal DNA sequencing data, including treatment naïve primary and matched post-treatment first recurrence tumor samples from the GLASS dataset5. We classified paired samples according to the 2016 World Health Organization (WHO) classification into three subtypes: IDH mutant with 1p/19q co-deletion (IDHmut-codel), IDH mutant without 1p/19q co-deletion (IDHmut-noncodel) and IDH wild type (IDHwt)11. The GLASS cohort used in this manuscript consists of n = 106 whole genome sequencing samples (n = 53 primary samples, n = 53 matched first recurrence samples) and n = 274 whole exome sequencing (WES) samples (n = 106 primary samples, n = 106 matched first recurrence samples). Detailed information on sequence platforms, capture kits and read length information are outlined in the GLASS marker paper5.
For validation analyses, we curated a metastatic cohort from the Hartwig Medical Foundation (HMF) comprising a total of 4549 samples8. The HMF cohort consists of metastatic tumor samples that were collected following local or systemic treatment as part of the CPCT-02 (NCT01855477) and DRUP (NCT02925234) clinical trials. Biopsy samples from a wide range of tumor types collected at various hospitals across the Netherlands were sequenced at the core facilities of the Hartwig Medical Foundation. Whole genome sequencing was performed for each sample according to standardized protocols46. Detailed information on sequence platforms, capture kits and read length information are outlined in the HMF marker paper8. VCF files with mutations and associated metadata were downloaded from The Hartwig Medical Database (https://database.hartwigmedicalfoundation.nl). After application of filtering criteria using BCFTools 1.9 (as described in detail in Extended Data Fig. 1e) a set of n = 3693 were defined and used for the majority of analyses throughout the manuscript. For survival analyses we selected RT-treated samples with sufficient survival information (n = 958). All prior radiotherapy data were extracted using clinical data as present in the CPCT-02 eCRF on December 08, 2020. These data were not cleaned and represent the data entered by the clinical sites. The prior radiotherapy was categorized as curative intent, palliative intent or other. All other instances were manually curated by the principal investigator. All adjuvant / neo-adjuvant or post-operative radiotherapy was considered curative intent radiotherapy. All local radiotherapy for pain relief or other symptom-directed goals were considered as palliative. Some items were not specified, and those events were not included in our analysis. We also excluded all radiotherapy for non-malignant disease states, specifically for gynecomastia treatment after castration. We cannot exclude over- or underrepresentation of the radiation signatures as we are unaware whether the metastases that were biopsied were not already present at the time of radiotherapy.
Variant Calling
Variant calling in the GLASS dataset was performed according to the GATK Best practices using GATK 4.1.0.0 and publicly released as part of a previous publication5. Briefly, GATK 4.1. was used for variant calling in tumor samples against a matched normal control. Additionally, panels of normals were constructed across multiple control samples from the same tissue source and sequencing center. Variants were broadly filtered for germline variants, cross-sample contamination, read orientation and sequence context. Variants were called across all samples for a given patient. Variants with a minimum coverage of 10 reads in both primary and recurrence and a minimum VAF of 10% for either the primary or the recurrence were included for further analysis. Variants were considered to be present if at least one mutant read was detected in a sample. Mutations directly overlapping with known repeat regions according to the repeatmasker database were removed. Specifically, we filtered out all variants in known repeat regions, including DNA satellites, microsatellites, long terminal repeats, transposable elements (LINE/SINE elements) and low complexity regions. Variant clonality was inferred for each patient individually using PyClone (v.0.13.1) and as described in more detail in the GLASS marker paper.
Mutation burden comparison
The mutation burden was calculated as the number of mutations per megabase (Mb) with at least 10x coverage and stratified by variant type. The overall tumor mutation burden (TMB) was calculated as the sum of the burden of small deletions, small insertions and single nucleotide variants. Recurrent tumors with greater than 10 mutations per Mb were considered hypermutated as previously described5. For the comparison of mutation burden between RT-treatment groups in the GLASS dataset, we calculated the burden of mutations unique to the recurrent tumors and therefore were acquired after treatment. To adjust for confounding covariables, we fitted a multivariable log-linear regression model using the glm function in R. In addition to RT-treatment, we included TMZ-treatment, hypermutation, surgical interval in months and molecular subtype as variables. The small deletion burden in the GLASS dataset was not confounded by batch effects. Accordingly, we included the full therapy and tumor type information for mutation burden analyses in the Hartwig metastatic cohort. To adjust for negative infinite values resulting from the log-transformation in the GLASS cohort, we added a constant value of 1 to the log function. For the metastatic cohort, the log-transformation did not result in (negative) infinite values and therefore not necessitating the addition of a constant value.
Association of deletions with non-B DNA structures
The genomic locations of non-canonical DNA structures were derived from the Non-B DNA database47. We calculated for every variant position and, for comparison, for 250,000 randomly sampled positions from the reference genome, the distance to non-B features as a continuous (absolute distance to genomic feature in bp) or categorical (position in or up to 100 bp to genomic feature – yes/no) values. We used a two-sided Mann-Whitney U test for differences in the genomic properties of variants in radiation-induced and non-radiation-induced tumors after adjusting for random background distribution.
dNdScv
For quantification of selection processes at the level of individual genes dependent on radiation therapy, we calculated dN/dS ratios as previously described5. Briefly, the R package dNdScv17 was run using the default and recommended parameters for each mutational fraction (private to primary, shared between primary and recurrence and private to recurrence). All analyses were conducted separately within radiotherapy-naïve and radiotherapy-treated groups.
Sequence microhomology
Sequence microhomology was determined by iteratively comparing the 3’ end of the deleted sequence to the 5’ flanking sequence. Any deletion demonstrating at least 2nt of homology was considered microhomology-mediated. The homologous sequence was characterized and further analyzed for the presence of 1nt, 2nt and 3nt repeats. The repeat unit and number of repeats were quantified.
Mutational signatures
SigProfiler was used to extract and plot mutational signatures of single base substitutions (SBS), double base substitutions (DBS) and indels (ID)18. Absolute and relative contributions of signatures were determined using modified functions from the MutationalPatterns R package48. Briefly, we fitted the mutational profile matrix generated with SigProfiler to the catalog of previously identified COSMIC mutational signatures (v3, May 2019) by solving the non-negative least squares problem. The single base substitution signatures SBS31 and SBS35 have been previously linked to platinum therapy14,18. Analysis of the HMF cohort using the signatures we extracted confirmed these previously established associations, providing further credence to the identified signatures. SigProfilerPlotting49 was used to visualize the distribution of indel characteristics (Extended Data Fig. 3a–d).
Structural variants
For the GLASS dataset split reads and discordant read pairs were extracted from all tumor and normal BAM files using samtools 1.750. We used the lumpyexpress tool (from LUMPY 0.2.13) to call structural variants providing the data associated with the set of normal and tumor samples belonging to one patient51. CNV predictions inferred from read-depth using CNVnator 0.3.3 were additionally provided to garner further support for identified variants52.The resulting call set was post-processed using SVtyper 0.6.0 to genotype structural variants for each individual sample belonging to a patient53. Finally, we used GATK VariantFiltration to filter all variants with less than four reads of support and those with quality scores less than ten54. Variants that showed any support in non-tumor samples were additionally removed. Variants were quantified per sample and further stratified according to type (translocation, duplication, deletion and inversion). We computed the change in frequencies for each patient by dividing the rate at recurrence by the rate at primary. Only variants spanning at least 20bp were considered.
Microsatellite Instability and Homologous Recombination Deficiency
Microsatellite instability (MSI) and homologous recombination deficiency (HRD) status were assigned according to previously defined criteria13. In short, MSI was determined in samples with >14000 indel repeats; HRD was classified based on a probablity score of >=0.5 according to the CHORD (Classifier of Homologous Recombination Deficiency) algorithm.
Aneuploidy calculation
Arm-level aneuploidy data from the GLASS dataset was obtained from a previous publication and copy number segmentation files from HMF were processed into arm-level copy number calls using the same methods5. Chromosomes demonstrating euploidy in both arms were considered euploid. Chromosomes with equidirectional aneuploidy in both arms or aneuploidy in a single arm and indeterminate ploidy in the other arm were considered “simple aneuploid”. Chromosomes with aneuploidy in one arm and incongruent ploidy in the other arm were considered “complex aneuploid”. Aneuploidy events were quantified for each tumor sample.
Statistical methods
All data analyses were conducted in R 3.6.1 (broadly using tidyverse 1.3.0), Python 3.7.3 and PostgreSQL 10.5. R was interfaced with the PostgreSQL database used for data storage using the unixODBC 2.3.6 driver plus DBI 1.0.0 and odbc 1.1.6 R packages. All survival analyses including Kaplan–Meier plots and Cox proportional hazards models were conducted using the R packages survival and survminer. For unpaired group comparisons the two-sided Mann-Whitney U test and two-sided Kruskal-Wallis test were used and for paired longitudinal comparisons the two-sided Wilcoxon signed-rank test was applied. Forest plots were generated using the R package forestmodel. Survival times for the GLASS dataset were calculated as described previously5. In the HMF metastatic cohort, we calculated survival starting from the date of biopsy to date of death. For patients that were alive, we used the last date of follow-up (date of treatment end) as censoring.
Data availability
Processed sequencing data from the GLASS project used in this study are available on Synapse, at https://www.synapse.org/glass. The WGS, RNA-seq, and corresponding clinical data used in this study were made available by the Hartwig Medical Foundation and were accessed under a license agreement (HMF DR-057 version 3.0). Data access can be obtained by filling out a data request forms. The form and detailed application procedures can be found online at https://www.hartwigmedicalfoundation.nl/applying-for-data/. The repeatmasker database used in this manuscript is available online at https://www.repeatmasker.org/.
Code availability
Pipeline scripts can be found at https://github.com/fpbarthel/GLASS. Custom scripts for analyses performed in this manuscript can be found at https://github.com/EmreKocakavuk/RTscars.
Extended Data
Extended Data Fig. 1. Radiotherapy specifically drives small deletion burden independent of multiple variables.
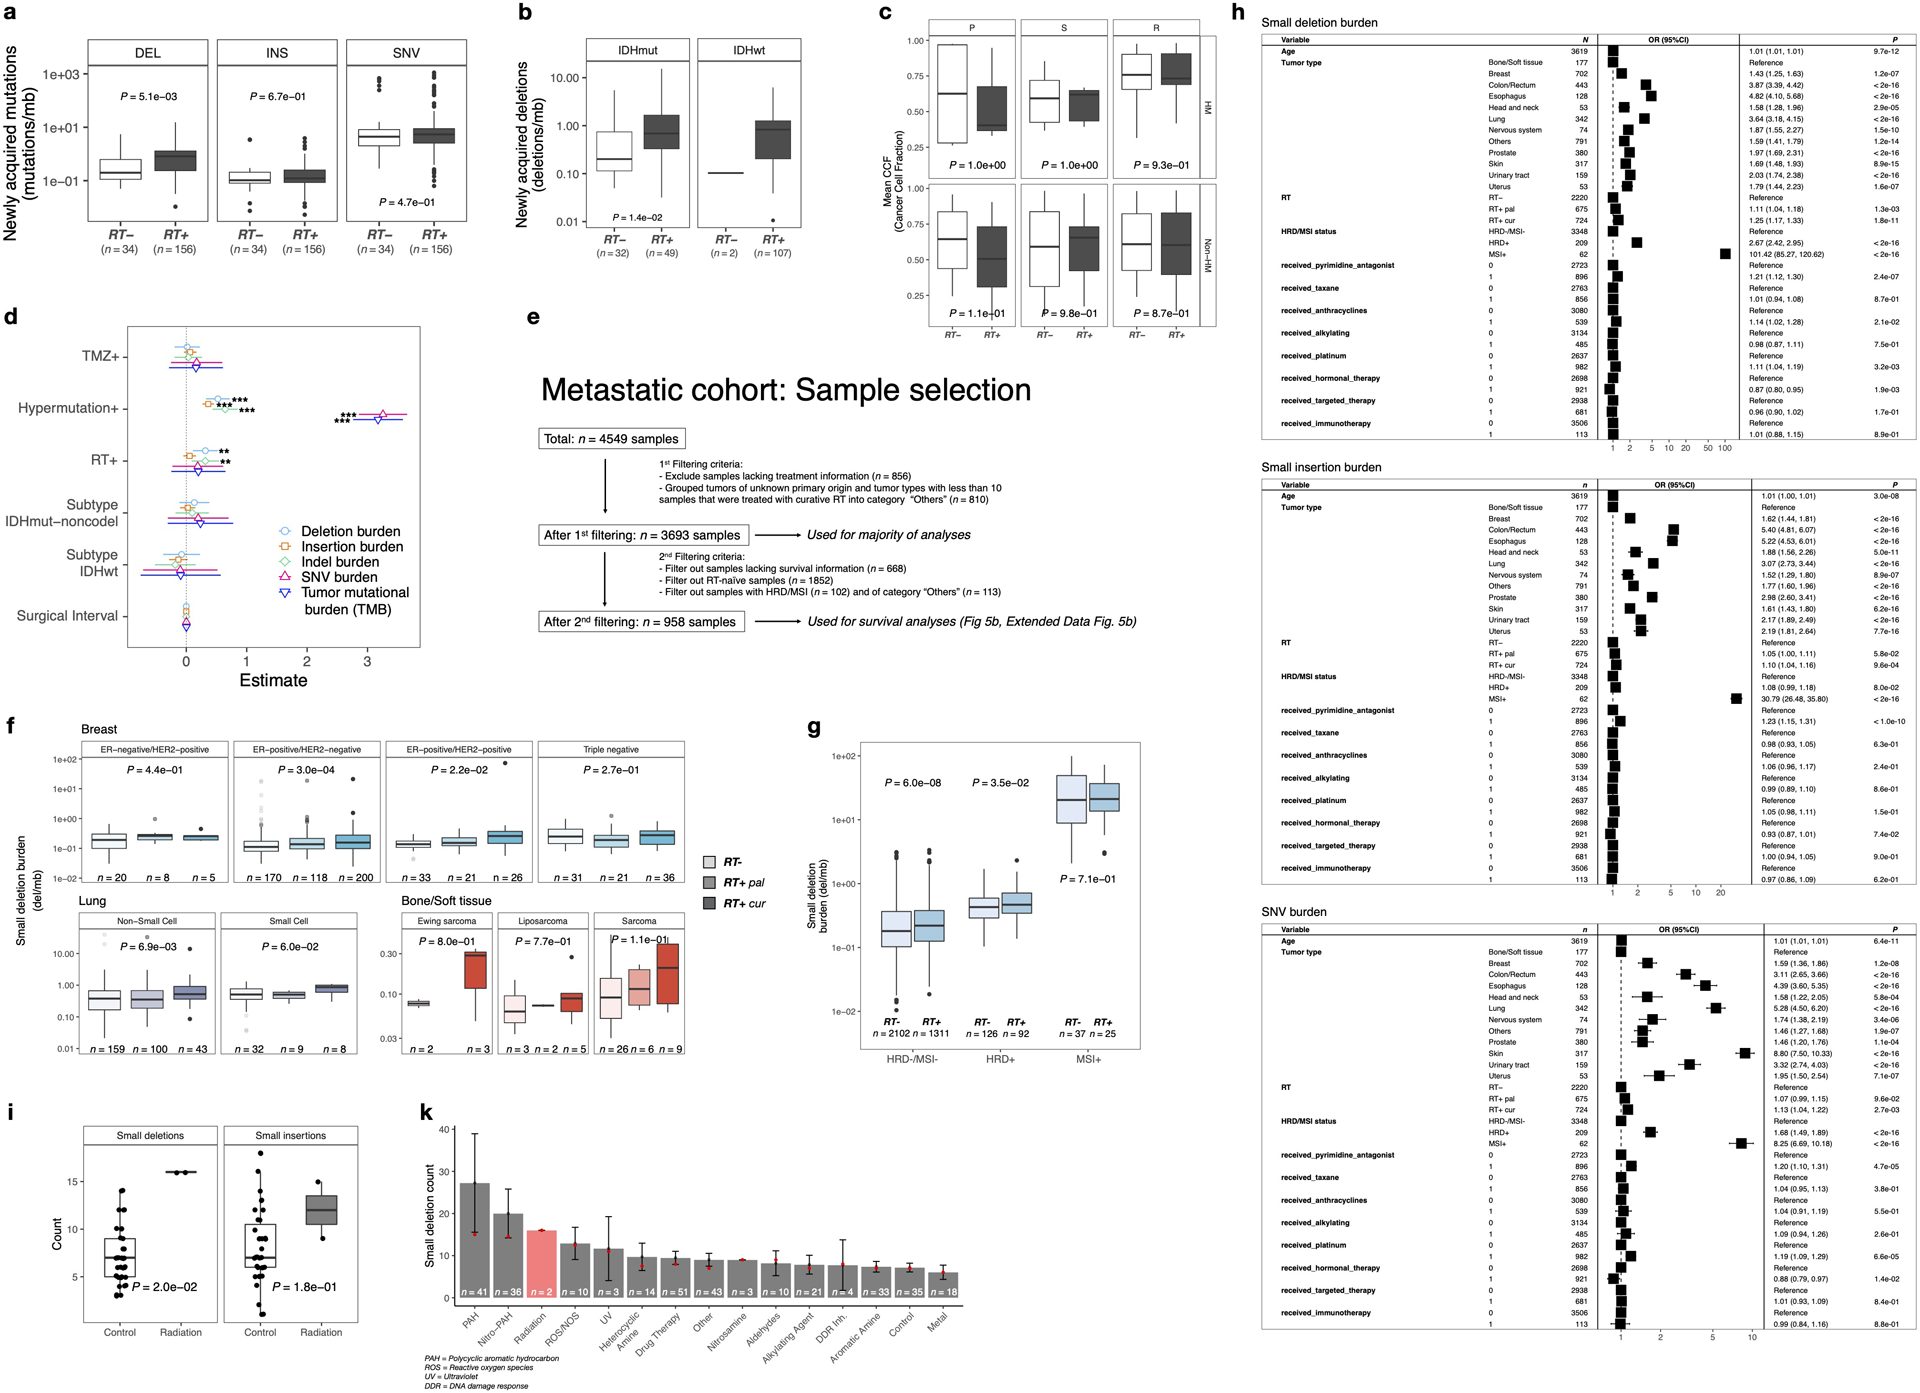
a. Boxplot (in this and all following figures: boxes span quartiles, center lines as medians, whiskers represent absolute range, excluding outliers): burden of post treatment mutations (mutations/mb) in RT-naïve (n=34) and RT-received (n=156) patients from GLASS cohort. Mutations separated by DEL (deletions), INS (insertions) and SNV (single nucleotide variants). Two-sided Mann-Whitney U test.
b. Acquired small deletion burden comparison between RT-naïve and RT-received cases separated by molecular subtype. Two-sided Mann Whitney U test.
c. Comparison of mean cancer cell fraction of small deletions per patient in GLASS separated by P, primary-only fraction, S, shared fraction and R, recurrence-only fraction and by HM, hypermutation. Two-sided Mann-Whitney U test.
d. Forest plots: multivariable log-linear regression model of acquired mutation burden (mutations/mb) in GLASS. Point, mean estimate; lines, 95%-confidence-interval. Two-sided t-test (**=p<0.01, ***=p<0.001).
e. Sample selection and filtering criteria for HMF including a detailed description of the usage for specific figures.
f. Separation of lung, breast and bone/soft tissue cancers into respective subtypes. Comparison of small deletion burden between RT−, RT+pal and RT+cur samples. Two-sided Kruskal-Wallis test.
g. Boxplots depicting burden of small deletions in HRD-/MSI- (n=3,413), HRD+ (n=218) and MSI+ (n=62) samples from the HMF cohort separated by RT-status. Two-sided Mann-Whitney U test.
h. Forest plots depicting multivariable log-linear regression model for mutation burdens in HMF. Two-sided t-test. Mutations separated into small deletions/insertions and SNVs. Independent variables: age, primary tumor location, DNA repair deficiency background and treatment including radiotherapy, taxane, alkylating agents, platin and others.
i. Comparison of small deletion counts between control vs ionizing radiation groups (PMID:30982602). Two-sided Mann-Whitney U test.
k. Distribution of small deletion counts per treatment group (PMID:30982602). Data presented as mean values +/− standard error of the mean, and red dots indicate median count of small deletions.
Extended Data Fig. 2. Genomic characteristics of RT-associated small deletions.
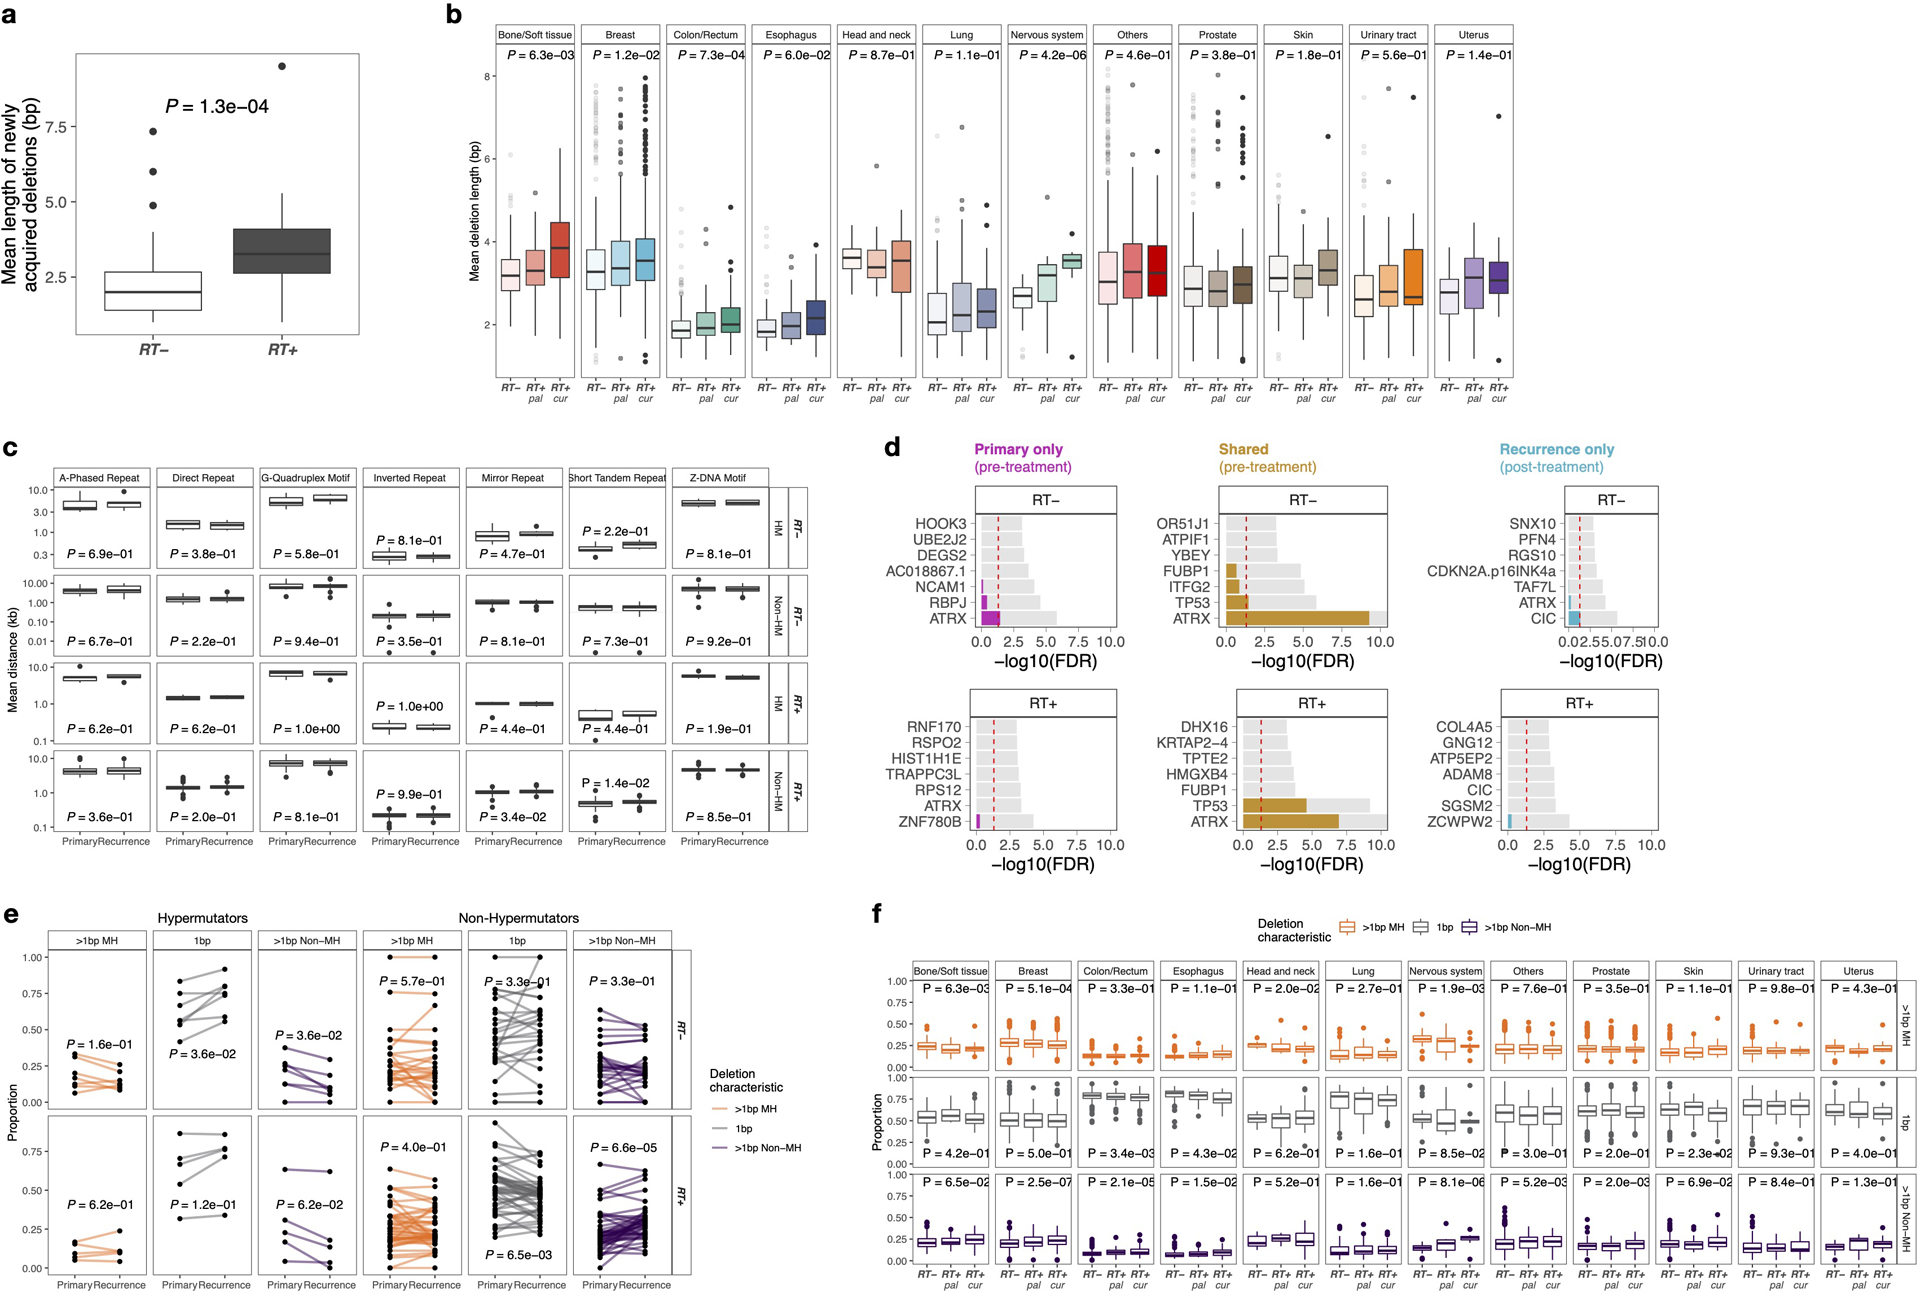
a. Comparison of mean deletion lengths of acquired deletions in RT− vs RT+ IDHmut gliomas. Two-sided Mann-Whitney U test.
b. Metastatic cohort: Boxplots depicting mean deletion lengths in RT-naïve (left) and palliative RT-treated (middle) and curative RT-treated (right) tumor samples separated by primary tumor location. Two-sided Kruskal-Wallis test.
c. Longitudinal comparison (X-Axis) of mean distances of deletions to non-B DNA features in kb (Y-Axis) in IDHmut glioma cases. Cases separated by radiation treatment and hypermutation. Note that neither in hypermutated nor in RT-naïve non-hypermutated glioma samples significant longitudinal differences were observed. Two-sided paired Wilcoxon signed-rank test.
d. Gene-wise dN/dS estimates by RT (rows) and fraction (columns) in GLASS. Two-sided likelihood ratio tests. Genes sorted by Q-value (Bonferroni-adjusted P-value) and P-value. Q-values indicated in color, whereas P-values shown in light grey. Q-value threshold of 0.05 indicated by a horizontal red line.
e. Comparison of proportion of deletions for IDHmut glioma samples separated by RT and hypermutation. Two-sided paired Wilcoxon signed-rank test. For each sample, the proportion of deletions with 1bp length, > 1bp length with microhomology and > 1bp length without microhomology add up to 1. Bottom right panels (RT-received non-hypermutators) presented in Figure 2d and shown here for comparison with other groups.
f. Comparison of proportion of deletions in metastatic cohort between RT-treated and RT-naïve cases using two-sided Kruskal-Wallis test. In bone/soft tissue, breast and head & neck and nervous system cancers, significantly lower proportions of deletions >1bp with microhomology were observed in RT-treated samples compared to RT-naïve samples. In contrast, RT-received breast, colon/rectum, esophagus, nervous system and prostate tumor samples showed significantly higher proportions in deletions > 1bp without microhomology. Boxes span quartiles, center lines as medians, whiskers represent absolute range, excluding outliers.
Extended Data Fig. 3. Mutational signatures associated with RT.
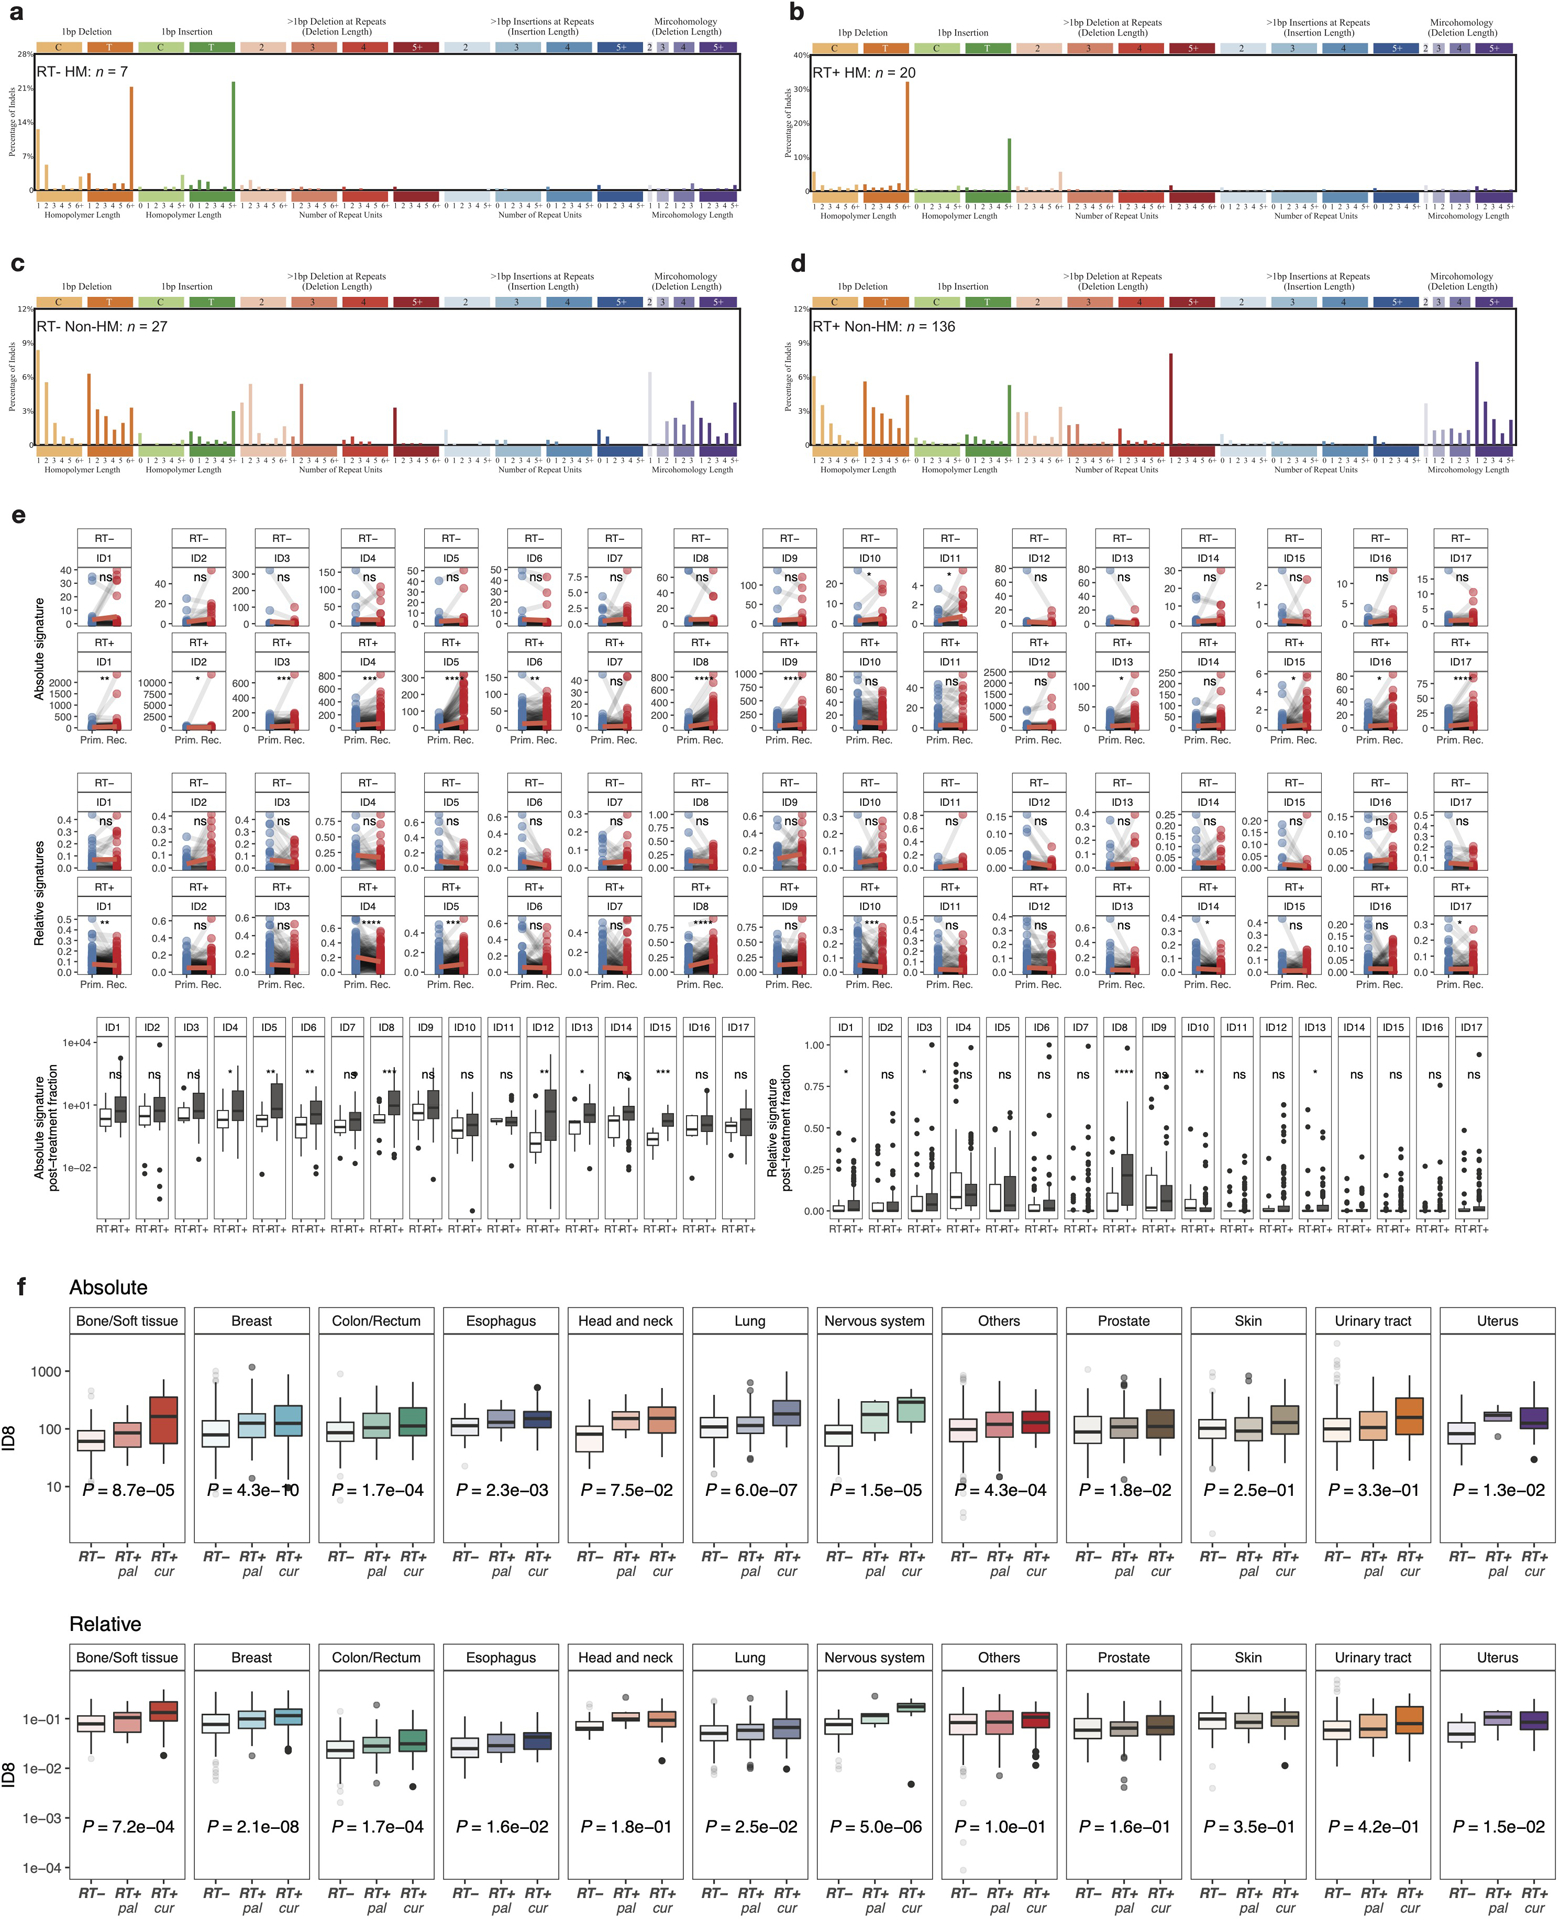
a-d. Distribution of indel types for post-treatment mutations in the GLASS cohort, separated by RT (a, c, RT- negative; b, d, RT-treated) and HM (a-b, Hypermutator; c-d, Non-Hypermutator). Note that patterns of indels in hypermutated samples resemble the previously identified MSI signature ID2, whereas RT-treated Non-Hypermutant gliomas harbor large similarities with ID8. Sample sizes for each subgroup are annotated.
e. Comprehensive comparison of all 17 COSMIC indel (ID) signatures in IDHmut glioma. Top 2 panels display longitudinal comparison of absolute signature contributions separated by radiation treatment (RT+ and RT−). Middle 2 panels display longitudinal comparison of relative signature contributions separated by radiation treatment. For these panels two-sided Mann-Whitney U test was applied for statistical testing. (ns = not significant, * = p < 0.05, ** = p < 0.01, *** = p < 0.001, **** = p < 0.0001). Note that ID8 is the only signature consistently associated with radiation therapy across different comparisons, nominating it as a robust signature of radiotherapy. Boxes span quartiles, center lines as medians, whiskers represent absolute range, excluding outliers.
f. Absolute (top) and relative (bottom) contribution of ID8 signature in metastatic cohort compared between cases with prior radiation treatment and cases without prior radiation treatment separated by tumor types. Note that most tumor types show significantly higher values of the signature in curative RT+ cases. Two-sided Kruskal-Wallis test was applied for statistical testing. Boxes span quartiles, center lines as medians, whiskers represent absolute range, excluding outliers.
Extended Data Fig. 4. Effects of radiotherapy on structural variants.
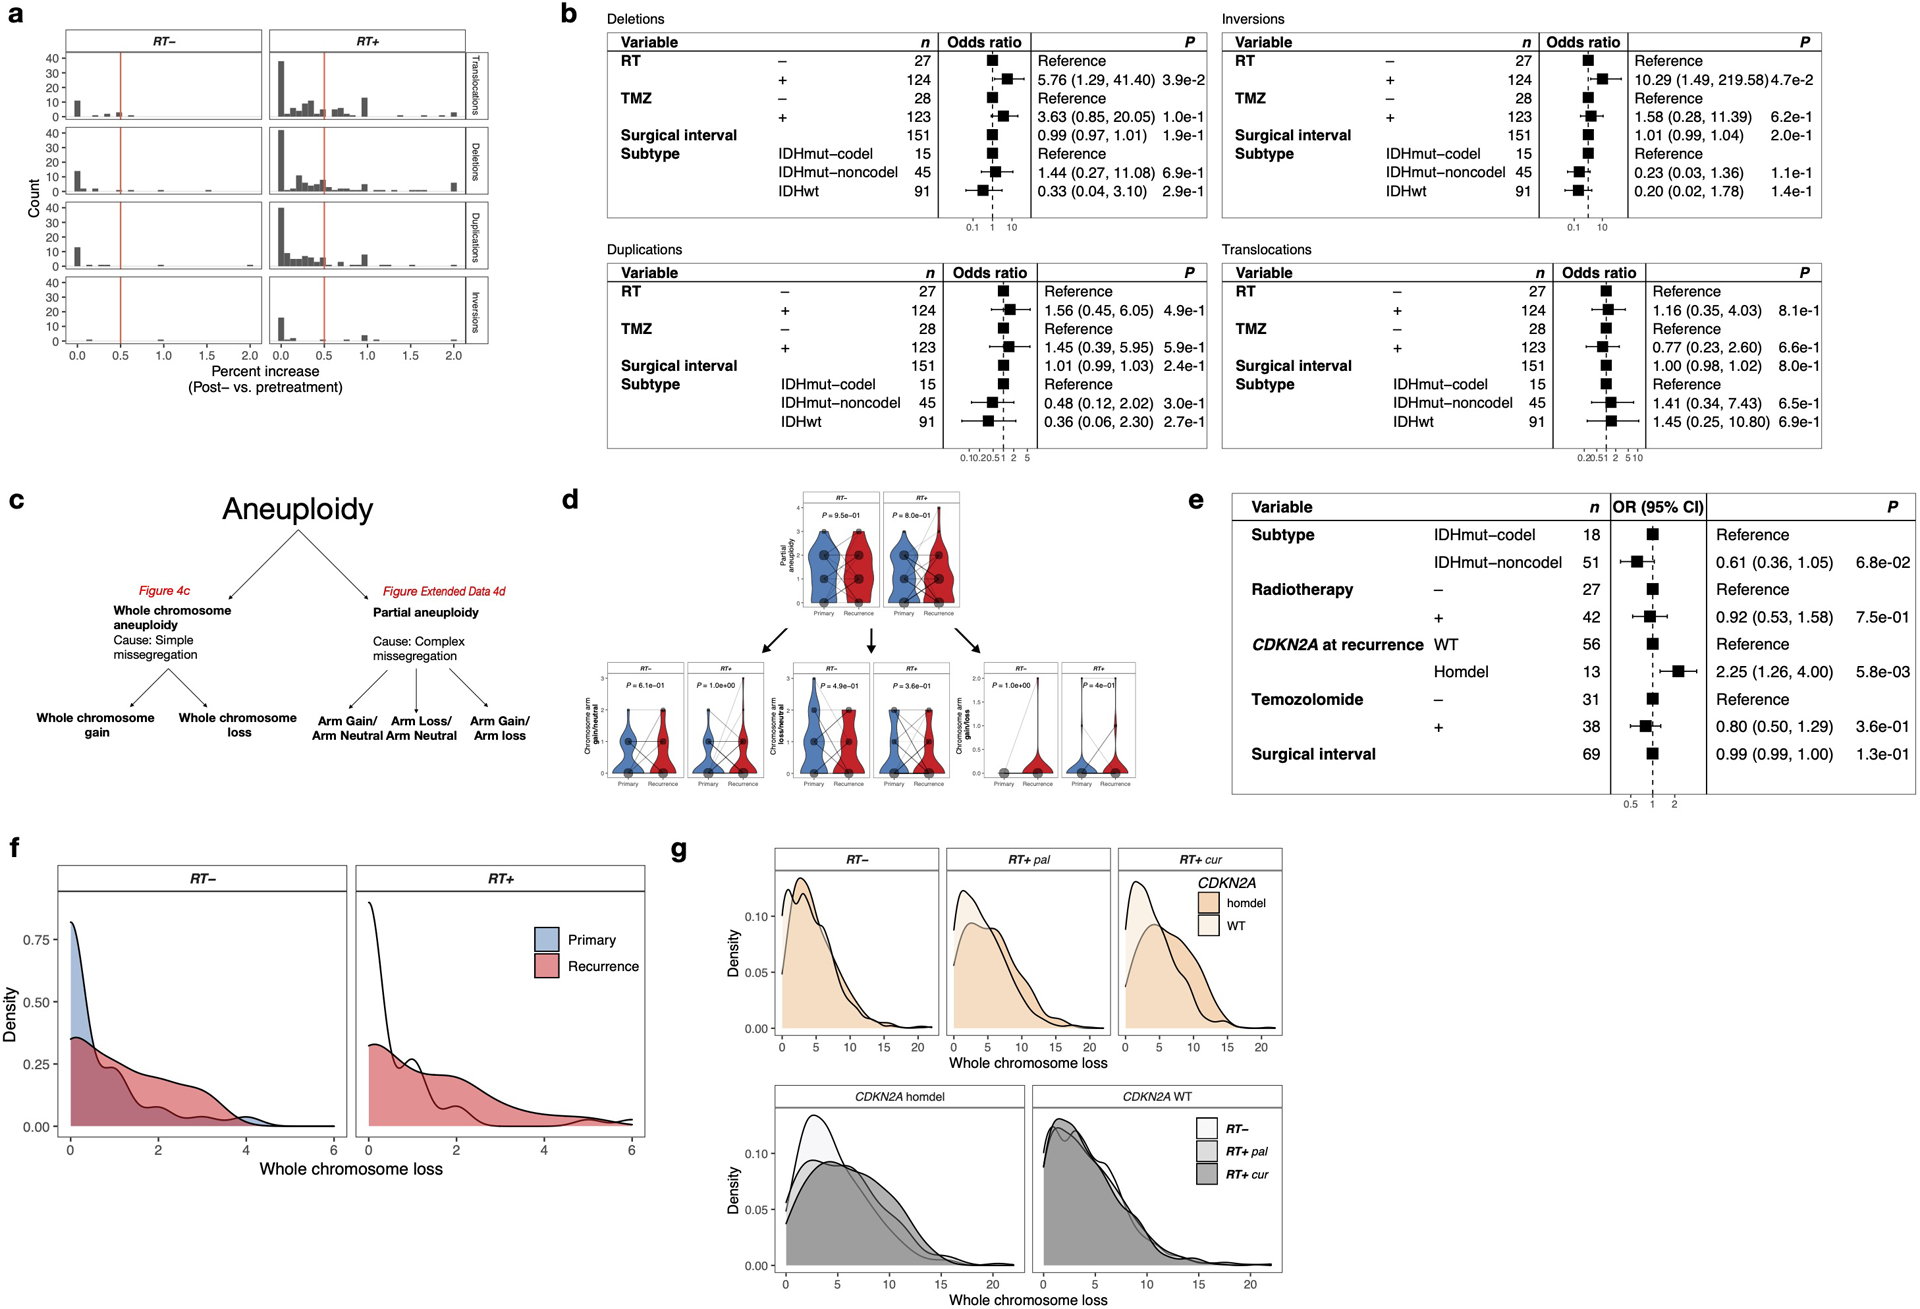
a. Analysis of structural variants (SVs) in glioma samples (Translocations, Duplications, Deletions, Inversions). For each patient, number of SVs were calculated pre-and post-treatment and the proportional increase after therapy for each SV-type was plotted separately for RT-naive and RT-treated samples. Based on the distribution of proportional increase from primary to recurrence, a cutoff was defined for > 50% increase that was further used for analyses in Figure 4a.
b. To support analyses presented in Figure 4a, a multivariable logistic regression model was fitted for the >50% increase values of the structural variant types. Two-sided Wald test. This model includes radiation therapy, temozolomide therapy, molecular subtype and surgical interval as variables.
c. Schematic overview of separation of aneuploidy events into whole chromosome aneuploidy as a result of simple segregation errors and partial aneuploidy as a result of complex segregation errors.
d. Longitudinal analysis of partial aneuploidy in IDHmut glioma samples. Dots are proportional to the frequency of whole chromosome loss integer for each subgroup. Two-sided paired Wilcoxon rank-signed test.
e. Multivariable Poisson regression model for whole chromosome losses in IDHmut glioma including molecular subtype, RT, TMZ, surgical interval and CDKN2A status at recurrence as variables. Two-sided Wald test. Note that CDKN2A homdel, but not RT is independently associated with higher whole chromosome losses.
f. Density plots over integers of whole chromosome deletion scores for comparison between primary vs recurrent glioma samples, separated by radiotherapy.
g. Density plots over integers of whole chromosome deletion scores for comparison between RT-naïve vs RT+pal vs RT+cur and/or CDKN2A homdel vs. wild-type (WT) samples from the HMF dataset. Note that CDKN2A homdel is associated with higher whole chromosome deletion scores, independent of RT. Within samples with CDKN2A homdel, samples that were RT-treated with curative intent show the highest deletion scores.
Extended Data Fig. 5. Radiotherapy-associated genomic scars linked to poor survival.
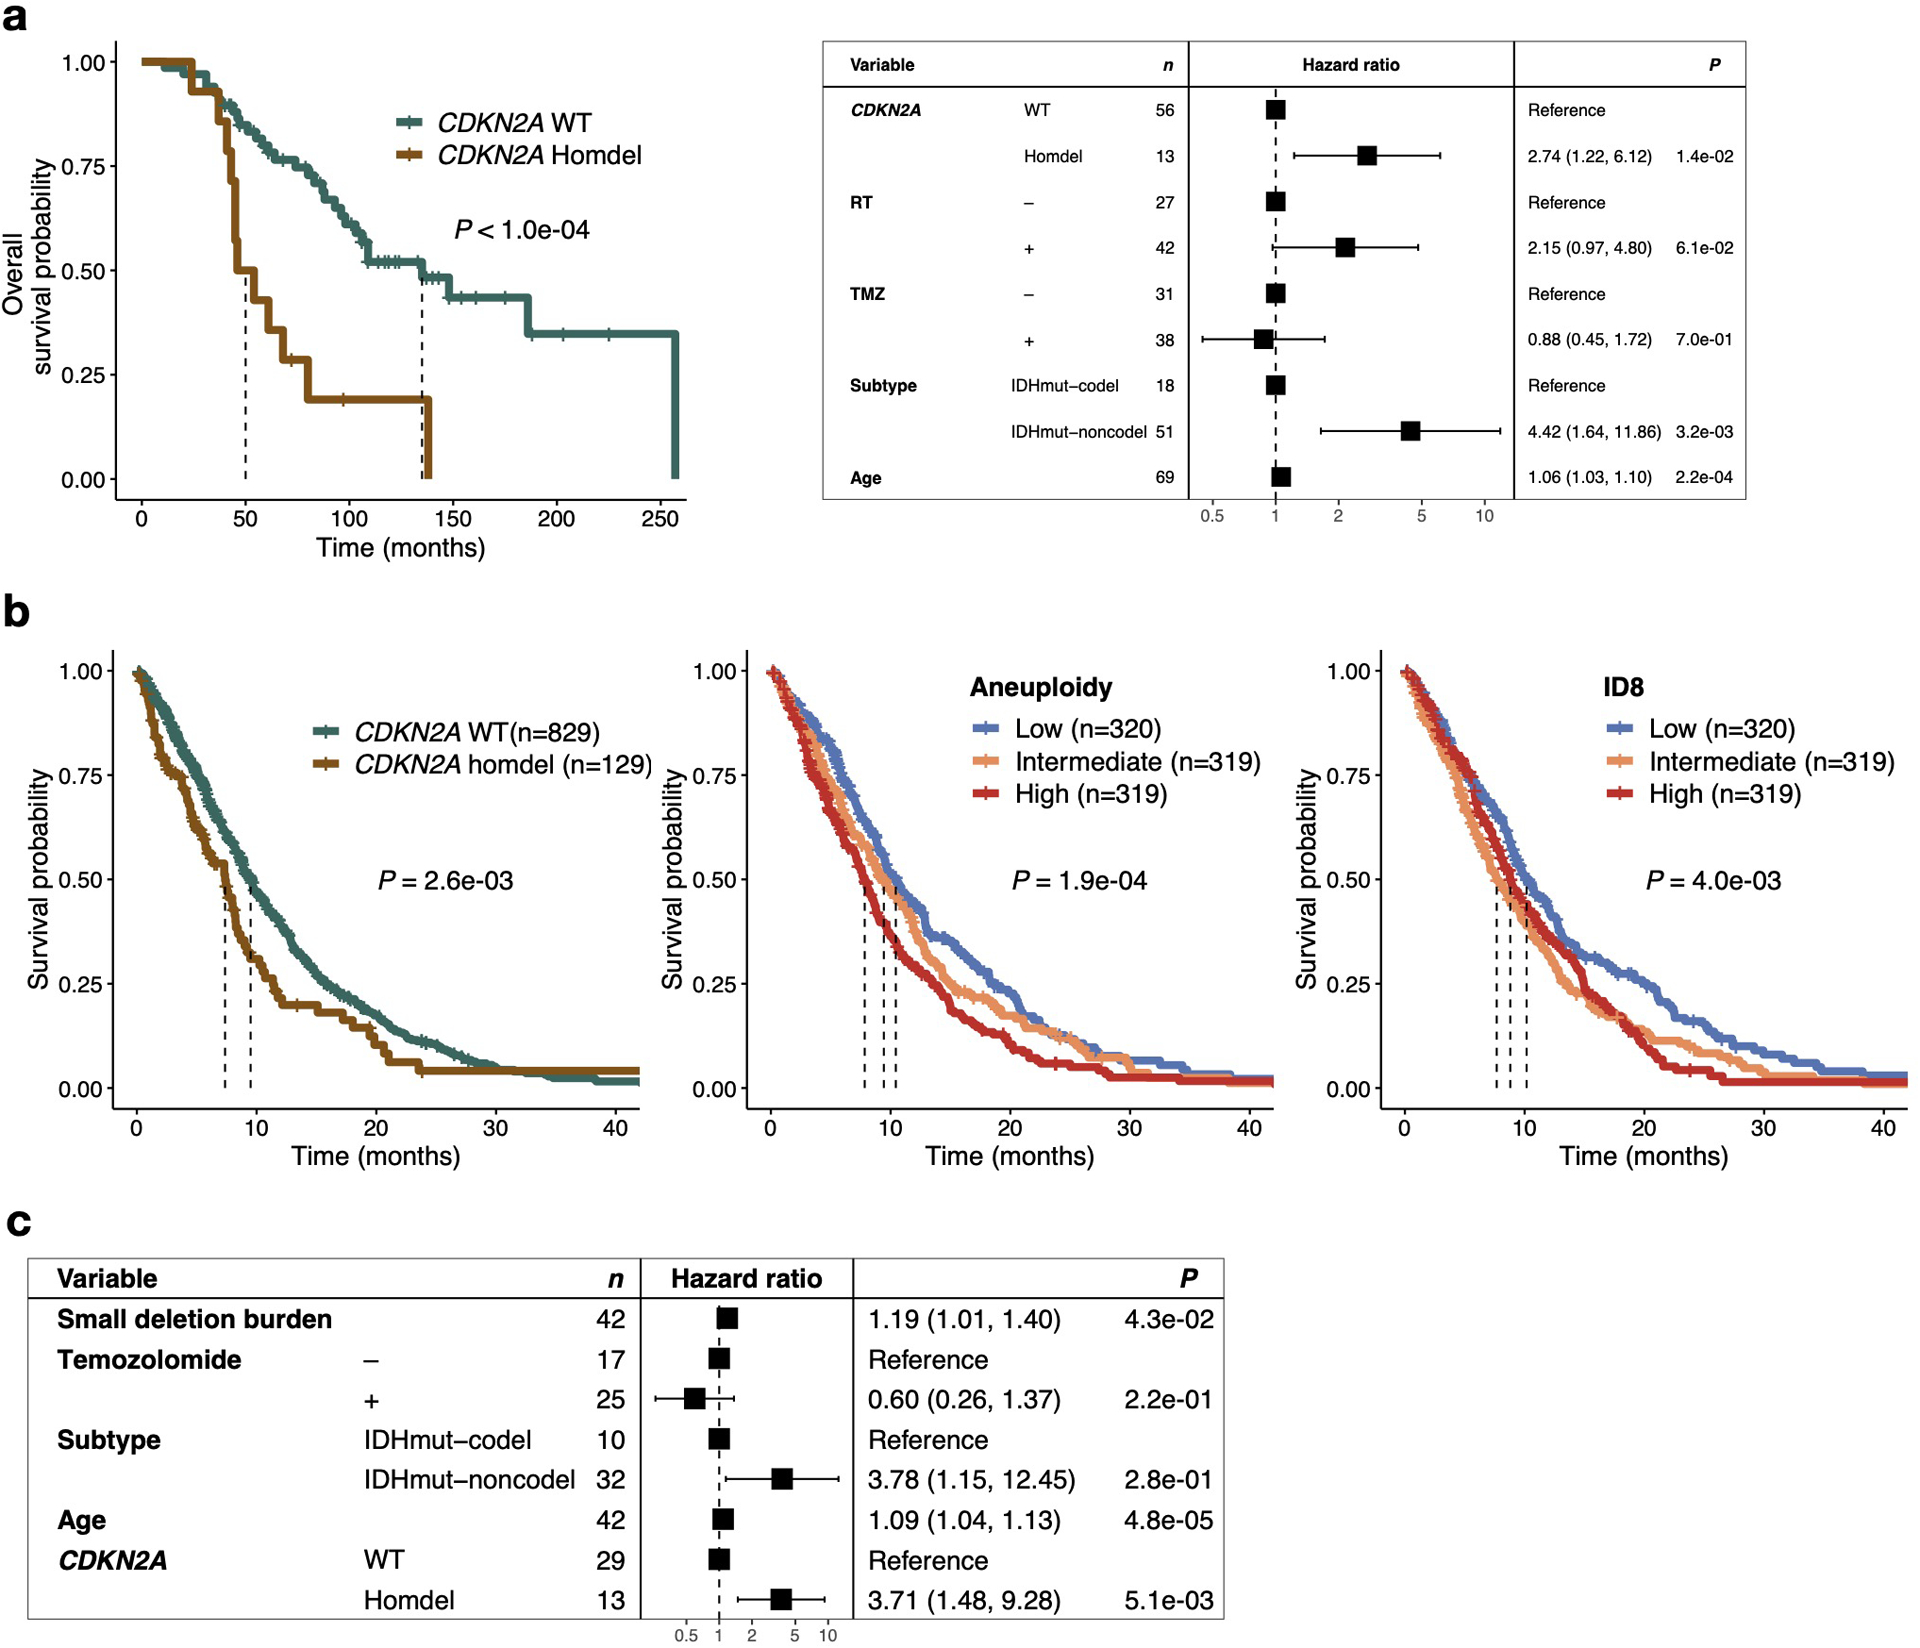
a. Left: Kaplan-Meier survival plot comparing overall survival time dependent on CDKN2A status at recurrence using two-sided log-rank test in IDH mutant glioma samples. Right: Multivariable cox regression model including CDKN2A status at recurrence, TMZ-treatment, molecular subtype and Age as variables. Two-sided Wald test was applied.
b. Left: Kaplan Meier survival plot comparing survival time dependent on CDKN2A status at metastasis using two-sided log-rank test RT-treated metastases (n = 958 with available survival information). Middle: Kaplan Meier survival plot comparing survival time dependent on aneuploidy burden at metastasis using two-sided log-rank test in RT-treated metastases (n = 958 with available survival information). Samples were separated into 3 tertiles based on whole chromosome loss aneuploidy scores: high (top tertile), intermediate (middle tertile) and low (bottom tertile). Right: Kaplan Meier survival plot comparing survival time dependent RT signature ID8 burden at metastasis using two-sided log-rank test in RT-treated metastases (n = 958 with available survival information). Samples were separated into 3 tertiles based on ID8 burden: high (top tertile), intermediate (middle tertile) and low (bottom tertile). Note that a low ID8 burden is associated with better survival, indicating a better response to RT.
c. Multivariable cox regression model including deletion burden at recurrence as continuous variable, CDKN2A homozygous deletion, Temozolomide-treatment, molecular subtype and age as variables in RT-treated IDH mutant samples.
Supplementary Material
ACKNOWLEDGEMENTS
This publication and the underlying study have been made possible partly on the basis of the data that Hartwig Medical Foundation and the Center of Personalised Cancer Treatment (CPCT) have made available to the study.
This work was supported by the following NIH grants: R01 CA190121, R01 CA237208, R21 NS114873 and Cancer Center Support Grant P30 CA034196, grants from the Musella Foundation, the B*CURED Foundation, the Brain Tumour Charity, and the Department of Defense W81XWH1910246 (R.G.W.V).
F.P.B. is supported by the JAX Scholar program and the National Cancer Institute (K99 CA226387). F.S.V. is supported by a postdoctoral fellowship from The Jane Coffin Childs Memorial Fund for Medical Research. K.C.J. is the recipient of an American Cancer Society Fellowship (130984-PF-17-141-01-DMC). E.K. is recipient of an MD-Fellowship by the Boehringer Ingelheim Fonds and is supported by the German National Academic Foundation.
Footnotes
Competing Interests
R.G.W.V. is a co-founder of Boundless Bio, Inc., which was not involved in the research presented here. R.G.W.V. is a member of Scientific Advisory Board of the Hartwig Medical Foundation. F.P.B. has performed consulting for Bristol Myers Squibb.
R.G.W.V., E.K., K.J.A., and F.P.B. are listed as inventors on a patent application filed by The Jackson Laboratory, related to the findings described here. The remaining authors declare no competing interests.
REFERENCES
- 1.Barton MB et al. Estimating the demand for radiotherapy from the evidence: a review of changes from 2003 to 2012. Radiother Oncol 112, 140–4 (2014). [DOI] [PubMed] [Google Scholar]
- 2.Tyldesley S et al. Estimating the need for radiotherapy for patients with prostate, breast, and lung cancers: verification of model estimates of need with radiotherapy utilization data from British Columbia. Int J Radiat Oncol Biol Phys 79, 1507–15 (2011). [DOI] [PubMed] [Google Scholar]
- 3.Chang HHY, Pannunzio NR, Adachi N & Lieber MR Non-homologous DNA end joining and alternative pathways to double-strand break repair. Nat Rev Mol Cell Biol 18, 495–506 (2017). [DOI] [PMC free article] [PubMed] [Google Scholar]
- 4.Campbell BB et al. Comprehensive Analysis of Hypermutation in Human Cancer. Cell 171, 1042–1056 e10 (2017). [DOI] [PMC free article] [PubMed] [Google Scholar]
- 5.Barthel FP et al. Longitudinal molecular trajectories of diffuse glioma in adults. Nature 576, 112–120 (2019). [DOI] [PMC free article] [PubMed] [Google Scholar]
- 6.Touat M et al. Mechanisms and therapeutic implications of hypermutation in gliomas. Nature 580, 517–523 (2020). [DOI] [PMC free article] [PubMed] [Google Scholar]
- 7.Behjati S et al. Mutational signatures of ionizing radiation in second malignancies. Nat Commun 7, 12605 (2016). [DOI] [PMC free article] [PubMed] [Google Scholar]
- 8.Priestley P et al. Pan-cancer whole-genome analyses of metastatic solid tumours. Nature 575, 210–216 (2019). [DOI] [PMC free article] [PubMed] [Google Scholar]
- 9.Consortium G Glioma through the looking GLASS: molecular evolution of diffuse gliomas and the Glioma Longitudinal Analysis Consortium. Neuro Oncol 20, 873–884 (2018). [DOI] [PMC free article] [PubMed] [Google Scholar]
- 10.Stupp R et al. Radiotherapy plus concomitant and adjuvant temozolomide for glioblastoma. N Engl J Med 352, 987–96 (2005). [DOI] [PubMed] [Google Scholar]
- 11.Louis DN et al. The 2016 World Health Organization Classification of Tumors of the Central Nervous System: a summary. Acta Neuropathol 131, 803–20 (2016). [DOI] [PubMed] [Google Scholar]
- 12.Lutz ST, Jones J & Chow E Role of radiation therapy in palliative care of the patient with cancer. J Clin Oncol 32, 2913–9 (2014). [DOI] [PMC free article] [PubMed] [Google Scholar]
- 13.Nguyen L, J WMM, Van Hoeck A & Cuppen E Pan-cancer landscape of homologous recombination deficiency. Nat Commun 11, 5584 (2020). [DOI] [PMC free article] [PubMed] [Google Scholar]
- 14.Pich O et al. The mutational footprints of cancer therapies. Nat Genet 51, 1732–1740 (2019). [DOI] [PMC free article] [PubMed] [Google Scholar]
- 15.Kucab JE et al. A Compendium of Mutational Signatures of Environmental Agents. Cell 177, 821–836.e16 (2019). [DOI] [PMC free article] [PubMed] [Google Scholar]
- 16.Georgakopoulos-Soares I, Morganella S, Jain N, Hemberg M & Nik-Zainal S Noncanonical secondary structures arising from non-B DNA motifs are determinants of mutagenesis. Genome research 28, 1264–1271 (2018). [DOI] [PMC free article] [PubMed] [Google Scholar]
- 17.Martincorena I et al. Universal Patterns of Selection in Cancer and Somatic Tissues. Cell 171, 1029–1041.e21 (2017). [DOI] [PMC free article] [PubMed] [Google Scholar]
- 18.Alexandrov LB et al. The repertoire of mutational signatures in human cancer. Nature 578, 94–101 (2020). [DOI] [PMC free article] [PubMed] [Google Scholar]
- 19.Davies H et al. HRDetect is a predictor of BRCA1 and BRCA2 deficiency based on mutational signatures. Nat Med 23, 517–525 (2017). [DOI] [PMC free article] [PubMed] [Google Scholar]
- 20.Touat M et al. Mechanisms and therapeutic implications of hypermutation in gliomas. Nature 580, 517–523 (2020). [DOI] [PMC free article] [PubMed] [Google Scholar]
- 21.Nik-Zainal S et al. Landscape of somatic mutations in 560 breast cancer whole-genome sequences. Nature 534, 47–54 (2016). [DOI] [PMC free article] [PubMed] [Google Scholar]
- 22.Roberts SA et al. An APOBEC cytidine deaminase mutagenesis pattern is widespread in human cancers. Nat Genet 45, 970–6 (2013). [DOI] [PMC free article] [PubMed] [Google Scholar]
- 23.Lei L et al. APOBEC3 induces mutations during repair of CRISPR-Cas9-generated DNA breaks. Nat Struct Mol Biol 25, 45–52 (2018). [DOI] [PubMed] [Google Scholar]
- 24.Nowarski R & Kotler M APOBEC3 cytidine deaminases in double-strand DNA break repair and cancer promotion. Cancer Res 73, 3494–8 (2013). [DOI] [PMC free article] [PubMed] [Google Scholar]
- 25.Nowarski R et al. APOBEC3G enhances lymphoma cell radioresistance by promoting cytidine deaminase-dependent DNA repair. Blood 120, 366–75 (2012). [DOI] [PMC free article] [PubMed] [Google Scholar]
- 26.Volkova NV et al. Mutational signatures are jointly shaped by DNA damage and repair. Nat Commun 11, 2169 (2020). [DOI] [PMC free article] [PubMed] [Google Scholar]
- 27.Ceccarelli M et al. Molecular Profiling Reveals Biologically Discrete Subsets and Pathways of Progression in Diffuse Glioma. Cell 164, 550–563 (2016). [DOI] [PMC free article] [PubMed] [Google Scholar]
- 28.Adewoye AB, Lindsay SJ, Dubrova YE & Hurles ME The genome-wide effects of ionizing radiation on mutation induction in the mammalian germline. Nature communications 6, 6684–6684 (2015). [DOI] [PMC free article] [PubMed] [Google Scholar]
- 29.Bakhoum SF et al. Numerical chromosomal instability mediates susceptibility to radiation treatment. Nature communications 6, 5990–5990 (2015). [DOI] [PMC free article] [PubMed] [Google Scholar]
- 30.Rose Li Y et al. Mutational signatures in tumours induced by high and low energy radiation in Trp53 deficient mice. Nat Commun 11, 394 (2020). [DOI] [PMC free article] [PubMed] [Google Scholar]
- 31.Touil N, Elhajouji A, Thierens H & Kirsch-Volders M Analysis of chromosome loss and chromosome segregation in cytokinesis-blocked human lymphocytes: non-disjunction is the prevalent mistake in chromosome segregation produced by low dose exposure to ionizing radiation. Mutagenesis 15, 1–7 (2000). [DOI] [PubMed] [Google Scholar]
- 32.Behjati S et al. Mutational signatures of ionizing radiation in second malignancies. Nat Commun 7, 12605 (2016). [DOI] [PMC free article] [PubMed] [Google Scholar]
- 33.Davidson PR, Sherborne AL, Taylor B, Nakamura AO & Nakamura JL A pooled mutational analysis identifies ionizing radiation-associated mutational signatures conserved between mouse and human malignancies. Sci Rep 7, 7645 (2017). [DOI] [PMC free article] [PubMed] [Google Scholar]
- 34.Lopez GY et al. The genetic landscape of gliomas arising after therapeutic radiation. Acta Neuropathol 137, 139–150 (2019). [DOI] [PMC free article] [PubMed] [Google Scholar]
- 35.Phi JH et al. Genomic analysis reveals secondary glioblastoma after radiotherapy in a subset of recurrent medulloblastomas. Acta Neuropathol 135, 939–953 (2018). [DOI] [PubMed] [Google Scholar]
- 36.Hu Z et al. Quantitative evidence for early metastatic seeding in colorectal cancer. Nat Genet 51, 1113–1122 (2019). [DOI] [PMC free article] [PubMed] [Google Scholar]
- 37.Reiter JG et al. Lymph node metastases develop through a wider evolutionary bottleneck than distant metastases. Nat Genet 52, 692–700 (2020). [DOI] [PMC free article] [PubMed] [Google Scholar]
- 38.Wiggans AJ, Cass GK, Bryant A, Lawrie TA & Morrison J Poly(ADP-ribose) polymerase (PARP) inhibitors for the treatment of ovarian cancer. Cochrane Database Syst Rev, CD007929 (2015). [DOI] [PMC free article] [PubMed] [Google Scholar]
- 39.Su JM et al. A phase I trial of veliparib (ABT-888) and temozolomide in children with recurrent CNS tumors: a pediatric brain tumor consortium report. Neuro Oncol 16, 1661–8 (2014). [DOI] [PMC free article] [PubMed] [Google Scholar]
- 40.O’Neil NJ, Bailey ML & Hieter P Synthetic lethality and cancer. Nature reviews. Genetics 18, 613–623 (2017). [DOI] [PubMed] [Google Scholar]
- 41.Munster P et al. First-In-Human Phase I Study Of A Dual mTOR Kinase And DNA-PK Inhibitor (CC-115) In Advanced Malignancy. Cancer Manag Res 11, 10463–10476 (2019). [DOI] [PMC free article] [PubMed] [Google Scholar]
- 42.Goldberg FW et al. The Discovery of 7-Methyl-2-[(7-methyl[1,2,4]triazolo[1,5-a]pyridin-6-yl)amino]-9-(tetrahydro-2H-p yran-4-yl)-7,9-dihydro-8H-purin-8-one (AZD7648), a Potent and Selective DNA-Dependent Protein Kinase (DNA-PK) Inhibitor. J Med Chem (2020). [DOI] [PubMed] [Google Scholar]
- 43.Thijssen R et al. Dual TORK/DNA-PK inhibition blocks critical signaling pathways in chronic lymphocytic leukemia. Blood 128, 574–83 (2016). [DOI] [PubMed] [Google Scholar]
- 44.Timme CR, Rath BH, O’Neill JW, Camphausen K & Tofilon PJ The DNA-PK Inhibitor VX-984 Enhances the Radiosensitivity of Glioblastoma Cells Grown In Vitro and as Orthotopic Xenografts. Mol Cancer Ther 17, 1207–1216 (2018). [DOI] [PMC free article] [PubMed] [Google Scholar]
- 45.Li M et al. First-in-class small molecule inhibitors of the single-strand DNA cytosine deaminase APOBEC3G. ACS Chem Biol 7, 506–17 (2012). [DOI] [PMC free article] [PubMed] [Google Scholar]
- 46.Bins S et al. Implementation of a Multicenter Biobanking Collaboration for Next-Generation Sequencing-Based Biomarker Discovery Based on Fresh Frozen Pretreatment Tumor Tissue Biopsies. Oncologist 22, 33–40 (2017). [DOI] [PMC free article] [PubMed] [Google Scholar]
- 47.Cer RZ et al. Non-B DB v2.0: a database of predicted non-B DNA-forming motifs and its associated tools. Nucleic acids research 41, D94–D100 (2013). [DOI] [PMC free article] [PubMed] [Google Scholar]
- 48.Blokzijl F, Janssen R, van Boxtel R & Cuppen E MutationalPatterns: comprehensive genome-wide analysis of mutational processes. Genome medicine 10, 33–33 (2018). [DOI] [PMC free article] [PubMed] [Google Scholar]
- 49.Bergstrom EN et al. SigProfilerMatrixGenerator: a tool for visualizing and exploring patterns of small mutational events. BMC Genomics 20, 685 (2019). [DOI] [PMC free article] [PubMed] [Google Scholar]
- 50.Li H et al. The Sequence Alignment/Map format and SAMtools. Bioinformatics 25, 2078–9 (2009). [DOI] [PMC free article] [PubMed] [Google Scholar]
- 51.Layer RM, Chiang C, Quinlan AR & Hall IM LUMPY: a probabilistic framework for structural variant discovery. Genome Biol 15, R84 (2014). [DOI] [PMC free article] [PubMed] [Google Scholar]
- 52.Abyzov A, Urban AE, Snyder M & Gerstein M CNVnator: an approach to discover, genotype, and characterize typical and atypical CNVs from family and population genome sequencing. Genome Res 21, 974–84 (2011). [DOI] [PMC free article] [PubMed] [Google Scholar]
- 53.Chiang C et al. SpeedSeq: ultra-fast personal genome analysis and interpretation. Nat Methods 12, 966–8 (2015). [DOI] [PMC free article] [PubMed] [Google Scholar]
- 54.Van der Auwera GA et al. From FastQ data to high confidence variant calls: the Genome Analysis Toolkit best practices pipeline. Curr Protoc Bioinformatics 43, 11 10 1–11 10 33 (2013). [DOI] [PMC free article] [PubMed] [Google Scholar]
Associated Data
This section collects any data citations, data availability statements, or supplementary materials included in this article.
Supplementary Materials
Data Availability Statement
Processed sequencing data from the GLASS project used in this study are available on Synapse, at https://www.synapse.org/glass. The WGS, RNA-seq, and corresponding clinical data used in this study were made available by the Hartwig Medical Foundation and were accessed under a license agreement (HMF DR-057 version 3.0). Data access can be obtained by filling out a data request forms. The form and detailed application procedures can be found online at https://www.hartwigmedicalfoundation.nl/applying-for-data/. The repeatmasker database used in this manuscript is available online at https://www.repeatmasker.org/.