Abstract
Background
Effective orifice area (EOA) ≥0.2 cm2 or regurgitant volume (Rvol) ≥30 mL predicts prognostic significance in functional mitral regurgitation (FMR). Both volumetric and proximal isovelocity surface area (PISA) methods enable calculation of these metrics. To determine their clinical value, we compared EOA and Rvol derived by volumetric and PISA quantitation upon outcome of patients with FMR.
Methods and Results
We examined the outcome of patients with left ventricular ejection fraction <35% and moderate to severe FMR. All had a complete echocardiogram including EOA and Rvol by both standard PISA and volumetric quantitation using total stroke volume calculated by left ventricular end‐diastolic volume×left ventricular ejection fraction and forward flow by Doppler method: EOA=Rvol/mitral regurgitation velocity time integral. Primary outcome was all‐cause mortality or heart transplantation. We examined 177 patients: mean left ventricular ejection fraction 25.2% and 34.5% with ischemic cardiomyopathy. Echo measurements were greater by PISA than volumetric quantitation: EOA (0.18 versus 0.11 cm2), Rvol (24.7 versus 16.9 mL), and regurgitant fraction (61 versus 37 %) respectively (all P value <0.001). During 3.6±2.3 years’ follow‐up, patients with EOA ≥0.2 cm2 or Rvol ≥30 mL had a worse outcome than those with EOA <0.2 cm2 or Rvol <30 mL only by volumetric (log rank P=0.003 and 0.004) but not PISA quantitation (log rank P=0.984 and 0.544), respectively.
Conclusions
Volumetric and PISA methods yield different measurements of EOA and Rvol in FMR; volumetric values exhibit greater prognostic significance. The echo method of quantifying FMR may affect the management of this disorder.
Keywords: functional mitral regurgitation, outcome, proximal isovelocity surface area (PISA) method, volumetric method
Subject Categories: Vascular Disease, Echocardiography, Quality and Outcomes
Nonstandard Abbreviations and Acronyms
- ASE
American Society of Echocardiography
- EOA
effective orifice area
- FMR
functional mitral regurgitation
- MR
mitral regurgitation
- PISA
proximal isovelocity surface area
- RF
regurgitant fraction
- Rvol
regurgitant volume
- TSV
total stroke volume
Clinical Perspective
What Is New?
We compared the determination of effective orifice area and regurgitant volume by volumetric and proximal isovelocity surface area echo methods to predict the outcome of patients with functional mitral regurgitation.
We found that effective orifice area or regurgitant volume obtained by the volumetric method demonstrated greater prognostic significance.
What Are the Clinical Implications?
Effective orifice area and regurgitant volume obtained by echo are important measures of the severity of functional mitral regurgitation.
Accurate quantitation of valvular regurgitation has prognostic importance and has implications regarding selection of interventional therapy in patients with functional mitral regurgitation.
The volumetric method of deriving effective orifice area and regurgitant volume by echo is superior to the proximal isovelocity surface area method in predicting mortality in patients with functional mitral regurgitation and should be the preferred quantitative method.
Functional mitral regurgitation (FMR), whether attributable to ischemic or nonischemic disease, has been characterized by an enlarged left ventricle, tethered mitral leaflets, and a dynamic change of mitral annular geometry.1, 2, 3, 4, 5, 6 Patients with FMR who have an effective orifice area (EOA) ≥0.2 cm2 or regurgitant volume (Rvol) ≥30 mL have been demonstrated to have a worse clinical outcome.7 The most commonly applied method to calculate EOA and Rvol uses measurements derived from the proximal isovelocity surface area (PISA) signal. However, this method has a number of limitations including assumption of a hemispherical shape, a flat mitral annulus and an infinitesimally small regurgitant area.8, 9, 10, 11 An alternate quantitative approach uses left ventricular (LV) volumetric measurements to derive total stroke volume (TSV), and the product of LV outflow velocity and area to determine forward stroke volume.12, 13 The volumetric method also has imperfections, including the fact that the assessment of endocardial detection depends upon the quality of the recording, and that the accuracy of LV outflow measures rely upon the precision of aortic annulus and outflow velocity identification. Both methods also use velocity measurements from the mitral regurgitant jet. The outcome of FMR quantified by these two methods remains uncertain, as is their ability to risk‐stratify patients. It is anticipated that a more accurate method of quantifying mitral regurgitation (MR) would enable greater risk stratification and prognostic ability. Therefore, we compared PISA and volumetric quantitation of FMR and examined patient outcomes to determine the ability of these 2 methods to identify high‐risk patients with FMR. In the past, MR in patients with severe LV dysfunction was considered a disease of the ventricle, and it was believed that repair of the valve would not be of benefit. Two recent studies have yielded divergent results as to the benefit of interventional therapy.14, 15 It is likely that the relative risks of the patients included in the studies played a role in the different results. Therefore, accurate risk stratification will be of particular importance for patients with FMR with severe LV dysfunction.
Methods
The data that support the findings of this study are available from the corresponding author upon reasonable request.
Study Population
This is a retrospective single‐center study of patients undergoing echocardiography between January 1, 2010, and December 31, 2015. We identified the echocardiograms of all patients with left ventricular ejection fraction (LVEF) ≤35% and moderate (147; 83%) to severe (30; 17%) FMR according to American Society of Echocardiography (ASE) guidelines.13 Also, we considered additional findings such as pulmonary vein systolic flow reversal (39; 22%) and MR jet directed toward left atrial posterior wall (115; 65%) for MR grading. For consistency, if a patient had multiple echocardiograms in the study period, we selected the first echo that showed LVEF ≤35% and moderate to severe FMR. All patients had an echocardiogram performed as indicated clinically. A total of 316 patients met LVEF ≤35% and moderate to severe FMR; among them, we included 177 patients, 67% men, with an average age of 59±13 years. We excluded patients with suboptimal 2‐dimensional image quality (35; 11%), atrial fibrillation or frequent arrhythmia (21; 7%), moderate to severe aortic regurgitation (7; 2%), and missing data (76; 24%) (Figure 1). Comorbidities and outcome were documented by a review of medical records. Our study complies with the Declaration of Helsinki and is approved by the ethics committee of the University of California, San Diego. Written informed consent was waived given the retrospective nature of the study.
Figure 1. Flow diagram of study subjects.
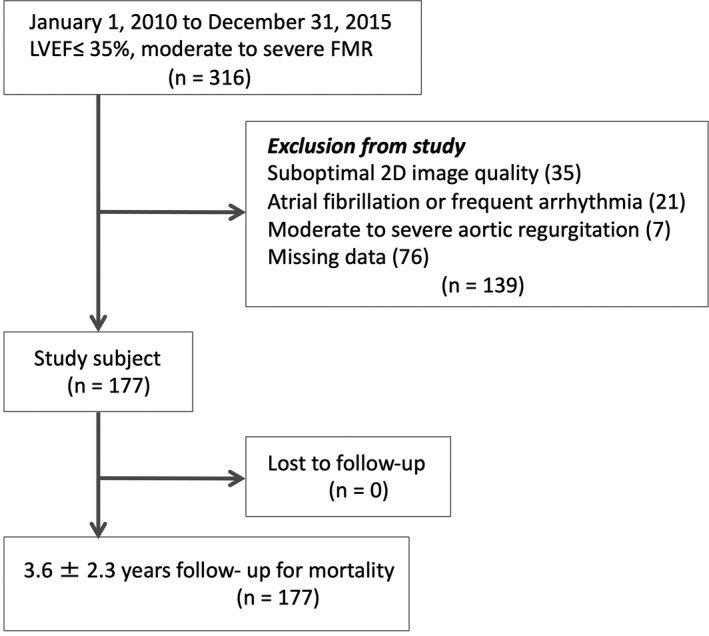
2D indicates 2‐dimensional; FMR, functional mitral regurgitation; and LVEF, left ventricular ejection fraction.
Echocardiography
All patients underwent a comprehensive echocardiogram as part of routine clinical care. Registered cardiac sonographers performed the echocardiograms using commercial ultrasound machines: Philips iE33 (Philips Medical Systems, Bothell, WA), Siemens SC2000 (Siemens Medical Solutions, Malvern, PA), and General Electric Vivid E9 (GE Medical Systems, Milwaukee, WI). Left ventricular end‐diastolic volume (LVEDV), left ventricular end‐systolic volume and LVEF were calculated using 2‐dimensional Simpson’s method.16 Transmitral E/A velocity ratio, the ratio of transmitral and mitral annular early diastolic velocities as E/e′, left atrial volume index, tricuspid annular plane systolic excursion, and tricuspid regurgitation peak gradient were measured according to the ASE guidelines.16 All echocardiographic data were stored in a workstation (Syngo, Siemens Medical USA, Malvern, PA) for offline measurement and analysis of EOA, Rvol, and regurgitant fraction (RF) by both volumetric and PISA methods.13 All measurements and analysis were performed blinded to the outcome of the patients. For the volumetric method, TSV is computed from LVEDV×LVEF, forward stroke volume is calculated by the Doppler method using the LV outflow tract area×velocity time integral of left ventricular outflow tract, and EOA was derived as (TSV–forward stroke volume)/velocity time integral of the MR jet. PISA was calculated in the standard fashion in accordance with ASE guidelines.13 The primary outcome was all‐cause death or heart transplantation. We followed the patients from 2010 to 2015 (mean, 3.6±2.3 years) and compared the EOA, Rvol and RF and outcome in patients with and without EOA ≥0.2 cm2 or Rvol ≥30 mL between the volumetric and PISA methods.
Statistical Analysis
Continuous data were presented as mean±SD or medians with the interquartile range. We performed the Kolmogorov‐Smirnov test to evaluate the assumption of normality. We compared echocardiographic factors between the volumetric and PISA methods using a paired t test for parametric data or the Mann‐Whitney U‐test for nonparametric data. The correlations between the volumetric and PISA methods were performed using Pearson’s correlation coefficient and Spearman’s rank correlation coefficient for parametric and nonparametric data. The correlation between EOA and LVEDV was assessed using linear regression analysis. We compared clinical outcome of patients with EOA ≥0.2 cm2 versus EOA <0.2 cm2 (or Rvol ≥30 mL versus Rvol <30 mL) as calculated by the PISA and volumetric methods using the Kaplan‐Meier log‐rank test. To analyze the impact of EOA on mortality risk, we performed Cox proportional hazards regression analysis for the group of patients with EOA ≥0.2 cm2 by the volumetric method, to those with EOA ≥0.2 cm2 by PISA. To assess the concordance of the risk, we analyzed Harrell’s concordance index. Interobserver variability of EOA and Rvol by both the volumetric and PISA methods were evaluated by intraclass correlation coefficients (ICC) analysis. Statistical analyses were performed with the use of the SPSS system (IBM, Chicago, IL) or SAS software (SAS Institute, Cary, NC).
Results
We identified 316 patients with an LVEF ≤35% and FMR; among them, 177 patients were evaluated by EOA, Rvol, and RF by both the volumetric and PISA methods. The primary reasons for patient exclusion were poor image quality, undetectable PISA radius, or arrhythmia. Patients’ characteristics are shown in Table 1; an ischemic cardiomyopathy was present in 61 (34.5%) patients with FMR. Mean LVEF was 25.2±7.7%, median LVEDV and LV end‐systolic volume were 186.0 mL and 135.5 mL. Median TSV and forward stroke volume obtained from the volumetric method were 45.9 mL and 27.6 mL.
Table 1.
Patient Characteristics
| Parameters | Values |
|---|---|
| Age, y | 58.9±13.3 |
| Male, n | 119 (67.2) |
| BSA, m2 | 1.89±0.28 |
| Hispanic, n | 39 (22.0) |
| Non‐Hispanic White, n | 84 (47.5) |
| Non‐Hispanic Black, n | 39 (22.0) |
| Non‐Hispanic Asian, n | 9 (5.1) |
| Non‐Hispanic Mix, n | 6 (3.4) |
| Nonischemic FMR, n | 116 (65.5) |
| Ischemic FMR, n | 61 (34.5) |
| LVEF, % | 25.2±7.7 |
| LVEDV, mL* | 186.0 (143.5–249.0) |
| LVESV, mL* | 135.5 (100.0–193.8) |
| E/A ratio* | 2.19 (1.53–2.68) |
| E/e′ ratio* | 15.2 (11.5–20.6) |
| LAVI, mL/m2* | 47.8 (39.5–58.3) |
| TRPG, mm Hg | 34.1±12.2 |
| TAPSE, cm* | 1.49 (1.18–1.80) |
| TSV, mL* | 45.9 (36.3–57.3) |
| LVOT FSV, mL* | 27.6 (21.5–36.1) |
| EOA by volumetric method, cm2* | 0.11 (0.06–0.19) |
| Rvol by volumetric method, mL* | 16.9 (9.5–24.8) |
| RF by volumetric method, % | 36.9±16.8 |
| Pulmonary venous flow reversal, n | 39 (22.0) |
| MR jet reached LA posterior wall, n | 115 (64.9) |
| Wide MR jet or 2 MR jets, n | 119 (67.2) |
| EOA by PISA method, cm2* | 0.18 (0.10–0.29) |
| Rvol by PISA method, mL* | 24.7 (14.1–38.6) |
| RF by PISA method, % | 60.9±41.8 |
Values are number (%), mean±SD, or *median (interquartile range). BSA indicates body surface area; EOA, effective orifice area; FMR, functional mitral regurgitation; FSV, forward stroke volume; LAVI, left atrial volume index; LVEDV, left ventricular end‐diastolic volume; LVEF, left ventricular ejection fraction; LVESV, left ventricular end‐systolic volume; LVOT, left ventricular outflow tract; PISA, proximal isovelocity surface area; RF, regurgitant fraction; Rvol, regurgitant volume; TAPSE, tricuspid annular plane systolic excursion; and TRPG, tricuspid regurgitation peak gradient.
We compared the values of EOA, Rvol, and RF between the volumetric and PISA methods. Values were smaller by the volumetric method (EOA, 0.11 [0.06–0.19] cm2; Rvol, 16.9 [9.5–24.8] mL; and RF, 36.9±16.8%) than by PISA (0.18 [0.10–0.29] cm2; 24.7 [14.1–38.6] mL; and 60.9±41.8%, respectively; all P<0.001) (Figure 2). The correlation between values by the volumetric and PISA methods were r=0.314, 0.246, and −0.012 for EOA, Rvol, and RF, respectively (EOA, Rvol: P<0.01, RF: P=0.878). EOA by the volumetric method had a modest correlation with LVEDV (r=0.510; P<0.001), while EOA by PISA had weaker correlation with LVEDV (r=0.303; P<0.001) (Figure 3).
Figure 2. Comparison of the (A) effective orifice area, (B) regurgitant volume (Rvol), and (C) regurgitant fraction (RF) between the volumetric (VOL) and proximal isovelocity surface area (PISA) method.
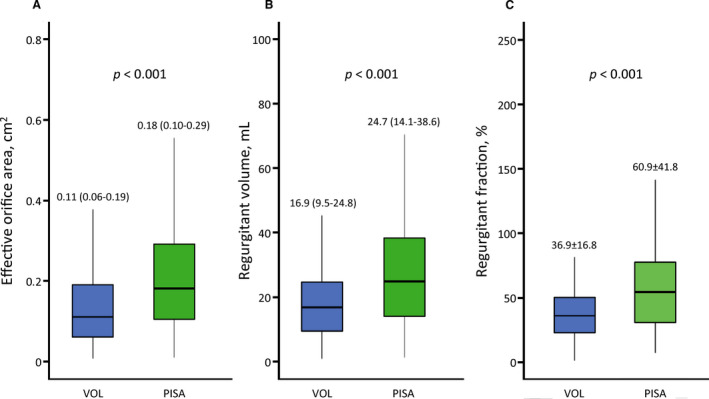
Figure 3. Correlation of effective orifice area (EOA) and left ventricular (LV) end‐diastolic volume.
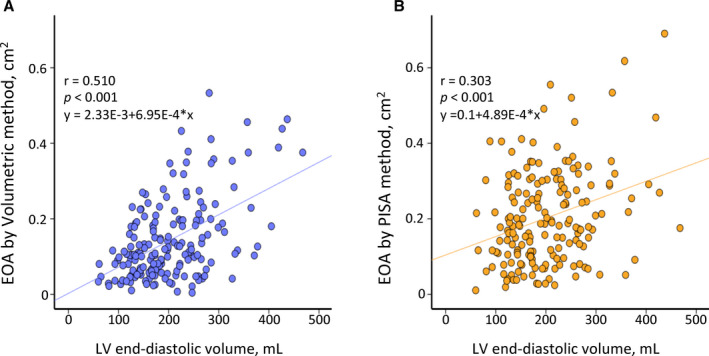
A, EOA obtained from volumetric method. B, EOA obtained from proximal isovelocity surface area (PISA) method.
During 3.6±2.3 years’ follow‐up, 49 patients died, 18 patients had heart transplantation, and 10 patients had mitral valve repair surgery.
The number of deaths/transplants in patients with EOA ≥0.2 cm2 or Rvol ≥30 mL when calculated by volumetric quantitation was 61% (23/38) and 59% (17/29), respectively. When calculated by the PISA method, the numbers were 41% (33/80) and 43% (29/68), respectively.
By the volumetric method, patients with EOA ≥0.2 cm2 or Rvol ≥30 mL had more adverse outcomes compared with those with EOA <0.2 cm2 (log rank P=0.003) or Rvol <30 mL (log rank P=0.004) (Figure 4, 5). By the PISA method; however, the outcome was similar for both the patients with and without EOA ≥0.2 cm2 (log rank P=0.984) or Rvol ≥30 mL (log rank P=0.544) (Figure 4, 5). We also analyzed the association between EOA, LVEDV, and mortality risk. Hazard ratio of EOA ≥0.2 cm2 by the volumetric method (hazard ratio, 2.411; 95% CI, 1.410–4.125; P=0.001) was statistically significant compared with EOA ≥0.2 cm2 by the PISA method (hazard ratio, 1.018; 95% CI, 0.625–1.658; P=0.942) (Table 2).
Figure 4. Outcome in patients with and without effective orifice area (EOA) ≥0.2 cm2 by volumetric or proximal isovelocity surface area (PISA) method.
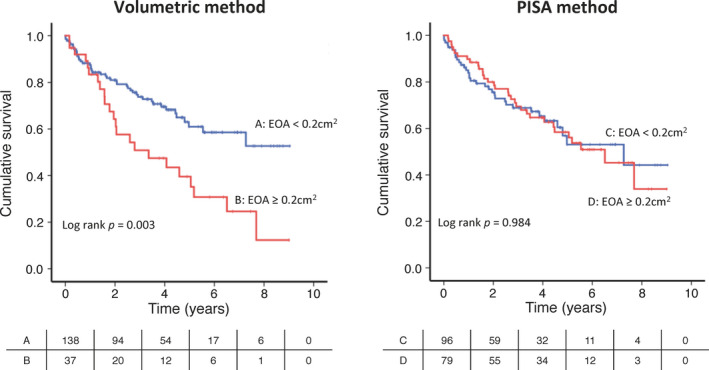
Figure 5. Outcome in patients with and without regurgitant volume (Rvol) ≥30 mL by volumetric or proximal isovelocity surface area (PISA) method.
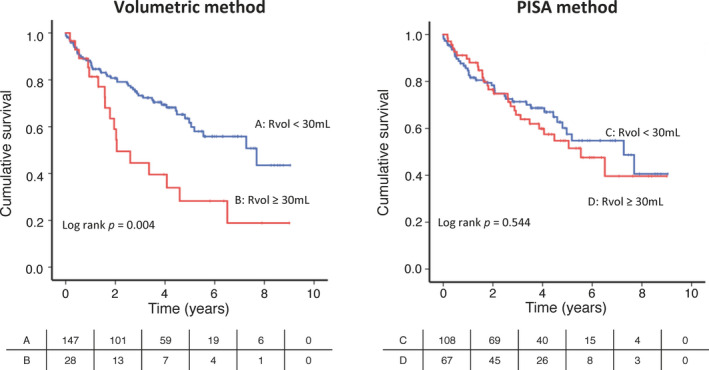
Table 2.
Cox Proportional Hazards Regression Analysis for Mortality
| HR | 95% CI | P Value | |
|---|---|---|---|
| EOA ≥0.2 cm2 by volumetric method | 2.411 | 1.410–4.125 | 0.001 |
| EOA ≥0.2 cm2 by PISA method | 1.018 | 0.625–1.658 | 0.942 |
EOA indicates effective orifice area; HR, hazard ratio; and PISA, proximal isovelocity surface area.
We performed receiver operating characteristic curve analysis of EOA and Rvol to determine the cutoff value for predicting death and heart transplant (Figure 6). The area under the curve of EOA and Rvol by the volumetric method were 0.62 and 0.61with P = 0.007 and 0.013, but by PISA were 0.56 and 0.54 with P = 0.193 and 0.425. Also, we analyzed the concordance index on the basis of the Cox model. The concordance index of EOA by the volumetric method (0.581) was higher than that by PISA (0.498) (volumetric versus PISA, P=0.247). Concordance index of Rvol by volumetric (0.573) was also higher than that by PISA (0.481) (volumetric versus PISA, P=0.179). Although there is no statistical difference of concordance index between PISA and volumetric method, concordance indexes of volumetric method were higher than those of PISA methods.
Figure 6. The receiver operating characteristic curves of effective orifice area (EOA) and regurgitant volume (Rvol) for predicting of death and heart transplant.
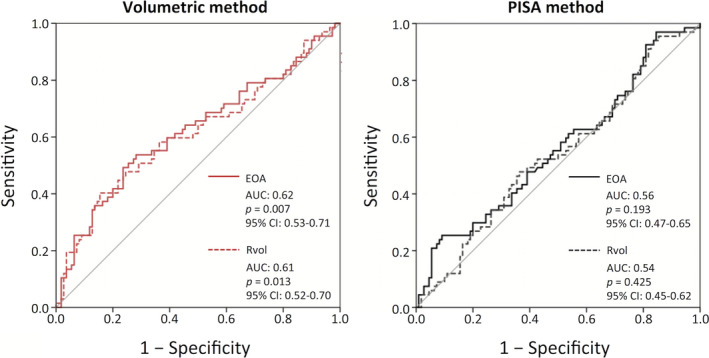
AUC indicates area under the curve.
Interobserver Variability
We analyzed ICC of EOA and Rvol by both the volumetric and PISA methods. Two investigators (S.I and C.H.) measured EOA and Rvol by both the volumetric and PISA methods in 15 cases. The ICC of EOA by volumetric or PISA method was 0.90 (95% CI, 0.660–0.970) and 0.78 (95% CI, 0.393–0.928), respectively. The ICC of Rvol was 0.87 (95% CI, 0.550–0.962) and 0.86 (95% CI, 0.606–0.956), respectively. The ICCs of volumetric were less variability than those of PISA method.
Discussion
We compared echocardiography measurements of the severity of functional mitral regurgitation by the PISA and volumetric methods and related them to the hard outcomes of all‐cause mortality and heart transplantation over a mean of 3.6 years. The major findings of our study were: values of FMR differed by the 2 methodologies; PISA yielded larger values of EOA and Rvol than volumetric; and importantly, high‐risk classification by volumetric was superior to that of PISA in predicting outcome. The differences in quantitation of FMR by the PISA and volumetric methods may be of significance in the management of patients with FMR.
PISA is the most common and useful method employed to quantify the severity of primary MR. However, the PISA method has several critical limitations, especially in patients with FMR or secondary MR. For example, PISA has many assumptions, such as that the mitral valve is a flat plane, the regurgitant orifice is central and infinitely small and that the PISA signal conforms to the geometry of a hemispheric shell. However, the mitral leaflet plane is clearly not flat, and of a greater significance, the PISA signal shape is often crescentic and nonhemispherical.8 The geometry of the proximal convergence zone in FMR is complex and often asymmetrical in shape.9 Although the PISA radius is measured at only 1 point in the cardiac cycle, the magnitude of the MR jet often varies during systole and frequently shows a biphasic temporal pattern.10 Usually, the PISA method is widely used for assessment for primary MR in patients with normal EF. Given many limitations by the PISA method in FMR, or secondary MR, it is uncertain if PISA is useful for assessment of severity in this patient population. In fact, we found that only the value by the volumetric method predicted worse outcome in patients with FMR. Prior studies have shown that the reproducibility of PISA measurements is modest and associated with suboptimal interobserver agreement.11 In our study, ICC of EOA by PISA was less than those by the volumetric method. The calculation of PISA radius may affect this variability. These factors clearly contribute to the difference between volumetric and PISA measurements. In this regard, our study found that 24 patients had Rvol greater than TSV (ie, RF >100%) by the PISA method. Our results suggest that PISA may overestimate EOA and Rvol in patients with FMR. Hagendorff et al17 also reported this pitfall of the PISA method for EOA and Rvol measurements.
There are 2 approaches for calculation of TSV by volumetric methods. One is the Doppler method comparing the mitral inflow to the aortic outflow calculated as the product of cross‐sectional area and integrated velocity; the other is Simpson’s method. In the former, mitral annulus geometry, sample volume position and angulation, and the precision of pulsed Doppler tracing can all affect the accuracy of TSV as derived by mitral inflow.18, 19 These variables can also affect measurement of aortic outflow. TSV by Simpson’s method is derived as LVEDV–LV end‐systolic volume or LVEDV×LVEF, and has been shown to have a good correlation with similar measurements by cardiovascular magnetic resonance imaging (CMR).20 Thus, we used Simpson’s rule to calculate Rvol as TSV (LVEDV×LVEF)–forward stroke volume. It has been shown that LV volumes obtained from 2‐dimensional echocardiography underestimate those obtained from CMR and 3‐dimensional echocardiography in patients with normal LVEF.21, 22 Accordingly, while both volumetric methods are subject to limitation of measurement precision, the number of potential variables appear a bit less with Simpson’s approach, and that was chosen as the volumetric technique for this study.
Uretsky et al23 compared Rvol between the PISA method by echocardiography and CMR assay by volumes. In agreement with our findings, they determined that Rvol obtained by PISA was larger than that by CMR. They included degenerative and flail mitral regurgitation, only 18% of subjects had FMR. Lopez‐Mattei et al24 compared Rvol between a volumetric method using transmitral flow by echocardiography and CMR. They found statistically significant discrepancies between the 2 methods, although no systematic overestimation existed. LVEF of both studies varied widely. In our study, LVEF/stroke volume was very low, and we included only moderate to severe FMR. Direct comparison of our study with theirs is complicated by differences in MR, cause of FMR, calculation method, characteristics of study population such as LVEF, and, of course, comparison standard.
Severe MR is defined as EOA ≥0.4 cm2, Rvol ≥60 mL, and RF ≥50% in the ASE guideline.13 Although the European Society of Cardiology guideline is similar to that of ASE for patients with primary MR,25 for patients with FMR they state that EOA ≥0.2 cm2 and Rvol ≥30 mL is the threshold for increased risk of cardiac events.13, 25, 26 LV function is impaired and cardiac output is reduced in patients with FMR, so regurgitation of even lesser degree than severe by ASE criteria may be sufficient to affect patient outcome. In fact, although our subjects were diagnosed as having moderate or severe MR by virtue of a large vena contracta or jet area or the presence of pulmonary vein flow reversal, most did not yield a calculated EOA ≥0.4 cm2 or Rvol ≥60 mL. The outcomes did not differ in patients with and without EOA ≥0.2 cm2 by PISA in our study, consistent with the findings of Patel et al.27 On the other hand, Rossi et al7 reported that the patients with EOA ≥0.2 cm2 by PISA did have adverse outcomes. Ischemic cardiomyopathy of FMR is an independent predictor of cardiovascular death,28 and the prevalence of ischemic FMR in our study (35%) may explain the variant findings of Rossi (62%).
The most important finding of our study was that patients with values for EOA and Rvol that met European Society of Cardiology criteria for increased risk by volumetric quantitation did have a reduced transplant‐free survival, while those by PISA did not. The explanation for this disparity remains uncertain. While PISA has many limitations in the precision of measurement of EOA and Rvol, the volumetric technique also has imperfections. Unfortunately, we do not have an independent standard by which to assess the relative accuracy of the measurements by the 2 techniques. However, the fact that a number of patients had Rvol greater than TSV by PISA supports the overestimation of measurements by this method. By virtue of the inclusion of LV volumes and EF in its algorithm, the volumetric method is more subject to the influence of LV dysfunction than is PISA. The potential influence of LV function upon FMR assessment may contribute to the better prognostic performance of volumetric quantitation. Perhaps the most likely explanation for the lesser prediction of outcome by PISA is the fact that the method appears to overestimate metrics for the severity of FMR. Values for EOA and Rvol were substantially higher by PISA than the volumetric method, likely related to the lack of hemispheric geometry of the PISA signal. It is likely that many patients with low‐risk FMR were included in the high‐risk group by this method. The inclusion of lower‐risk patients in the high‐risk category would, of course, blunt the prognostic accuracy of the PISA method. We found that values for EOA, Rvol, and RF by the volumetric method did not show a good correlation with those by PISA. Thus, not only did these 2 methods differ in quantitative metrics, but they also lacked correlation.
Patients with moderate and severe FMR had worse outcome than those with mild or no FMR.29 Two recent studies yielded divergent results as to the benefit of interventional therapy.14, 15 It is likely that the relative risks of the patients included in the studies played a role in the different results. Therefore, accurate risk stratification will be of particular importance for patients with FMR with severe LV dysfunction.
Limitations
This is a single‐center study in a group of patients with severe LV dysfunction (LVEF ≤35%). Our findings may not apply to patients with FMR with a lesser degree of LV dysfunction. In addition to patients with severe FMR, our study also included patients with moderate FMR who did not meet severe criteria by echocardiography (EOA ≥0.2 cm2 or Rvol ≥30 mL). In our study, TSV and forward stroke volume were low, which likely reflects severe LV dysfunction. Also, we did not compare outcome according to RF. Currently, 3‐dimensional echocardiographic software enables the assessment and quantification of complex MR with multiple and eccentric jets.30, 31 However, our study was retrospective, we did not have available 3‐dimensional echocardiograms, computed tomography, or magnetic resonance imaging, which was not then and is not now routinely performed in these patients. However, we planned the analysis and reviewed the echocardiographic data prospectively. We did not take into account comorbidities or the therapy applied since each patient served as their own control. We recognize that measurement of LV volumes and EF by 2‐dimensional echocardiography may underestimate TSV compared with angiography.
Conclusions
Measures of the severity of FMR by echocardiography or any other modality are of greatest value in assessing prognosis and guiding therapy. With the advent of evidence that catheter intervention is of value in certain patients with FMR,14, 15 accurate methods to not only assess the severity of FMR but also predict outcome are of great clinical value. Echocardiography is an excellent modality to quantitate FMR and follow its progression. Our data indicate that traditional ultrasound metrics of MR, including EOA and Rvol, can be of value in predicting risk of mortality or heart transplant if derived by a volumetric method. In addition, this volumetric method is superior to the more commonly applied PISA technique. These data may be of value in the management of patients with functional MR.
Sources of Funding
None.
Disclosures
None.
Acknowledgments
We thank all registered cardiac sonographers at the University of California, San Diego, for their efforts.
(J Am Heart Assoc. 2021;10:e018553. DOI: 10.1161/JAHA.120.018553.)
For Sources of Funding and Disclosures, see page 9.
See Editorial by Hu and Chen
References
- 1.Saito K, Okura H, Watanabe N, Obase K, Tamada T, Koyama T, Hayashida A, Neishi Y, Kawamoto T, Yoshida K. Influence of chronic tethering of the mitral valve on mitral leaflet size and coaptation in functional mitral regurgitation. JACC Cardiovasc Imaging. 2012;5:337–345. DOI: 10.1016/j.jcmg.2011.10.004. [DOI] [PubMed] [Google Scholar]
- 2.Silbiger JJ. Mechanistic insights into ischemic mitral regurgitation: echocardiographic and surgical implications. J Am Soc Echocardiogr. 2011;24:707–719. DOI: 10.1016/j.echo.2011.04.001. [DOI] [PubMed] [Google Scholar]
- 3.Daimon M, Saracino G, Fukuda S, Koyama Y, Kwan J, Song JM, Agler DA, Gillinov AM, Thomas JD, Shiota T. Dynamic change of mitral annular geometry and motion in ischemic mitral regurgitation assessed by a computerized 3D echo method. Echocardiography. 2010;27:1069–1077. DOI: 10.1111/j.1540-8175.2010.01204.x. [DOI] [PubMed] [Google Scholar]
- 4.Agricola E, Oppizzi M, Maisano F, De Bonis M, Schinkel AF, Torracca L, Margonato A, Melisurgo G, Alfieri O. Echocardiographic classification of chronic ischemic mitral regurgitation caused by restricted motion according to tethering pattern. Eur J Echocardiogr. 2004;5:326–334. DOI: 10.1016/j.euje.2004.03.001. [DOI] [PubMed] [Google Scholar]
- 5.Ray S. The echocardiographic assessment of functional mitral regurgitation. Eur J Echocardiogr. 2010;11:i11–i17. DOI: 10.1093/ejechocard/jeq121. [DOI] [PubMed] [Google Scholar]
- 6.Agricola E, Oppizzi M, Pisani M, Meris A, Maisano F, Margonato A. Ischemic mitral regurgitation: mechanisms and echocardiographic classification. Eur J Echocardiogr. 2008;9:207–221. DOI: 10.1016/j.euje.2007.03.034. [DOI] [PubMed] [Google Scholar]
- 7.Rossi A, Dini FL, Faggiano P, Agricola E, Cicoira M, Frattini S, Simioniuc A, Gullace M, Ghio S, Enriquez‐Sarano M, et al. Independent prognostic value of functional mitral regurgitation in patients with heart failure. A quantitative analysis of 1256 patients with ischaemic and non‐ischaemic dilated cardiomyopathy. Heart. 2011;97:1675–1680. DOI: 10.1136/hrt.2011.225789. [DOI] [PubMed] [Google Scholar]
- 8.Grayburn PA, Weissman NJ, Zamorano JL. Quantitation of mitral regurgitation. Circulation. 2012;126:2005–2017. DOI: 10.1161/CIRCULATIONAHA.112.121590. [DOI] [PubMed] [Google Scholar]
- 9.Marsan NA, Westenberg JJ, Ypenburg C, Delgado V, van Bommel RJ, Roes SD, Nucifora G, van der Geest RJ, de Roos A, Reiber JC, et al. Quantification of functional mitral regurgitation by real‐time 3D echocardiography: comparison with 3D velocity‐encoded cardiac magnetic resonance. JACC Cardiovasc Imaging. 2009;2:1245–1252. DOI: 10.1016/j.jcmg.2009.07.006. [DOI] [PubMed] [Google Scholar]
- 10.Hung J, Otsuji Y, Handschumacher MD, Schwammenthal E, Levine RA. Mechanism of dynamic regurgitant orifice area variation in functional mitral regurgitation. J Am Coll Cardiol. 1999;33:538–545. DOI: 10.1016/S0735-1097(98)00570-1. [DOI] [PubMed] [Google Scholar]
- 11.Biner S, Rafique A, Rafii F, Tolstrup K, Noorani O, Shiota T, Gurudevan S, Siegel RJ. Reproducibility of proximal isovelocity surface area, vena contracta, and regurgitant jet area for assessment of mitral regurgitation severity. JACC Cardiovasc Imaging. 2010;3:235–243. DOI: 10.1016/j.jcmg.2009.09.029. [DOI] [PubMed] [Google Scholar]
- 12.Stewart WJ, Currie PJ, Salcedo EE, Lytle BW, Gill CC, Schiavone WA, Agler DA, Cosgrove DM. Intraoperative Doppler color flow mapping for decision‐making in valve repair for mitral regurgitation. Technique and results in 100 patients. Circulation. 1990;81:556–566. DOI: 10.1161/01.CIR.81.2.556. [DOI] [PubMed] [Google Scholar]
- 13.Zoghbi WA, Adams D, Bonow RO, Enriquez‐Sarano M, Foster E, Grayburn PA, Hahn RT, Han Y, Hung J, Lang RM, et al. Recommendations for noninvasive evaluation of native valvular regurgitation: a report from the American Society of Echocardiography developed in collaboration with the Society for Cardiovascular Magnetic Resonance. J Am Soc Echocardiogr. 2017;30:303–371. DOI: 10.1016/j.echo.2017.01.007. [DOI] [PubMed] [Google Scholar]
- 14.Stone GW, Lindenfeld J, Abraham WT, Kar S, Lim DS, Mishell JM, Whisenant B, Grayburn PA, Rinaldi M, Kapadia SR, et al.; COAPT Investigators . Transcatheter mitral‐valve repair in patients with heart failure. N Engl J Med. 2018;379:2307–2318. DOI: 10.1056/NEJMoa1806640. [DOI] [PubMed] [Google Scholar]
- 15.Obadia J‐F, Messika‐Zeitoun D, Leurent G, Iung B, Bonnet G, Piriou N, Lefèvre T, Piot C, Rouleau F, Carrié D, et al.; MITRA‐FR Investigators . Percutaneous repair or medical treatment for secondary mitral regurgitation. N Engl J Med. 2018;379:2297–2306. DOI: 10.1056/NEJMoa1805374. [DOI] [PubMed] [Google Scholar]
- 16.Lang RM, Badano LP, Mor‐Avi V, Afilalo J, Armstrong A, Ernande L, Flachskampf FA, Foster E, Goldstein SA, Kuznetsova T, et al. Recommendations for cardiac chamber quantification by echocardiography in adults: an update from the American Society of Echocardiography and the European Association of Cardiovascular Imaging. J Am Soc Echocardiogr. 2015;28:1–39. DOI: 10.1016/j.echo.2014.10.003. [DOI] [PubMed] [Google Scholar]
- 17.Hagendorff A, Doenst T, Falk V. Echocardiographic assessment of functional mitral regurgitation: opening Pandora’s box? ESC Heart Fail. 2019;6:678–685. DOI: 10.1002/ehf2.12491. [DOI] [PMC free article] [PubMed] [Google Scholar]
- 18.Lewis JF, Kuo LC, Nelson JG, Limacher MC, Quinones MA. Pulsed Doppler echocardiographic determination of stroke volume and cardiac output: clinical validation of two new methods using the apical window. Circulation. 1984;70:425–431. DOI: 10.1161/01.CIR.70.3.425. [DOI] [PubMed] [Google Scholar]
- 19.Rokey R, Sterling LL, Zoghbi WA, Sartori MP, Limacher MC, Kuo LC, Quinones MA. Determination of regurgitant fraction in isolated mitral or aortic regurgitation by pulsed Doppler two‐dimensional echocardiography. J Am Coll Cardiol. 1986;7:1273–1278. DOI: 10.1016/S0735-1097(86)80146-2. [DOI] [PubMed] [Google Scholar]
- 20.Aurich M, André F, Keller M, Greiner S, Hess A, Buss SJ, Katus HA, Mereles D. Assessment of left ventricular volumes with echocardiography and cardiac magnetic resonance imaging: real‐life evaluation of standard versus new semiautomatic methods. J Am Soc Echocardiogr. 2014;27:1017–1024. DOI: 10.1016/j.echo.2014.07.006. [DOI] [PubMed] [Google Scholar]
- 21.Dorosz JL, Lezotte DC, Weitzenkamp DA, Allen LA, Salcedo EE. Performance of 3‐dimensional echocardiography in measuring left ventricular volumes and ejection fraction: a systematic review and meta‐analysis. J Am Coll Cardiol. 2012;59:1799–1808. DOI: 10.1016/j.jacc.2012.01.037. [DOI] [PMC free article] [PubMed] [Google Scholar]
- 22.Hoffmann R, Barletta G, von Bardeleben S, Vanoverschelde JL, Kasprzak J, Greis C, Becher H. Analysis of left ventricular volumes and function: a multicenter comparison of cardiac magnetic resonance imaging, cine ventriculography, and unenhanced and contrast‐enhanced two‐dimensional and three‐dimensional echocardiography. J Am Soc Echocardiogr. 2014;27:292–301. DOI: 10.1016/j.echo.2013.12.005. [DOI] [PubMed] [Google Scholar]
- 23.Uretsky S, Gillam L, Lang R, Chaudhry FA, Argulian E, Supariwala A, Gurram S, Jain K, Subero M, Jang JJ, et al. Discordance between echocardiography and MRI in the assessment of mitral regurgitation severity: a prospective multicenter trial. J Am Coll Cardiol. 2015;65:1078–1088. DOI: 10.1016/j.jacc.2014.12.047. [DOI] [PubMed] [Google Scholar]
- 24.Lopez‐Mattei JC, Ibrahim H, Shaikh KA, Little SH, Shah DJ, Maragiannis D, Zoghbi WA. Comparative assessment of mitral regurgitation severity by transthoracic echocardiography and cardiac magnetic resonance using an integrative and quantitative approach. Am J Cardiol. 2016;117:264–270. DOI: 10.1016/j.amjcard.2015.10.045. [DOI] [PubMed] [Google Scholar]
- 25.Joint Task Force on the Management of Valvular Heart Disease of the European Society of Cardiology (ESC); European Association for Cardio‐Thoracic Surgery (EACTS) . Vahanian A, Alfieri O, Andreotti F, Antunes MJ, Barón‐Esquivias G, Baumgartner H, Borger MA, Carrel TP, De Bonis M, et al. Guidelines on the management of valvular heart disease (version 2012). Eur Heart J. 2012;33:2451‐2496. DOI: 10.1093/eurheartj/ehs109. [DOI] [PubMed] [Google Scholar]
- 26.Nishimura RA, Otto CM, Bonow RO, Carabello BA, Erwin JP, Guyton RA, O'Gara PT, Ruiz CE, Skubas NJ, Sorajja P, et al. AHA/ACC guideline for the management of patients with valvular heart disease: executive summary: a report of the American College of Cardiology/American Heart Association Task Force on Practice Guidelines. J Am Coll Cardiol. 2014;2014(63):2438–2488. DOI: 10.1016/j.jacc.2014.02.537. [DOI] [PubMed] [Google Scholar]
- 27.Patel JB, Borgeson DD, Barnes ME, Rihal CS, Daly RC, Redfield MM. Mitral regurgitation in patients with advanced systolic heart failure. J Card Fail. 2004;10:285–291. DOI: 10.1016/j.cardfail.2003.12.006. [DOI] [PubMed] [Google Scholar]
- 28.Bursi F, Enriquez‐Sarano M, Nkomo VT, Jacobsen SJ, Weston SA, Meverden RA, Roger VL. Heart failure and death after myocardial infarction in the community: the emerging role of mitral regurgitation. Circulation. 2005;111:295–301. DOI: 10.1161/01.CIR.0000151097.30779.04. [DOI] [PubMed] [Google Scholar]
- 29.Asgar AW, Mack MJ, Stone GW. Secondary mitral regurgitation in heart failure: pathophysiology, prognosis, and therapeutic considerations. J Am Coll Cardiol. 2015;65:1231–1248. DOI: 10.1016/j.jacc.2015.02.009. [DOI] [PubMed] [Google Scholar]
- 30.Militaru S, Bonnefous O, Hami K, Langet H, Houard L, Allaire S, Pouleur AC, Dianis S, This A, Beauloye C, et al. Validation of semiautomated quantification of mitral valve regurgitation by three‐dimensional color Doppler transesophageal echocardiography. J Am Soc Echocardiogr. 2020;33:342–354. DOI: 10.1016/j.echo.2019.10.013. [DOI] [PubMed] [Google Scholar]
- 31.Cavalcante JL, Kusunose K, Obuchowski NA, Jellis C, Griffin BP, Flamm SD, Kwon DH. Prognostic impact of ischemic mitral regurgitation severity and myocardial infarct quantification by cardiovascular magnetic resonance. JACC Cardiovasc Imaging. 2020;13:1489–1501. DOI: 10.1016/j.jcmg.2019.11.008. [DOI] [PubMed] [Google Scholar]


