

Abstract
Background
Men and women are labeled as obese on the basis of a body mass index (BMI) using the same criterion despite known differences in their fat distributions. Subcutaneous adipose tissue and visceral adipose tissue (VAT), as measured by computed tomography, are advanced measures of obesity that closely correlate with cardiometabolic risk independent of BMI. However, it remains unknown whether prognostic significance of anthropometric measures of adiposity versus VAT varies in men versus women.
Methods and Results
In 3482 FHS (Framingham Heart Study) participants (48.1% women; mean age, 50.8±10.3 years), we tested the associations of computed tomography–based versus anthropometric measures of fat with cardiometabolic and cardiovascular disease (CVD) risk. Mean follow‐up was 12.7±2.1 years. In men, VAT, as compared with BMI, had a similar strength of association with incident cardiometabolic risk factors (eg, adjusted odds ratio [OR], 2.36 [95% CI, 1.84–3.04] versus 2.66 [95% CI, 2.04–3.47] for diabetes mellitus) and CVD events (eg, adjusted hazard ratio [HR], 1.32 [95% CI, 0.97–1.80] versus 1.74 [95% CI, 1.14–2.65] for CVD death). In women, however, VAT, when compared with BMI, conferred a markedly greater association with incident cardiometabolic risk factors (eg, adjusted OR, 4.51 [95% CI, 3.13–6.50] versus 2.33 [95% CI, 1.88–3.04] for diabetes mellitus) as well as CVD events (eg, adjusted HR, 1.85 [95% CI, 1.26–2.71] versus 1.19 [95% CI, 1.01–1.40] for CVD death).
Conclusions
Anthropometric measures of obesity, including waist circumference and BMI, adequately capture VAT‐associated cardiometabolic and cardiovascular risk in men but not in women. In women, abdominal computed tomography–based VAT measures permit more precise assessment of obesity‐associated cardiometabolic and cardiovascular risk.
Keywords: body mass index, cardiovascular risk, metabolic health, obesity, sex differences, visceral adipose tissue
Subject Categories: Obesity, Risk Factors, Women, Cardiovascular Disease
Nonstandard Abbreviations and Acronyms
- FHS
Framingham Heart Study
- SAT
subcutaneous adipose tissue
- VAT
visceral adipose tissue
- WC
waist circumference
Clinical Perspective
What Is New?
Anthropometric measures of obesity, including waist circumference and body mass index, as universal classifiers of obesity, and the amount of visceral adipose tissue (VAT) on computed tomography are associated with cardiometabolic and cardiovascular risk in men and women.
Waist circumference and body mass index adequately capture VAT‐associated cardiometabolic and cardiovascular risk in men but not in women.
In women, abdominal computed tomography–based VAT measures permit more precise assessment of obesity‐associated cardiometabolic and cardiovascular risk.
What Are the Clinical Implications?
Compared with anthropometric measures of obesity, quantification of VAT on computed tomography allows more accurate assessment of obesity‐associated cardiometabolic and cardiovascular risk in women.
In men, body mass index shows a similar strength of association with cardiometabolic and cardiovascular risk when compared with VAT.
Sex‐specific approaches for cardiometabolic risk assessment, including standardization of computed tomography–based measures of fat, are warranted.
It is estimated that 50% of both US men and women are expected to be labeled as obese by the year 2030.1 This is concerning as there is strong evidence on the association of obesity with increased cardiometabolic and cardiovascular risk.2, 3 In addition, obesity is a risk factor for gallbladder disease, osteoarthritis, sleep apnea, chronic respiratory diseases, and some cancers.4
Body mass index (BMI) and waist circumference (WC) are widely available anthropometric measures of overall and central adiposity, respectively, that are used to define who is obese.5, 6 Despite known sex‐related differences in body fat distribution, the same BMI cutoff of ≥30 kg/m2 is used to define obesity for both men and women.7, 8 In contrast, sex‐specific thresholds are used for WC, a surrogate of excess abdominal fat linked especially with diabetes mellitus,9, 10 to define upper limits of normal, with higher normal values in men compared with women.9
Nevertheless, neither the current 2013 American Heart Association/American College of Cardiology guidelines on the management of obesity nor the 2019 American Heart Association/American College of Cardiology Guideline on the Primary Prevention of Cardiovascular Disease provides sex‐specific guidance. Both recommend measurement of WC in addition to BMI in individuals with a BMI ≥25 kg/m2 5 or BMI <35 kg/m2,6 respectively, in both men and women.
In contrast to anthropometric measures, computed tomography (CT) can directly visualize and quantify adipose tissue components, including visceral adipose tissue (VAT).11, 12, 13 Among imaging parameters of adiposity, VAT is by far the strongest predictor of an adverse cardiovascular risk profile,12, 14, 15 and predicts cardiometabolic and cardiovascular risk even after adjustment for BMI in both men and women.11, 16, 17 The relationship between increased VAT and increased cardiovascular risk is believed to be mediated in part by higher levels of proinflammatory cytokines with increasing VAT.18, 19 Moreover, CT data have also demonstrated significant sex‐specific differences in body fat distribution. For instance, women have significantly higher subcutaneous adipose tissue (SAT) volumes, and lower VAT volumes, when compared with men; these sex‐related differences are not captured by BMI or WC. However, to our knowledge, the strength of associations of VAT, SAT, and VAT/SAT ratio with cardiometabolic and cardiovascular disease (CVD) risk has not been directly compared with BMI and WC.
Thus, the objective of our analysis was to determine whether anthropometric measures of obesity, including BMI and WC, adequately represent VAT‐associated cardiometabolic and CVD risk similarly in men versus women.
Accordingly, we assessed sex‐specific differences in the associations of BMI, WC, VAT, SAT, and VAT/SAT ratio with prevalent metabolic health status, incident cardiometabolic risk factors, and CVD events in the FHS (Framingham Heart Study).
Methods
Anonymized data and materials from the Framingham’s Offspring and Third‐Generation examination data are available through the National Heart, Lung, and Blood Institute’s BioLINCC and can be accessed by qualified investigators with approval. Requests for Framingham data should follow the process outlined in BioLINCC (https://biolincc.nhlbi.nih.gov/home/).
Study Sample
Participants were drawn from the FHS, including the Offspring and Third‐Generation cohorts, who underwent routine thoracic and abdominal multidetector CT between 2002 and 2005.14 Of the 3529 participants in the multidetector CT substudy, 47 were excluded because of missing data on metabolic status. The sample size for this analysis, hence, comprised 3482 eligible individuals. Institutional review board approval was obtained before the study, and all subjects gave informed consent.
Anthropometric Measures of Fat
BMI was calculated as body mass in kilograms divided by the square of body height in meters. WC was assessed at the level of the umbilicus and recorded as previously described.20
Adipose Tissue Imaging and Quantification
The technical aspects of adipose tissue assessment have been extensively described elsewhere.14, 21 In short, participants underwent 8‐slice multidetector CT imaging of the abdomen, and 25 continuous 5‐mm‐thick slices were recorded, covering 125 mm above the level of S1 vertebral level. VAT and SAT volumes were quantified using dedicated software (Aquarius 3D Workstation; TeraRecon Inc, San Mateo, CA) by identifying fat using a Hounsfield unit–based threshold of −195 to −45 Hounsfield units (window center, −120 Hounsfield units), as previously described.14, 21 Excellent intraclass correlation coefficients (>0.99) for interreader comparisons have been previously reported for both VAT and SAT.14, 21
Presence of nonalcoholic fatty liver disease on CT was defined as previously described.22
Definition of Metabolic Health Status
We defined being metabolically unhealthy as the presence of ≥2 of the “National Cholesterol Education Program—Adult Treatment Panel III” criteria. These include (1) high triglycerides (≥1.69 mmol/L [≥150 mg/dL]) or use of lipid‐lowering drugs, (2) elevated systolic blood pressure (≥130 mm Hg) or diastolic blood pressure (≥85 mm Hg) or use of antihypertensive drugs, (3) elevated blood glucose (≥5.6 mmol/L [≥100 mg/dL]) or any use of medications for diabetes mellitus (insulin or oral glucose‐lowering medications), and (4) low high‐density lipoprotein cholesterol (<1.03 mmol/L [<40 mg/dL] in men and <1.29 mmol/L [<50 mg/dL] in women). We excluded WC as part of the National Cholesterol Education Program—Adult Treatment Panel III criteria because of previously reported collinearity with BMI,23 and the nature of this study to compare different measures of obesity with each other, including WC.
Follow‐Up and Outcome
Cardiometabolic risk factors were assessed during clinical follow‐up visits between 2005 and 2011, resulting in similar observation periods for participants in the Offspring and Third‐Generation cohorts. Cardiometabolic risk factors included (1) incident hypertriglyceridemia, defined as high triglycerides (≥1.69 mmol/L [≥150 mg/dL]) or use of lipid‐lowering drugs, (2) hypertension, defined as systolic blood pressure ≥140 mm Hg or diastolic blood pressure ≥90 mm Hg, (3) diabetes mellitus, defined as a fasting plasma glucose level ≥126 mg/dL or treatment with either insulin or a hypoglycemic agent, and (4) low high‐density lipoprotein, defined as serum levels of <1.03 mmol/L (<40 mg/dL) in men and <1.29 mmol/L (<50 mg/dL) in women, or use of lipid‐lowering drugs.
We recorded CVD events during follow‐up, defining hard CVD as fatal or nonfatal myocardial infarction or fatal or nonfatal stroke, global CVD as hard CVD or angina, atherothrombotic infarction of brain, or intermittent claudication, and cardiovascular death as sudden or nonsudden coronary heart disease death or CVD death. Follow‐up for CVD events was available until end of 2016.
Statistical Analysis
We report mean and SD as well as total numbers and percentages for descriptive analyses. Comparisons between men and women were performed using the Student t‐test for continuous variables and the χ2 test or Fisher exact test for categorical variables.
Sex‐specific logistic regression analyses, adjusted for age and smoking, were performed to assess the cross‐sectional associations of measures of body fat (BMI, WC, VAT, SAT, and VAT/SAT ratio) and (1) prevalence of being metabolically unhealthy and prospective associations with (2) incident cardiometabolic risk factors (diabetes mellitus, hypertension, low high‐density lipoprotein, and hypertriglyceridemia). Cross‐sectional comparisons were performed at the baseline examination at the time of the CT. For incident cardiometabolic risk factors, only patients free of the specific cardiometabolic outcome variable were included.
In addition, we performed sex‐specific Cox‐regression analyses, adjusted for age and smoking, using global CVD, hard CVD, and cardiovascular death as separate end points.
To allow for better comparison between different measures of fat, adjusted odds ratios (ORs) and adjusted hazard ratios (HRs) are reported per a 1‐SD increase for each anthropometric or CT‐based adiposity measurement. In a post hoc step, we performed sex‐specific power calculations for key outcome analyses (BMI‐ and VAT‐associated risk for incident diabetes mellitus, hypertension, and global CVD). The level of significance was set to a 2‐sided P value of 0.05, and dedicated software was used for all analyses (SAS 9.4, Cary, NC).
Results
Baseline Characteristics
A total of 3482 participants were eligible for this investigation. The mean age was 50.8±10.3 years, and 48.1% of participants were women.
Baseline characteristics, including sex‐specific differences, are displayed in Table 1. Mean BMI and WC were significantly higher in men compared with women (28.5±4.6 kg/m2 and 39.8±5.3 inches versus 27.2±6.9 kg/m2 and 36.8±6.9 inches, respectively; P<0.0001 for all). Men were younger (49.6±10.6 versus 52.1±9.9 years; P<0.001) but had a less favorable cardiometabolic risk profile (P<0.05 for all baseline risk factors), with the exception of smoking status (P=0.34).
Table 1.
Baseline Characteristics for All Participants and Stratified by Sex
| Characteristics |
All Participants (n=3482; 100.00%) |
Men (n=1807; 51.90%) |
Women (n=1675; 48.10%) |
P Value |
|---|---|---|---|---|
| Age, y | 50.79 (10.33) | 49.59 (10.60) | 52.08 (9.86) | <0.0001 |
| BMI, kg/m2 | 27.85 (5.88) | 28.47 (4.61) | 27.18 (6.94) | <0.0001 |
| Waist circumference, inches | 38.38 (6.29) | 39.82 (5.28) | 36.84 (6.89) | <0.0001 |
| Hypertension, n (%) | 1022 (29.35) | 574 (31.77) | 448 (26.75) | 0.0012 |
| Use of antihypertensive drugs, n (%) | 661 (18.98) | 352 (19.48) | 309 (18.45) | 0.4378 |
| Systolic blood pressure, mm Hg | 121.98 (17.59) | 123.40 (14.65) | 120.40 (20.19) | <0.0001 |
| Diastolic blood pressure, mm Hg | 76.59 (19.72) | 78.10 (9.07) | 74.96 (26.73) | <0.0001 |
| Diabetes mellitus, n (%) | 220 (6.32) | 129 (7.14) | 91 (5.43) | 0.0387 |
| Fasting glucose, mmol/L | 98.88 (19.95) | 101.80 (21.15) | 95.71 (18.06) | <0.0001 |
| Total cholesterol, mmol/L | 196.33 (35.32) | 194.80 (34.24) | 198.00 (36.40) | 0.0090 |
| HDL cholesterol, mmol/L | 53.29 (16.57) | 45.91 (12.44) | 61.26 (16.78) | <0.0001 |
| LDL cholesterol, mmol/L | 117.94 (31.51) | 121.70 (30.34) | 114.00 (32.24) | <0.0001 |
| Triglycerides, mmol/L | 128.04 (90.10) | 141.90 (104.90) | 113.00 (67.58) | <0.0001 |
| Use of lipid‐lowering drugs, n (%) | 489 (14.04) | 311 (17.21) | 178 (10.63) | <0.0001 |
| Metabolically unhealthy, n (%) | 1483 (42.59) | 950 (52.57) | 533 (31.82) | <0.0001 |
| History of CVD, n (%) | 112 (3.22) | 69 (3.82) | 43 (2.57) | 0.0365 |
| Current smoking, n (%) | 450 (12.92) | 243 (13.45) | 207 (12.36) | 0.3383 |
| No. of drinks per week | 5.11 (7.96) | 7.04 (9.69) | 3.04 (4.71) | <0.0001 |
| Framingham risk score | 0.09 (0.10) | 0.12 (0.11) | 0.06 (0.07) | <0.0001 |
| CT measures of fat | ||||
| VAT, cm3 | 1816.30 (1029.71) | 2236.70 (1016.70) | 1363.80 (833.30) | <0.0001 |
| SAT, cm3 | 2883.39 (1385.19) | 2637.70 (1203.90) | 3147 (1513.30) | <0.0001 |
| VAT/SAT ratio | 0.69 (0.39) | 0.91 (0.38) | 0.44 (0.21) | <0.0001 |
Data are given as mean (SD), unless otherwise indicated. BMI indicates body mass index; CT, computed tomography; CVD, cardiovascular disease; HDL, high‐density lipoprotein; LDL, low‐density lipoprotein; SAT, subcutaneous adipose tissue; and VAT, visceral adipose tissue.
On noncontrast CT, VAT was 1816±1030 mL, SAT was 2883±1385 mL, and VAT/SAT ratio was 0.69±0.39. As reported previously,14 significant differences for CT‐based measures of fat were observed between men and women. Men had higher amounts of VAT (2236±1017 versus 1364±833 mL; P<0.001) but lower amounts of SAT (2638±1204 versus 3147±1514 mL; P<0.001) compared with women.
Prevalence of Poor Metabolic Health
A total of 1483 (42.6%) were metabolically unhealthy at baseline (31.8% women versus 52.6% men; P<0.001). Figure 1 displays results of the logistic regression analyses, demonstrating the association of the different measures of adiposity with being metabolically unhealthy. We observed a significant sex interaction for VAT (P<0.0001) and VAT/SAT ratio (P<0.0001), but not for BMI, WC, and SAT (P>0.10 for all).
Figure 1. Sex‐specific association of anthropometric and computer tomography–derived measures of obesity with prevalent metabolic health status.

A, Sex‐specific association of body mass index (BMI), waist circumference (WC), and visceral adipose tissue (VAT), subcutaneous adipose tissue (SAT), and VAT/SAT ratio on computed tomography with prevalence of being metabolically unhealthy. Analyses are adjusted (Adj.) for age and smoking, and odds ratios (ORs) are given per 1‐SD increase of each measure of fat. B, The different strengths of association for BMI (gray) and VAT (black) with prevalence of being metabolically unhealthy are displayed for men and women separately.
In men, BMI (adjusted OR, 2.89 [95% CI, 2.47–3.39]) and WC (adjusted OR, 2.83 [95% CI, 2.41–3.32]) shared a similar magnitude of association with poor metabolic health compared with VAT (adjusted OR, 2.82 [95% CI, 2.46–3.25]). In women, this magnitude of association with poor metabolic health was markedly higher for VAT (adjusted OR, 5.10 [95% CI, 4.20–6.0]) and VAT/SAT ratio (adjusted OR, 4.20 [95% CI, 3.17–5.56]) compared with anthropometric measures (adjusted OR for BMI, 2.89 [95% CI, 2.52–3.32]; and adjusted OR for WC, 2.76 [95% CI, 2.40–3.17]).
We did not detect a significant sex interaction for the association between BMI (P=0.06) or VAT (P=0.14) with prevalence of nonalcoholic fatty liver disease.
Development of a Metabolically Unhealthy Phenotype
Of 1999 individuals who were metabolically healthy at baseline, 444 (49.32% women) developed a metabolically unhealthy phenotype during follow‐up. BMI, WC, and all CT measures of fat each was significantly associated with becoming metabolically unhealthy (Figure 2A). Similar to the associations with being metabolically unhealthy at baseline (Figure 1), VAT and VAT/SAT ratio had a markedly higher strength of association with becoming metabolically unhealthy in women (VAT: adjusted OR, 2.57 [95% CI, 2.09–3.14]) compared with BMI and WC (BMI: adjusted OR, 1.67 [95% CI, 1.45–1.91]). In men, however, VAT and BMI had a similar strength of association with developing a metabolically unhealthy phenotype (adjusted OR, 1.73 [95% CI, 1.46–2.05] and 1.78 [95% CI, 1.47–2.16], respectively).
Figure 2. Sex‐specific association of anthropometric and computer tomography–derived measures of obesity with becoming metabolically unhealthy.
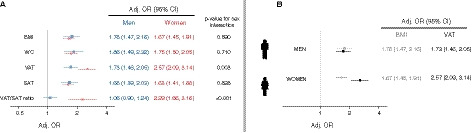
A, Sex‐specific adjusted odds ratios (Adj. ORs) demonstrating the different strengths of association for body mass index (BMI), waist circumference (WC), visceral adipose tissue (VAT), and subcutaneous adipose tissue (SAT) with becoming metabolically unhealthy. B, The different strengths of association for BMI (gray) and VAT (black) with becoming metabolically unhealthy are displayed for men and women separately.
Incident Cardiovascular Risk Factors
During clinical follow‐up visits between 2005 and 2011, 120 individuals developed new‐onset diabetes mellitus, 447 developed arterial hypertension, 130 had new‐onset low high‐density lipoprotein levels, and 486 developed hypertriglyceridemia.
By logistic regression analyses (Figure 3A), adjusted for age and smoking, anthropometric and CT‐based measures of body fat were associated with all incident cardiometabolic risk factors in both men and women.
Figure 3. Sex‐specific association of anthropometric and computer tomography–derived measures of obesity with incident cardiometabolic risk factors.

A, Sex‐specific association of body mass index (BMI), waist circumference (WC), and visceral adipose tissue (VAT), subcutaneous adipose tissue (SAT), and VAT/SAT ratio on computed tomography with incident cardiometabolic risk factors. Analyses are adjusted (Adj.) for age and smoking, and odds ratios (ORs) are given per 1‐SD increase of each measure of fat. B, The different strengths of association for BMI (gray) and VAT (black) with incident cardiometabolic risk factors are displayed for men and women separately. HDL indicates high‐density lipoprotein.
In men, BMI and WC had similar strengths of associations with incident risk factors compared with CT‐based measures, whereas in women, VAT and VAT/SAT ratio had stronger associations with all incident cardiometabolic risk factors compared with anthropometric measures (Figure 3B). The same was observed for fasting glucose levels as metric outcome (Table 2).
Table 2.
Association of Different Anthropometric and CT‐Based Measures of Fat, per 1‐SD Increase, With Fasting Glucose
| Association With Fasting Glucose | Standardized β (95% CI) per 1‐SD Increase | ||
|---|---|---|---|
| Men | Women | P for Sex Interaction | |
| BMI | 6.44 (5.24–7.64) | 5.01 (4.34–5.69) | 0.042 |
| WC | 5.32 (4.18–6.46) | 5.19 (4.45–5.94) | 0.900 |
| VAT | 4.24 (3.15–5.33) | 8.36 (7.29–9.44) | <0.001 |
| SAT | 3.10 (1.96–4.24) | 3.91 (3.13–4.68) | 0.231 |
| VAT/SAT ratio | 1.31 (0.20–2.42) | 6.77 (4.98–8.55) | <0.001 |
Data are adjusted for age and smoking. BMI indicates body mass index; CT, computed tomography; SAT, subcutaneous adipose tissue; VAT, visceral adipose tissue; and WC, waist circumference.
Incident Cardiovascular Events
During a mean follow‐up of 12.7±2.1 years, a total of 264 global CVD (119 [45.1%] in women), 138 hard CVD (57 [41.30%] in women), and 56 cardiovascular deaths (23 [41.1%] in women) occurred. A similar trend compared with incident cardiometabolic risk factor can be observed (Figure S1). Figure 4 illustrates differences of BMI and VAT and their association with cardiovascular events for men and women separately. In men, BMI had a slightly higher or similar magnitude of association with cardiovascular events compared with VAT. In women, however, VAT and VAT/SAT ratio were more closely related with cardiovascular events compared with anthropometric measures. Findings were consistent across all 3 cardiovascular end points.
Figure 4. Sex‐specific differences of body mass index and visceral adipose tissue with incident cardiovascular disease (CVD) events.
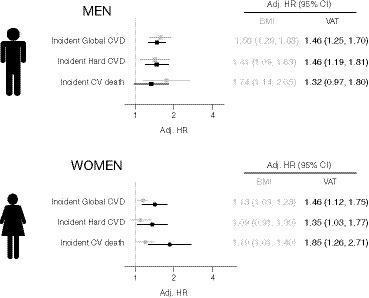
The different strengths of association for body mass index (BMI; gray) and visceral adipose tissue (VAT; black) with incident cardiovascular events are displayed for men and women separately. Adj. HR indicates adjusted hazard ratio; and CV, cardiovascular.
Post hoc power testing revealed a limited power for BMI for predicting incident CVD in women (24%) but not for all other sex‐specific main analyses (power >99% for BMI and VAT predicting incident diabetes mellitus, hypertension, and global CVD).
Discussion
Obesity is a worsening global epidemic that affects men and women similarly and is associated with markedly elevated CVD risk.2, 3 Anthropometric measures of obesity, including BMI and WC, although easily obtainable, inadequately reflect actual body fat tissue distribution and thus may fail to capture sex‐related differences in obesity‐related risk.10, 24 In contrast, CT‐based measures of fat, including VAT and SAT, directly quantify abdominal body fat compartments, such as VAT and SAT, and thus may represent more accurately any sex‐specific cardiometabolic risk associated with body fat distribution in men versus women. Our data from 3482 FHS participants undergoing abdominal CT strongly suggest the existence of significant sex‐related differences in the associations of BMI and WC versus VAT with poor metabolic health, incident cardiometabolic risk factors, and incident CVD events. In men, BMI and WC have similar magnitudes of associations with outcomes of interest compared with CT‐based measures of fat. In contrast, in women, VAT and VAT/SAT ratio have markedly stronger associations with cardiometabolic and CVD outcomes compared with BMI and WC.
Anthropometric Measures of Obesity and Cardiovascular Risk
Despite known sex‐related differences in adiposity and body fat distribution,25 BMI cutoff values to define an individual as obese are identical for men and women in major guidelines.8 Although sex‐specific thresholds for WC are established, WC is only recommended as an “add on” to BMI in patients with high BMI for risk stratification purposes because the incremental value of WC for predicting cardiometabolic and CVD risk over BMI is controversial.26, 27
There are hints in the literature that using sex‐specific thresholds for anthropometric measures to describe risk would be more optimal. For example, in an analysis of the UK biobank, a comparison of the strength of association with myocardial infarction between WC and BMI showed that a 1‐SD increase in WC conferred a greater excess risk for myocardial infarction in women (adjusted HR, 1.35 [95% CI, 1.28–1.42] versus 1.22 [95% CI, 1.17–1.28]) but not in men (adjusted HR, 1.28 [95% CI, 1.23–1.33] versus 1.28 [95% CI, 1.23–1.32]).28 We observed a similar trend for WC having a stronger association with all cardiovascular events compared with BMI in women but not in men. Nevertheless, it remains unclear if and to what extent BMI and WC account for sex‐related differences in body fat composition, including VAT, a strong predictor of cardiometabolic and CVD risk.10, 14
VAT and SAT
Tomographic techniques are the gold standard for assessing body fat composition and adipose tissue distribution, allowing for accurate quantification of both VAT and SAT.29 The biological differences between VAT and SAT are well known, with VAT being a stronger harbinger of inflammation, and cardiometabolic and cardiometabolic risk compared with SAT.11, 18, 30 There is substantial literature demonstrating strong associations of both VAT and VAT/SAT ratio with prevalent cardiometabolic risk factors,12, 14, 15 incident cardiometabolic risk factors,11 and CVD events.18 Moreover, most studies demonstrate that VAT and VAT/SAT ratio predict cardiometabolic risk independent of BMI.11, 12, 14, 15, 18
Interestingly, these studies found significant differences in body fat distribution between women and men; women have more SAT but less VAT compared with men.14
Moreover, in an analysis of the Jackson Heart Study including 1596 women and 881 men, VAT was more closely related to prevalent hypertension and diabetes mellitus in women compared with men (adjusted OR, 1.62 [95% CI, 1.4–1.9] and 1.82 [95% CI, 1.6–2.1] versus 1.55 [95% CI, 1.3–1.8] and 1.69 [95% CI, 1.4–2.0], respectively).31 From the present FHS cohort, Britton et al reported that VAT carried a higher risk for incident CVD in men compared with women (adjusted HR, 1.66 [95% CI, 1.16–2.39] versus 1.04 [95% CI, 0.65–1.65] per 1‐SD increase; P value for sex interaction 0.1).16 That study had fewer CVD events (90 versus 264) and a shorter follow‐up (5 versus 13 years) compared with the present analysis, and investigated VAT‐associated CVD risk when adjusted for cardiovascular risk factors and BMI. However, the strengths of associations of VAT, SAT, and VAT/SAT ratio with prevalent and incident cardiometabolic risk and cardiovascular events have not been directly compared with BMI and WC. Hence, it is unclear to what extent anthropometric measures reflect VAT‐associated cardiometabolic and CVD risk in men versus women. Our study augments current knowledge by directly comparing anthropometric and CT‐based measures of fat in terms of their sex‐specific strengths of associations with prevalent and incident cardiometabolic risk as well as CVD events. In men, higher WC and BMI had a similar adverse association with prevalent and incident cardiometabolic risk factors and cardiovascular events when compared with VAT. In women, however, VAT and VAT/SAT ratio were associated with a markedly greater risk for all outcomes compared with BMI and WC. Our observations cannot be explained by sex differences in the association between BMI and VAT with presence of nonalcoholic fatty liver disease.
Comparison of Anthropometric Measures and VAT in Previous Studies
Limited data are available directly comparing VAT with anthropometric measures in men versus women. In a cross‐sectional study including postmenopausal South African women, the discriminatory power of VAT (by dual‐energy x‐ray absorptiometry) for detecting metabolic syndrome was compared with anthropometric measures. In contrast to our study, the investigators reported that dual‐energy x‐ray absorptiometry–derived VAT and WC had similar discriminatory ability to detect metabolic syndrome, which was present in >50% of all study participants. However, that study is limited by its sample size (n=204), ORs per 1‐SD increase for VAT and WC were not reported, and longitudinal data were not evaluated.32 To our knowledge, our study is the first to compare comprehensively the strengths of associations with prevalent and incident cardiometabolic risk and cardiovascular events for CT‐derived measures of fat and anthropometric measures in men versus women.
Future Perspectives
A major limitation in the clinical integration of cross‐sectional abdominal obesity and fat distribution parameters, however, is a lack of standardization. For example, in the FHS, a stack of 25 continuous 5‐mm‐thick slices covering 125 mm above the vertebral level of S1 was used for VAT and SAT quantification.21 Others (eg, in the Jackson Heart Study) used 24 continuous 2.5‐mm‐thick slices covering 60 mm above the level of S1.33 This multislice volumetric approach is not only time‐consuming, but the lack of standardization hampers the comparison of results between studies.
In a limited sample size (n=100), we previously demonstrated that VAT and SAT area on a single‐slice approach at the vertebral level L3/L4 or L4/L5 showed excellent correlation with a multiple‐stack volumetric assessment in the FHS.34 This promising approach, which would increase both standardization and feasibility, however, needs confirmation in larger cohorts and requires external validation. Given that ≈30 million abdominal CT scans are performed in the United States annually,35, 36 identifying individuals in whom CT‐based measures of fat might improve risk prediction is warranted.
Limitations
Several limitations of our study merit comment. As with any analyses from the FHS, we were not able to assess ethnic/race‐related differences because of our predominant White study sample. Other studies, however, indicate that VAT differs across different race/ethnic groups.37 In addition, CT scans were performed between 2002 and 2005, when obesity rates were lower compared with the present.1 Other anthropometric measures, including waist/hip ratio and waist/height ratio, were not studied in our analysis as they are not used in clinical practice or endorsed by current guideline recommendations, although some studies have reported that the waist/height ratio was superior in detecting cardiometabolic risk factors in both men and women, and hence may be a more accurate marker for central adiposity.38 Hemoglobin A1c levels were not available in our cohort. Of note, alternative imaging techniques, such as ultrasound, have also been proposed to quantify VAT, which, as opposed to CT, are free of radiation.39 However, ultrasound is more operator dependent compared with CT, and limited data for ultrasound‐based VAT are available. Also, we covered 125 mm above the level of S1, which may not reflect body fat distribution and the full spectrum of obesity‐associated risk. Finally, a limited amount of cardiovascular events may limit generalizability of our findings.
Conclusions
In our community‐based analysis, anthropometric measures of obesity, including WC and BMI, demonstrate a similarly strong association with cardiometabolic and CVD risk in men compared with VAT on abdominal CT. In women, however, VAT may permit more precise assessment of adiposity‐associated risks when compared with BMI or WC. Sex‐specific approaches for cardiometabolic risk assessment, including standardization of CT‐based measures of fat, are warranted.
Sources of Funding
The FHS (Framingham Heart Study) acknowledges the support of contracts NO1‐HC‐25195, HHSN268201500001I, 75N92019D00031, and K24HL113128 from the National Heart, Lung, and Blood Institute for this research. The funder had no role in the design and conduct of the study; collection, management, analysis, and interpretation of the data; preparation, review, or approval of the manuscript; and decision to submit the manuscript for publication.
Disclosures
Dr Kammerlander reports receiving a grant from the Austrian Society of Cardiology during the time of this work. Dr Vasan is supported in part by the Evans Medical Foundation and the Jay and Louis Coffman Endowment from the Department of Medicine, Boston University School of Medicine. Dr Long is supported in part by the National Institute of Diabetes and Digestive and Kidney Diseases K23 DK113252, the Doris Duke Charitable Foundation, Gilead Sciences Research Scholars Award, the Boston University School of Medicine Department of Medicine Career Investment Award, and the Boston University Clinical Translational Science Institute UL1 TR001430. Dr Long reports consulting fees for Iterative Scopes and Ionis Pharmaceuticals and research funding from Gilead Sciences and Echosens Corporation, all not related to the present research. Dr Hoffmann reports research support not related to the present research: research grants on behalf of the institution: KOWA, MedImmune, HeartFlow, Duke University, Oregon Health & Science University (American Heart Association, 13FTF16450001), Columbia University (National Institutes of Health [NIH], 5R01‐HL109711), NIH/National Heart, Lung, and Blood Institute (NHLBI) 5K24HL113128, NIH/NHLBI 5T32HL076136, NIH/NHLBI 5U01HL123339; and consulting fees: Duke University and Recor Medical. The remaining authors have no disclosures to report.
Supporting information
Figure S1
Acknowledgments
We acknowledge the dedication of the FHS participants, without whom this research would not be possible.
Author contributions: Study concept and design: Drs Kammerlander and Hoffmann; acquisition, analysis, or interpretation of data: Dr Kammerlander, Dr Lyass, T.F. Mahoney, Dr Massaro, Dr Long, Dr Vasan, and Dr Hoffmann; drafting of the manuscript: Drs Kammerlander and Hoffmann; critical revision of the manuscript for important intellectual content: all authors; statistical analysis: Dr Lyass, T.F. Mahoney, and Dr Massaro; obtained funding: Drs Vasan and Hoffmann; administrative, technical, or material support: not applicable; study supervision: Dr Hoffmann.
(J Am Heart Assoc. 2021;10:e019968. DOI: 10.1161/JAHA.120.019968.)
Supplementary Material for this article is available at https://www.ahajournals.org/doi/suppl/10.1161/JAHA.120.019968
For Sources of Funding and Disclosures, see page 9.
References
- 1.Ward ZJ, Bleich SN, Cradock AL, Barrett JL, Giles CM, Flax C, Long MW, Gortmaker SL. Projected U.S. state‐level prevalence of adult obesity and severe obesity. N Engl J Med. 2019;381:2440–2450. DOI: 10.1056/NEJMsa1909301. [DOI] [PubMed] [Google Scholar]
- 2.Kannel WB, McGee DL. Diabetes and cardiovascular disease: the Framingham Study. JAMA. 1979;241:2035–2038. DOI: 10.1001/jama.1979.03290450033020. [DOI] [PubMed] [Google Scholar]
- 3.Kivimaki M, Kuosma E, Ferrie JE, Luukkonen R, Nyberg ST, Alfredsson L, Batty GD, Brunner EJ, Fransson E, Goldberg M, et al. Overweight, obesity, and risk of cardiometabolic multimorbidity: pooled analysis of individual‐level data for 120 813 adults from 16 cohort studies from the USA and Europe. Lancet Public Health. 2017;2:e277–e285. DOI: 10.1016/S2468-2667(17)30074-9. [DOI] [PMC free article] [PubMed] [Google Scholar]
- 4.Jensen MD, Ryan DH, Apovian CM, Ard JD, Comuzzie AG, Donato KA, Hu FB, Hubbard VS, Jakicic JM, Kushner RF, et al. 2013 AHA/ACC/TOS Guideline for the management of overweight and obesity in adults: a report of the American College of Cardiology/American Heart Association Task Force on practice guidelines and the obesity society. J Am Coll Cardiol. 2014;63:2985–3023. DOI: 10.1016/j.jacc.2013.11.004. [DOI] [PubMed] [Google Scholar]
- 5.Jensen MD, Ryan DH, Apovian CM, Ard JD, Comuzzie AG, Donato KA, Hu FB, Hubbard VS, Jakicic JM, Kushner RF, et al. 2013 AHA/ACC/TOS guideline for the management of overweight and obesity in adults: a report of the American College of Cardiology/American Heart Association Task Force on practice guidelines and the obesity society. Circulation. 2014;129:S102–S138. DOI: 10.1161/01.cir.0000437739.71477.ee. [DOI] [PMC free article] [PubMed] [Google Scholar]
- 6.Arnett DK, Blumenthal RS, Albert MA, Buroker AB, Goldberger ZD, Hahn EJ, Himmelfarb CD, Khera A, Lloyd‐Jones D, McEvoy JW, et al. 2019 ACC/AHA guideline on the primary prevention of cardiovascular disease: a report of the American College of Cardiology/American Heart Association Task Force on clinical practice guidelines. Circulation. 2019;140:e596–e646. DOI: 10.1161/CIR.0000000000000678. [DOI] [PMC free article] [PubMed] [Google Scholar]
- 7.Calle EE, Thun MJ, Petrelli JM, Rodriguez C, Heath CW Jr. Body‐mass index and mortality in a prospective cohort of U.S. adults. N Engl J Med. 1999;341:1097–1105. DOI: 10.1056/NEJM199910073411501. [DOI] [PubMed] [Google Scholar]
- 8.Physical status: the use and interpretation of anthropometry . Report of a WHO expert committee. World Health Organ Tech Rep Ser. 1995;854:1–452. [PubMed] [Google Scholar]
- 9.Klein S, Allison DB, Heymsfield SB, Kelley DE, Leibel RL, Nonas C, Kahn R. Waist circumference and cardiometabolic risk: a consensus statement from shaping America's health: association for weight management and obesity prevention; NAASO, the obesity society; the American Society for Nutrition; and the American Diabetes Association. Obesity. 2007;15:1061–1067. DOI: 10.1038/oby.2007.632. [DOI] [PubMed] [Google Scholar]
- 10.Flegal KM, Shepherd JA, Looker AC, Graubard BI, Borrud LG, Ogden CL, Harris TB, Everhart JE, Schenker N. Comparisons of percentage body fat, body mass index, waist circumference, and waist‐stature ratio in adults. Am J Clin Nutr. 2009;89:500–508. DOI: 10.3945/ajcn.2008.26847. [DOI] [PMC free article] [PubMed] [Google Scholar]
- 11.Abraham TM, Pedley A, Massaro JM, Hoffmann U, Fox CS. Association between visceral and subcutaneous adipose depots and incident cardiovascular disease risk factors. Circulation. 2015;132:1639–1647. DOI: 10.1161/CIRCULATIONAHA.114.015000. [DOI] [PMC free article] [PubMed] [Google Scholar]
- 12.Kaess BM, Pedley A, Massaro JM, Murabito J, Hoffmann U, Fox CS. The ratio of visceral to subcutaneous fat, a metric of body fat distribution, is a unique correlate of cardiometabolic risk. Diabetologia. 2012;55:2622–2630. DOI: 10.1007/s00125-012-2639-5. [DOI] [PMC free article] [PubMed] [Google Scholar]
- 13.Rosenquist KJ, Pedley A, Massaro JM, Therkelsen KE, Murabito JM, Hoffmann U, Fox CS. Visceral and subcutaneous fat quality and cardiometabolic risk. JACC Cardiovasc Imaging. 2013;6:762–771. DOI: 10.1016/j.jcmg.2012.11.021. [DOI] [PMC free article] [PubMed] [Google Scholar]
- 14.Fox CS, Massaro JM, Hoffmann U, Pou KM, Maurovich‐Horvat P, Liu C‐Y, Vasan RS, Murabito JM, Meigs JB, Cupples LA, et al. Abdominal visceral and subcutaneous adipose tissue compartments: association with metabolic risk factors in the Framingham Heart Study. Circulation. 2007;116:39–48. DOI: 10.1161/CIRCULATIONAHA.106.675355. [DOI] [PubMed] [Google Scholar]
- 15.Lee JJ, Pedley A, Hoffmann U, Massaro JM, Levy D, Long MT. Visceral and intrahepatic fat are associated with cardiometabolic risk factors above other ectopic fat depots: the Framingham Heart Study. Am J Med. 2018;131:684–692.e12. DOI: 10.1016/j.amjmed.2018.02.002. [DOI] [PMC free article] [PubMed] [Google Scholar]
- 16.Britton KA, Massaro JM, Murabito JM, Kreger BE, Hoffmann U, Fox CS. Body fat distribution, incident cardiovascular disease, cancer, and all‐cause mortality. J Am Coll Cardiol. 2013;62:921–925. DOI: 10.1016/j.jacc.2013.06.027. [DOI] [PMC free article] [PubMed] [Google Scholar]
- 17.Lee JJ, Pedley A, Hoffmann U, Massaro JM, Fox CS. Association of changes in abdominal fat quantity and quality with incident cardiovascular disease risk factors. J Am Coll Cardiol. 2016;68:1509–1521. DOI: 10.1016/j.jacc.2016.06.067. [DOI] [PMC free article] [PubMed] [Google Scholar]
- 18.Figueroa AL, Takx RAP, MacNabb MH, Abdelbaky A, Lavender ZR, Kaplan RS, Truong QA, Lo J, Ghoshhajra BB, Grinspoon SK, et al. Relationship between measures of adiposity, arterial inflammation, and subsequent cardiovascular events. Circ Cardiovasc Imaging. 2016;9:e004043. DOI: 10.1161/CIRCIMAGING.115.004043. [DOI] [PMC free article] [PubMed] [Google Scholar]
- 19.Pou KM, Massaro JM, Hoffmann U, Vasan RS, Maurovich‐Horvat P, Larson MG, Keaney JF, Meigs JB, Lipinska I, Kathiresan S, et al. Visceral and subcutaneous adipose tissue volumes are cross‐sectionally related to markers of inflammation and oxidative stress: the Framingham Heart Study. Circulation. 2007;116:1234–1241. DOI: 10.1161/CIRCULATIONAHA.107.710509. [DOI] [PubMed] [Google Scholar]
- 20.Preis SR, Massaro JM, Hoffmann U, D'Agostino RB Sr, Levy D, Robins SJ, Meigs JB, Vasan RS, O'Donnell CJ, Fox CS. Neck circumference as a novel measure of cardiometabolic risk: the Framingham Heart Study. J Clin Endocrinol Metab. 2010;95:3701–3710. DOI: 10.1210/jc.2009-1779. [DOI] [PMC free article] [PubMed] [Google Scholar]
- 21.Maurovich‐Horvat P, Massaro J, Fox CS, Moselewski F, O'Donnell CJ, Hoffmann U. Comparison of anthropometric, area‐ and volume‐based assessment of abdominal subcutaneous and visceral adipose tissue volumes using multi‐detector computed tomography. Int J Obes. 2007;31:500–506. DOI: 10.1038/sj.ijo.0803454. [DOI] [PubMed] [Google Scholar]
- 22.Speliotes EK, Massaro JM, Hoffmann U, Vasan RS, Meigs JB, Sahani DV, Hirschhorn JN, O'Donnell CJ, Fox CS. Fatty liver is associated with dyslipidemia and dysglycemia independent of visceral fat: the Framingham Heart Study. Hepatology. 2010;51:1979–1987. DOI: 10.1002/hep.23593. [DOI] [PMC free article] [PubMed] [Google Scholar]
- 23.Hinnouho GM, Czernichow S, Dugravot A, Nabi H, Brunner EJ, Kivimaki M, Singh‐Manoux A. Metabolically healthy obesity and the risk of cardiovascular disease and type 2 diabetes: the Whitehall II cohort study. Eur Heart J. 2015;36:551–559. DOI: 10.1093/eurheartj/ehu123. [DOI] [PMC free article] [PubMed] [Google Scholar]
- 24.Barry VW, Baruth M, Beets MW, Durstine JL, Liu J, Blair SN. Fitness vs. fatness on all‐cause mortality: a meta‐analysis. Prog Cardiovasc Dis. 2014;56:382–390. DOI: 10.1016/j.pcad.2013.09.002. [DOI] [PubMed] [Google Scholar]
- 25.Link JC, Reue K. Genetic basis for sex differences in obesity and lipid metabolism. Annu Rev Nutr. 2017;37:225–245. DOI: 10.1146/annurev-nutr-071816-064827. [DOI] [PMC free article] [PubMed] [Google Scholar]
- 26.Freiberg MS, Pencina MJ, D'Agostino RB, Lanier K, Wilson PW, Vasan RS. BMI vs. waist circumference for identifying vascular risk. Obesity. 2008;16:463–469. DOI: 10.1038/oby.2007.75. [DOI] [PubMed] [Google Scholar]
- 27.Emerging Risk Factors Collaboration , Wormser D, Kaptoge S, Di Angelantonio E, Wood AM, Pennells L, Thompson A, Sarwar N, Kizer JR, Lawlor DA, et al. Separate and combined associations of body‐mass index and abdominal adiposity with cardiovascular disease: collaborative analysis of 58 prospective studies. Lancet. 2011;377:1085–1095. DOI: 10.1016/S0140-6736(11)60105-0. [DOI] [PMC free article] [PubMed] [Google Scholar]
- 28.Peters SAE, Bots SH, Woodward M. Sex differences in the association between measures of general and central adiposity and the risk of myocardial infarction: results from the UK Biobank. J Am Heart Assoc. 2018;7:e008507. DOI: 10.1161/JAHA.117.008507. [DOI] [PMC free article] [PubMed] [Google Scholar]
- 29.Rao G, Powell‐Wiley TM, Ancheta I, Hairston K, Kirley K, Lear SA, North KE, Palaniappan L, Rosal MC, American Heart Association Obesity Committee of the Council on Lifestyle and Cardiometabolic Health , et al. Identification of obesity and cardiovascular risk in ethnically and racially diverse populations: a scientific statement from the American Heart Association. Circulation. 2015;132:457–472. DOI: 10.1161/CIR.0000000000000223. [DOI] [PubMed] [Google Scholar]
- 30.Akoumianakis I, Antoniades C. The interplay between adipose tissue and the cardiovascular system: is fat always bad? Cardiovasc Res. 2017;113:999–1008. DOI: 10.1093/cvr/cvx111. [DOI] [PubMed] [Google Scholar]
- 31.Liu J, Fox CS, Hickson DA, May WD, Hairston KG, Carr JJ, Taylor HA. Impact of abdominal visceral and subcutaneous adipose tissue on cardiometabolic risk factors: the Jackson Heart Study. J Clin Endocrinol Metab. 2010;95:5419–5426. DOI: 10.1210/jc.2010-1378. [DOI] [PMC free article] [PubMed] [Google Scholar]
- 32.Davidson FE, Matsha TE, Erasmus RT, Kengne AP, Goedecke JH. The discriminatory power of visceral adipose tissue area vs anthropometric measures as a diagnostic marker for metabolic syndrome in South African women. Diabetol Metab Syndr. 2019;11:93. DOI: 10.1186/s13098-019-0483-1. [DOI] [PMC free article] [PubMed] [Google Scholar]
- 33.Liu J, Coady S, Carr JJ, Hoffmann U, Taylor HA, Fox CS. Differential associations of abdominal visceral, subcutaneous adipose tissue with cardiometabolic risk factors between African and European Americans. Obesity. 2014;22:811–818. DOI: 10.1002/oby.20307. [DOI] [PMC free article] [PubMed] [Google Scholar]
- 34.Irlbeck T, Massaro JM, Bamberg F, O'Donnell CJ, Hoffmann U, Fox CS. Association between single‐slice measurements of visceral and abdominal subcutaneous adipose tissue with volumetric measurements: the Framingham Heart Study. Int J Obes. 2010;34:781–787. DOI: 10.1038/ijo.2009.279. [DOI] [PMC free article] [PubMed] [Google Scholar]
- 35.Berrington de Gonzalez A, Mahesh M, Kim KP, Bhargavan M, Lewis R, Mettler F, Land C. Projected cancer risks from computed tomographic scans performed in the United States in 2007. Arch Intern Med. 2009;169:2071–2077. DOI: 10.1001/archinternmed.2009.440. [DOI] [PMC free article] [PubMed] [Google Scholar]
- 36.Mettler FA Jr. Medical radiation exposure in the United States: 2006–2016 trends. Health Phys. 2019;116:126–128. DOI: 10.1097/HP.0000000000000996. [DOI] [PubMed] [Google Scholar]
- 37.Pandey A, Kondamudi N, Patel KV, Ayers C, Simek S, Hall ME, Musani SK, Blackshear C, Mentz RJ, Khan H, et al. Association between regional adipose tissue distribution and risk of heart failure among blacks. Circ Heart Fail. 2018;11:e005629. DOI: 10.1161/CIRCHEARTFAILURE.118.005629. [DOI] [PubMed] [Google Scholar]
- 38.Ashwell M, Gunn P, Gibson S. Waist‐to‐height ratio is a better screening tool than waist circumference and BMI for adult cardiometabolic risk factors: systematic review and meta‐analysis. Obes Rev. 2012;13:275–286. DOI: 10.1111/j.1467-789X.2011.00952.x. [DOI] [PubMed] [Google Scholar]
- 39.Seven E, Thuesen BH, Linneberg A, Jeppesen JL. Abdominal adiposity distribution quantified by ultrasound imaging and incident hypertension in a general population. Hypertension. 2016;68:1115–1122. DOI: 10.1161/HYPERTENSIONAHA.116.07306. [DOI] [PubMed] [Google Scholar]
Associated Data
This section collects any data citations, data availability statements, or supplementary materials included in this article.
Supplementary Materials
Figure S1