

Abstract
Numerous studies have linked alpha-frequency (~ 10 Hz) visual entrainment to the inhibition of incoming visual information. However, while these studies have provided key evidence for the intrinsic sensitivity of the human brain to incoming alpha-frequency signals, they have only examined the negative impact of alpha entrainment on target stimuli. Thus, it remains uncertain whether the perception of distracting or non-imperative stimuli can also be affected by alpha-frequency entrainment. In the current study, we address this question using an adapted version of the arrow-based Erikson “Flanker” paradigm that incorporates stimuli flickering at two distinct frequencies: 10 Hz (alpha) and 30 Hz. By presenting flickering stimuli in the portions of the visual field where the flanking arrows would soon appear, we aimed to determine whether the frequency of visual entrainment (i.e., 10 Hz versus 30 Hz) significantly interacted with the congruency of the flanking arrows (representing selective attention processing) using behavioral task performance and neural oscillations as the outcome metrics. Twenty-three healthy adult participants underwent magnetoencephalography (MEG) during performance of the task. Our results indicated a reduced congruency effect (i.e., a smaller difference between congruent and incongruent trials) in the alpha-flicker condition, as compared to the 30 Hz-flicker condition, which suggests a robust relationship between alpha entrainment and the active inhibition of distractor stimuli appearing in that portion of the visual field. Supporting this, alpha-frequency (but not 30 Hz) entrainment responses in primary visual cortex also covaried significantly with the behavioral congruency effect.
Keywords: visual entrainment, selective attention, magnetoencephalography, alpha oscillations
1. Introduction
The human brain is thought to implement various cognitive processes using well-defined rhythmic patterns of population-level neural activity (Buzsaki & Draguhn, 2004; Schnitzler & Gross, 2005). For instance, a substantial amount of research has connected parieto-occipital alpha-frequency oscillations to the active inhibition of visual cortical function (Jensen & Mazaheri, 2010; Rihs, Michel, & Thut, 2007), particularly when these rhythms are measured prior to the onset of a salient visual stimulus or during the maintenance phase of visual working memory tasks (Bonnefond & Jensen, 2012; Heinrichs-Graham & Wilson, 2015; Proskovec, Heinrichs-Graham, & Wilson, 2016; van Dijk, Schoffelen, Oostenveld, & Jensen, 2008; Wiesman et al., 2016; Wiesman, Mills, et al., 2018; Wilson et al., 2017). However, the conceptualization of occipital alpha as a suppression mechanism in visual cortex has recently come into question (Foster & Awh, 2018). Thus, studies aimed at experimentally manipulating occipital alpha in visual cortices and measuring the resulting effects on behavior and associated neural responses are extremely relevant.
In an attempt to manipulate occipital alpha experimentally, many laboratories have turned to frequency-specific entrainment with flickering visual stimuli (Schwab et al., 2006). Although it remains unclear whether entrainment responses to stimuli flickering in the alpha-range represent a power-modulation of ongoing rhythmic patterns of neural activity, or more simply a “frequency-following response” (Keitel, Quigley, & Ruhnau, 2014), it is nonetheless established that visual perception appears to be negatively modulated by these stimuli (de Graaf et al., 2013; Gulbinaite, van Viegen, Wieling, Cohen, & VanRullen, 2017; Mathewson et al., 2012; Spaak, de Lange, & Jensen, 2014; Wiesman, Groff, & Wilson, 2018). An enhanced understanding of this phenomenon is crucial, as flickering visual stimuli have been used for decades to “tag” stimuli in vision and cognitive neuroscience research in a supposedly neutral, physiologically-inert fashion (Norcia, Appelbaum, Ales, Cottereau, & Rossion, 2015).
Importantly, the impact of task-salience on the negative effects of alpha entrainment remains unclear, as does the nature of these impairing effects on visual perception (i.e., pre- or post- attentive). Such knowledge is essential to understanding the interaction between attention and the effects of alpha entrainment on visual perception, which is a rapidly growing area of neuroscience (Calderone, Lakatos, Butler, & Castellanos, 2014). As discussed above, previous research has found a detrimental effect of alpha entrainment on visual perception, but virtually all of these studies entrained the visual field corresponding to target stimuli (de Graaf et al., 2013; Mathewson et al., 2012; Spaak et al., 2014; Wiesman, Groff, et al., 2018). Thus, whether similar effects would be observed when the entrained visual field corresponded to non-imperative, or even distracting, stimuli remains to be investigated. Essentially, if such alpha entrainment is associated with similarly detrimental effects on the perception of distracting stimuli, then the expected net effect would be enhanced task performance, which would support the conceptualization that alpha entrainment has an “early” inhibitory effect in visual cortex that modulates visual perception. A recent exception to this was provided by Gulbinaite et al. (2017) who entrained the visual cortices of participants at 10 Hz during an adapted “flanker” paradigm (Eriksen & Eriksen, 1974). By flickering the stimuli to entrain at alpha (10 Hz) or near-alpha frequencies (i.e., 7.5 Hz or 15 Hz), the authors showed that the frequency of entrainment, as well as the spectral distance between this entrainment and each participant’s peak alpha frequency, predicted behavior on the task. Importantly, Gulbinaite et al. did not find that entrainment effects were specific to target or flanker stimuli positions, but this could reflect potential limitations in experimental design. Basically, they entrained visual cortices at the specified frequencies both during the pre-stimulus period and during the presentation of the flanker stimuli. Thus, they were unable to directly test the effects of alpha distractor-entrainment under equivalent probe conditions. Further, the entrainment stimuli used in this study did not completely overlap in visual space with the subsequently-presented probe items, which could potentially reduce the potency of any entrainment effects.
In this study, we utilized an arrow-based, entrainment version of the classic Eriksen flanker paradigm and magnetoencephalography (MEG) to investigate the dynamic interactions between alpha-targeted entrainment in the visual cortex and behavioral performance on the selective attention task. We hypothesized that local entrainment of visual cortex at 10 Hz would result in a reduced interference effect of visual stimuli in that portion of the visual field. Specifically, by entraining visual cortices at two distinct frequencies (i.e., 10 Hz alpha and 30 Hz control) in the specific locations where the interfering arrows would subsequently appear (and not over the target arrow), we hypothesized that pre-stimulus alpha entrainment would selectively decrease the behavioral interference effect of the incongruent flanking arrows. Further, we hypothesized that the strength of pre-stimulus neural entrainment in the alpha range would predict the decreased behavioral interference effect of the distracting flanker stimuli.
2. Materials and Methods
2.1. Participants
Twenty-three healthy young adults were recruited for the study (Mage = 26.09; age range: 20–33 years; 16 males; 21 right-handed). Exclusion criteria included any medical illness affecting CNS function, any neurological or psychiatric disorder, history of head trauma, current substance abuse, and any non-removable metal implants that would adversely affect MEG data acquisition. Participants were compensated $50 for their time and travel for taking part in the study. All participants had normal or corrected-to-normal vision. Three participants were excluded early during analysis of the neural data: one due to technical difficulties with data acquisition and two more due to artifactual neural data (i.e., physiologically-implausible amplitude of responses), leaving a remaining twenty total participants for further analysis (Mage = 26.00; 15 males; 18 right-handed). The Institutional Review Board at the University of Nebraska Medical Center reviewed and approved this investigation. Written informed consent was obtained from each participant following detailed description of the study. All participants completed the same experimental protocol.
2.2. MEG Experimental Design and Behavioral Data Analysis
We used a modified arrow-based version of the classic Eriksen “flanker” paradigm to engage alpha-frequency networks related to selective attention processing (Figure 1). Each trial began with a fixation that was presented for a randomly-varied inter-stimulus interval of 2100–2300 ms. After this, two entrainment stimuli were flickered at a frequency of either 10 or 30 Hz on each side of this central fixation for 1500 ms. A row of 5 arrows was then presented in the same spatial locations as the five previously-presented stimuli (i.e., the central fixation and four surrounding entrainment stimuli) for 1000 ms. Importantly, the presentation of these arrows coincided with what would be the effective “peak” of the ongoing entrained rhythm. Prior to starting the experiment, participants were instructed to respond as quickly and accurately as possible as to whether the middle arrow was pointing to the left (index finger) or right (middle finger), using their right hand on a non-magnetic button pad. All stimuli prior to the presentation of the flanker arrows (i.e., the fixation and entrainment stimuli) were diamonds of equal height and width as the arrows, so to completely encompass and systematically modulate the visual field of the subsequently-presented flanker stimuli. The 300 total trials were pseudo-randomized and equally split between each of the two entrainment (10 Hz and 30 Hz) and flanker congruency (congruent and incongruent) conditions. Correct responses were also pseudo-randomized, such that the direction of the central target arrow was never repeated more than twice in a row. Custom visual stimuli were programmed in Matlab (Mathworks, Inc., Massachusetts, USA) using Psychophysics Toolbox Version 3 (Brainard, 1997) and back-projected onto a semi-translucent non-ferromagnetic screen at an approximate distance of 42 inches, using a Panasonic PT-D7700U-K model DLP projector with a refresh rate of 60 Hz and a contrast ratio of 4000:1. Flickering stimuli were presented as a square-wave function with a frequency of either 10 Hz (3 frames on/3 frames off; ~16.67 ms per frame) or 30 Hz (1 frame on/1 frame off), with a luminance contrast of 100% (white stimuli on a black background). The arrow and entrainment stimuli were centered on five locations evenly distributed horizontally across the screen, and each subtended an approximate visual angle of 1.0° horizontally by 1.0° vertically. Including spaces between the arrows, the entire visual array (i.e., all five arrows/entrainment stimuli) subtended an approximate visual angle of 6.3° horizontally by 1.0° vertically. Total MEG recording time was about 24 minutes.
Figure 1. Task design.
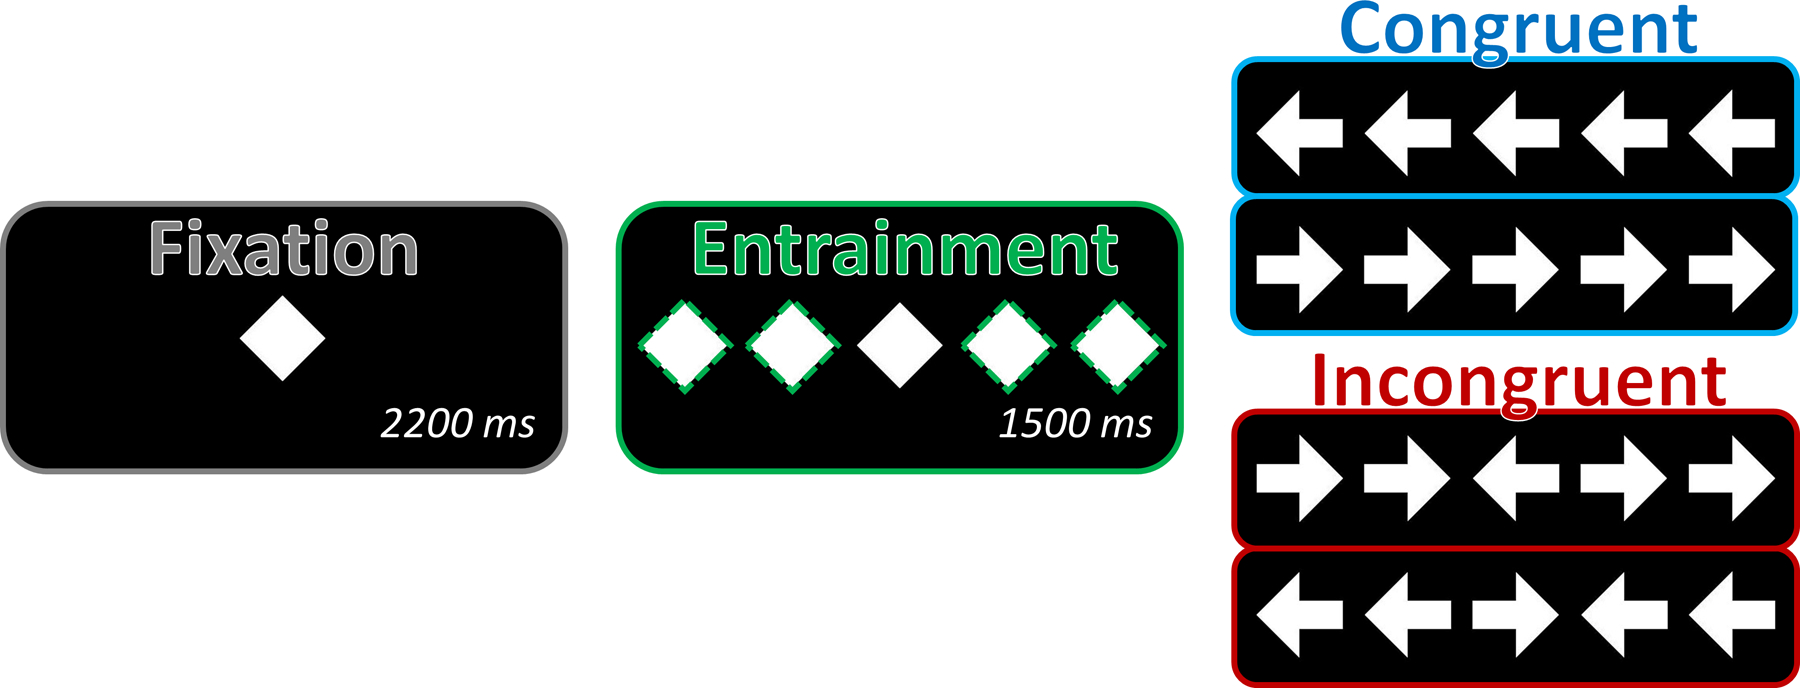
The task began with 2200 ms of fixation, followed by 1500 ms of bilateral peripheral visual entrainment (green dotted lines) driven at either 10 or 30 Hz. Upon cessation of the entraining stimuli, one of the four arrow arrays was presented, comprising either a congruent or incongruent visual stimulus. Participants were instructed to indicate (by button press) the direction of the central arrow, while ignoring the interfering information provided by the flanking distractor arrows. Diamonds were chosen for fixation and entrainment stimuli, so as to completely encompass the visual field of the to-be-presented arrow stimuli, while also providing no information regarding the direction of the subsequently-presented arrow stimuli. It is important to note that the five positions of the fixation and entrainment stimuli perfectly overlapped in visual space with the positions of the subsequently-presented arrow stimuli.
For each participant, reaction time (RT) data were extracted for each individual trial, incorrect and no-response trials were removed, and outliers were then excluded based on a standard threshold of ± 2.5 standard deviations from the mean. The remaining RT data were then averaged within each participant, and these mean RT values were subjected to a 2 (flanker congruency) × 2 (entrainment frequency) repeated measures ANOVA. These participant-level RT means were also used in subsequent statistical analyses, however it is important to note that, when computing the “congruency effect” for these analyses (commonly computed as the Incongruent RT – Congruent RT), we opted to divide the values instead, as this helped minimize the bias resulting from variability in overall response time (i.e., participants with higher overall reaction time could have a higher congruency effect, despite having a similar RT ratio between the two conditions). Importantly, side-by-side comparison of the different methods to compute congruency effects (i.e., subtraction, division, [active-baseline]/[active+baseline]) revealed that this choice made almost no difference in our primary finding (i.e., the significant time-varying relationship between 10 Hz entrainment and behavior). Accuracy data were also computed, but were not analyzed for conditional differences due to possible ceiling effects (mean accuracy = 94%) that would obscure meaningful interpretation.
2.3. MEG Data Acquisition
In general, the MEG methods detailed in sections 2.3 through 2.6 closely approximate the pipeline established in earlier papers from our group (Heinrichs-Graham & Wilson, 2015; McDermott et al., 2017; Proskovec et al., 2016; Wiesman, Groff, et al., 2018; Wiesman et al., 2016; Wiesman, Heinrichs-Graham, Proskovec, McDermott, & Wilson, 2017; Wiesman, Mills, et al., 2018; Wiesman, O’Neill, et al., 2018; Wilson et al., 2017). All recordings were conducted in a one-layer magnetically-shielded room with active shielding engaged for environmental noise compensation. Neuromagnetic responses were sampled continuously at 1 kHz with an acquisition bandwidth of 0.1–330 Hz using a 306-sensor Elekta MEG system (Helsinki, Finland) equipped with 204 planar gradiometers and 102 magnetometers. Participants were monitored during data acquisition via real-time audio–video feeds from inside the shielded room. Each MEG dataset was individually corrected for head motion and subjected to noise reduction using the signal space separation method with a temporal extension (Taulu & Simola, 2006).
2.4. Structural MRI Processing and MEG Coregistration
Preceding MEG measurement, four coils were attached to the participant’s head and localized, together with the three fiducial points and scalp surface, using a 3-D digitizer (Fastrak 3SF0002, Polhemus Navigator Sciences, Colchester, VT, USA). Once the participant was positioned for MEG recording, an electric current with a unique frequency label (e.g., 322 Hz) was fed to each of the coils. This induced a measurable magnetic field and allowed each coil to be localized in reference to the sensors throughout the recording session. Since coil locations were also known in head coordinates, all MEG measurements could be transformed into a common coordinate system. With this coordinate system, each participant’s MEG data were co-registered with individual structural T1-weighted MRI data (N = 12), when available, or alternatively were fitted to a template MRI (N = 11) using the digitized scalp surface points, in BESA MRI (Version 2.0) prior to source-space analysis. Importantly, previous studies have shown that using such a template has a negligible effect on the results (Holliday, Barnes, Hillebrand, & Singh, 2003), and our primary neural measure of interest, the power of the 10 Hz entrainment response, did not significantly differ according to whether participants were co-registered to individual or template MRIs using a very liberal threshold (i.e., one-tailed cluster-based permutation test on the timeseries data, with an initial p-value threshold of p < .20). Structural MRI data were aligned parallel to the anterior and posterior commissures and transformed into standardized space. Following source analysis (i.e., beamforming; see section 2.6 MEG Source Imaging and Statistics), each participant’s 4.0 × 4.0 × 4.0 mm functional images were also transformed into standardized space using the transform that was previously applied to the structural MRI volume and spatially resampled.
2.5. MEG Preprocessing, Time-Frequency Transformation, and Sensor-Level Statistics
Cardiac artifacts were removed from the data using signal-space projection (SSP), which was subsequently accounted for during source reconstruction (Uusitalo & Ilmoniemi, 1997). The continuous magnetic time series was then divided into 3200 ms epochs (−2200 to 1000 ms relative to the onset of the arrow stimuli; −700 to 2500 ms relative to the onset of the entraining stimuli), with the baseline extending from −2000 to −1600 ms prior to the onset of the arrow stimuli (and −500 to −100 ms prior to the onset of the entrainment stimuli). Recall that the entrainment stimuli appeared 1500 ms prior to the arrow stimuli and extended until their onset. Epochs containing artifacts were rejected using a fixed threshold method, supplemented with visual inspection. An average of 255.10 (SD = 13.57) trials per participant (out of 300 total) were used for further analysis, and the mean number of accepted trials per condition did not differ by entrainment frequency, flanker congruency, nor by an interaction between the two terms (2 × 2 repeated measures ANOVA; all p’s > .20).
The artifact-free epochs were next transformed into the time-frequency domain using complex demodulation (Kovach & Gander, 2016), and the resulting spectral power estimations per sensor were averaged over trials to generate time-frequency plots of mean spectral density. For visualization, these sensor-level data were normalized by each respective bin’s baseline power, which was calculated as the mean power during the −2000 to −1600 ms time period. The time-frequency windows used for subsequent source imaging of the entrainment response were determined a priori, based on the duration and frequency of the entrained stimuli. For each of these responses, the spectral window was the frequency of entrainment (i.e., 10 or 30 Hz) ± 0.25 Hz, and the time windows were defined in two successive bins stretching from −1500 to −500 ms prior to arrow stimuli presentation. To facilitate comparison between the baseline and entrainment periods, the duration of the baseline was extended in time (−2100 to −1600 ms) to match the length (500 ms) of the entrainment bins for source imaging. Since there were no strong a priori predictions about the spectral and temporal extent of the alpha-frequency neural responses to the arrow stimuli (i.e., after entrainment), the time-frequency windows used for source imaging of these responses were determined by statistical analysis of the sensor-level spectrograms across the entire array of gradiometers. Each data point in the spectrogram was initially evaluated using a mass univariate approach based on the general linear model. To reduce the risk of false positive results while maintaining reasonable sensitivity, a two stage procedure was followed to control for Type 1 error. In the first stage, one-sample t-tests were conducted on each data point and the output spectrogram of t-values was thresholded to define time-frequency bins containing potentially significant oscillatory deviations across all participants. In stage two, time-frequency bins that survived the threshold were clustered with temporally and/or spectrally neighboring bins that were also above the threshold, and a cluster value was derived by summing all of the t-values of all data points in the cluster. Nonparametric permutation testing was then used to derive a distribution of cluster-values and the significance level of the observed clusters (from stage one) were tested directly using this distribution (Ernst, 2004; Maris & Oostenveld, 2007). For each comparison, at least 10,000 permutations were computed to build a distribution of cluster values. Based on these analyses, the alpha time-frequency window that contained significant (p < .05) oscillatory events across all participants were subjected to a beamforming analysis. Subsequent MEG analyses were performed only on significant oscillatory events that began in the time window preceding the mean RT across all participants, so as to focus on responses underlying visuospatial attention and discrimination, rather than other processes inherent to the later portions of the task (i.e., motor initiation, response/error-checking, etc.). Finally, to examine the effects of entrainment on phase-consistency across trials, we also computed inter-trial phase coherence (ITPC) for the 10 Hz and 30 Hz entrainment responses at a resolution of 2 Hz and 25 ms.
2.6. MEG Source Imaging and Statistics
Cortical networks were imaged through an extension of the linearly constrained minimum variance vector beamformer (DICS; Gross et al., 2001), which applies spatial filters to time-frequency sensor data in order to calculate voxel-wise source power for the entire brain volume. The single images are derived from the cross spectral densities of all combinations of MEG gradiometers averaged over the time-frequency range of interest, and the solution of the forward problem for each location on a grid specified by input voxel space. Following convention, we computed noise-normalized, source power per voxel in each participant using active (i.e., task) and passive (i.e., baseline) periods of equal duration and bandwidth. Such images are typically referred to as pseudo-t maps, with units (pseudo-t) that reflect noise-normalized power differences (i.e., active vs. passive) per voxel. For the entrainment maps, the baseline was defined as −2100 to −1600 ms prior to arrow stimulus onset, while the baseline for the arrow stimulus response was defined as −400 to 0 ms prior to the onset of these stimuli. The baseline was shifted for the arrow stimulus response to account for the differential modulation of absolute alpha activity between the two entrainment conditions, as well as to account for individual variability in the strength of this entrainment response. The time-frequency window used to compute source images for the arrow-stimulus response extended temporally from 200 to 550 ms after the onset of the arrows, and spectrally from 8 to 14 Hz. To generate participant-level maps for the entrainment responses, we averaged the whole-brain images from the two previously described time-frequency windows (temporal extent: −1500 to −1000 ms and −1000 to −500 ms prior to flanker stimulus onset; spectral extent: the respective entrainment frequency ± 0.25 Hz) within each participant for each entrainment frequency, and these maps were then used to identify the peak voxel of the respective entrainment response. MEG pre-processing and imaging used the Brain Electrical Source Analysis (BESA version 6.0) software. Entrainment peak voxels were identified as the voxel with the highest response magnitude from the grand average of the entrainment maps. Peak voxel locations for the arrow stimulus alpha response were extracted from the voxel with the highest average pseudo-t across all conditions and participants.
Virtual sensor (i.e., voxel time series) data were computed by applying the sensor-weighting matrix derived through the forward computation to the preprocessed signal vector, which yielded a time series for each source vector centered in the voxel of interest. For the entrainment responses, time series were extracted across a frequency range of ± 0.25 Hz centered on the entrainment frequency of interest, to maximize the entrainment signal and reduce interference from competing responses (i.e., the lateral desynchronization). In contrast, the time series for the arrow stimuli response was extracted across a frequency range of 8–14 Hz, to both maximize the temporal precision of the dynamic neural signals being investigated, as well as to better represent the endogenous cortical oscillations that normally serve selective attention processing (McDermott et al., 2017). It should be noted that, due to the temporal resolution needed to derive a reliable measure of the entrainment responses, the temporal resolution for the entrainment time series was reduced compared to the 8–14 Hz time series. These time series were in absolute units (not relative to baseline) and, after initial analyses did not suggest substantial laterality effects, were averaged across both hemispheres into one voxel time series per response (i.e., entrainment and arrow stimulus responses) per participant for the desired time interval (i.e., the time periods preceding and succeeding the presentation of the arrow stimuli). To also examine the effect of entrainment phase-consistency on behavior, virtual sensor ITPC was computed using these same peak voxels for each entrainment frequency (i.e., 10 Hz and 30 Hz), and subjected to similar statistical analyses.
2.7. Statistical Analyses
Once the peak voxel time series were extracted for the responses of interest (i.e., the entrainment and arrow stimuli responses), we used cluster-based permutation statistics to test our hypotheses. This method was selected due to the statistical non-independence of neural time series data (as neural activations are not expected to persist across only one time sample), as well as to account for the time-varying nature of attentional effects on steady-state responses (Morgan, Hansen, & Hillyard, 1996). This statistical procedure is largely similar to that used in the sensor-level statistics. Briefly, clusters of temporally-contiguous, significant relationships were identified using a two stage procedure to control for Type 1 error. In the first stage, effect-size statistics were computed for each data point and the output spectrogram of these values were thresholded at p < .05 to define time bins that were potentially significant across all participants. In stage two, time bins that survived were clustered with temporally neighboring bins that were also above the threshold, and a cluster value was derived by summing all of the effect size statistics of all data points in the cluster. Nonparametric permutation testing was then used to derive a distribution of cluster-values and the significance level of the observed clusters (from stage one) were tested directly using this distribution. For each comparison, at least 10,000 permutations were computed to build a distribution of cluster values, and a final cluster threshold of p < .05 was considered statistically significant. Time series permutation testing was performed using custom-built functions in Matlab, behavioral ANOVAs and Bayesian ANOVAs were computed in JASP (J. Team, 2018), and linear regression modeling was performed in R (R. C. Team, 2017; Tingley, Yamamoto, Hirose, Keele, & Imai, 2014). All statistical tests were performed two-tailed, unless explicitly stated otherwise.
3. Results
3.1. Effects of Entrainment Frequency and Arrow Congruency on Behavior
All participants performed well on the task (mean = 94.09% correct, SD = 2.94%) and we did not examine accuracy due to possible ceiling effects. A 2 × 2 (entrainment frequency by flanker arrow congruency) repeated-measures ANOVA on reaction time (RT) revealed a significant main effect of congruency (F(1,22) = 101.48, p < .001), supporting decades of previous literature using similar selective attention paradigms. In addition, and supporting our primary hypothesis of alpha-frequency entrainment as an amplifier of active inhibition of the visual cortex, we observed an interaction between frequency and congruency (F(1,22) = 18.70, p < .001), such that the effect of congruency (i.e., the difference in RT between incongruent and congruent trials) was significantly reduced for the 10 Hz entrainment trials (mean ΔRT = 18.15), as compared to the 30 Hz entrainment trials (mean ΔRT = 37.76; Figure 2). To further probe the robustness of this effect, we also performed a repeated-measures Bayesian analysis to determine the relative evidence of the alternative hypothesis in reference to the null hypothesis (Bayes Factor; BF10) while controlling for the individual effects of congruency and frequency in the null model. This analysis revealed an interaction term with an individual BF10 = 135.15, meaning that these data are ~ 135 times more likely to result from the alternative hypothesis than the null, which is considered very strong evidence for the alternative hypothesis. No main effect of entrainment frequency on reaction time was observed (p = .644).
Figure 2. Reduction of the behavioral congruency effect by 10 Hz visual entrainment.

Visualization of the interaction term between the factors of entrainment frequency (10 or 30 Hz) and arrow congruency (incongruent or congruent) shows that participants exhibited a reduced effect of congruency in the 10 Hz entrainment condition, as compared to the 30 Hz condition. We propose that the 10 Hz entrainment increased alpha in visual regions corresponding to the flanking arrows, and that this increased alpha decreased local processing and thus decreased the impact of congruency between the flanking and central arrows. On the left, overall reaction time is denoted on the y-axis in milliseconds, while on the right, reaction time congruency differences (incongruent – congruent; also in ms) are denoted on the y-axis.
3.2. Temporal-spectral Profile of Alpha-frequency Neural Oscillatory Dynamics
Before projecting our recorded neurophysiological signals into brain-space, we first needed to identify the temporal and spectral extent of our neural responses of interest (i.e., the entrainment and arrow stimulus responses). After decomposing the signal into time-frequency components across the entire array of sensors, we observed two distinct alpha-frequency neural responses, both consistent with previous reports (McDermott et al., 2017; Spaak et al., 2014). In the 10 Hz entrainment condition, this analysis revealed a robust narrow-band synchronization at 10 Hz beginning almost immediately after the onset of the entrainment stimuli (1500 ms prior to the onset of the flanker arrow stimuli), and extending modestly into the presentation of the arrows. Further, we also observed a more broad-band desynchronization in the alpha range (8 – 14 Hz) in both entrainment conditions, extending temporally from 200 to 550 ms after the onset of the arrow stimuli. A robust, narrow-band synchronization centered around 30 Hz was also observed in the 30 Hz entrainment condition, and this response also began 1500 ms prior to the onset of the flanker stimuli and extended slightly into the arrow presentation. These responses can be visualized in the data from a representative sensor (M2123) over the posterior occipital cortices in Figure 3. Finally, the ITPC increased substantially during the entrainment time-window at each respective frequency (i.e., at 10 Hz in the 10 Hz entrainment condition and at 30 Hz in the 30 Hz condition; Figure 4 – sensor M2123).
Figure 3. Temporal-spectral profile of neural oscillatory dynamics.

The sensor plots display alpha (bottom) and gamma (top) frequency neural responses over occipital regions for the 10 Hz (left) and 30 Hz (right) entrainment conditions. Time (in milliseconds) is denoted on the x-axis at bottom, and frequency (in Hz) is denoted on the y-axis of each respective plot. The dashed white line at −1500 ms indicates the onset of the entrainment stimuli, and the dashed white line at 0 ms indicates the onset of the arrow stimuli. Entrainment frequency is denoted using a dashed grey bar for each condition. The color scale bar for percent change from baseline is displayed between the plots. These spectrograms represent group-averaged data from one posterior occipital gradiometer sensor (M2123) that was representative of the neural responses in this region.
Figure 4. Inter-trial phase coherence of visual entrainment dynamics.

Similar to Figure 3, but plotting inter-trial phase coherence rather than response power. These spectrograms represent group-averaged data from the same posterior occipital gradiometer sensor (M2123) that was representative of the neural responses in this region. The color scale bar for inter-trial phase coherence is displayed between the plots, with zero indicating no phase-consistency across trials, and one indicating perfect phase-consistency across trials.
To determine the cortical origins of these responses, each was subjected to an advanced source-reconstruction analysis (see Methods). In agreement with previous studies of visual entrainment and selective attention, the 10 Hz and 30 Hz narrow-band entrainment responses were found to originate from medial primary visual areas in the occipital cortex, while the 8 – 14Hz alpha desynchronization originated from slightly more lateral occipital regions (Figure 5). In order to better examine the distinct temporal profiles of each of these responses, we extracted peak voxel virtual sensor time-series from the 10 and 30 Hz entrainment conditions and the 8 – 14 Hz desynchronization peaks (in units of absolute power; nAm2), and subjected the resulting frequency-specific power-envelopes to cluster-based permutation analyses to test our hypotheses.
Figure 5. Spatial origins of neural dynamics.

Source image maps display the thresholded output of the beamformer analyses for each entrainment condition (left and middle), as well as for the 8 – 14 Hz desynchronization response, averaged over all participants. Color scale legends to the right represent average response amplitude (in pseudo-t values).
3.3. Alpha Visual Entrainment Reduces the Effect of Distracting Stimuli
Providing robust support for our prediction that entrained alpha-frequency oscillations represent a form of active inhibition in visual cortex, time series permutation testing revealed that the power of the entrainment response at 10 Hz significantly predicted congruency differences in RT (Rmin = −.49, pcluster < .001; Figure 6, top), such that as the entrained response increased, the interference effect of the flanking arrows decreased. The predictive capacity of this signal increased steadily from the onset of the entrainment stimuli to the onset of the arrow stimuli, reaching significance in the peri-stimulus window for the presentation of the arrows (−600 to 200 ms). To enhance visualization and interpretation of this relationship, we averaged over this time window and plotted the resulting power values against congruency differences in RT (Figure 7). Intriguingly, the same relationship was absent from the ITPC data, indicating that the power of the entrainment response, and not the consistency of the entrainment across trials, was responsible for the observed behavioral effects. Additionally, although entrainment in the 30 Hz condition produced a robust neural response at 30 Hz (Figure 3, top right), the power of this response did not predict the congruency effect on RT (Rmax = .12, Rmin = −.004, no significant clusters; Figure 6, bottom), signifying that this effect is specific to the alpha-band, and not a general effect of visual entrainment.
Figure 6. Power of visual entrainment at 10 Hz predicts congruency effects on behavior.

The source image maps (left) show the neural response to the 10 Hz (top) and 30 Hz (bottom) entrainment stimuli, with a color scale legend to the side representing group-averaged response amplitude (in pseudo-t values). Plots (right) are the power envelopes for the entrained medial occipital responses (green and blue lines) and the time-varying relationship between this respective entrainment response and the congruency effect on RT (dotted black lines). Time (in ms) is denoted on the x-axes, and the y-axes on the left and right display the relevant scales for the regression (in R) and power envelope (in nAm2) time series, respectively. The shaded box indicates the temporal cluster identified as significant by permutation testing, with the peak regression effect size and cluster significance value denoted above. For reference, the horizontal gray dotted line indicates the initial cutoff of p < .05 used for the identification of potentially-significant clusters in the permutation analysis.
Figure 7. Relationship between the 10 Hz visual entrainment response and behavior.

This scatterplot shows the relationship between the 10 Hz visual entrainment response in primary visual cortex averaged across the significant time-window identified in the permutation analysis (denoted on the y-axis in nAm2) and the effect of congruency on behavior (denoted on the x-axis as a ratio of incongruent RT/congruent RT). The line of best-fit and the regression coefficient for this relationship are overlaid on the plot in black. The grey dotted lines indicate the 95% confidence interval for this relationship.
Finally, due to the importance of neural congruency effects in lateral visual regions in the alpha-band (McDermott et al., 2017), we hypothesized that the power of 10 Hz entrainment might be reflected in the difference values of the neural desynchronization responses to incongruent versus congruent trials. To test this hypothesis, we computed a timepoint-by-timepoint ratio of the alpha desynchronization response to the incongruent/congruent flanker stimuli. We then regressed the power of the 10 Hz entrainment response (averaged over the previously-identified −600 to 200 ms time window) on these data, and corrected for multiple comparisons using a cluster-based permutation approach. This relationship was indeed significant from 75 to 325 ms (Rmax = .48, pcluster < .001, one-tailed) after arrow onset, such that as the power of the entrainment response increased, the absolute power of the incongruent, relative to the congruent, response, also increased. Again, to enhance visualization, we averaged over this significant time window and plot this relationship in Figure 8. In other words, since this response was a desynchronization from pre-stimulus levels of alpha (8–14 Hz) activity, the participants who exhibited stronger entrainment at 10 Hz tended to have a weaker response to the incongruent (relative to the congruent) stimuli. In contrast, those who did not entrain as strongly tended towards the more prototypical pattern (McDermott et al., 2017) of a stronger response to incongruent (relative to congruent) stimuli.
Figure 8. Relationship between the 10 Hz visual entrainment response and the 8 – 14 Hz alpha desynchronization.

This scatterplot shows the relationship between the 10 Hz visual entrainment response in primary visual cortex averaged across the significant time-window identified in the permutation analysis (denoted on the x-axis in nAm2) and the effect of congruency on the 8 – 14 Hz alpha desynchronization response (denoted on the y-axis as a ratio of incongruent response power/congruent response power). The line of best-fit and the regression coefficient for this relationship are overlaid on the plot in black. The grey dotted lines indicate the 95% confidence interval for this relationship.
4. Discussion
Alpha-frequency oscillatory activity in the parieto-occipital cortices has been repeatedly connected to the active inhibition of irrelevant visual information (Heinrichs-Graham & Wilson, 2015; Jensen & Mazaheri, 2010; Proskovec et al., 2016; van Dijk et al., 2008; Wiesman et al., 2016; Wiesman, Mills, et al., 2018; Wilson et al., 2017), however causal links between neurophysiology and behavioral outcomes have been difficult to draw. Several studies have used visual stimuli that flicker at specific frequencies to systematically enhance occipital alpha oscillations and impair visual perception of target stimuli (Calderone et al., 2014; de Graaf et al., 2013; Gulbinaite et al., 2017; Mathewson et al., 2012; Spaak et al., 2014; Thut, Schyns, & Gross, 2011; Wiesman, Groff, et al., 2018), but no study to date had investigated whether this effect could be extended to impair perception of distracting stimuli (i.e., for a net benefit). In this study, we used a modified arrow-based version of the classic Eriksen flanker selective attention paradigm (Eriksen & Eriksen, 1974), paired with frequency-targeted flickering stimuli and dynamic brain imaging using MEG to address these gaps in the scientific literature. By entraining visual cortex at 10 or 30 Hz only over the visual field of the to-be-presented distractor stimuli, we provided robust evidence for the role of pre-stimulus alpha entrainment in the active inhibition of visual cortex function, even when this inhibition is beneficial to task performance. These findings, as well as their broader implications, are discussed below.
Regarding our behavioral data, we had one primary hypothesis: that alpha-frequency (10 Hz) entrainment relative to 30 Hz entrainment would selectively reduce the congruency (i.e., flanker) effect of the interfering arrow stimuli, which was supported. Further, due to the literature suggesting substantial individual variability in neural responses to entraining stimuli (Heinrichs-Graham & Wilson, 2012), we hypothesized that the magnitude of the neural response to entrainment would predict this behavioral modulation, such that higher entrainment power at 10 Hz would predict a greater reduction in behavioral interference. Again this hypothesis was supported. Importantly, we found no main effect of entrainment frequency on overall reaction time (i.e., congruency-invariant RT), signifying that differences in entrainment did not differentially modulate general alertness on the task, but rather acted to specifically inhibit visual distractor information in the 10 Hz condition. The importance of this finding is two-fold. First, alpha entrainment of visual cortex has been found previously to inhibit visual perception, and these data provide additional support for this. Steady-state visual stimuli have been used for decades to “tag” stimuli in cognitive experiments using a purportedly inert/neutral frequency of entrainment, the representations of which (i.e., SSVEPs) could then be localized within relevant neural networks and used as markers of lateralization and other phenomena. The current study provides evidence that these stimuli are not only non-inert, but in some cases actually serve as potent modulators of very low-level cognitive processes (i.e., visual perception). Further, the finding that this effect was specific to the 10 Hz entrainment condition suggests a particular sensitivity of the occipital cortex to alpha-frequency rhythmic visual input. Through further research, it might be possible to use this knowledge to better understand low-level perceptual deficits in patient populations, or to enhance attention in cognitively demanding settings. Second, previous research on this topic has focused on impairing the perception of target stimuli, and until now it has remained uncertain whether this effect could be translated to the inhibition of distracting visual information. Our finding that distracting information can also be compromised by 10 Hz visual entrainment notably strengthens the notion that the gating of information seen with alpha entrainment begins at visual perception. Interestingly, our findings also introduces the possibility of using alpha entrainment to positively modulate performance on selective attention tasks, by decreasing the negative effect of distracting environmental inputs.
In regards to our neural data, we hypothesized that the power of visual entrainment in the 10 Hz condition would significantly covary with the reduction of distractor inhibition discussed above. We observed such a relationship during the time-window prior to and encompassing the onset of the selective attention stimuli, further strengthening the link between alpha entrainment and visual inhibition. Importantly, we found no such relationship between ITPC during the entrainment period and distractor inhibition. This signifies that the power, and not the phase-consistency, of the entrainment response was predictive of entrainment effects on behavior, and warrants further study into the phase-power relationships of rhythmic visual entrainment. The 10 Hz entrainment response also covaried significantly with the effect of stimulus congruency on the occipital alpha desynchronization, which is a neural response that has previously been found to index the effect of flanker interference (McDermott et al., 2017), as well as active visual processing more generally. The nature of this relationship was such that as 10 Hz entrainment in primary visual cortex increased, the difference in this response between incongruent and congruent trials was reduced, signifying a modulation of endogenous, perceptually-relevant patterns of neural activity by 10 Hz entrainment. Finally, 30 Hz entrainment exhibited no relationship with task performance, indicating that these effects are frequency-specific, and not a general result of visual entrainment.
Of course, this research is not without limitations. First and foremost, due to the nature and focus of our experimental paradigm and hypotheses, the effect of other oscillatory frequencies was not explored. Neural oscillations in cortices other than occipital, and in frequencies other than alpha, have been found to be essential to selective attention processing (McDermott et al., 2017; Womelsdorf & Fries, 2007) and visual perception (Busch, Dubois, & VanRullen, 2009; Demiralp & Başar, 1992; Jensen, Gips, Bergmann, & Bonnefond, 2014; Marshall, O’Shea, Jensen, & Bergmann, 2015; Muthukumaraswamy & Singh, 2013; Posada, Hugues, Franck, Vianin, & Kilner, 2003; Tallon-Baudry, Bertrand, Henaff, Isnard, & Fischer, 2005; Vidal, Chaumon, O’Regan, & Tallon-Baudry, 2006; Wiesman et al., 2017; Wiesman, O’Neill, et al., 2018), and thus might have displayed interesting interactions with the occipital dynamics that we investigated, however the focus of this study was to examine the alpha-occipital dynamics in detail, and future research will be needed to flesh out the effects of other oscillatory responses. Second, although we did find the hypothesized reduction in RT in the incongruent condition following 10 Hz, relative to 30 Hz, entrainment, we also observed the opposite effect in the congruent condition. In other words, it appears that in addition to decreasing RT on incongruent trials, 10 Hz entrainment also tended to increase RT on congruent ones. Although intriguing, this finding was unexpected, and future research is needed to understand its origin. Third, we made no attempt here to vary the delay between the end of the visual entrainment and the onset of the task stimuli (i.e., the arrows), as has been done in other studies (Spaak et al., 2014). Thus, since we presented our task-stimuli at what would effectively be the “peak” of the entrained rhythm, it remains possible that our results would have been different if we had instead presented them at the “trough.” Fourth, although a number of our results were statistically-significant, the study might have been attained more power by a single-trial experimental design and analysis pipeline, and future studies should investigate this. Finally, it should be noted that since we only used one control entrainment condition that was “faster” than the 10 Hz condition (i.e., 30 Hz), it remains a possibility that the observed reduction in distractor effects was not alpha-specific. However, while theoretically plausible, this explanation is in direct conflict with the vast majority of literature on this topic, and would imply that the alpha-specific effects of entrainment previously observed on imperative stimuli do not persist when the stimuli are instead distracting. Thus, we remain convinced that alpha-specificity is the more parsimonious explanation.
Despite these limitations, this study provides new insight into the effects of alpha entrainment on visual perception, and also suggests that these signals might be used to enhance selective attention function in the presence of visual distractors. This is essential knowledge, which could potentially be leveraged to enhance selective attention abilities in cognitively-taxing environments. These findings also provide novel information regarding the coding of visual saliency in the human visual cortex, and will hopefully motivate further study in this area.
Acknowledgements
This research was supported by grants R01-MH103220 (TWW), R01-MH116782 (TWW), R01-MH118013 (TWW), and F31-AG055332 (AIW) from the National Institutes of Health, grant #1539067 from the National Science Foundation (TWW), and a NASA Nebraska Space Grant (AIW). The funders had no role in study design, data collection and analysis, decision to publish, or preparation of the manuscript.
Footnotes
Conflict of Interest
The authors declare no competing interests, financial or otherwise.
References
- Bonnefond M, & Jensen O (2012). Alpha oscillations serve to protect working memory maintenance against anticipated distracters. Curr Biol, 22(20), 1969–1974. [DOI] [PubMed] [Google Scholar]
- Brainard DH (1997). The Psychophysics Toolbox. Spatial Vision, 10, 433–436. [PubMed] [Google Scholar]
- Busch NA, Dubois J, & VanRullen R (2009). The phase of ongoing EEG oscillations predicts visual perception. J Neurosci, 29(24), 7869–7876. [DOI] [PMC free article] [PubMed] [Google Scholar]
- Buzsaki G, & Draguhn A (2004). Neuronal oscillations in cortical networks. Science, 304(5679), 1926–1929. [DOI] [PubMed] [Google Scholar]
- Calderone DJ, Lakatos P, Butler PD, & Castellanos FX (2014). Entrainment of neural oscillations as a modifiable substrate of attention. Trends Cogn Sci, 18(6), 300–309. [DOI] [PMC free article] [PubMed] [Google Scholar]
- de Graaf TA, Gross J, Paterson G, Rusch T, Sack AT, & Thut G (2013). Alpha-band rhythms in visual task performance: phase-locking by rhythmic sensory stimulation. PLoS One, 8(3), e60035. [DOI] [PMC free article] [PubMed] [Google Scholar]
- Demiralp T, & Başar E (1992). Theta rhythmicities following expected visual and auditory targets. Int J Psychophysiol, 13(2), 147–160. [DOI] [PubMed] [Google Scholar]
- Eriksen BA, & Eriksen CW (1974). Effects of noise letters upon the identification of a target letter in a nonsearch task. Perception & Psychophysics, 16(1), 143–149. [Google Scholar]
- Ernst MD (2004). Permutation methods: a basis for exact inference. Statistical Science, 19(4), 676–685. [Google Scholar]
- Foster JJ, & Awh E (2018). The role of alpha oscillations in spatial attention: limited evidence for a suppression account. Curr Opin Psychol, 29, 34–40. [DOI] [PMC free article] [PubMed] [Google Scholar]
- Gross J, Kujala J, Hamalainen M, Timmermann L, Schnitzler A, & Salmelin R (2001). Dynamic imaging of coherent sources: Studying neural interactions in the human brain. Proc Natl Acad Sci U S A, 98(2), 694–699. [DOI] [PMC free article] [PubMed] [Google Scholar]
- Gulbinaite R, van Viegen T, Wieling M, Cohen MX, & VanRullen R (2017). Individual Alpha Peak Frequency Predicts 10 Hz Flicker Effects on Selective Attention. J Neurosci, 37(42), 10173–10184. [DOI] [PMC free article] [PubMed] [Google Scholar]
- Heinrichs-Graham E, & Wilson TW (2012). Presence of strong harmonics during visual entrainment: a magnetoencephalography study. Biol Psychol, 91(1), 59–64. [DOI] [PMC free article] [PubMed] [Google Scholar]
- Heinrichs-Graham E, & Wilson TW (2015). Spatiotemporal oscillatory dynamics during the encoding and maintenance phases of a visual working memory task. Cortex, 69, 121–130. [DOI] [PMC free article] [PubMed] [Google Scholar]
- Holliday IE, Barnes GR, Hillebrand A, & Singh KD (2003). Accuracy and applications of group MEG studies using cortical source locations estimated from participants’ scalp surfaces. Hum Brain Mapp, 20(3), 142–147. [DOI] [PMC free article] [PubMed] [Google Scholar]
- Jensen O, Gips B, Bergmann TO, & Bonnefond M (2014). Temporal coding organized by coupled alpha and gamma oscillations prioritize visual processing. Trends Neurosci, 37(7), 357–369. [DOI] [PubMed] [Google Scholar]
- Jensen O, & Mazaheri A (2010). Shaping functional architecture by oscillatory alpha activity: gating by inhibition. Front Hum Neurosci, 4, 186. [DOI] [PMC free article] [PubMed] [Google Scholar]
- Keitel C, Quigley C, & Ruhnau P (2014). Stimulus-driven brain oscillations in the alpha range: entrainment of intrinsic rhythms or frequency-following response? J Neurosci, 34(31), 10137–10140. [DOI] [PMC free article] [PubMed] [Google Scholar]
- Kovach CK, & Gander PE (2016). The demodulated band transform. J Neurosci Methods, 261, 135–154. [DOI] [PMC free article] [PubMed] [Google Scholar]
- Maris E, & Oostenveld R (2007). Nonparametric statistical testing of EEG- and MEG-data. J Neurosci Methods, 164(1), 177–190. [DOI] [PubMed] [Google Scholar]
- Marshall TR, O’Shea J, Jensen O, & Bergmann TO (2015). Frontal eye fields control attentional modulation of alpha and gamma oscillations in contralateral occipitoparietal cortex. J Neurosci, 35(4), 1638–1647. [DOI] [PMC free article] [PubMed] [Google Scholar]
- Mathewson KE, Prudhomme C, Fabiani M, Beck DM, Lleras A, & Gratton G (2012). Making waves in the stream of consciousness: entraining oscillations in EEG alpha and fluctuations in visual awareness with rhythmic visual stimulation. J Cogn Neurosci, 24(12), 2321–2333. [DOI] [PubMed] [Google Scholar]
- McDermott TJ, Wiesman AI, Proskovec AL, Heinrichs-Graham E, & Wilson TW (2017). Spatiotemporal oscillatory dynamics of visual selective attention during a flanker task. Neuroimage, 156, 277–285. [DOI] [PMC free article] [PubMed] [Google Scholar]
- Morgan ST, Hansen JC, & Hillyard SA (1996). Selective attention to stimulus location modulates the steady-state visual evoked potential. Proc Natl Acad Sci U S A, 93(10), 4770–4774. [DOI] [PMC free article] [PubMed] [Google Scholar]
- Muthukumaraswamy SD, & Singh KD (2013). Visual gamma oscillations: the effects of stimulus type, visual field coverage and stimulus motion on MEG and EEG recordings. Neuroimage, 69, 223–230. [DOI] [PubMed] [Google Scholar]
- Norcia AM, Appelbaum LG, Ales JM, Cottereau BR, & Rossion B (2015). The steady-state visual evoked potential in vision research: A review. J Vis, 15(6), 4. [DOI] [PMC free article] [PubMed] [Google Scholar]
- Posada A, Hugues E, Franck N, Vianin P, & Kilner J (2003). Augmentation of induced visual gamma activity by increased task complexity. Eur J Neurosci, 18(8), 2351–2356. [DOI] [PubMed] [Google Scholar]
- Proskovec AL, Heinrichs-Graham E, & Wilson TW (2016). Aging modulates the oscillatory dynamics underlying successful working memory encoding and maintenance. Hum Brain Mapp, 37(6), 2348–2361. [DOI] [PMC free article] [PubMed] [Google Scholar]
- Rihs TA, Michel CM, & Thut G (2007). Mechanisms of selective inhibition in visual spatial attention are indexed by alpha-band EEG synchronization. Eur J Neurosci, 25(2), 603–610. [DOI] [PubMed] [Google Scholar]
- Schnitzler A, & Gross J (2005). Normal and pathological oscillatory communication in the brain. Nat Rev Neurosci, 6(4), 285–296. [DOI] [PubMed] [Google Scholar]
- Schwab K, Ligges C, Jungmann T, Hilgenfeld B, Haueisen J, & Witte H (2006). Alpha entrainment in human electroencephalogram and magnetoencephalogram recordings. Neuroreport, 17(17), 1829–1833. [DOI] [PubMed] [Google Scholar]
- Spaak E, de Lange FP, & Jensen O (2014). Local entrainment of alpha oscillations by visual stimuli causes cyclic modulation of perception. J Neurosci, 34(10), 3536–3544. [DOI] [PMC free article] [PubMed] [Google Scholar]
- Tallon-Baudry C, Bertrand O, Henaff MA, Isnard J, & Fischer C (2005). Attention modulates gamma-band oscillations differently in the human lateral occipital cortex and fusiform gyrus. Cereb Cortex, 15(5), 654–662. [DOI] [PubMed] [Google Scholar]
- Taulu S, & Simola J (2006). Spatiotemporal signal space separation method for rejecting nearby interference in MEG measurements. Phys Med Biol, 51(7), 1759–1768. [DOI] [PubMed] [Google Scholar]
- Team, J. (2018). JASP (Version 0.8.3.1).
- Team, R. C. (2017). R: A language and environment for statistical computing. R Foundation for Statistical Computing, Vienna, Austria. [Google Scholar]
- Thut G, Schyns PG, & Gross J (2011). Entrainment of perceptually relevant brain oscillations by non-invasive rhythmic stimulation of the human brain. Front Psychol, 2, 170. [DOI] [PMC free article] [PubMed] [Google Scholar]
- Tingley D, Yamamoto T, Hirose K, Keele L, & Imai K (2014). mediation: R Package for Causal Mediation Analysis. . Journal of Statistical Software, 59(5), 1–38.26917999 [Google Scholar]
- Uusitalo MA, & Ilmoniemi RJ (1997). Signal-space projection method for separating MEG or EEG into components. Med Biol Eng Comput, 35(2), 135–140. [DOI] [PubMed] [Google Scholar]
- van Dijk H, Schoffelen JM, Oostenveld R, & Jensen O (2008). Prestimulus oscillatory activity in the alpha band predicts visual discrimination ability. J Neurosci, 28(8), 1816–1823. [DOI] [PMC free article] [PubMed] [Google Scholar]
- Vidal JR, Chaumon M, O’Regan JK, & Tallon-Baudry C (2006). Visual grouping and the focusing of attention induce gamma-band oscillations at different frequencies in human magnetoencephalogram signals. J Cogn Neurosci, 18(11), 1850–1862. [DOI] [PubMed] [Google Scholar]
- Wiesman AI, Groff BR, & Wilson TW (2018). Frontoparietal Networks Mediate the Behavioral Impact of Alpha Inhibition in Visual Cortex. Cereb Cortex. [DOI] [PMC free article] [PubMed] [Google Scholar]
- Wiesman AI, Heinrichs-Graham E, McDermott TJ, Santamaria PM, Gendelman HE, & Wilson TW (2016). Quiet connections: Reduced fronto-temporal connectivity in nondemented Parkinson’s Disease during working memory encoding. Hum Brain Mapp. [DOI] [PMC free article] [PubMed] [Google Scholar]
- Wiesman AI, Heinrichs-Graham E, Proskovec AL, McDermott TJ, & Wilson TW (2017). Oscillations during observations: Dynamic oscillatory networks serving visuospatial attention. Hum Brain Mapp, 38(10), 5128–5140. [DOI] [PMC free article] [PubMed] [Google Scholar]
- Wiesman AI, Mills MS, McDermott TJ, Spooner RK, Coolidge NM, & Wilson TW (2018). Polarity-dependent modulation of multi-spectral neuronal activity by transcranial direct current stimulation. Cortex, 108, 222–233. [DOI] [PMC free article] [PubMed] [Google Scholar]
- Wiesman AI, O’Neill J, Mills MS, Robertson KR, Fox HS, Swindells S, et al. (2018). Aberrant occipital dynamics differentiate HIV-infected patients with and without cognitive impairment. Brain. [DOI] [PMC free article] [PubMed] [Google Scholar]
- Wilson TW, Proskovec AL, Heinrichs-Graham E, O’Neill J, Robertson KR, Fox HS, et al. (2017). Aberrant Neuronal Dynamics during Working Memory Operations in the Aging HIV-Infected Brain. Sci Rep, 7, 41568. [DOI] [PMC free article] [PubMed] [Google Scholar]
- Womelsdorf T, & Fries P (2007). The role of neuronal synchronization in selective attention. Curr Opin Neurobiol, 17(2), 154–160. [DOI] [PubMed] [Google Scholar]