

Abstract
Native electrospray mass spectrometry is a powerful method for determining the native stoichiometry of many polydisperse multi-subunit biological complexes, including multi-subunit protein complexes and lipid-bound transmembrane proteins. However, when polydispersity results from incorporation of multiple copies of two or more different subunits, it can be difficult to analyze subunit stoichiometry using conventional mass spectrometry analysis methods, especially when m/z distributions for different charge states overlap in the mass spectrum. It was recently demonstrated by Marty and co-workers (Hoi, K.K. et al., Anal. Chem. 2016, 88, 6199–6204) that Fourier Transform (FT)-based methods can determine the bulk average lipid composition of protein-lipid Nanodiscs assembled with two different lipids, but a detailed statistical description of the composition of more general polydisperse two-subunit populations is still difficult to achieve. This results from the vast number of ways in which the two types of subunit can be distributed within the analyte ensemble. Here, we present a theoretical description of three common classes of heterogeneity for mixed-subunit analytes and demonstrate how to differentiate and analyze them using mass spectrometry and FT methods. First, we first describe FT-based analysis of mass spectra corresponding to simple superpositions, convolutions, and multinomial distributions for two or more different subunit types using model data sets. We then apply these principles with real samples, including mixtures of single-lipid Nanodisc in the same solution (superposition), mixed-lipid Nanodiscs and copolymers (convolutions), and isotope distribution for ubiquitin (multinomial distribution). This classification scheme and the FT method used to study these analyte classes should be broadly useful in mass spectrometry as well as other techniques where overlapping, periodic signals arising from analyte mixtures are common.
Keywords: mass spectrometry, deconvolution, heterogeneity, polydispersity, Fourier Transform
Introduction
Multi-subunit, polydisperse complexes, such as multivalent protein-ligand complexes and membrane protein-lipid complexes, are essential for the function and structure of all organisms.1–4 Native electrospray ionization mass spectrometry (ESI-MS), in which large, non-covalent complexes are transferred intact into the gas phase, is a powerful technique for determining the native stoichiometry of many such biomolecular complexes.5–18 Developments in MS methodology and spectrum analysis tools have made it possible to characterize stoichiometry distributions even for polydisperse populations of complexes.7,19–29 However, in cases where the polydispersity is exceptionally high, varies for different charge states, or arises from a distribution in the stoichiometry of two or more different subunits, the mass spectrum can be exceedingly difficult to analyze, as the ESI source produces overlapping charge state distributions sometimes comprising tens or even hundreds of peaks.7,18,23,29,30
Multiple alternative methods have been developed to facilitate the analysis of highly polydisperse samples, including Fourier Transform (FT)-based algorithms,7,18–20,31 m/z-domain deconvolution algorithms,23,25,29,32,33 comb filters,29,33 and macromolecular mass defect analysis (akin to Kendrick mass defect analysis for polymers).34–36 Commonly used mass spectral-domain deconvolution algorithms typically require user optimization of the algorithm and input of accurate guesses at several parameters describing the mass distribution. Macromolecular mass defect analysis can be used to characterize samples with multiple subunits when mass resolution is high,36 and the commercial software package PMI has been shown to perform well in deconvolving mass spectra of pharmaceutically-relevant polydisperse ion populations29 Conversely, FT-based mass deconvolution can often be achieved with little to no initial parameter guessing even when resolution is relatively low, as was recently shown for a sample of intact lipoprotein Nanodiscs containing over 300 lipids19 and for bacterial toxin complexes embedded in nearly intact detergent micelles.18 Furthermore, Marty and co-workers recently demonstrated that FT methods can quantify the average subunit composition for Nanodisc ions containing two different lipid types.35 In that study, an iterative FT approach was used to determine an average subunit mass from the entire Nanodisc mass spectrum, and it was revealed that this measurement reflected the bulk lipid mole fractions of the mixture used to synthesize the Nanodiscs.
While it may seem intuitive that methods such as FT could be used to determine the average bulk composition of polydisperse ions containing two or more types of subunits, a general method to determine the detailed subunit composition distribution has not been developed. From a mathematical perspective, mixed-subunit populations can fall into many different “classes”, depending on how the different subunit types are distributed, and, a priori, different classes may not be amenable to the same analysis methods. As a familiar example, an ion’s natural isotope mass distribution arises from a mixture of different combinations of isotopes of each constituent atom, and the number of each type of atom is fixed. By contrast, individual Nanodiscs within a mixed-lipid Nanodisc sample can have both different lipid composition and different total numbers of lipids, giving rise to a composition analysis problem that is fundamentally different from that of natural isotope distributions. Here, we illustrate how three important classes of mixed-subunit ion populations can be treated with FT deconvolution methods. In addition to demonstrating the theoretical utility and limitations of using FT on three different types of classes (simple superpositions, convolutions, and multinomial distribution), we demonstrate how FT-based composition analysis can be used to infer information about the self-assembly mechanism of Nanodiscs.
Methods
Sample Preparation.
A single-sample panel of Nanodiscs containing palmitoyloleoylphosphatidylcholine (POPC), dipalmitoylphosphatidylcholine (DPPC) or both were prepared according to a method adapted from that of Sligar and co-workers.37,38 Briefly, all lipids were purchased from Avanti Polar Lipids as 5 mg/mL solutions in chloroform, dried until opaque with dry nitrogen gas, and re-suspended to a final concentration of 50 mM in a pH 7.4 aqueous buffer containing 100 mM sodium cholate (Sigma-Aldrich), 20 mM Tris (Bio-Rad), 100 mM sodium chloride, and 0.5 mM ethylenediaminetetraacetic acid (EDTA). Membrane scaffold protein MSP1D1 (Sigma-Aldrich) was reconstituted in pH 7.4 aqueous buffer (20 mM Tris, 100 mM sodium chloride, 0.5 mM EDTA, 0.01% sodium azide) to a concentration of ~200 μM. Lipid suspensions were mixed with MSP1D1 solutions and additional buffer to a final concentration 50 μM in MSP1D1 and appropriate lipid concentrations. These concentrations were 3.38 mM for pure POPC; 4.5 mM for pure DPPC; and 4.22 mM, 3.94 mM, and 3.66 mM for 75/25, 50/50, and 25/75 percent mixtures of DPPC/POPC respectively. The concentrations for these lipid mixtures were based on a weighted measurement of the expected number of each type of lipid per scaffold protein in well-formed, pure-lipid Nanodiscs (90:1 and 67.5:1 lipid:MSP1D1 for DPPC and POPC, respectively). The pure lipid stocks were mixed in the desired ratios and sonicated for an additional 30 minutes before adding MSP1D1 stock. Samples were incubated for 1 hr at 20 °C, and Nanodisc self-assembly was initiated by cholate removal through dialysis. To aid self-assembly, BioBeads SM-2 (Bio-Rad) were placed in the dialysis buffer (20 mM Tris, 100 mM sodium chloride, and 0.5 mM EDTA), which was stirred constantly overnight. Nanodisc samples were buffer-exchanged into 200 mM ammonium acetate (Sigma-Aldrich) at pH 7.0 using Micro Bio-Spin 6 columns (Bio-Rad) immediately before MS analysis.
Poly(ethylene glycol)-block-poly(propylene glycol)-block-poly(ethylene glycol) (PEG-PPG-PEG) was purchased from Sigma-Aldrich (product number 412325) and used without further purification. The polymer was solubilized to a concentration of 0.5 mg/mL in ultra-pure (18.0 MΩ) water. Bovine ubiquitin (Ubq) was purchased from Sigma-Aldrich and used without further purification. Aqueous Ubq solutions were prepared containing 25 μM Ubq and 200 mM ammonium acetate.
Mass Spectrometry.
All mass spectrometry analysis was performed with a Synapt G2-Si ion mobility mass spectrometer (Waters Corp.) using a static nanoelectrospray ionization (nanoESI) source. NanoESI emitters were prepared by pulling borosilicate capillaries (ID 0.78 mm, Sutter Instruments) to a tip ID of ~1 μm using a Flaming-Brown P-97 micropipette puller (Sutter Instruments). For each sample, ~3–5 μL of solution was loaded into an emitter, which was placed approximately 3–5 mm from the entrance of the mass spectrometer. A platinum wire inserted into the solution was used to apply an electrical potential of 0.6–1.0 kV relative to instrumental ground to initiate electrospray. Argon was used as the collision gas at a flow rate of 5 mL min−1 for all experiments. For Nanodisc samples, the Trap and Transfer collision voltage were set to 100 and 5 V, respectively, and the m/z acquisition range was 100 to 32,000. Both the Sample Cone and Source Offset were set to 25 V, and mass spectra were signal-averaged for 20 minutes. For polymer mass spectra, samples were sprayed from ultrapure water (resistivity 18.0 MΩ/cm). Trap and Transfer collision voltage were set to 10 and 5 V, respectively, and the m/z acquisition range was 100 to 8,000. The Sample Cone and Source Offset were both set to 25 V, and mass spectra were signal-averaged for 5 minutes. For the Ubq sample, the Trap and Transfer collision voltage were set to 10 and 5 V, respectively, and the m/z acquisition range was 100 to 5,000. The Sample Cone and Source Offset were both set to 25 V, and the mass spectrum was signal-averaged for 2 minutes. m/z calibration was performed using CsI cluster ions formed by nanoelectrospray of 100 mM aqueous CsI solution.
Data deconvolution.
All FT-based mass spectrum deconvolution analysis was performed using the Prell group’s home-built program, iFAMS (interactive Fourier-Transform Analysis for Mass Spectrometry) v. 5.2, available as open-source Python code at https://github.com/prellgroup/iFAMS.
Theory
Background: FT-based analysis of mass spectrum for single-subunit ion population.
The principles behind the FT method for characterizing polydisperse samples containing a single subunit have been explained in detail elsewhere7 and therefore will only be briefly described here. The mass spectrum (s(m/z)) of a polydisperse sample attributed to a particular charge state, Z, can be mathematically described in terms of three distinct functions: a comb, c(m/z), of delta functions, characterized by the spacing of each mass spectral peak (i.e., the mass of the repeated subunit divided by Z); a peak shape function, p(m/z), which describes the average shape of each peak in the comb with charge state Z; and an envelope function, e(m/z), which describes the relative abundances of each of the peaks with charge state Z, i.e., it is represents the subunit stoichiometry distribution. We then have:
where * represents convolution, and • represents multiplication.
According to the Fourier Convolution Theorem, the FT of the mass spectrum, FT[s(m/z); k] = S(k) is
S(k) is itself a sequence of equally spaced peaks at integer multiples of a frequency equal to the inverse of the spacing of the comb function c(m/z), i.e., Z divided by the subunit mass. By linearity of FT, sequential charge states produced by ESI results in a sequence of equally spaced peaks in the Fourier domain, where the spacing between adjacent peaks is inversely proportional to the mass of the repeated subunit. Finally, peaks in the frequency domain can then be isolated and inverse Fourier transformed to reveal the envelope function, e(m/z), for each charge state, which allows one to determine charge state specific polydispersity (and other mass statistics) in the mass spectrum.
Classes of ion populations containing two or more types of repeated subunit.
The presence of a second type of repeated subunit in the analyte population can significantly complicate the analysis of a mass spectrum, and it should be emphasized that there are a very large number of ways in which even just two repeated subunits can be distributed. Three important classes of subunit distributions are represented in Fig. 1 as modeled mass spectra along with their corresponding Fourier spectra, and these classes are described below in greater detail. One of the simplest classes of polydisperse mixed-subunit analyte populations arises from mixing two non-interacting (on the time-scale of the experiment), single-subunit populations together (see Fig. 1A). The mass spectrum of such an ion population is described by
where Stot(k) = FT[stot(m/z); k], S1(k) = FT[s1(m/z); k], and S2(k) = FT[s2(m/z); k]. That is, both the mass spectrum and its Fourier transform (due to the linearity of FT) are simple superpositions of those belonging to the individual single-subunit populations. We refer to this hereafter as a “Class I” (simple superposition) population and note that it can be easily generalized to multiple subunits by similar reasoning.
Figure 1.
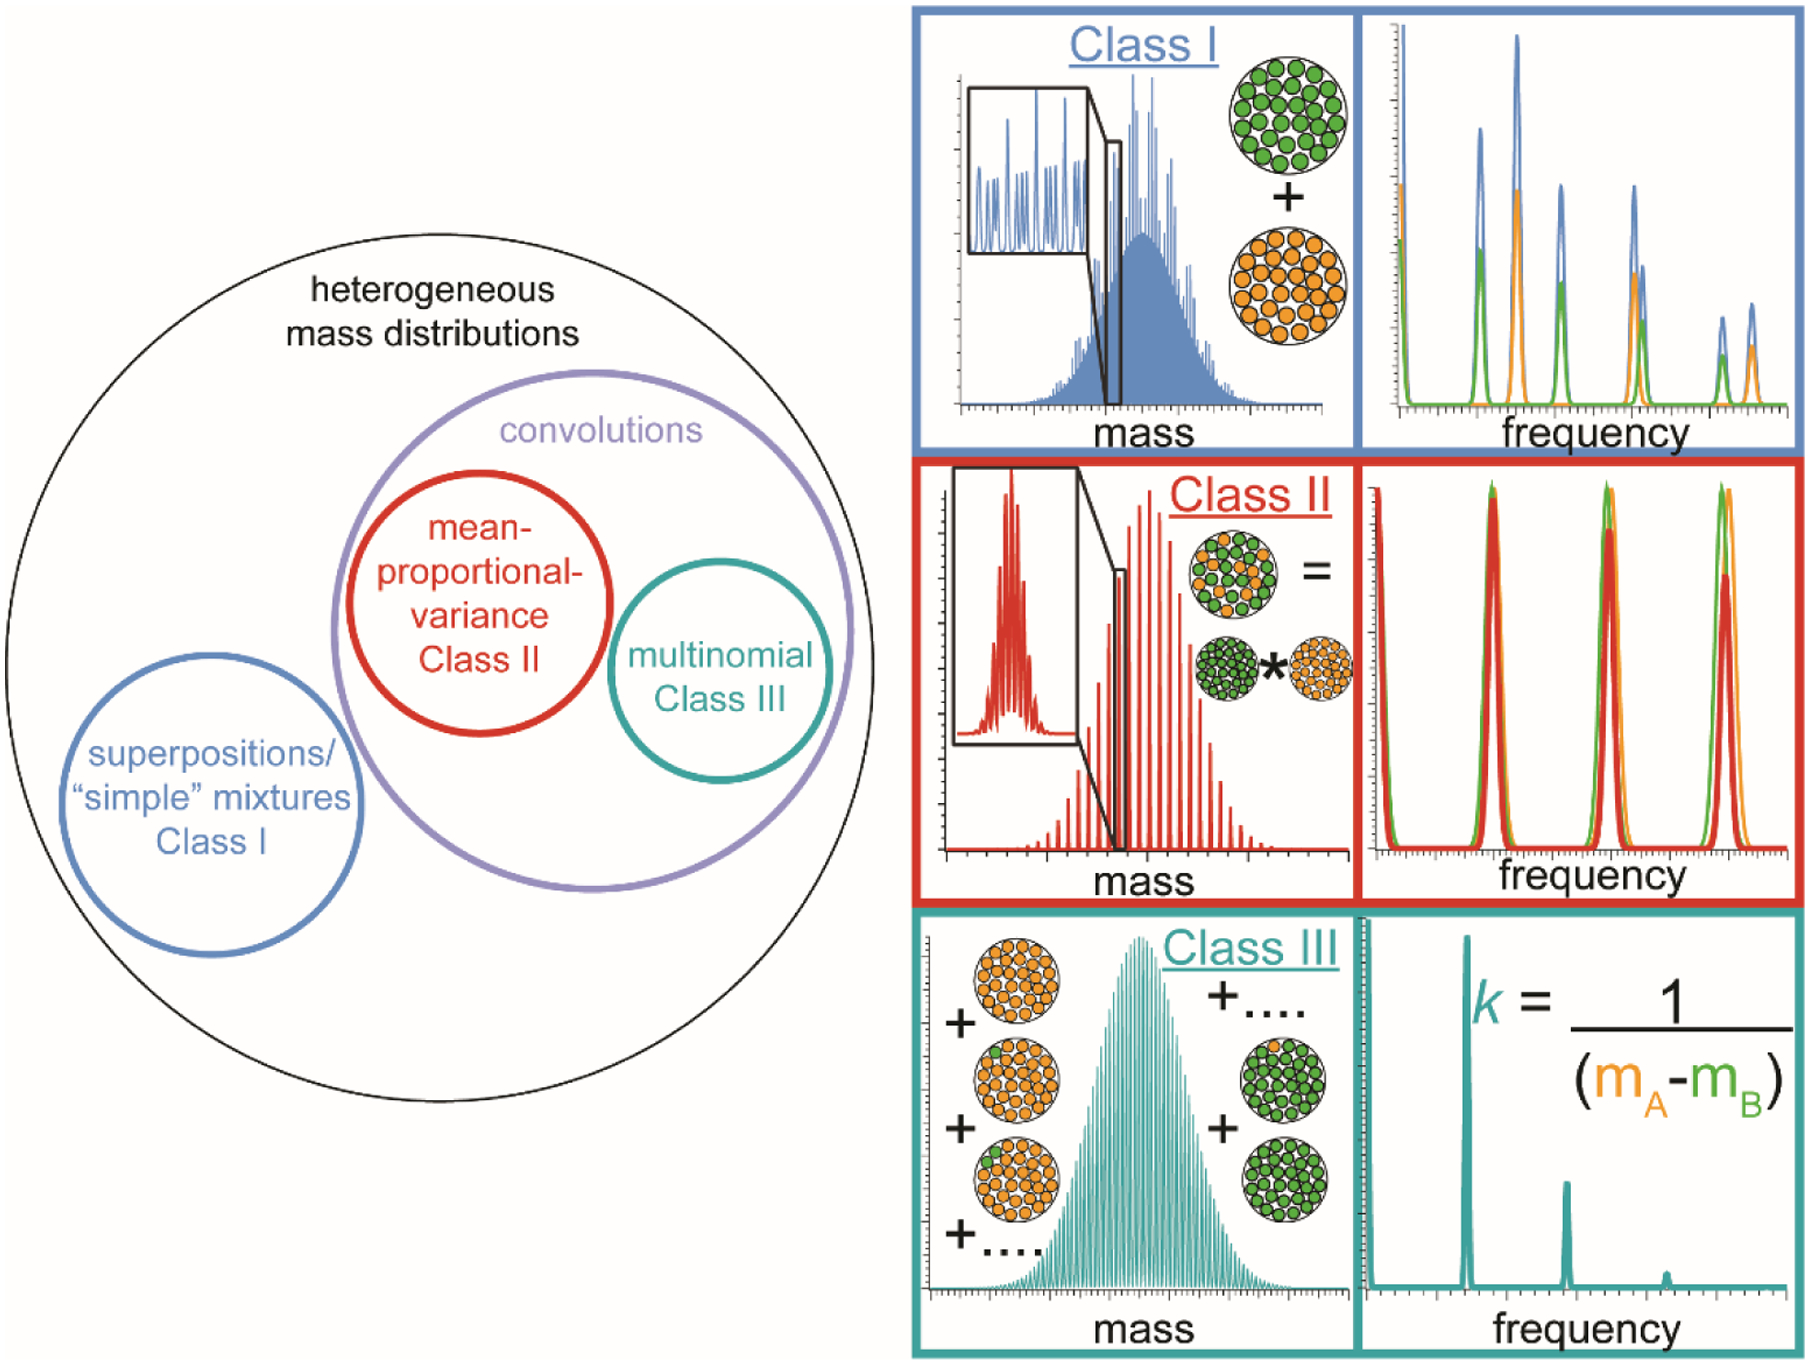
Left: Schematic representation showing the relationship between heterogeneity classes of mixed-subunit populations (see text). Right: model mass spectra and corresponding Fourier spectra for different classes of heterogeneous ion populations containing two different types of repeated subunit (shown as green and orange circles inset in mass spectra). For each class, orange and green traces in Fourier spectra represent underlying signal due to each subunit type, whereas traces of the same color as the corresponding mass spectrum represent the expected Fourier spectrum of the total ion population. For Class I, the total Fourier spectrum is the sum of the underlying pure-subunit spectra; for Class II, the total Fourier spectrum is the product of the underlying pure-subunit spectra; and for Class III, the total Fourier spectrum has a fundamental frequency that is independent of the bulk mole fractions of the two subunits and depends only on their monomer masses.
In sharp contrast, many other common heterogeneous ion populations arise from assembly of two or more types of subunit together into complexes, whether covalent (e.g., random copolymers) or non-covalent (e.g., phospholipid Nanodiscs). While there is a very large number of subunit stoichiometry distributions that can result, two particularly important extremes for which FT-based stoichiometry distribution is possible are 1) those for which the stoichiometry distribution of the resulting ion population can be described as the convolution of the underlying stoichiometry distributions of the individual subunit types (see Fig. 1B) and 2) those for which the total number of subunits is fixed (see Fig. 1C). We refer to these as “Class II” and “III” populations throughout the manuscript.
Figure 2.

Mass spectra and corresponding Fourier spectra of Nanodiscs assembled with DPPC (A and B), POPC (C and D), and both single-lipid Nanodisc samples mixed together (E and F) in equimolar ratios, all acquired under identical instrumental conditions. Dotted lines in Fourier spectra provide a guide to the eye to see that the mixed-Nanodisc spectrum is indeed a superposition of the two single-lipid Nanodisc spectra.
A common example of a Class II population is a linear block copolymer in which each block is inherently polydisperse, and each block’s monomer number is independent of those of the other blocks in the same polymer. The subunit stoichiometry distribution of the whole block copolymer population is, in this case, a convolution of the stoichiometry distributions of each block. For a block copolymer consisting of two types of subunit, for each charge state Z, we thus can thus decompose the mass spectrum stot(m/z) in terms of two underlying mass spectra, s1(m/z) and s2(m/z):
and therefore,
That is, the FT of the total ion spectrum is the product of the underlying mass spectra for each subunit type with charge state Z. This can be straightforwardly generalized to three or more types of subunit within the block copolymer (a modeled data set for the convolution of three different subunits is demonstrated in the supplementary information in Fig. S1).
Common examples of Class III populations range from isotope distributions of an ion to protein complexes comprising different isoforms with identical incorporation probabilities. Class III populations have in common that their abundance distribution for a given charge state follows a multinomial distribution with respect to the ensemble average incorporation probability of each subunit type. For a Class III population consisting of just two types of subunit, the mass spectrum can be described by
for each m/z corresponding to an ion containing nA of subunit A and nB (= ntot – nA) of subunit B with probabilities pA and pB (= 1 – pA), respectively. This distribution is equivalent to an ntot-fold autoconvolution of a distribution having just two peaks at m/z values mA/Z and mB/Z with relatively abundances pA and pB, respectively. Thus the FT of s(m/z) is simply the ntot power of the FT of this simple two-peak spectrum. (Again, this idea can be generalized quite easily to compute the isotope distribution of any molecule from the natural abundances of its constituent atoms according to their individual stoichiometries.)
A priori, one might expect that Class II mass distributions should often be much broader and have denser peaks spacing than Class III mass distributions, but it can be difficult to distinguish the two from one another or from Class I mass distributions simply by visual inspection of the mass spectrum, especially with relatively low resolution. However, for Class III ion populations, the frequency-domain spacing between the fundamentals corresponding to each charge state Z is simply
Importantly, this frequency spacing is independent of the probabilities pA, pB, etc., in stark contrast to Class II ion populations (see below).
Results and Discussion
Rationale for selected examples.
The questions arise how, without having to perform the impractical and/or highly time-consuming analysis of all the peaks directly in the mass spectral domain, one can determine whether a multi-subunit ion population belongs to Class I, II, or III (or none of these), and what statistics (such as average subunit composition, average ion size, and polydispersity) one can measure straightforwardly from the mass spectrum, even with poor resolution. To demonstrate how Fourier transform can discern between the different types of multi-subunit populations, and to illustrate the type of unique information that can be learned from this analysis, the following samples were used: a mixture of two separately-prepared, single-lipid Nanodisc populations (Class I); mixed-lipid Nanodisc (Class II); a block copolymer (Class II); and a monomeric protein (the isotope distribution of which represents Class III).
Class I mixture of single-subunit Nanodiscs (simple superposition).
For Class I ion populations, the distribution of peaks in the mass spectrum is a superposition of the underlying mass spectra belonging to each type of analyte. Due to the linearity of FT, the Fourier spectrum is therefore a superposition of the underlying Fourier spectra of each type of analyte, and the positions of peaks in the Fourier spectrum do not change for the mixture. An example of the mass spectrum of a Class I mixture of single-lipid Nanodiscs and its corresponding Fourier spectrum, acquired under moderately activating conditions where fewer than 20 lipids are expected to have dissociated from the Nanodiscs, are shown in Fig. 2. The two Nanodisc populations were separately prepared using different lipids (POPC and DPPC), then mixed in approximately equal molar ratios immediately before analysis with nESI-MS. While it is difficult to see that the mass spectrum itself is a ~1:1 superposition of the mass spectra of pure POPC and DPPC Nanodiscs, acquired under identical instrumental conditions, it is clear that the corresponding Fourier spectrum is such a superposition, especially with increasing harmonic number, where better peak resolution is achieved than for the fundamental peaks. (For comparison, mass-domain deconvolution using a comb filter, such as is available in UniDec and PMI software, is provided for all three mass spectra in Supplementary Figure S2.) Emphatically, peaks in the Fourier spectrum do not occur at the bulk-mole-fraction-weighted average frequency of the POPC and DPPC Nanodisc peaks, in sharp contrast to results for Nanodiscs prepared from a 1:1 bulk mixture of POPC and DPPC lipids (see below) and to previous results for mixed-lipid (i.e., Class II) Nanodiscs.35 To test whether evidence of lipid exchange between the two Nanodisc populations could be found on the 1-hour timescale, mass spectra of the mixed-Nanodisc sample were continuously collected for 60 minutes immediately after mixing. Figs. 2E and 2F show the signal-averaged mass spectrum and its corresponding Fourier spectrum for the first 20 minutes, and analogous spectra for the 20–40 and 40–60 minute intervals are shown in Fig. S3. No significant differences in the Fourier spectra were observed, indicating no significant exchange of lipids between the two populations on the 1-hour timescale, in agreement with previous reports.39
Class II mixed-lipid Nanodiscs (convolution of composition distributions).
Fig. 3 shows the mass spectrum (A) and corresponding Fourier spectrum (B) for a Nanodisc sample prepared from a bulk mixture of POPC and DPPC in a molar ratio of 25%:75% POPC:DPPC, which is expected to result in Nanodiscs that both lipids (spectra of other molar ratios are shown in Fig. S4). A priori, because the assembly mechanism for Nanodiscs is not well understood, it is not clear whether this should result in Class II or III (or some other class) of heterogeneity. Class II heterogeneity would result from a Nanodisc assembly mechanism than can be approximated by two independent Poisson processes, i.e., in which the two different types of lipids add to the growing Nanodiscs via first-order kinetics with rate constants dependent on the initial bulk concentrations of the lipids. In this case, the distribution in the total number of lipids in the Nanodiscs should be a convolution of the (Poisson) distributions for the number of each lipid type contained in the Nanodisc. Because the convolution of two independent Poisson distributions is another Poisson distribution, and because the mean of a Poisson distributions is equal to its variance, this mechanism should result in Nanodiscs with approximately equal mean and variance in the total number of lipids. As has been previously observed in multiple studies of intact MSP1D1 Nanodiscs using native MS, the mean number of lipids is often ~120–180 (depending on lipid size or instrument used14) with a standard deviation of ~10–15 (i.e., a variance of ~100–225),7,23 so this mechanism is consistent with these observations. Similarly, larger MSP1E3D1 Nanodiscs typically contain ~270–350 lipids with a variance of ~225–400.19 A somewhat tedious but straightforward derivation (see Supplementary Information) shows that Fourier-domain peaks for such a Class II sample (where subunit stoichiometry variances are proportional to their means via a common constant) will be located at the bulk mole-fraction-weighted average frequencies characteristic of the two subunit types. Emphatically, if the variances of the subunit distributions are not simply proportional to their means via a common constant—which may be the case for many real samples—the frequency of peaks in the Fourier spectrum may have no simple relationship to their bulk mole fractions (see Supplementary Figure S5).
Figure 3.

Representative mass spectrum (A) and corresponding Fourier spectrum (B) for Nanodiscs assembled with 75% DPPC and 25% POPC. In contrast to the mixture of two single-lipid Nanodiscs mixed together (see Fig. 2), Nanodiscs assembled from a mixture of two lipids produces only a single series of peaks in the Fourier spectrum, whose spacing corresponds to the variance-weighted average subunit mass. Panel (C) shows average subunit mass measured for mixed DPPC/POPC Nanodiscs assembled using five different lipid bulk mole fractions. Error bars represent one standard deviation due to uncertainty in the Fourier fundamental frequency determination, and dotted lines represents perfect agreement between measured and bulk mole fractions.
Fig. 3C shows that frequencies in the Fourier spectra for all five of the bulk concentration ratios tested for POPC and DPPC do indeed fall very close (within one standard deviation, based on uncertainty of the frequency measurement) to the bulk mole-fraction-weighted average frequencies expected for a sample with the Class II heterogeneity described above, i.e., with variance-proportional means. (The underlying standard deviations in lipid number due to each lipid type can be quickly estimated by dividing the measured total lipid number variance7 between the two lipids according to the observed frequency, then taking square roots; for the data in Fig. 3, these standard deviations are ~9 and 5 lipids for DPPC and POPC, respectively.) This result is consistent with previously reports for other mixed-lipid Nanodiscs by Marty and coworkers.35 Observation of this relationship, which should occur for variance-proportional stoichiometry means, for many different lipid mixtures therefore strongly supports a Nanodisc formation mechanism that proceeds by independent, first-order addition of lipids with minimal back-exchange of lipids40 until the Nanodiscs are “full”. Thus, the observed Nanodisc compositions are thus kinetically trapped and likely do not equilibrated on the timescale of these experiments (several minutes to several hours), a finding that has important implications for experiments using mixed-lipid Nanodiscs to study recruitment of lipids by membrane proteins.
Class III mixed-lipid Nanodiscs (hypothetical equilibrated Nanodiscs with fixed number of lipids per Nanodisc).
Class III heterogeneity, in stark contrast, would be associated with a mechanism whereby fully formed ions equilibrate with one another by exchange of subunits before MS analysis, but always end up containing the same total number of subunits. For Nanodiscs containing two types of similar-sized lipids, the resulting composition distribution would be expected to be nearly binomial, and the variances in the distribution of each lipid would be nearly identical and independent of the bulk lipid mole fractions. Viewed another way, if “full” Nanodiscs always contain exactly ntot lipids of type A or B, any lipid within a Nanodisc that is not lipid type A must be type B, thus the A and B lipid distributions within the Nanodiscs must have equal variances even if their means are different. As described in the Theory section, the corresponding Class III Fourier spectrum would then have a fundamental frequency equal to the inverse of the difference between the two masses (e.g., 26 Da for POPC and DPPC) regardless of bulk composition. (For comparison, Supplementary Figure S5 illustrates reconstructed subunit mole fractions for Class III ion population when erroneously assuming the mean-proportional-variance condition, and Supplementary Figure S6 contains a simulated mass spectrum and corresponding Fourier spectrum for a hypothetical Class III Nanodisc population, highlighting its differences from those of a Class II population.) The sharp contrast between this result and the experimental results shown in Fig. 2 lends further support to the mechanism of mixed-lipid Nanodisc formation described in the previous section. Together with the Class I mixture results described above, these results indicate that the FT method can straightforwardly distinguish between Class I, II, and III heterogeneity, even in cases where the bulk average subunit composition is the same. For Class III systems, the major constraint is that the total number of subunits is constant. Thus, in probing the composition of a suspected Class III ion population with labile subunits using the FT methods described here, it is important to keep the activating conditions as low as possible to avoid the problem of significantly altering the composition or total stoichiometry of the ions.
Class II triblock copolymer (convolution of polydisperse composition distributions).
Similar reasoning described above for Class II mixed-lipid Nanodiscs can be used to understand the mass spectra and corresponding Fourier spectra of many block copolymers formed by growing each successive block off pre-existing, polydisperse blocks. In many realistic cases, the exact size of each block will be uncorrelated with the exact size of the other component blocks, resulting in an overall copolymer length distribution that is the convolution of the block length distributions of each monomer type. Large polymers often exhibit high polydispersity, which has interesting consequences for the corresponding Fourier spectrum. An ESI mass spectrum for a PEG:PPG:PEG linear triblock copolymer sample is shown in Fig. 4. Intriguingly, the first observed peak at positive frequency in the corresponding Fourier spectrum occurs near the respective 3rd and 4th harmonic of the 3+ charge state corresponding to PEG and PPG, respectively, with essentially no discernable signal at lower frequencies. The reason that lower-frequency peaks, closer to the PEG and PPG fundamental frequencies, are not observed is that the polydispersity of the constituent PEG and PPG blocks is so large that the corresponding Fourier-domain peaks are too narrow to overlap significantly for any lower-order harmonics and happen to nearly coincide for these harmonics (and multiples thereof; see Supplementary Information for a mathematical derivation of this result). From the observed Fourier-domain frequencies, and assuming mean-proportional variances for the distributions of the monomers, the ratio of the average number of monomers incorporated into the block copolymers is determined to be ~4.4:1 PEG:PPG. Combined with the mean mass of 8370 Da for the copolymer population determined by Gábor Transform analysis20 in iFAMS (see Fig. 4C), this ratio corresponds to an average mass of 6810 ± 880 Da for the PEG blocks and 1560 ± 420 Da for the PPG blocks. The ~4.4:1 ratio is remarkably close to the manufacturer-reported average mass of 8400 Da and average composition of 3.8:1 PEG:PPG based on 1H-NMR analysis of the polymer sample. While a number of factors likely contribute to this discrepancy, including possible inclusion of short-chain polymer contaminants in the 1H-NMR data,20 purification of the PPG core before growth of the PEG blocks could also effect a lower variance:mean ratio of the PPG block length distribution relative to that of the PEG blocks. This would result in a slightly higher PEG:PPG ratio being determined using the FT-based mass spectrometry method described here based on the assumption of mean-proportional variances of the monomer distributions. Results of this analysis are summarized in Table 1.
Figure 4.

Deconvolved mass spectrometry data for poly(ethylene glycol)-block-poly(propylene glycol)-block-poly(ethylene glycol) (PEG-PPG-PEG, 8.4 kDa manufacturer-reported average molecular weight). Mass spectrum with reconstructed charge-state specific distributions shown by colored traces (A), corresponding Fourier spectrum (B), and deconvolved zero-charge spectrum (C), with colors in A and C representing charge states of the same color as in the inset in B. Black trace in (C) shows the summation of data from all charge states, i.e., the deconvolved “zero-charge” mass spectrum. Corresponding Gábor spectrogram (D), which is used to aid signal isolation for reconstructing the charge-state specific distributions in A and C.
Table 1.
Total and monomer-specific polydispersity characterization of ~8.4 kDa poly(ethylene glycol)-block-poly(propylene glycol)-block-poly(ethylene glycol) ions using the FT-based method described in the text
| PEG monomer mass (Da) | PPG monomer mass (Da) | Measured average monomer mass (Da) | % total polymer length variance due to PEG | % total polymer length variance due to PPG |
|---|---|---|---|---|
| 44.0516 | 58.0079 | 46.65 | 81.4 | 18.6 |
| Measured average mass of polymer population (Da) | Recovered average PEG mass in triblock polymer (Da) | Recovered average PPG mass in triblock polymer (Da) | ||
| 8370 ± 970 | 6810 ± 880 | 1560 ± 420 |
Class III isotope distributions (multinomial mass distributions).
As is well known, for an ion with chemical formula AnABnBCnC…, where A, B, C, … are elements, and nA, nB, nC, … are the stoichiometries of each element (assumed to have natural or other well-defined bulk isotope abundance distributions), the relative abundance of the isotopomer of the ion with total mass
where nAi and mAi are the respective stoichiometry and mass of the ith isotope of element A, etc., is
where the terms in parentheses are multinomial coefficients, and pAi is the relative bulk abundance of the ith isotope of element A, etc. The FT spectrum of this isotope distribution is simply the product of nA of the FT of element A’s bulk isotope abundance spectrum times nB of that for element B, times nC of that for element C, etc.41,42 Because the total number of atoms in the ion is fixed, this is in fact an example of Class III heterogeneity, where the repeated subunits are simply different isotopes. Fig. 5 shows an isotope-resolved experimental mass spectrum of (ubiquitin + 6H)6+ as well as its corresponding predicted mass spectrum from the Fourier analysis. The Fourier spectrum is predicted using pre-computed Fourier spectra for its constituent atom (C, N, O, S, and H) natural isotope distributions using ubiquitin’s chemical formula, C378H629N105O118S1 (based on its amino acid sequence), and assuming natural bulk isotope abundances. The Fourier spectrum of even this relatively large (8.6 kDa) ion can be computed quickly (<1 s), and a version of iFAMS incorporating this isotope calculation tool, including the ability to input amino acid sequences, will soon be released via our Github page. Especially for proteins and other large ions, this can be extremely advantageous over conventional mass spectral-domain methods relying on direct convolution, because pointwise products are much faster to compute than convolutions, and is inherently much more accurate than low-order polynomial approximations to the direct convolution. The resolution of the predicted exact mass spectrum is limited only by the maximum frequency included in the pre-computed Fourier spectra for the constituent atoms, thus it trivial to predict mass spectra in this manner to essentially arbitrary resolution (including isotope fine structure) at minimal computational expense. While using FT to model isotope distributions is not new, the logic and mathematics behind this concept can also be applied to complex ions formed from subunits with exchangeable variants whose total number is fixed. This could occur, for example, in an ensemble of complexes containing one or more proteins with isoforms or post-translational modifications (PTMs) that do not affect the stability of the complex and are randomly incorporated in the condensed phase. In this case, the mass distribution of the isoforms/PTMs would take the place of the isotope mass distribution for a particular atom type, and the expected total mass distribution can be calculated by FT in the same way as the total isotope distribution for a simple ion.
Figure 5.

Ubiquitin isotope distribution calculated using FT method described in text (red) and measured by mass spectrometry using its 5+ (protonated) charge state (blue). Experimental data are integrated peak values, relative abundances are normalized to the greatest abundance in each spectrum, and error is calculated as the difference in relative abundance between the experimental and calculated values for each isotope peak. Total computational time for calculated mass spectrum was 0.57 s.
Conclusions
Analytes exhibiting dispersity resulting from incorporation of two or more different repeated subunits can be extremely challenging to study by conventional mass spectrometry analysis methods. This challenge arises not only from the overlap of, potentially, 10’s to 100’s of peaks in the mass spectrum, but also from the vast number of possible subunit compositions distributions. Here, we have described three major classes of ion heterogeneity and outlined what information can or cannot be reliably obtained from FT-based analysis of the corresponding mass spectra. Especially important to the study of mixed-subunit populations that represent convolutions of underlying subunit stoichiometry distributions, such as mixed-lipid Nanodiscs or block copolymers, the information most directly represented in the Fourier spectrum for Class II ion populations is actually the relative variances of the subunit distributions rather than their means, and care should be therefore exercised in interpreting the mass spectra of Class II ions by this method. Conversely, adherence of Class II ion populations to a mean-proportional-variance model across a variety of bulk subunit compositions can, perhaps unexpectedly, provide intriguing clues as to the assembly mechanism of the analyte ensemble. By the same token, deviations from this model may indicate equilibration of the ion population by exchange of subunits, interaction between subunits, or other complex behavior. In the future, it is expected that mass spectrometry analysis of complex ion populations using the FT-based methods described here will become a powerful route for studying assembly mechanisms that are difficult to access simply from the bulk average ratio of subunit stoichiometries measured by conventional techniques, such as NMR headgroup analysis, FT-IR spectroscopy, or digestion-based methods that are vulnerable to losing information about the variety of intact complexes in a sample.
Supplementary Material
Acknowledgments
Research reported in this publication was generously supported by the National Science Foundation (award number CHE-1752994) and the National Institute of Allergy and Infectious Diseases (award number R21AI125804). The content is solely the responsibility of the authors and does not necessarily represent the official views of the National Science Foundation or the National Institutes of Health.
Footnotes
Conflict of Interest
The authors declare no conflict of interest.
References
- 1.Clifton LA; Hall SCL; Mahmoudi N; Knowles TJ; Heinrich F; Lakey JH “Structural Investigations of Protein–Lipid Complexes Using Neutron Scattering.” In Lipid-Protein Interactions: Methods and Protocols; Kleinschmidt JH, Ed.; Springer New York: New York, NY, 2019, p 201. [DOI] [PubMed] [Google Scholar]
- 2.Gupta K; Li J; Liko I; Gault J; Bechara C; Wu D; Hopper JTS; Giles K; Benesch JLP; Robinson CV “Identifying key membrane protein lipid interactions using mass spectrometry.” Nat. Protoc 2018, 13, 1106. [DOI] [PMC free article] [PubMed] [Google Scholar]
- 3.Montenegro FA; Cantero JR; Barrera NP “Combining Mass Spectrometry and X-Ray Crystallography for Analyzing Native-Like Membrane Protein Lipid Complexes.” Front. Physiol 2017, 8, 892. [DOI] [PMC free article] [PubMed] [Google Scholar]
- 4.Sarkar D; Singh Y; Kalia J “Protein–Lipid Interfaces Can Drive the Functions of Membrane-Embedded Protein–Protein Complexes.” ACS Chem. Biol 2018, 13, 2689. [DOI] [PMC free article] [PubMed] [Google Scholar]
- 5.Barrera NP; Isaacson SC; Zhou M; Bavro VN; Welch A; Schaedler TA; Seeger MA; Miguel RN; Korkhov VM; van Veen HW; Venter H; Walmsley AR; Tate CG; Robinson CV “Mass Spectrometry of Membrane Transporters Reveals Subunit Stoichiometry and Interactions.” Nat. Methods 2009, 6, 585. [DOI] [PMC free article] [PubMed] [Google Scholar]
- 6.Campuzano IDG; Netirojjanakul C; Nshanian M; Lippens JL; Kilgour DPA; Van Orden S; Loo JA “Native-MS Analysis of Monoclonal Antibody Conjugates by Fourier Transform Ion Cyclotron Resonance Mass Spectrometry.” Anal. Chem 2018, 90, 745. [DOI] [PubMed] [Google Scholar]
- 7.Cleary SP; Thompson AM; Prell JS “Fourier Analysis Method for Analyzing Highly Congested Mass Spectra of Ion Populations with Repeated Subunits.” Anal. Chem 2016, 88, 6205. [DOI] [PubMed] [Google Scholar]
- 8.Heck AJR; van den Heuvel RHH “Investigation of Intact Protein Complexes by Mass Spectrometry.” Mass Spectrom. Rev 2004, 23, 368. [DOI] [PubMed] [Google Scholar]
- 9.Laganowsky A; Reading E; Hopper JTS; Robinson CV “Mass Spectrometry of Intact Membrane Protein Complexes.” Nat. Protoc 2013, 8, 639. [DOI] [PMC free article] [PubMed] [Google Scholar]
- 10.Loo JA “Electrospray Ionization Mass Spectrometry: a Technology for Studying Noncovalent Macromolecular Complexes.” Int. J. Mass Spectrom 2000, 200, 175. [Google Scholar]
- 11.Robinson CV; Chung EW; Kragelund BB; Knudsen J; Aplin RT; Poulsen FM; Dobson CM “Probing the Nature of Noncovalent Interactions by Mass Spectrometry. A Study of Protein−CoA Ligand Binding and Assembly.” J. Am. Chem. Soc 1996, 118, 8646. [Google Scholar]
- 12.Zhang H; Cui WD; Gross ML; Blankenship RE “Native Mass Spectrometry of Photosynthetic Pigment-Protein Complexes.” FEBS Lett. 2013, 587, 1012. [DOI] [PMC free article] [PubMed] [Google Scholar]
- 13.Benesch JLP; Ruotolo BT “Mass Spectrometry: Come of Age for Structural and Dynamical Biology.” Curr. Opin. Struct. Biol 2011, 21, 641. [DOI] [PMC free article] [PubMed] [Google Scholar]
- 14.Campuzano IDG; Li H; Bagal D; Lippens JL; Svitel J; Kurzeja RJM; Xu H; Schnier PD; Loo JA “Native MS Analysis of Bacteriorhodopsin and an Empty Nanodisc by Orthogonal Acceleration Time-of-Flight, Orbitrap and Ion Cyclotron Resonance.” Anal. Chem 2016, 88, 12427. [DOI] [PMC free article] [PubMed] [Google Scholar]
- 15.Li HL; Wolff JJ; Van Orden SL; Loo JA “Native Top-Down Electrospray Ionization-Mass Spectrometry of 158 kDa Protein Complex by High-Resolution Fourier Transform Ion Cyclotron Resonance Mass Spectrometry.” Anal. Chem 2014, 86, 317. [DOI] [PMC free article] [PubMed] [Google Scholar]
- 16.Marty MT; Hoi KK; Gault J; Robinson CV “Probing the Lipid Annular Belt by Gas-Phase Dissociation of Membrane Proteins in Nanodiscs.” Angew. Chem.-Int. Edit 2016, 55, 550. [DOI] [PMC free article] [PubMed] [Google Scholar]
- 17.Sterling HJ; Williams ER “Origin of supercharging in electrospray ionization of noncovalent complexes from aqueous solution.” J. Am. Soc. Mass Spectrom 2009, 20, 1933. [DOI] [PMC free article] [PubMed] [Google Scholar]
- 18.Wilson JW; Rolland AD; Klausen GM; Prell JS “Ion Mobility-Mass Spectrometry Reveals That α-Hemolysin from Staphylococcus aureus Simultaneously Forms Hexameric and Heptameric Complexes in Detergent Micelle Solutions.” Anal. Chem 2019, 91, 10204. [DOI] [PMC free article] [PubMed] [Google Scholar]
- 19.Cleary SP; Li H; Bagal D; Loo JA; Campuzano IDG; Prell JS “Extracting Charge and Mass Information from Highly Congested Mass Spectra Using Fourier-Domain Harmonics.” J. Am. Soc. Mass Spectrom 2018, 29, 2067. [DOI] [PMC free article] [PubMed] [Google Scholar]
- 20.Cleary SP; Prell JS “Liberating Native Mass Spectrometry from Dependence on Volatile Salt Buffers by Use of Gábor Transform.” ChemPhysChem 2019, 20, 519. [DOI] [PubMed] [Google Scholar]
- 21.Keener JE; Zambrano DE; Zhang G; Zak CK; Reid DJ; Deodhar BS; Pemberton JE; Prell JS; Marty MT “Chemical Additives Enable Native Mass Spectrometry Measurement of Membrane Protein Oligomeric State within Intact Nanodiscs.” J. Am. Chem. Soc 2019, 141, 1054. [DOI] [PMC free article] [PubMed] [Google Scholar]
- 22.Marty MT; Baldwin AJ; Marklund EG; Hochberg GKA; Benesch JLP; Robinson CV “Bayesian Deconvolution of Mass and Ion Mobility Spectra: From Binary Interactions to Polydisperse Ensembles.” Anal. Chem 2015, 87, 4370. [DOI] [PMC free article] [PubMed] [Google Scholar]
- 23.Marty MT; Zhang H; Cui WD; Blankenship RE; Gross ML; Sligar SG “Native Mass Spectrometry Characterization of Intact Nanodisc Lipoprotein Complexes.” Anal. Chem 2012, 84, 8957. [DOI] [PMC free article] [PubMed] [Google Scholar]
- 24.Marty MT; Zhang H; Cui WD; Gross ML; Sligar SG “Interpretation and Deconvolution of Nanodisc Native Mass Spectra.” J. Am. Soc. Mass Spectrom 2014, 25, 269. [DOI] [PMC free article] [PubMed] [Google Scholar]
- 25.Morgner N; Robinson CV “Massign: An Assignment Strategy for Maximizing Information from the Mass Spectra of Heterogeneous Protein Assemblies.” Anal. Chem 2012, 84, 2939. [DOI] [PubMed] [Google Scholar]
- 26.Stengel F; Baldwin Andrew J.; Bush Matthew F.; Hilton Gillian R.; Lioe H; Basha E; Jaya N; Vierling E; Benesch Justin L. P. “Dissecting Heterogeneous Molecular Chaperone Complexes Using a Mass Spectrum Deconvolution Approach.” Chem. Biol 2012, 19, 599. [DOI] [PMC free article] [PubMed] [Google Scholar]
- 27.van Breukelen B; Barendregt A; Heck AJR; van den Heuvel RHH “Resolving Stoichiometries and Oligomeric States of Glutamate Synthase Protein Complexes with Curve Fitting and Simulation of Electrospray Mass Spectra.” Rapid Commun. Mass Spectrom 2006, 20, 2490. [DOI] [PubMed] [Google Scholar]
- 28.Zheng H; Ojha PC; McClean S; Black ND; Hughes JG; Shaw C “Heuristic Charge Assignment for Deconvolution of Electrospray Ionization Mass Spectra.” Rapid Commun. Mass Spectrom 2003, 17, 429. [DOI] [PubMed] [Google Scholar]
- 29.Campuzano IDG; Robinson JH; Hui JO; Shi SDH; Netirojjanakul C; Nshanian M; Egea PF; Lippens JL; Bagal D; Loo JA; Bern M “Native and Denaturing MS Protein Deconvolution for Biopharma: Monoclonal Antibodies and Antibody–Drug Conjugates to Polydisperse Membrane Proteins and Beyond.” Anal. Chem 2019, 91, 9472. [DOI] [PMC free article] [PubMed] [Google Scholar]
- 30.Trimpin S; Clemmer DE “Ion Mobility Spectrometry/Mass Spectrometry Snapshots for Assessing the Molecular Compositions of Complex Polymeric Systems.” Anal. Chem 2008, 80, 9073. [DOI] [PubMed] [Google Scholar]
- 31.Prebyl BS; Cook KD “Use of Fourier Transform for Deconvolution of the Unresolved Envelope Observed in Electrospray Ionization Mass Spectrometry of Strongly Ionic Synthetic Polymers.” Anal. Chem 2004, 76, 127. [Google Scholar]
- 32.Kitov PI; Han L; Kitova EN; Klassen JS “Sliding Window Adduct Removal Method (SWARM) for Enhanced Electrospray Ionization Mass Spectrometry Binding Data.” J. Am. Soc. Mass Spectrom 2019, 30, 1446. [DOI] [PubMed] [Google Scholar]
- 33.Lu J; Trnka MJ; Roh S-H; Robinson PJJ; Shiau C; Fujimori DG; Chiu W; Burlingame AL; Guan S “Improved Peak Detection and Deconvolution of Native Electrospray Mass Spectra from Large Protein Complexes.” J. Am. Soc. Mass Spectrom 2015, 26, 2141. [DOI] [PMC free article] [PubMed] [Google Scholar]
- 34.Fouquet T; Sato H “Extension of the Kendrick Mass Defect Analysis of Homopolymers to Low Resolution and High Mass Range Mass Spectra Using Fractional Base Units.” Anal. Chem 2017, 89, 2682. [DOI] [PubMed] [Google Scholar]
- 35.Hoi KK; Robinson CV; Marty MT “Unraveling the Composition and Behavior of Heterogeneous Lipid Nanodiscs by Mass Spectrometry.” Anal. Chem 2016, 88, 6199. [DOI] [PMC free article] [PubMed] [Google Scholar]
- 36.Walker LR; Marzluff EM; Townsend JA; Resager WC; Marty MT “Native Mass Spectrometry of Antimicrobial Peptides in Lipid Nanodiscs Elucidates Complex Assembly.” Anal. Chem 2019, 91, 9284. [DOI] [PMC free article] [PubMed] [Google Scholar]
- 37.Denisov IG; Grinkova YV; Lazarides AA; Sligar SG “Directed Self-Assembly of Monodisperse Phospholipid Bilayer Nanodiscs with Controlled Size.” J. Am. Chem. Soc 2004, 126, 3477. [DOI] [PubMed] [Google Scholar]
- 38.Denisov IG; Sligar SG “Nanodiscs in Membrane Biochemistry and Biophysics.” Chem. Rev 2017, 117, 4669. [DOI] [PMC free article] [PubMed] [Google Scholar]
- 39.Lai G; Forti KM; Renthal R “Kinetics of lipid mixing between bicelles and nanolipoprotein particles.” Biophys. Chem 2015, 197, 47. [DOI] [PMC free article] [PubMed] [Google Scholar]
- 40.Zhang G; Keener JE; Marty MT “Measuring Remodeling of the Lipid Environment Surrounding Membrane Proteins with Lipid Exchange and Native Mass Spectrometry.” Anal. Chem 2020, 92, 5666. [DOI] [PMC free article] [PubMed] [Google Scholar]
- 41.Fernandez-de-Cossio Diaz J; Fernandez-de-Cossio J “Computation of Isotopic Peak Center-Mass Distribution by Fourier Transform.” Anal. Chem 2012, 84, 7052. [DOI] [PubMed] [Google Scholar]
- 42.Ipsen A “Efficient Calculation of Exact Fine Structure Isotope Patterns via the Multidimensional Fourier Transform.” Anal. Chem 2014, 86, 5316. [DOI] [PubMed] [Google Scholar]
Associated Data
This section collects any data citations, data availability statements, or supplementary materials included in this article.