

Abstract
Objective:
Electrical impedance myography (EIM) is a recent technology to assess muscle health. As of today, the clinical application of EIM has been applied only to evaluate muscle condition using non-invasive surface electrodes in contact with the skin; however, intermediate tissues at the recording site introduce confounding artifacts which reduce the technique’s performance as a biomarker of neuromuscular disorders (NMD). Here, we develop and test in humans a new approach using two concentric needles for intramuscular EIM recordings.
Methods:
First, we study the recording characteristics of dual concentric needle EIM via analytical models and finite element models (FEMs). Next, the validity of the models is verified by performing experiments on saline and agar phantoms. Finally, 8 subjects with various neuromuscular diseases were studied measuring tibialis anterior, biceps, deltoid, adductor pollicis brevis, first dorsal interosseous and flexor carpi radialis muscles.
Results:
Analytical and FEM simulations are in good agreement with a maximum experimental discrepancy <8% and <9% using gauge needles 26 and 30, respectively. The inter-session reproducibility, as measured by the intraclass correlation coefficients for all muscles studied, was 0.926, which is comparable or exceeds the reproducibility of other well-established electrophysiological tests to assess muscle health.
Conclusion:
The reproducibility of the technique support future clinical validation of needle EIM for assessment of disease status, either as part of standard patient care or as biomarker measure in clinical trials.
Significance:
Needle EIM has the potential of becoming a valuable diagnostic tool to evaluate NMD in adult population.
Index Terms—: Electrical impedance myography, neuromuscular disorders, needle electrodes
I. Introduction
Electrical impedance myography (EIM) is a technology that is finding increasing application to assess neuromuscular disorders (NMD) [1]–[3]. EIM relies on the four-terminal electrical impedance technique [4], namely the application of an alternating electrical current across a region of muscle and the measurement of the resulting electrical voltage response. The underlying scientific premise of EIM is that structural and morphological alterations in pathological tissue (e.g., myofiber atrophy, inflammation, edema, and fat infiltration) change the intrinsic electrical properties of muscle, and these changes can be detected in the measured impedance [5]. This important feature allows EIM to serve both as a primary diagnostic test as well as a method for tracking disease progression or response to therapy. In point of fact, EIM has already been employed to follow disease progression in a number of clinical studies including amyotrophic lateral sclerosis and Duchenne muscular dystrophy [6]–[8].
To date, EIM has been only employed in clinical research studies using surface electrodes placed in contact with the skin above the muscle of interest, an approach referred hereafter as surface EIM. The benefits of surface EIM include its non-invasiveness and the fact that it is a procedure simple to perform that requires minimal operator training. Examining a muscle takes only few seconds, allowing surveys of multiple muscles to be completed quickly. However, there are three major technical limitations of surface EIM approaches. First, surface data includes the electrical contribution of skin, subcutaneous fat, and other nearby anatomical structures including the boundary of the conductor volume [9], [10]. In other words, surface EIM provides non muscle-specific data including a complex amalgam of muscle, other tissues at the site of the recording and the dimensions of the conductor volume. The second limitation is the intrinsic lack of spatial resolution associated to surface EIM. It is virtually impossible to obtain basic electrophysiological data from individual myofibers or motor units performing surface EIM recordings. Finally, in pre-clinical studies, skin preparation methods are necessary to remove animals’ fur and ensure electrode contact with the skin. The use of depilatory creams for this purpose can lead to skin inflammation and edema, which in turn can affect surface EIM values and be a confounding factor.
To overcome these limitations, we developed a new approach to allow intramuscular EIM recordings in patients using needles, a new modality termed as needle EIM to distinguish it from its surface counterpart [11]–[15]. Our previous needle EIM simulation and animal studies revealed excellent muscle sensitivity thus warranting its application in patients with NMD. Accordingly, here we sought to evaluate needle EIM by employing using a customized concentric needle, similar to those used to perform standard electromyography (EMG) studies in clinical practice. Concentric EIM needles used in this study include two electrodes: the inner electrode and the outer cannula itself only exposed at the end of the shaft; the two electrodes being separated by a thin layer of insulating material.
In this study, twin concentric EIM needles were used simultaneously to record intramuscular impedance, with the two electrodes available at the tip of each needle serving as current and voltage sensing electrodes. This study provides a description of our new approach, including the development of analytical models and finite element models (FEMs), testing in phantom media, and finally its application in subjects with a variety of NMD to assess its inter-session reproducibility at the clinic.
II. Twin concentric needle EIM
The concept of measuring needle EIM with concentric needles is illustrated in Figure 1. For EIM measurement, each needle is used as current (in red color) and voltage (in blue color) electrodes separately. Here, we have developed several analytical models (Section II-A) and FEMs (Section II-B), starting from the simplest geometry abstraction shown in Fig.2 model 1 to our most realistic approximation of real needles used later in patients (same figure, model 9). Each model builds on the one before it incorporating one additional design parameter that brings the needle device closer to the real experimental setup. This step-by-step approach allows us to study the role of each EIM needle design parameter in the measured impedance value.
Fig. 1.
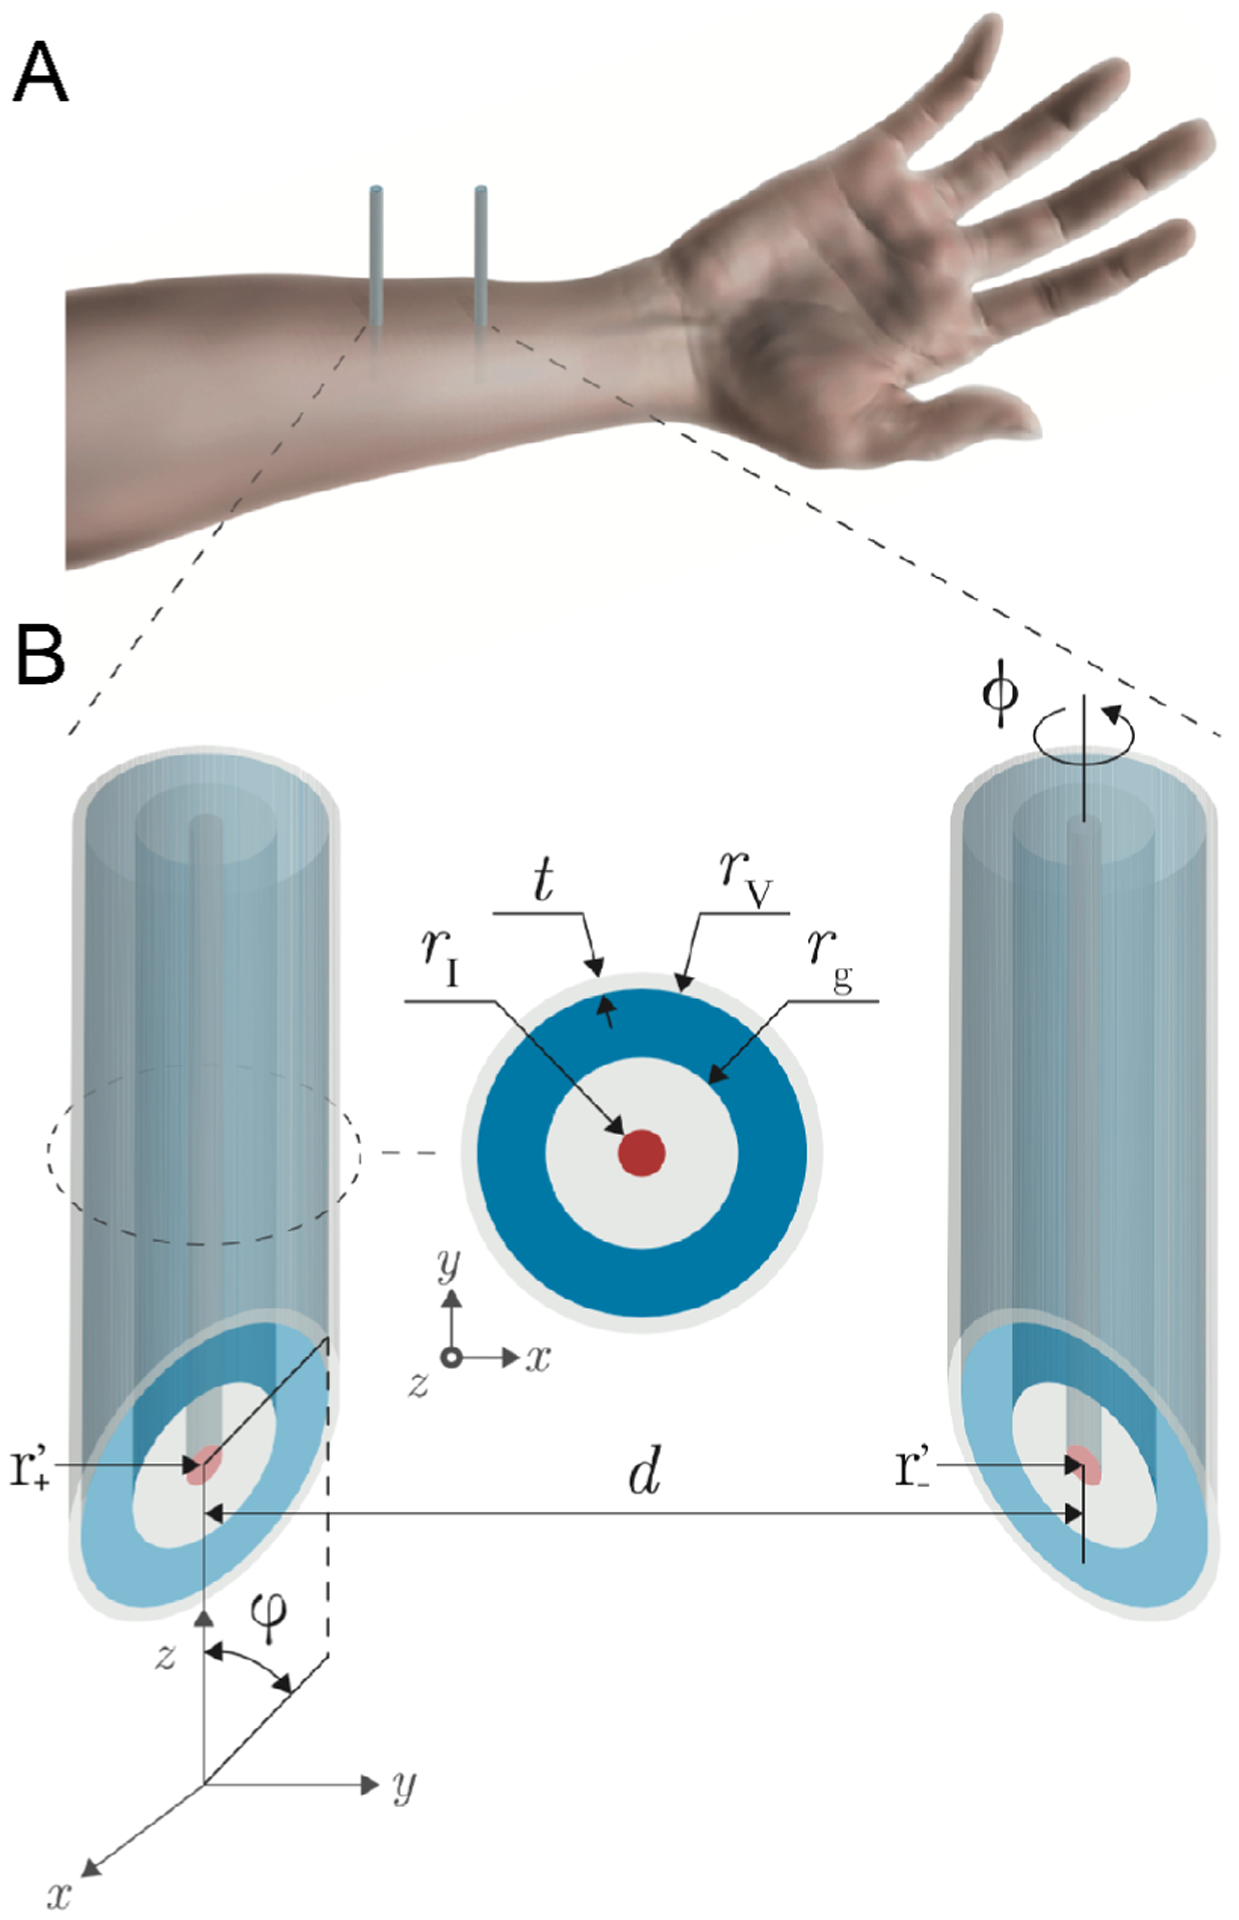
Schematic representation of needle electrical impedance myography based on concentric needles. (A) Two concentric needles are inserted through the skin and subcutaneous fat layers into the muscle. (B) Model developed. The needle design parameters include the center-to-center distance between needles d, the tip angle φ, the thickness of the insulating material covering the length of the needle shaft t, the exterior radius of the voltage electrode rV, the insulating material between electrodes rg, the radius of the current electrode rI, and the rotation angle ϕ. The source (+) and sink (−) current electrodes have coordinates .
Fig. 2.
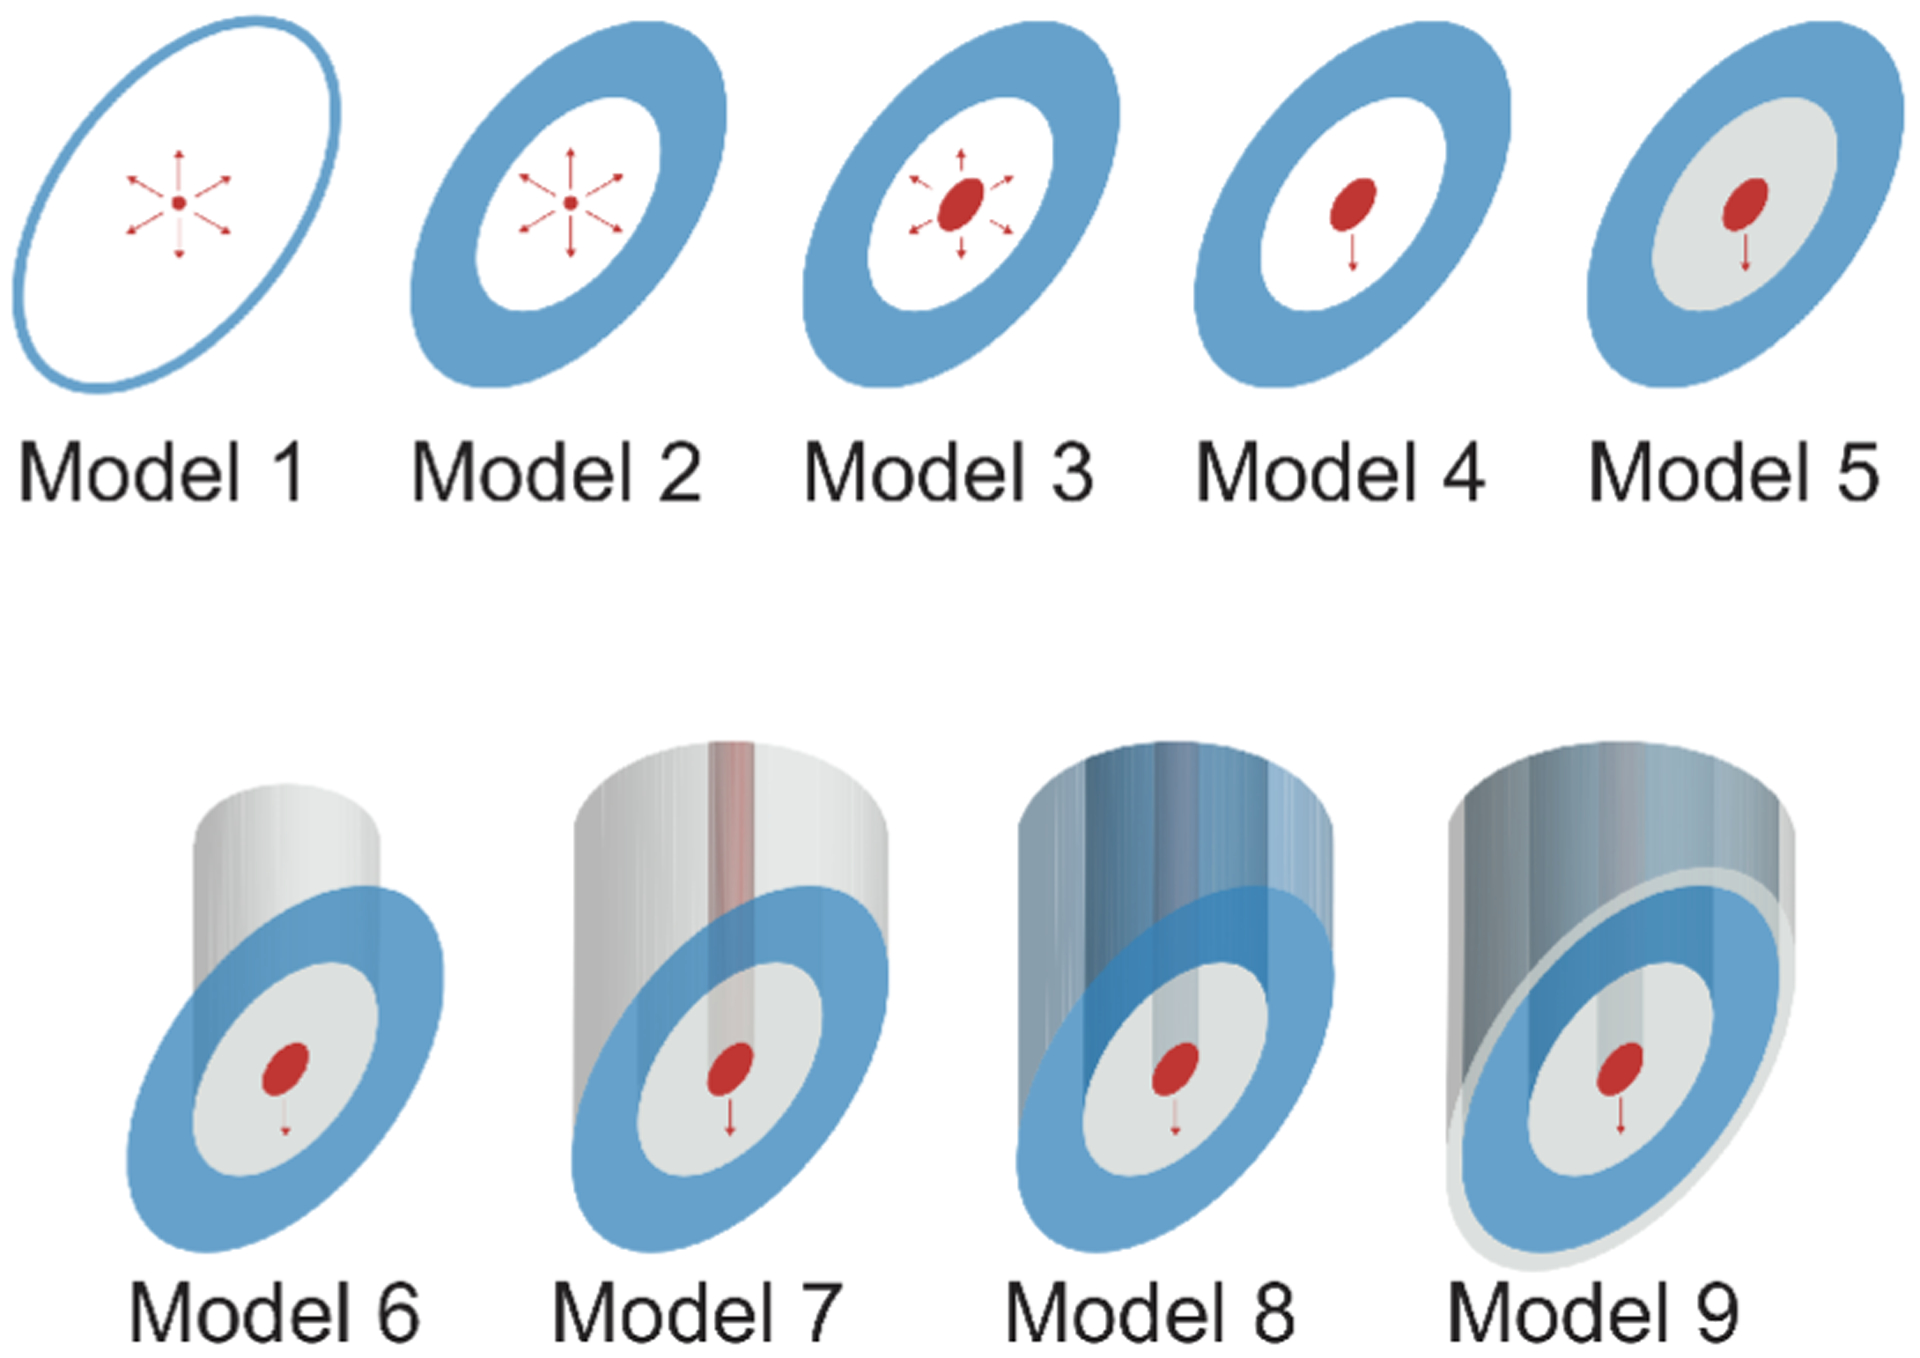
Schematic illustrating the needle models considered in this study. Starting with the simplest model abstraction (model 1), each model builds on the previous model increasing the complexity one parameter at a time. In the figure, the current and the voltage electrodes are shown in red and blue color as a convention, respectively; while the insulating material is shown in gray color. For measuring muscle impedance, the two concentric needles are considered to be the same model from 1 to 9.
A. Analytical models
Due to the mathematical complexity, analytical models have been only developed for models 1 and 2 shown in Figure 2, further studied below.
Model 1: the needle voltage electrode is considered as a one-dimensional curve , parametrized as
and described between the intersection of the plane determined by the origin of coordinates and the normal vector , and the curved face of a cylinder with radius rV, the latter with the current electrode as the vertical axis. In this setting, φ ∈ (0, π/2] is the needle tip angle, being φ = 0 and φ = π/2 a sharp and flat needle, respectively.
The procedure to determine the impedance consists of three steps. First, we determine the average electrical potential measured by the voltage electrode in model 1 (denoted by the subscript m1), which is
| (1) |
where dθ is the length of the C, namely
| (2) |
and
| (3) |
is the voltage generated at r := (x, y, z) by an omnidirectional point-like current electrode placed at r′ ≔ (x′, y′, z′), with I (A) the amplitude of the applied current; the impedivity property of the domain determined by the conductivity σ (S m−1) and permittivity ε (F m−1); the imaginary unit (dimensionless); ω the (angular) frequency (rad s−1); K = 2π, 4π (dimensionless) a constant factor for half space and full space domains, respectively; and ‖ • ‖ the euclidean norm operator. Inserting (2) and (3) into (1) gives,
with Gl ≔ G/L(C) and G ≔ κI/K.
Next, we compute the total voltage measured by the high voltage electrode, which is
where and represent the averaged electrical potential on the high voltage electrode created by the positive and negative current electrodes with coordinates and , respectively, with ϕ ∈ [0, 2π) the needle counterclockwise rotation angle along the z-axis. Their expressions can be simplified as follows
| (4) |
and
| (5) |
with and ψ ≔ θ − ϕ.
Finally, note that due to the symmetry (i.e., the second concentric needle is a symmetrical reflection of the first concentric needle), we have that the voltage measured by the low voltage electrode is , i.e., the measured impedance is
| (6) |
Model 2: the voltage electrode is considered as a two-dimensional closed area defined by the surface S lying on a plane as defined in model 1 now enclosed by the curved faces of two coaxial vertical cylinders whose axis contain the current electrode point and have radii rV and rg respectively, where rV > rg. In this setting, rV is the exterior radius of the voltage electrode and rg is the insulating material between the inner and outer electrodes.
Then, the average electrical potential measured by a voltage electrode in model 2 (denoted by the subscript m2) is
| (7) |
where is the area of the voltage electrode which can be computed as the difference of two ellipses with semi-minor and semi-major axes {rV, rV/sinφ} and {rg, rg/sinφ}. Then, the electrical potential is
with Ga ≔ G/A, rc ≔ r cosθ, rs ≔ r sinθ, , , , , and where Cg and CV are the parametrizations of the radial integral limits defined by rg and rV in terms of the integration angle θ, namely
with R{V,g} ≔ r{V,g}(1−sin2 θ cos2 φ)−1/2.
Following the same rationale as in model 1, the total voltage measured by the positive voltage electrode is
with
| (8) |
and
| (9) |
Finally, we can compute the impedance measured in model 2 from (8) and (9) as follows
| (10) |
One can expect that the parameters overlooked in the analysis of model 2 will cause theoretical values in (10) to differ from FEM simulations of model 9. Furthermore, muscle dimensions are finite and thus the assumption of (semi-)infinite domains may not be fulfilled in practice, which implies that boundary effects will affect the data. First, to correct the geometrical simplifications of model 2, we propose to use a constrained gain factor on mimicking the effect of semi-infinite and infinite domains, i.e. ξ = 1 and ξ = 0 respectively. Second, to account for boundary effects, we use the method of image charges [16]. Briefly, this method of satisfying the boundary conditions imposed on the electrical potential generated by a point charge next to a plane insulator consists of using an opposite charge at the mirror image position of the original charge (i.e., reflection, see Figure 3). If we approximate the domain as a cuboid with dimensions width×length×height L×(L+d)×L delimited by insulator planes, then there is an infinite number of reflections; however, here we have only taken into account the first reflections being generated by the two original current electrodes. Finally, we propose a modified version of model 2 with gain and boundary correction as follows
| (11) |
with
the potential induced by the image current sources, with and the reflections positions with respect to the positive and negative current electrodes, being the indices j, k{1,2}, , with j, l ∈ {−1, 0, 1}, (k1, k2) ∈ {(0, 0), (0, 1), (1, 1)} satisfying {j, k1, k2, l} ≠ {0, 0, 0, 0} the position of the original source and sink current electrodes. In all, the number of reflections considered in the sum above are the first 26 image sources in three-dimensions. The effect of the rotation angle ϕ was not considered to compute the source reflections as discussed in Section V-A5.
Fig. 3.

Illustration of the image point sources in the xy-plane to correct boundary effects. The rectangle in the center represents the domain with the original positive (blue) and negative (red) current electrodes. The original source (+, in red) and sink (−, in blue) current electrodes have coordinates whereas their boundary images have coordinates .
B. Finite element models
To extend our previous analysis, we simulate all the models shown in Fig.2 by means of the finite element method. The specifications of each simulation model are detailed below.
Model 1: Same as in Section II-A. The voltage electrodes are made of metal with conductivity 106 S m−1.
Model 2: Same as in Section II-A. The voltage electrode is a plane surface enclosed between the ellipse in model 1 and a smaller, concentric and homothethic ellipse with semi-axis rg and rg/sinφ.
Model 3: The current electrode is defined as a surface delimited by an ellipse concentric and homothethic ellipse to the voltage electrode ellipses, with semi-axes rI and rI/sinφ, being rI the radius of the inner cylinder of the needle.
Model 4: The electrical current flow is restricted to flow from the bottom face along the z-axis.
Model 5: The surface in between the current electrode and the voltage electrode is insulated.
Model 6: The inner insulated surface and the current electrode are extruded along the z-axis.
Model 7: The voltage electrode is extruded and insulated along the z-axis except the bottom face, which remains exposed.
Model 8: The extruded voltage electrode is considered metal, i.e., exposed barrel. This is our most realistic model of the standard commercially available concentric needles used in EMG studies.
Model 9: A thin layer of insulator with thickness is added around the exterior extrusion face of the voltage electrode. Thus, the only exposed metal part in contact with the domain is the bottom face of the needle. This last model is the most accurate description of the needles described in section III.
III. Materials
A. Impedance measurement device
Phantom and human needle EIM measurements were performed with SFB7 (Impedimed, Inc., Brisbane, Australia) between 3 kHz and 1 MHz (255 frequencies).
B. Ultrasound imaging device
Ultrasound images were obtained using a Terason t3000 system (Teracorp, Inc., Burlington, MA, USA) to determine the thickness of subcutaneous fat tissue and visually confirm the correct placement of the EIM needles into the muscles of interest as described in Section IV-D.
C. Concentric needle electrodes
Commercially available concentric needles of gauge 26 and 30 (S53156 and S53153, Natus Neurology, Middleton, WI) were insulated using parylene coating with a vacuum deposition process providing a complete and uniform encapsulation of the needle. The metallic beveled tip was re-exposed gently using sand paper (see an example in Figure 4). Photomicrographs of the needles were taken with a microscope (3015, Accu-Scope, Inc., NY, USA) using a digital camera (MU500, AmScope, LLC, CA, USA). Measurements were then performed with ImageJ software using a calibration slide as a reference (see Figure 4). The estimated dimensions (mean ± standard deviation) of the needles are for gauge 30: , , and ; and for gauge 26: , , and ; with .
Fig. 4.

Lateral (top) and front (bottom) photomicrographs of the tip of the insulated 30 gauge concentric needles used in this study.
D. Conductivity and temperature measurement device
The conductivity and the temperature of the saline solution used for phantom experiments were measured using C100 Conductivity/TDS/Salinity Meter (Cole-Parmer Instrument Company, LLC, IL, USA).
IV. Methods
A. Finite element model simulations
Finite element method simulations were performed using Comsol Multiphysics (Comsol, Inc., Burlington, MA) to study the influence of the needle the tip angle φ and the distance between needles d on the measured data. The models shown in Figure 2 were simulated with the needles positioned at the center of the cuboid with saline solution conductivity 1.6 S m−1 and L = 30 mm (see Figure 5). The values of the needle parameters measured in Section III were used. Electrostatic simulations were performed at 10 kHz applying an electrical current with amplitude I = 1 mA. With the geometry defined, a mesh with approximately 115,000 tetrahedral elements was used to perform the simulations (Dell Precision Tower 7910, Intel Xeon E5–2600 v4). An example of impedance simulation with twin concentric needles is shown Figure 5. The simulations considered reference electrodes’ contact impedance with surface resistance 10−3 Ω m2 and surface capacitance 0.16·10−6 F m2 [17].
Fig. 5.
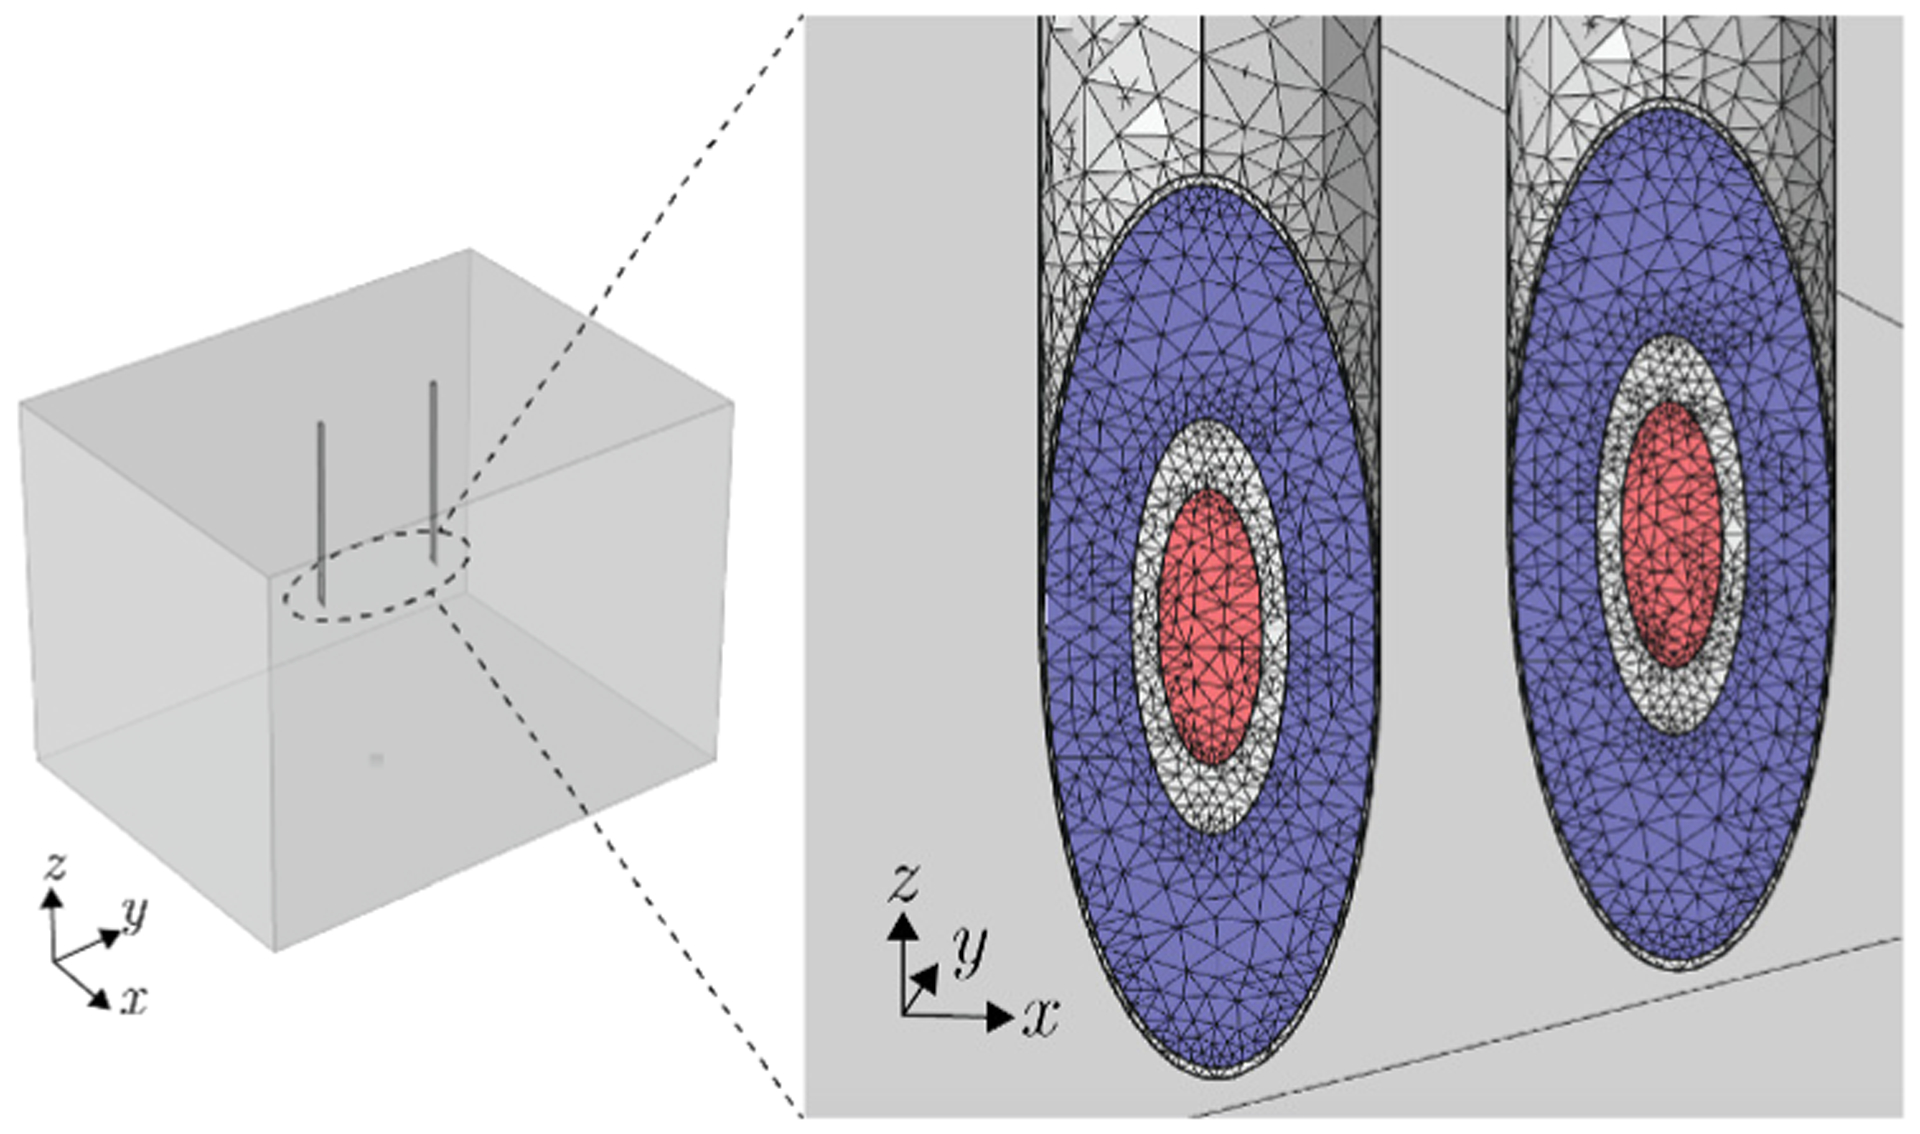
Three-dimensional view of the finite element model simulation of the twin needles inserted in the domain (left) and mesh detail of the concentric electrical impedance simulation of model 9 (right). The current and voltage electrodes are shown in red and blue color, respectively.
B. Phantom experiments on saline solution and agarose-based gel
Experiments on 0.9% sodium chloride solution (Tecnova, Inc., CA, USA) were performed with the conductivity and the temperature measured [18]. The twin concentric needles described in Section III-C were positioned parallel to each other using a micromanipulator (M3301-M3, World Precision Instruments, Inc., FL, USA). The needles were then inserted into the saline solution at a depth of 3 cm and the plastic container used had larger dimensions to minimize boundary effect. The impedance from three experiments with the needle distance varying from 0.3 to 30 mm was measured using a new pair of EIM concentric needles of gauge 26 and 30 in each experiment and the mean and standard deviation computed.
We also performed experiments on agarose gel. To prepare the gel, we mixed 1 g of agarose (UltraPure™, Invitrogen, Inc., CA, USA) was added for every 100 mL of saline solution. The mix was then heated in an Erlenmeyer flask for 1.5 min and cooled with dry ice. Finally, we performed the same impedance experiments as in the saline solution.
C. Subject information
Eight convenience subjects (7 males, 1 female, 60.2±15.8 years) with neuromuscular disorders were enrolled from the EDX Lab by hospital employees based on to their availability and willingness to participate in our study. Subjects were consented under an Institutional Review Board-approved protocol #2012P000364 (Beth Israel Deaconess Medical Center). Our study did not include healthy controls. Exclusion criteria included age <18 years, the presence of a pacemaker, pregnancy, or dialysis. All subjects had previously underwent detailed physical examination, needle electromyography (EMG) and ultrasound of the muscles under study. The diagnoses per examination and EMG report were:
Subject 1: Moderate chronic C7-T1 polyradiculopathy on the right, predominantly involving the C8-T1 roots.
Subject 2: Mild-to-moderate, chronic median neuropathy at the right wrist.
Subject 3: Bilateral, subacute, moderate-to-severe C5–6 radiculopathies. Mild to moderate median neuropathies at both wrists. The EMG findings were also suggestive of a mild-to-moderate underlying generalized sensory polyneuropathy.
Subject 4: Severe, chronic median neuropathies at both wrists. The EMG findings were also suggestive of a mild ulnar neuropathy at the left elbow.
Subject 5: Profoundly severe median neuropathies localized to both wrists.
Subject 6: Inclusion body myositis.
Subject 7: Oculopharyngeal muscular dystrophy.
Subject 8: Limb girdle muscular dystrophy.
D. Experimental protocol
Informed consent was obtained from the subjects prior to the measurements and subjects were reimbursed at the completion of the study for their participation. After the skin was cleaned with alcohol, specific anatomic landmarks were used for needle placement with two pinpoint tattoos at a distance of 10 mm centered along the belly of the muscles studied in longitudinal direction. The muscles studied were tibialis anterior, biceps, deltoid, adductor pollicis brevis, first dorsal interosseous and flexor carpi radialis muscle. The needles were inserted perpendicular to the muscle and needle penetration depth was adjusted according to the muscle in question also taking into account the thickness of subcutaneous fat determined from the ultrasound image.
E. Needle EIM reproducibility
Individuals immediately underwent repeated testing of the muscles studied to determine the inter-session reproducibility of needle EIM as measured by the intraclass correlation coefficient (ICC). Out of the 8 subjects measured, we only performed reproducibility assessments on 7 individual muscles moving the needles once inserted to minimize patient discomfort. Needle EMG and EIM examination was performed by a Board-certified physician (S.R.). Due to limited sample size, we combined both unaffected and affected needle EIM data for calculating the reproducibility from 7 subjects with whom repeated values were obtained from individual muscles, giving a total of 14 needle EIM repeated measurements.
F. Subject data analysis
Affected and unaffected needle EIM data was determined with standard needle EMG. Multi-frequency needle EIM data collected with SFB7 (Impedimed, Carlsbad, CA) were fitted to the Cole impedance model [19] using the Marquardt-Levenberg nonlinear least square curve-fitting algorithm (MATLAB, The Mathworks, Natick, MA, USA) described elsewhere [20]. The maximum number of iterations and the fitting tolerance were set to 106 and 1012, respectively. From the fitting, extrapolated resistance at DC frequency R0 parameter was determined.
V. Results
A. Analytical and simulation results
1). Model analysis:
Figure 7A shows the resistance measured with theory and FEM simulations. The theoretical resistance values were obtained considering a semi-infinite (half-space) and infinite domains, the latter mimicking how the FEM simulations were performed. Then, in model 2, the resistance increases with respect to model 1 because the increased area of the voltage electrodes. This notable difference between model 1 and 2 justifies why the approximation of the voltage electrode as a closed curve is not accurate enough. The analytical and FEM resistance of model 1 and 2 are in excellent agreement with a relative error <0.1%. Next, the geometrical differences from model 2 to model 6 do not have a major impact on the measured resistance. In other words, it is arguable that the point approximation of the current electrode, the restriction on the electrical current flow, the addition of insulating material between electrodes and its extrusion in the z-axis affect substantially the data in this setup. The resistance again increases in model 7 approximately by 40% due to the contribution of the insulating material that covers the upper part of the voltage electrodes, which effectively reduces the space for the electrical current to flow. Importantly, the resistance drastically decreases in model 8 outside the theoretical limits due to the metal exposed along the cannula of the needle. The exposed metal interferes with the electrical potential distribution greatly. At this point, we found that the resistance value becomes strictly dependent on the needle insertion depth (see also the experimental results in Section V-B). Finally, the resistance value measured with model 9 is again within the expected theoretical lower and upper limits predicted by analytical models 1 and 2.
Fig. 7.
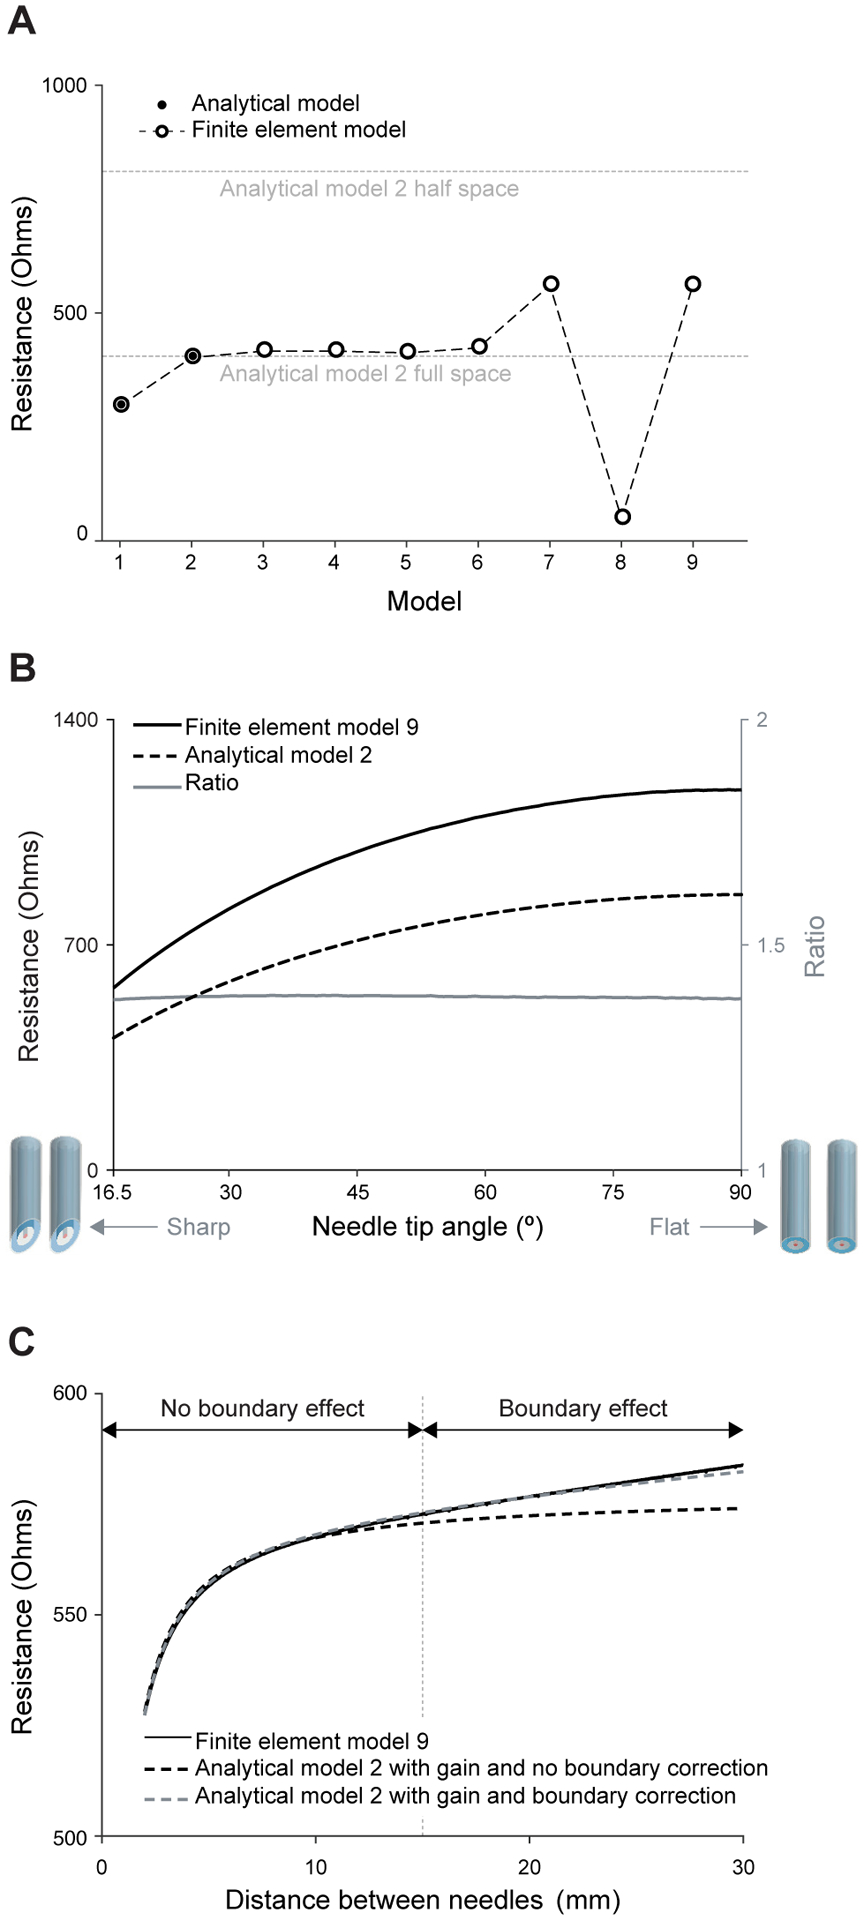
Analytical and finite element model simulation results of twin concentric needles measuring saline solution. (A) Resistance resulting from the measurement of impedance with the needle models in Figure 2 in full-space and half-space. (B) Study of the resistance measured with the needles’ tip angle. (C) Study of the resistance as a function of the separation between needles. We refer the reader to the text for further details. The needle insulation thickness considered in model 9 is t = 4 μm.
2). Needle tip angle analysis:
The goal of this study is to approximate analytical model 2 with the FEM simulation results obtained from the most realistic model 9. The impedance measured with varying the needle tip angle was simulated considering two 30 gauge needles at a distance d = 1 cm. Figure 7B shows the resistance value decreases with decreasing needle tip angle and vice versa. Importantly, the theoretical and simulation results have the same trend and the ratio simulation/theory remains constant 1.388 with needle tip angle. This results indicates that it is accurate to correct the outcome of analytical model 2 using a scalar gain factor that approximates the resistance measured with model 9 available through FEM simulations only.
3). Needle distance and boundary effect analysis:
Figure 7C plots the measured resistance while changing the needles’ distance d from 2 to 30 mm, with the needles’ gauge 30 and tip angle φ = 16.5°. The resistance obtained with model 9 increases with increasing distance (solid black line). Once the needles separation reaches a distance similar to the domain dimensions in the FEM simulations, then boundary effects impact the data. As expected, if we only take into account the gain factor ξ = 0.38 in (11), the theoretical resistance (dashed black line) only coincides with that of simulation only in the region where the needles are at close distances (i.e., region with no boundary effect). Accounting for boundary effects describes the simulation data at farther distances as well (dashed gray line). Simulations considering needles’ gauge 26 gave the same model outcomes (not shown) with the same gain factor ξ = 0.38 as a 30G needle.
4). Needle coating thickness analysis:
The effect of insulation thickness was studied considering 30 gauge twin needles in saline solution separated d = 1 cm varying the thickness 2 ≤ t ≤ 10 μm. The resistance increased linearly with increasing t parametrized as follows R(t) = (1+m(t−t0)R(t0)), where m = 0.0166 μm−1, t0 = 4 μm, and R(t0) is shown in Figure 7C.
5). Needle rotation angle analysis:
The rotation of the needles around the z-axis determined by the angle ϕ can be neglected because it generates relative resistance changes <0.01%, whereas the computational error when performing the simulations was 0.3% of the resistance value, i.e., 30 times larger.
6). Needle dimension analysis:
Changes in needle parameters rV and rg affect the resistance measured, however, these are accurately predicted by model 2. Changes due to variation on the current electrode size rI within the range of needle specifications have an impact on the data <0.01% and thus can be neglected. Finally, ξ = 0.38 was found to be the same regardless the different dimensions of needles between gauge 26 and 30.
7). Needle depth misalignment analysis:
Simulations were performed to study the effect of depth misalignment between twin needles with Δz ∈ [0, 10] mm. The resistance increases with increasing Δz, but still can be accurately predicted with the analytical model developed in (11) with ξ = 0.38.
8). Coating imperfection analysis:
We studied two type of insulating imperfections: (i), incomplete insulation near the needle tip, and (ii), micro hole in the insulation layer (Figure 8 A and B, respectively). In the first case, the increased metal area exposed facilitates the current flow between needles, which results into an effective 32% resistance drop with respect to the resistance value measured with no imperfections (gauge 30, d = 10 mm). The effect of a micro hole was studied as a cylindrical hole extrusion in the insulation layer with varying radius rhole and distance from the needle tip to the center of the hole dhole. The hole was found to have a modest impact on the resistance data <3% in the cases studied in Table I.
Fig. 8.

(A) Rendering of the needle geometry with incomplete insulation where the beveled part of the needle begins in the tip. (B) Detail of the normalized isopotential lines near the needle tip with a micro hole (indicated by the red arrowhead) at 5 mm from the needle tip.
TABLE I.
Ratio between the resistance measured with a micro hole in the insulating layer and perfect insulation. A value close to 100% indicates a minimal impact on the resistance due to the micro hole.
| rhole (μm) | ||||
|---|---|---|---|---|
| 0.5 | 2 | 5 | ||
| 0.5 | 99.8% | 99.2% | 98.8% | |
| dhole (mm) | 2.5 | 99.6% | 98.6% | 98.0% |
| 5 | 99.1% | 98.6% | 97.2% | |
B. Phantom results
Phantom experiments on saline solution and agarose gel showed the same effect on the resistance as function of the the distance between concentric needles. Figure 9 quantifies the relative change between the resistance obtained at different distance with respect the resistance value obtained at distance d = 30 mm comparing needles’ model 2 and 9. The greatest difference between theory and saline experiments is 8% and 9% and occur at distances 0.75 and 1 mm for needle gauges 26 and 30 respectively. These differences are due to experimental inaccuracies when close positioning the needles. The agarose measurements started at d = 10 mm to facilitate an accurate positioning of the needles by mitigating the effect of gel stiffness. We also studied temporal changes in the resistance with the needles immersed in saline solution. The resistance was measured every 5 minutes during 4 hours. Over this period of time, the resistance value decreased 5% on average. The resistance variations were temporal dependent, being 1.66% and 0.4% the first and last hour respectively.
Fig. 9.
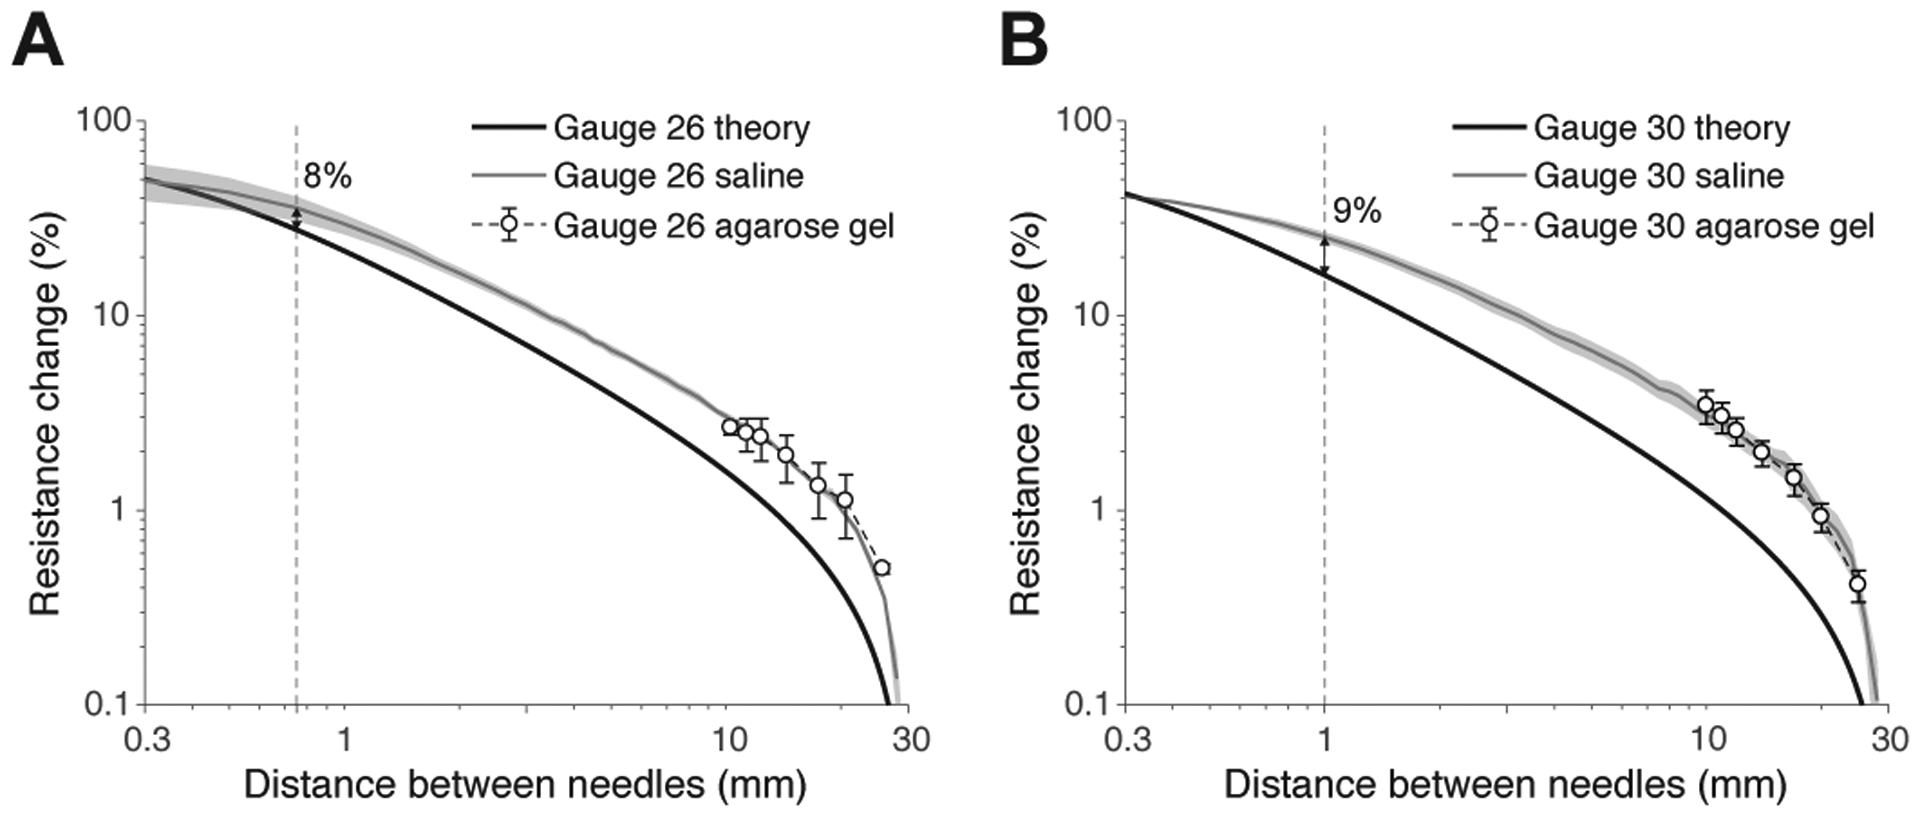
Relative resistance change from experiments performed on saline solution (gray line), agarose gel (white circles), and theory (model 2 with gain and boundary correction, black line) using twin concentric needles with gauge 26 (A) and 30 (B). The saline solution and agarose gel conductivity was 1.61±0.01 S m−1 and temperature 22±1 °C (mean ± standard deviation). The vertical dotted line shows that the discrepancy between theory and experiments is <10% when d ≤ 1 mm. Mean ± standard error of the mean are reported from n = 3 experiments.
Finally, we also tested non-insulated concentric needles. In our simulation framework, this is model 8 in Figure 2. The resistance measured on agarose gel was similar to the simulation value in Figure 7A. Considering a distance between needles of 10 mm and needle insertion depth of 15 mm, the simulation and experiment resistance is 49.65 and 49.75±0.87 Ω (mean ± standard error of the mean, n = 3 experiments) respectively. These experiments also showed the needle insertion depth had a great impact on the data, i.e., the resistance decreasing with increasing the insertion depth.
C. Multi-frequency needle EIM analysis
Figure 10 shows the calibration factor modeling the frequency dependence of muscle electrical properties reported elsewhere [21] considering needle Model 9. The correction factors is normalized to 10 kHz based on the results previously shown. The reactance calibration factor has a value close to 1 in the frequency range studied, decreasing with frequency. The resistance calibration factor, however, exhibits a maximum at frequencies between 100 and 1000 kHz.
Fig. 10.
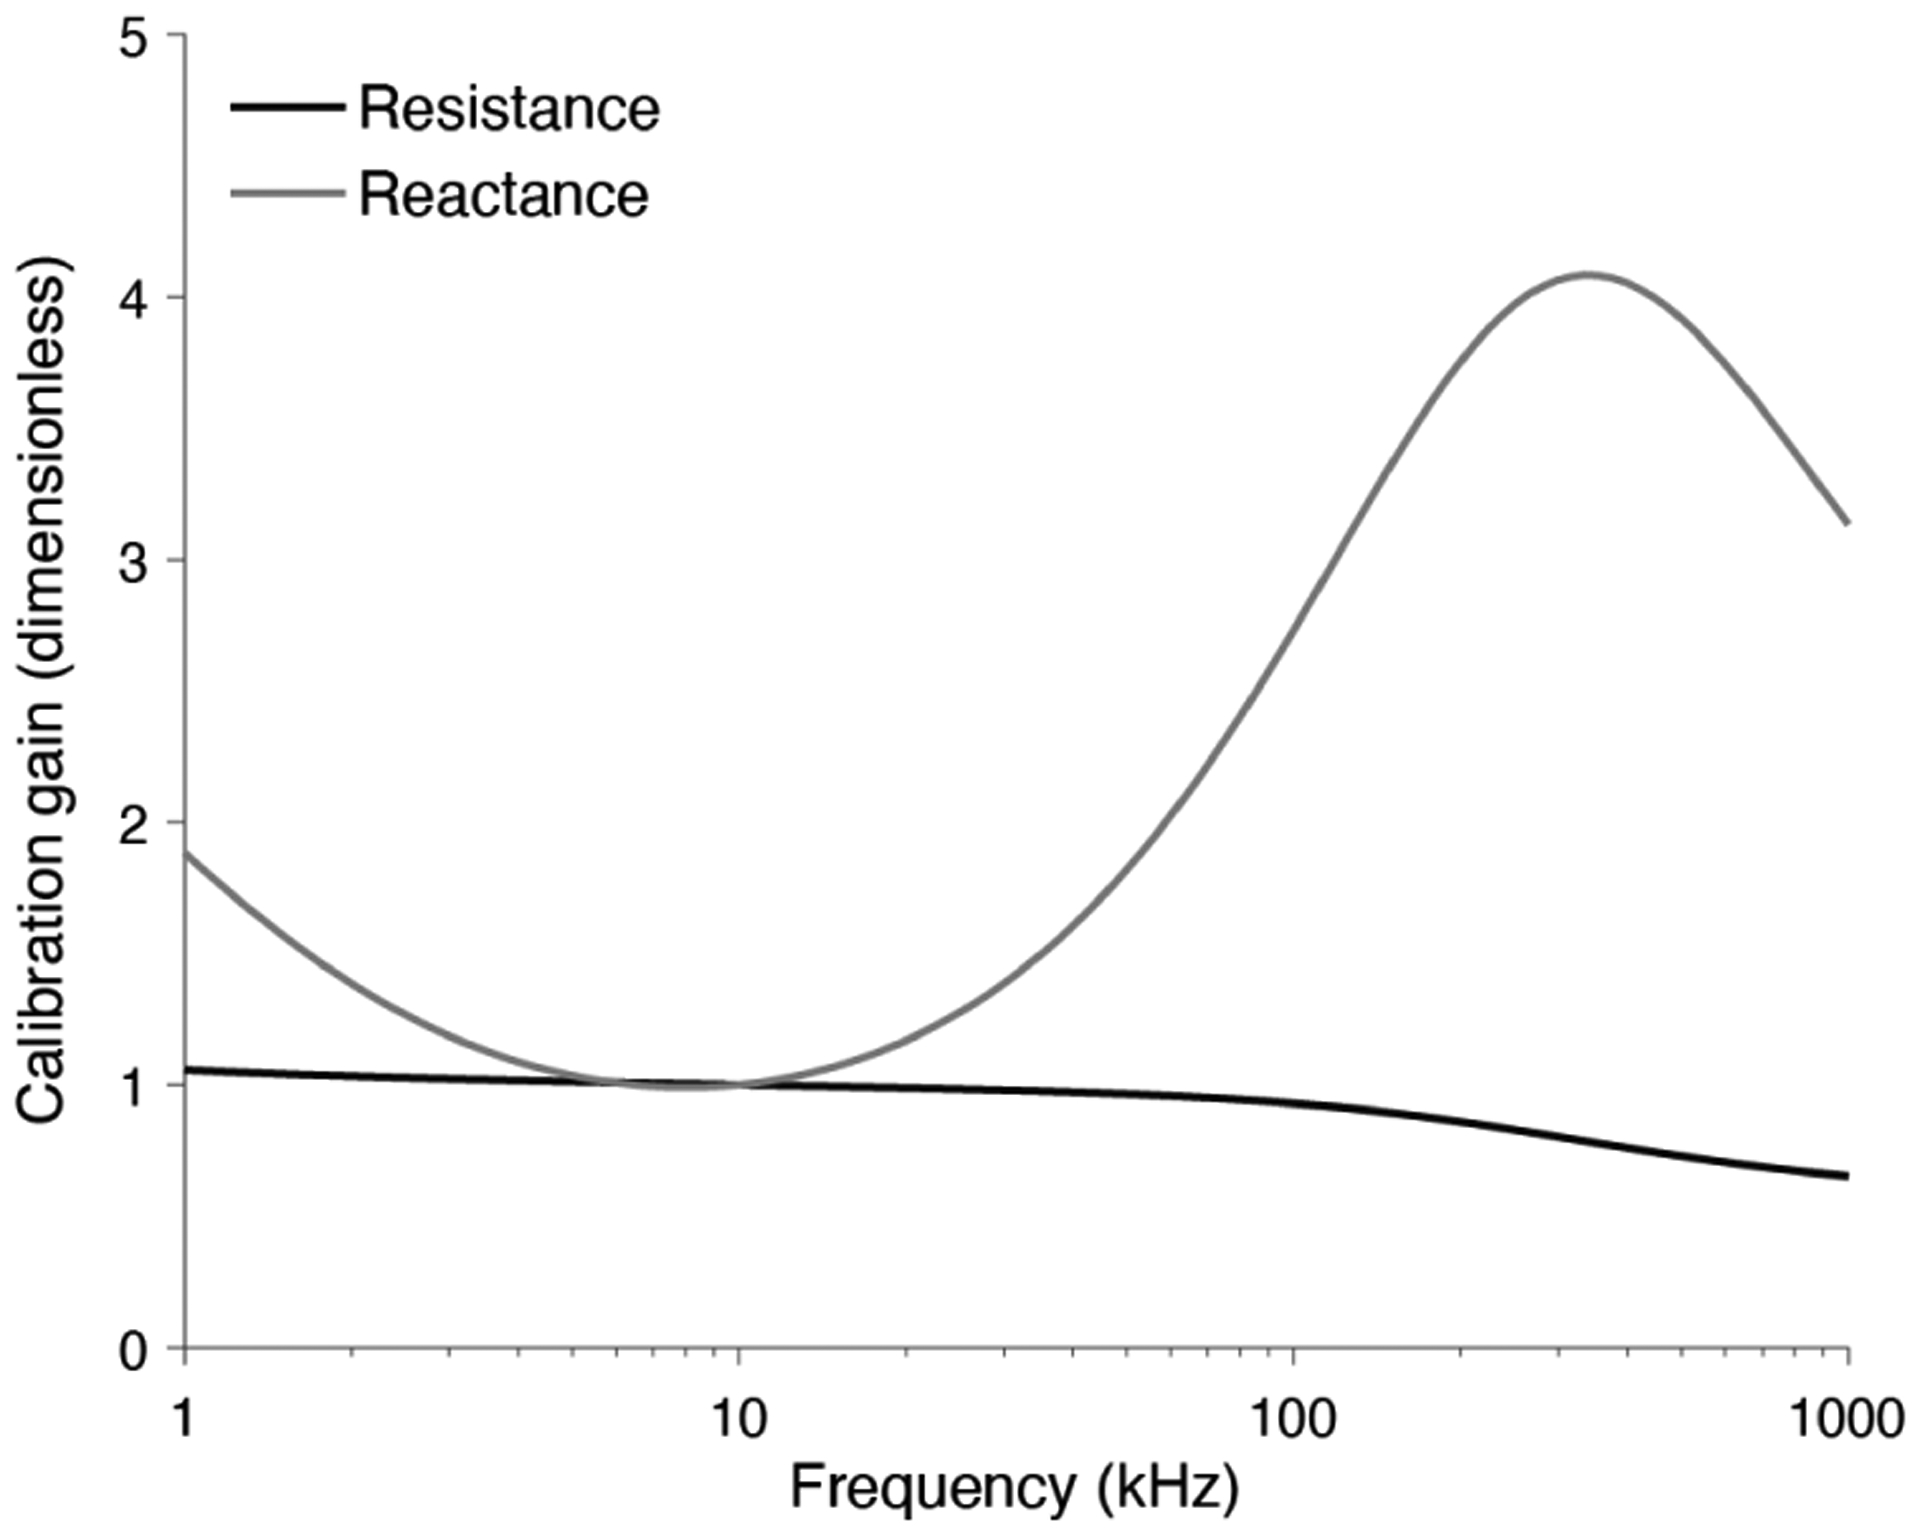
Resistance and reactance calibration curves for multi-frequency electrical impedance myography measurements from 1 kHz to 1 MHz. The correction factor is normalized with respect to muscle data at 10 kHz.
Figure 11 shows an example of multi-frequency needle EIM data measured on the first dorsal interosseous muscle bilaterally in a 66-year-old man with moderate, chronic right cervical polyradiculopathy with normal strength on the unaffected side and weakness on the right side.
Fig. 11.

Example of multi-frequency needle electrical impedance myography data at selected frequencies (circles) and fitted model (lines) measured on the left (affected) and right (unaffected) first dorsal interosseous muscles from the same patient.
D. Subject reproducibility data
Fig.12 plots test versus retest values of Cole model R0 parameter, together with least-squares-fitted line. The slopes of the fitted line is 1.012 close to perfect reproducibility with ICC=1.
Fig. 12.

Combined unaffected and affected test versus retest data of Cole model parameter R0 (circles) and fitted line with 95% confidence intervals. Reproducibility data were obtained from 7 subjects with whom repeated values were obtained from individual muscles, giving a total of 14 needle EIM repeated measurements. Abbreviation: ICC, intraclass correlation coefficient.
VI. Discussion
Here, we introduce twin concentric needle EIM, a new minimally-invasive approach to assess the condition of muscle with potential to complement existing electrodiagnostic tools [22]. The approach is first developed using analytical and FEM models for studying the effect of needle experimental design parameters on the recorded intramuscular EIM data. The experiment setup parameters studied included needles’ separation, needle gauge, needle tip sharpness, needles’ depth misalignment, and coating imperfections. The analytical models developed, although simple, were used as a reference and allowed us to validate with confidence more complex FEM simulations, which would otherwise have not been possible. Validated models were then compared with experimental results conducting phantom measurements on saline and agar phantoms.
The analytical results show that increasing the distance between needles (in practice from 10 to 15 mm) provides optimal results by minimizing the effect of needle bevel angle and potential depth misalignment between the two needles. Regarding the needle gauge, all values studied reported the same gain factor. We then found that a larger needle gauge requires less penetration depth to mitigate the finite-shape of the muscle, thus helping to reduce patient discomfort. Finally, we also found that commercial concentric needles’ can be used for EIM as well since the correction factor is almost constant for typical needle tip angle values.
Phantom experimentation supports analytical and FEM simulation results. Best agreement were obtained with a distance between needles of 10 mm with a maximum relative error below 10% by maintaining the needles as much perpendicular as possible with the tissue surface, independently of the needle gauge and bevel angle orientation. Experimental results from phantom media gave us a priori knowledge of practical considerations to ensure the validity of needle EIM data, for example, maintaining the needles perpendicular to the muscle and adjusting the needle penetration depth taking into account the thickness of subcutaneous fat determined from the ultrasound image.
Unlike surface EIM approaches using gel-adhesive electrodes [23]–[25], stainless steel electrodes [26], or microneedle electrode arrays [27], the needle approach presented here offsets the contributions from both skin and subcutaneous fat tissues. This is especially relevant in both patients with overweight and longitudinal studies where variations of subcutaneous fat can be a confounder making healthy data look sick or vice versa [10]. As a consequence, the muscle-specific contribution to surface EIM data ranges from 8% to 30% [9]. With needle EIM, the impedance data itself are generated >97% by muscle tissue only [11], [13]. Another advantage of needle EIM over surface EIM is that it allows to confidently evaluate a specific muscle, both superficial and internal, with higher spatial resolution than is possible with surface electrodes thus making this approach less affected by changes in muscle size or shape, the latter another confounder in longitudinal EIM studies due to disease progression (e.g., muscle atrophy in amyotrophic lateral sclerosis).
Despite the novelty of our work, the reproducibility reported is comparable or exceeds the reproducibility of other well-established electrophysiological tests to assess the health of muscle and nerve. For example, studies have shown that reproducibility of median F-wave latencies obtain a reproducibility of only 10% [28], [29], while motor and sensory amplitudes often have a variation greater than 50% [30], [31]. The interrater agreement of EMG between faculty-level physicians is only about 60% [32]. Our results suggest that needle EIM has a similar test-retest reproducibility than surface EIM approaches, in which ICCs values of 0.85–0.98 have been reported [33]–[35]. We found that in realistic clinical conditions, accurate repositioning of the needles is important to achieve high reproducibility measuring small muscles than large muscles. Also, special care must be taken when positioning the needles since a superficial muscle measurement could be affected by vicinity of subcutaneous fat tissue with different electrical properties altering the propagation of the electrical current applied for EIM measurement. On the other hand, deep tissue evaluation has the disadvantage that it is necessary to insert the needle more deeply which could also interfere with deeper structures or create greater discomfort in the patient.
This study has limitations warranting further theoretical and human studies using the technology presented. The first limitation is the difference between the simulation models and the concentric needles used. For example, the tip of concentric needles used is sharp to facilitate the insertion through the skin, but this design parameter was not considering in the analytical models to facilitate the parametrization of the electrode geometry. In addition, more sophisticated analytical and FEM analysis are required to include the regular, bundled structure of striated muscle, i.e., a concept known as electrical anisotropy [36]. Additional experimental work is also needed to characterize the experimental recording characteristics of concentric EIM needles [37], [38]. More practically, a drawback of the technique presented is the need to insert two needles into the muscle. Additional work is also necessary to characterize the current density near the needle current electrode to study potential focal activation effects in muscle fibers. Importantly, none of the subjects reported a physiological effect during the measurement (e.g., tingling) nor did we observe muscle contraction during the measurement. Also, the patients who participated in this study tolerated the test with similar discomfort as in needle EMG. Besides measuring small number of diseased individuals and healthy subjects, intra-session variability was not assessed. Despite these limitations, the basic reproducibility of the technique warrant additional work to expand our findings to studying anatomical features of muscle [39] and establish the sensitivity and specificity compared to other accepted clinical outcomes.
VII. Conclusion
In this study, we have presented technical, simulation and experimental results supporting twin concentric needle EIM, a new needle approach with potential to expand the repertoire of tools currently available in the electrodiagnostic laboratory. New needle EIM technology has the potential serve as a valuable scientific tool to evaluate how electrical alterations in tissue structure and composition as measured by EIM are related to neurophysiological changes measured by EMG. This work promises to offer new insights into neuromuscular disease development and its impact on muscle physiology and function beyond that possible with surface EIM approaches only.
Fig. 6.

Experimental setup of a phantom measurement on agarose gel using twin concentric needles with gauge 26. The needles’ electrodes are connected to the impedance measurement device (SFB7, Impedimed, Inc., Brisbane, Australia) and positioned using micromanipulators (M3301-M3, World Precision Instruments, Inc., FL, USA).
Conflict of interest
Dr. Sanchez has equity and serves a consultant and scientific advisor to, HaystackDx Inc., Ioniq Sciences Inc., and B-Secur Ltd. He also serves as a consultant to Myolex Inc., Impedimed Inc., Texas Instruments Inc., and Happy Health Inc., companies that develop impedance related technology for consumer, research and clinical use. Dr. Rutkove is Co-Founder and has equity of HaystackDx Inc. and Myolex Inc. HaystackDx has an option to license patented impedance technology of which Drs. Sanchez, Rutkove and Kwon are named as an inventor. This study did not employ any relevant company technology.
The work of S. B. Rutkove was supported by NIH under Grant R01 NS091159. The work of B. Sanchez was supported by NIH under Grant R41 RNS112029A.
Contributor Information
Marti Martinez de Morentin Cardoner, Neurology Department, Division of Neuromuscular Diseases, Beth Israel Deaconess Medical Center, 330 Brookline Avenue, Harvard Medical School, Boston, MA 02215-5491, USA..
Hyeuknam Kwon, College of Science and Technology, Yonsei University, Wonju, Republic of Korea 26493..
Benjamin Sanchez, Electrical and Computer Engineering Department, Sorenson Molecular Biotechnology Building, 36 S. Wasatch Drive, University of Utah, Salt Lake City, Utah 84112, USA.
References
- [1].Sanchez B and Rutkove SB, “Electrical Impedance Myography and Its Applications in Neuromuscular Disorders,” Neurotherapeutics, vol. 14, no. 1, pp. 107–118, January 2017. [DOI] [PMC free article] [PubMed] [Google Scholar]
- [2].——, “Present Uses, Future Applications, and Technical Underpinnings of Electrical Impedance Myography,” Curr. Neurol. Neurosci. Rep, vol. 17, no. 11, p. 86, November 2017. [DOI] [PubMed] [Google Scholar]
- [3].Sanchez B, Martinsen OG et al. , “Electrical impedance myography: A critical review and outlook,” Clin. Neurophysiol, vol. 132, no. 2, pp. 338–344, February 2021. [DOI] [PMC free article] [PubMed] [Google Scholar]
- [4].Schwan HP, “Four-Electrode Null Techniques for Impedance Measurement with High Resolution,” Rev. Sci. Instrum, vol. 39, no. 4, p. 481, 1968. [Google Scholar]
- [5].Nagy JA, DiDonato CJ et al. , “Permittivity of ex vivo healthy and diseased murine skeletal muscle from 10 kHz to 1 MHz,” Sci. Data, vol. 6, no. 1, p. 37, December 2019. [DOI] [PMC free article] [PubMed] [Google Scholar]
- [6].“NCT02611674. Methodology Study of Novel Outcome Measures to Assess Progression of ALS,” 2016.
- [7].Rutkove SB, Zhang H et al. , “Electrical impedance myography to assess outcome in amyotrophic lateral sclerosis clinical trials,” Clin. Neurophysiol, vol. 118, no. 11, pp. 2413–2418, 2007. [DOI] [PMC free article] [PubMed] [Google Scholar]
- [8].Rutkove SB, Geisbush TR et al. , “Cross-sectional evaluation of electrical impedance myography and quantitative ultrasound for the assessment of Duchenne muscular dystrophy in a clinical trial setting.” Pediatr. Neurol, vol. 51, no. 1, pp. 88–92, July 2014. [DOI] [PMC free article] [PubMed] [Google Scholar]
- [9].Rutkove SB, Pacheck A, and Sanchez B, “Sensitivity distribution simulations of surface electrode configurations for electrical impedance myography,” Muscle Nerve, vol. 56, no. 5, pp. 887–895, November 2017. [DOI] [PMC free article] [PubMed] [Google Scholar]
- [10].Kwon H, Malik WQ et al. , “Separation of subcutaneous fat from muscle in surface electrical impedance myography measurements using model component analysis,” IEEE Trans. Biomed. Eng, vol. 66, no. 2, pp. 354–364, 2019. [DOI] [PMC free article] [PubMed] [Google Scholar]
- [11].Kwon H, Rutkove SB, and Sanchez B, “Recording characteristics of electrical impedance myography needle electrodes,” Physiol. Meas, vol. 38, no. 9, pp. 1748–1765, August 2017. [DOI] [PubMed] [Google Scholar]
- [12].Kwon H, Nagy JA et al. , “New electrical impedance methods for the in situ measurement of the complex permittivity of anisotropic biological tissues,” Phys. Med. Biol, vol. 62, no. 22, pp. 8616–8633, September 2017. [DOI] [PubMed] [Google Scholar]
- [13].Kwon H, Di Cristina JF et al. , “Recording characteristics of electrical impedance-electromyography needle electrodes,” Physiol. Meas, vol. 39, no. 5, p. 055005, May 2018. [DOI] [PMC free article] [PubMed] [Google Scholar]
- [14].Rutkove SB, Kwon H et al. , “Electrical impedance imaging of human muscle at the microscopic scale using a multi-electrode needle device: A simulation study,” Clin. Neurophysiol, vol. 129, no. 8, pp. 1704–1708, August 2018. [DOI] [PubMed] [Google Scholar]
- [15].Kwon H, Guasch M et al. , “New electrical impedance methods for the in situ measurement of the complex permittivity of anisotropic skeletal muscle using multipolar needles,” Sci. Rep, vol. 9, no. 1, p. 3145, December 2019. [DOI] [PMC free article] [PubMed] [Google Scholar]
- [16].Robillard PN and Poussart D, “Spatial resolution of four electrode array.” IEEE Trans. Biomed. Eng, vol. 26, no. 8, pp. 465–70, August 1979. [DOI] [PubMed] [Google Scholar]
- [17].Grimnes S and Martinsen OG, Bioimpedance and Bioelectricity Basics, 3rd ed. Academic Press, 2014. [Google Scholar]
- [18].Marchal C, Nadi M et al. , “Dielectric properties of gelatine phantoms used for simulations of biological tissues between 10 and 50 MHz.” Int. J. Hyperth, vol. 5, no. 6, pp. 725–32, January 1989. [DOI] [PubMed] [Google Scholar]
- [19].Cole KS, “Permeability and impermeability of cell membranes for ions,” Cold Spring Harb. Symp. Quant. Biol, vol. 8, no. 0, pp. 110–122, January 1940. [Google Scholar]
- [20].Sanchez B, Bandarenka AS et al. , “Novel approach of processing electrical bioimpedance data using differential impedance analysis,” Med. Eng. Phys, vol. 35, no. 9, pp. 1349–1357, September 2013. [DOI] [PubMed] [Google Scholar]
- [21].Gabriel S, Lau RW, and Gabriel C, “The dielectric properties of biological tissues : II . Measurements in the frequency range 10 Hz to 20 GHz,” Phys. Med. Biol, vol. 41, no. 11, pp. 2251–2269, November 1996. [DOI] [PubMed] [Google Scholar]
- [22].Nandedkar SD, “Emerging techniques in the electrodiagnostic laboratory,” PM R, vol. 5, no. 5, pp. S115–S122, May 2013. [DOI] [PubMed] [Google Scholar]
- [23].Cornish BH, Eles PT et al. , “The effect of electrode placement in measuring ipsilateral/contralateral segmental bioelectrical impedance.” Ann. N. Y. Acad. Sci, vol. 904, pp. 221–224, 2000. [DOI] [PubMed] [Google Scholar]
- [24].Rutkove SB, Aaron R, and Shiffman CA, “Localized bioimpedance analysis in the evaluation of neuromuscular disease.” Muscle Nerve, vol. 25, no. 3, pp. 390–7, March 2002. [DOI] [PubMed] [Google Scholar]
- [25].Sanchez B, Pacheck A, and Rutkove SB, “Guidelines to electrode positioning for human and animal electrical impedance myography research,” Sci. Rep, vol. 6, no. 1, p. 32615, December 2016. [DOI] [PMC free article] [PubMed] [Google Scholar]
- [26].Narayanaswami P, Spieker AJ et al. , “Utilizing a handheld electrode array for localized muscle impedance measurements.” Muscle Nerve, vol. 46, no. 2, pp. 257–63, August 2012. [DOI] [PMC free article] [PubMed] [Google Scholar]
- [27].Li Z, Li Y et al. , “Microneedle Electrode Array for Electrical Impedance Myography to Characterize Neurogenic Myopathy,” Ann. Biomed. Eng, vol. 44, no. 5, pp. 1566–1575, September 2016. [DOI] [PubMed] [Google Scholar]
- [28].Pinheiro DS, Manzano GM, and Nóbrega JAM, “Reproducibility in nerve conduction studies and F-wave analysis,” Clin. Neurophysiol, vol. 119, no. 9, pp. 2070–2073, September 2008. [DOI] [PubMed] [Google Scholar]
- [29].Kohara N, Kimura J et al. , “F-wave latency serves as the most reproducible measure in nerve conduction studies of diabetic polyneuropathy: Multicentre analysis in healthy subjects and patients with diabetic polyneuropathy,” Diabetologia, vol. 43, no. 7, pp. 915–921, July 2000. [DOI] [PubMed] [Google Scholar]
- [30].Kimura J, “Facts, fallacies, and fancies of nerve conduction studies: Twenty-first annual Edward H. Lambert lecture,” Muscle and Nerve, vol. 20, no. 7, pp. 777–787, July 1997. [DOI] [PubMed] [Google Scholar]
- [31].——, “Long and short of nerve conduction measures: Reproducibility for sequential assessments,” J. Neurol. Neurosurg. Psychiatry, vol. 71, no. 4, pp. 427–430, October 2001. [DOI] [PMC free article] [PubMed] [Google Scholar]
- [32].Kendall R and Werner RA, “Interrater reliability of the needle examination in lumbosacral radiculopathy.” Muscle Nerve, vol. 34, no. 2, pp. 238–41, August 2006. [DOI] [PubMed] [Google Scholar]
- [33].Rutkove SB, Lee KS et al. , “Test-retest reproducibility of 50 kHz linear-electrical impedance myography.” Clin. Neurophysiol, vol. 117, no. 6, pp. 1244–8, June. [DOI] [PubMed] [Google Scholar]
- [34].Statland JM, Heatwole C et al. , “Electrical impedance myography in facioscapulohumeral muscular dystrophy,” Muscle and Nerve, vol. 54, no. 4, pp. 696–701, 2016. [DOI] [PMC free article] [PubMed] [Google Scholar]
- [35].Li Z, Chen L et al. , “Handheld Electrical Impedance Myography Probe for Assessing Carpal Tunnel Syndrome,” Ann. Biomed. Eng, vol. 45, no. 6, pp. 1572–1580, March 2017. [DOI] [PubMed] [Google Scholar]
- [36].Kwon H, de Morentin MM et al. , “Approximate complex electrical potential distribution in the monodomain model with unequal conductivity and relative permittivity anisotropy ratios,” Physiol. Meas, vol. 40, no. 8, p. 085008, September 2019. [DOI] [PubMed] [Google Scholar]
- [37].Nandedkar SD and Sanders DB, “Recording characteristics of monopolar EMG electrodes.” Muscle Nerve, vol. 14, no. 2, pp. 108–12, February 1991. [DOI] [PubMed] [Google Scholar]
- [38].Nandedkar SD, Tedman B, and Sanders DB, “Recording and physical characteristics of disposable concentric needle EMG electrodes.” Muscle Nerve, vol. 13, no. 10, pp. 909–14, October 1990. [DOI] [PubMed] [Google Scholar]
- [39].Hu C, Hu H et al. , “Correlation Between Muscle Structures and Electrical Properties of the Tibialis Anterior in Subacute Stroke Survivors: A Pilot Study,” Front. Neurosci, vol. 13, November 2019. [DOI] [PMC free article] [PubMed] [Google Scholar]