

Abstract
The global burden of diabetes is rapidly increasing, from 451 million people in 2019 to 693 million by 20451. The insidious onset of type 2 diabetes delays diagnosis and increases morbidity2. Given the multifactorial vascular effects of diabetes, we hypothesized that smartphone-based photoplethysmography (PPG) could provide a widely-accessible digital biomarker for diabetes. Here, we developed a deep neural network (DNN) to detect prevalent diabetes using smartphone-based PPG from an initial cohort of 53,870 individuals (the “Primary Cohort”), which was then validated in a separate cohort of 7,806 individuals (the “Contemporary Cohort”), and a cohort of 181 prospectively-enrolled individuals from three clinics (the “Clinic Cohort”). The DNN achieved an area under the curve (AUC) for prevalent diabetes of 0.766 in the Primary Cohort (95% confidence interval (CI): 0.750–0.782; sensitivity 75%, specificity 65%) and 0.740 in the Contemporary Cohort (95% CI: 0.723–0.758; sensitivity 81%, specificity 54%). When the output of the DNN, called the DNN Score, was included in a regression analysis alongside age, gender, race/ethnicity, and body mass index, the AUC was 0.830 and the DNN Score remained independently predictive of diabetes. The performance of the DNN in the Clinic Cohort was similar to that in other validation datasets. There was a significant and positive association between the continuous DNN Score and hemoglobin A1c (HbA1c) (p≤0.001) among those with HbA1c. These findings demonstrate that smartphone-based PPG provides a readily attainable, noninvasive digital biomarker of prevalent diabetes.
Keywords: Diabetes mellitus, Machine learning, deep neural network (DNN), artificial intelligence, remote sensors, smartphone, photoplethysmography (PPG)
Globally, half of all people living with diabetes are undiagnosed (~224 million), and 79% live in low and middle-income countries1. Diabetes causes both macrovascular and microvascular multi-organ disease, including coronary heart disease, stroke, neuropathy and kidney disease, among others3. A readily attainable, non-invasive digital biomarker of diabetes could facilitate disease detection by making it easier to identify at-risk individuals who would benefit from confirmatory diagnostic testing using HbA1c. Such a tool would have particular impact in underserved populations and those out of reach from traditional medical care.
PPG is a noninvasive optical technique which detects blood flow changes through a vascular bed4. It is measured by shining light into tissue, such as the fingertip or wrist, and quantifying the backscattered light that corresponds with changes in blood volume4. PPG has long been used clinically to measure heart rate (HR) and peripheral blood oxygen saturation4, and research applications have ranged from detection of hypertension5 to various cardiovascular abnormalities6,7. Until recently, PPG recording required specialized equipment, however technological developments have enabled PPG measurement from sensors on smart-devices, like smartphones and fitness trackers. The rapid worldwide adoption of smart-devices over the past decade8 provides an opportunity to develop non-invasive, widely-scalable digital biomarkers for diseases like diabetes9.
PPG is uniquely positioned to capture the multifactorial sequelae of diabetes resulting from a variety of pathophysiologic mechanisms. PPG readily captures sequential heartbeats, enabling not only its longstanding use for HR measurement, but also heart rate variability, which is impacted by diabetic autonomic and neural-regulatory effects10-12. Recently, a shared genetic etiology between resting HR and diabetes was identified, implicating mechanisms ranging from metabolism to endothelial aging13. Indeed, endothelial dysfunction is an early hallmark of diabetic vascular disease, and is readily detectable in the PPG waveform14. Similarly, diabetes-related microvascular arteriosclerosis6,15 and neuropathy can affect PPG16. Given the multitude of mechanisms by which diabetes impacts PPG, algorithmic analysis of PPG should ideally leverage the complete PPG recording and all the morphologic and temporal information contained therein. DNNs are a class of algorithms17 which have successfully achieved complex pattern recognition for various medical tasks18-20. DNNs provide the advantage of being agnostic to specific sets of predetermined PPG features suspected to predict diabetes, and instead detect patterns using the full PPG record. We therefore hypothesized that PPG obtained from commercially available smartphones and analyzed using a DNN could identify individuals with and without diabetes.
In this study, we first developed and validated a DNN to detect prevalent diabetes in a “Primary Cohort,” comprised of 53,870 Health eHeart study21 participants who contributed 2,589,448 PPG recordings between April 1, 2014 and April 30, 2018 (Figure 1a). Participants self-reported diabetes status and measured PPG by placing an index fingertip on the smartphone camera using the Azumio Instant Heart Rate iOS application (Azumio, Inc; Figure 1b). The Primary Cohort was randomly split into training (70%, n=37,709) and development (10%, n=4,848) datasets—used to train and tune the DNN, respectively—and a Test Dataset (20%, n=11,313), used for DNN validation. The DNN outputs a “DNN Score” between 0 and 1, with higher scores suggesting greater likelihood of diabetes (see Methods). Since many participants contributed >1 recording, we reported DNN performance using AUC22 at both the ‘recording-level,’ which treats each recording independently, and the ‘user-level,’ which averages the DNN Score for all recordings provided by a user; user-level assessment was preferred when possible since clinical application calls for classifying a user as having diabetes or not.
Figure 1: Consort diagram describing the study cohorts and screenshots from the smartphone app used for PPG acquisition.

a. Description of the datasets used for algorithm development and validation. The deep neural network (DNN) was trained using the training and development dataset of the Primary Cohort (left), and validated using the test dataset of the Primary Cohort. We additionally validated the DNN in the temporally-distinct Contemporary Cohort (middle) and the prospectively enrolled, in-person Clinic Cohort (right). Blue outlines indicate datasets used for model development and training. Yellow outlines indicate datasets used for model validation. All datasets are completely separate and do not contain overlapping participants. b. Screenshots from the smartphone app used to acquire user-measured PPG recordings using a smartphone app and camera. PPG: photoplethysmography; BPM: beats per minute. DNN: Deep Neural Network; Hz: Hertz.
In the Primary Cohort, 3,564 participants (6.6%) had self-reported diabetes and 50,306 (93.3%) did not (Extended Data Figures 1-2). Compared to those without diabetes, those with diabetes were older, male, had higher HR and body mass index (BMI), and were less likely to be non-Hispanic white. In the hold-out Test Dataset, the DNN’s AUC to detect diabetes was 0.766 at the user-level (95% CI: 0.750–0.782; recording-level AUC=0.680, 95% CI: 0.678–0.683; Table 1 and Figure 2a). At the chosen cut-off threshold (DNN Score=0.427), user-level sensitivity was 75% and specificity was 65%. Due in part to the low prevalence of diabetes in our cohort (6.6%), the positive predictive value (PPV) of the DNN Score at the user-level and recording-level was 13% and 10%, while the negative predictive value (NPV) was 97% and 96%, respectively (Table 1). DNN performance in the development dataset was not significantly different from the Test Dataset (user-level AUC=0.766, 95% CI: 0.740–0.792; recording-level AUC=0.694, 95% CI: 0.691–0.698).
Table 1. Performance of the DNN to detect diabetes using PPG in three validation datasets.
Sample sizes reported indicate individual people. User-level performance metrics are reported based on the average DNN score for all recordings from an individual user. Recording-level performance metrics are calculated treating each recording independently. Since Clinic Cohort participants only received one measurement, only the recording-level metric is reported for this cohort. Samples sizes shown indicate numbers of individual people.
| AUC (95% CI) | Sensitivity* | Specificity* | PPV* | NPV* | |
|---|---|---|---|---|---|
| Test Dataset, n=11,313 | |||||
| User-level | 0.766 (0.750-0.782) | 75.0% (72.0–77.8%) | 65.4% (64.6–66.3%) | 13.3% (12.3–14.3%) | 97.4% (97.0–97.7%) |
| Recording-level | 0.680 (0.678-0.683) | 66.2% (65.8–66.7%) | 60.2% (60.1–60.3%) | 10.2% (10.0–10.3%) | 96.3% (96.3 – 96.4%) |
| Contemporary Cohort, n=7,806 | |||||
| User level | 0.740 (0.722-0.756) | 80.7% (77.7–83.6%) | 54.4% (53.2–55.5%) | 14.5% (13.3–15.5%) | 96.7% (96.2–97.2%) |
| Recording-level | 0.664 (0.661-0.667) | 72.8% (72.2–73.3%) | 51.6% (51.4–51.8%) | 14.6% (14.5–14.8%) | 94.3% (94.2–94.4%) |
| Clinic Cohort, n=181 | |||||
| Recording-level | 0.682 (0.605–0.755) | 81.7% (69.2–93.1%) | 53.4% (45.8–61.1%) | 31.9% (22.9-40.7%) | 91.6% (85.7-97.0%) |
| Newly Diagnosed Diabetes, Recording-level, (n=164) | 0.644 (0.546–0.744) | 75.9% (56.3–92.9%) | 53.0% (45.2–61.2%) | 19.1% (11.2–28.3%) | 93.8% (88.2–98.4%) |
Metrics are reported at a threshold of DNN score=0.427; this threshold can be altered to optimize DNN performance on specific metrics as suitable for future applications. Abbreviations: CI: Confidence Interval; PPV: Positive predictive value; NPV: Negative predictive value; AUC: Area under the ROC curve.
Figure 2: Comparison of model performance to detect diabetes in the Test Dataset.

a. Receiver operating characteristic curves for detection of diabetes, as assessed for the DNN score alone or for the output of LogReg Model 5, which includes comorbidities, with and without the DNN Score. This is calculated at either the recording-level, which treats each recording independently, or at the user-level, which is averaged across all recordings of an individual user. The DNN Score cutoff used (0.427) is indicated by a black dot on each curve. Inset: Bar chart showing the area under the receiver operating characteristic curve (AUC) point estimate values for diabetes in the test dataset by the indicated models; 95% confidence intervals are shown as error bars. b. DNN sensitivity, specificity, diagnostic odds-ratio and AUC to detect prevalent diabetes in the Test Dataset, as reported across ranges of age, gender and number of recordings. The Test Dataset sample size is 11,313 individuals. Counts are provided in parentheses for all subgroup metrics. The diagnostic odds-ratio was quantified as the ratio of positive likelihood ratio (sensitivity / (1–specificity)) to the negative likelihood ratio ((1–sensitivity)/specificity), with the associated 95% CI. The diagnostic odds-ratio is presented at the user-level for strata of age, gender and number of recordings. Interaction p-values are two-sided Wald tests between the DNN Score and the respective covariates for diabetes. Abbreviations: DNN: deep neural network; AUC: area under the receiver operating characteristic curve; OR: diagnostic odds ratio; CI: confidence interval.
In addition to validating DNN performance in the Primary Cohort Test Dataset, we employed 2 additional validation cohorts (Figure 1a), providing 3 total examples of algorithm generalizability to datasets distinct from the training dataset23. The first was the “Contemporary Cohort,” composed of PPG recordings from 7,806 participants newly-enrolled into Health eHeart from May 1 to December 31, 2018. This temporally-distinct validation cohort exhibits the DNN’s robustness to secular changes, such as new smartphone models and cameras, that could affect PPG recording. Then, to validate our approach in a real-world clinical setting, we prospectively enrolled an in-person “Clinic Cohort” comprised of 181 consecutive patients referred to 3 cardiovascular prevention clinics (2 in San Francisco, one in Montreal) between November 1, 2018 and July 30, 2019 (Figure 1a, Extended Data Figure 3). The DNN’s user-level AUC to detect diabetes in the Contemporary Cohort was similar to that in the Primary Cohort: 0.740 (95% CI: 0.723–0.758; recording-level AUC=0.661, 95% CI: 0.664–0.667); the DNN had higher sensitivity, but lower specificity, versus the Primary Cohort (Table 1).
In the prospectively enrolled in-person Clinic Cohort, 38 patients (21.0%) had medical record-confirmed diabetes (Extended Data Figure 3). Compared with the Primary Cohort, the Clinic Cohort was substantially older, more male, and had more comorbidity. The Clinic Cohort recording-level AUC (0.682, 95% CI 0.605–0.755) was similar to the recording-level AUC in the Test Dataset and Contemporary Cohorts (Table 1). Compared with the Test Dataset, there was higher sensitivity and PPV, but lower specificity and NPV. When Clinic Cohort patients with a prior diabetes diagnosis were excluded (n=17), 21 patients remained who were newly diagnosed by HbA1c during the clinic visit. In this subset of patients with newly diagnosed diabetes, the DNN AUC was 0.644 (95% CI: 0.546–0.744; Table 1); the DNN correctly identified 16 out of 21 patients with newly diagnosed diabetes (Extended Data Figure 4f).
To investigate whether PPG was predictive of diabetes independently of other predictors and comorbidities, we built nested logistic regression (LogReg) models in the Test Dataset with and without the inclusion of the DNN Score (Table 2). After adjustment for age, gender, race and BMI, the DNN Score remained independently and significantly predictive of prevalent diabetes (Table 2, Supplemental Table 1); the AUC for this prediction model was 0.830 (95% CI: 0.787–0.873; Figure 2a). The DNN Score was also strongly predictive of diabetes independently of all examined comorbidities, including hypertension, hypercholesterolemia and coronary artery disease, among others (Table 2; LogReg-Model 5); the AUC for this prediction model was 0.830 (95% CI: 0.815–0.844; Figure 2a). In all models, the DNN Score was a strong diabetes predictor and was only slightly attenuated after adjustment (Table 2, Supplemental Table 1). Heart rate variability was no longer a significant predictor of diabetes after the DNN Score was added, while HR was attenuated (Table 2, LogReg-Model 4). Compared to participants with a DNN Score below the cutoff (<0.427), those with a DNN Score above the cutoff differed demographically and were nearly twice as likely to have any medical condition (69.4% vs 37.3%; p<0.001; Supplemental Table 2).
Table 2. Performance of logistic regression models for prediction of prevalent diabetes with and without the DNN score in the Test Dataset.
All models are shown without (“a”) and with (“b”) inclusion of the DNN score as a predictor. Models 1-3 are nested models, containing incrementally more demographic predictors and BMI. Model 4 adjusts for heart rate and heart rate variability. Model 5 adjusts for common cardiovascular comorbidities. Sample sizes reported indicate individual people.
| Predictor | Multivariable-adjusted OR without DNN Score (95% CI) |
p- value† |
Multivariable- adjusted OR with DNN Score (95% CI) |
p-value† |
|---|---|---|---|---|
| LogReg Model 1a: Age: AUC=0.691 (95% CI: 0.672–0.710) (n=11,313) | LogReg Model 1b: 1a + DNN score: AUC=0.770 (95% CI: 0.754-0.786) (n=11,313) | |||
| Age, years | 1.04 (1.04–1.05) | <0.001 | 1.01 (1.01–1.02) | <0.001 |
| DNN Score, per SD | - | - | 2.69 (2.41-2.99) | <0.001 |
| LogReg Model 2a: Age, gender and race: AUC=0.698 (95% CI: 0.674 – 0.722) (n=7,851) | LogReg Model 2b: 2a + DNN score: AUC=0.777 (0.757 – 0.798) (n=7,851) | |||
| Age, years | 1.04 (1.04–1.05) | <0.001 | 1.01 (1.00–1.02) | 0.013 |
| Gender | ||||
| Males | Ref. | - | Ref. | - |
| Females | 0.99 (0.82-1.21) | 0.996 | 0.65 (0.53–0.79) | <0.001 |
| Race/Ethnicity | 0.003 | 0.17 | ||
| Non-Hispanic White, n (%) | Ref. | - | Ref. | - |
| Black or African American, n (%) | 1.87 (1.11-3.15) | 0.001 | 1.40 (0.82 - 2.38) | 0.213 |
| Hispanic, Latino or Spanish origin/ancestry, n (%) | 0.73 (0.49-1.07) | 0.106 | 0.69 (0.46 – 1.01) | 0.058 |
| Asian, n (%) | 1.86 (1.30-2.67) | 0.001 | 1.46 (1.01 – 2.12) | 0.047 |
| Multi-ethnic, n (%) | 1.27 (0.78-2.07) | 0.344 | 1.29 (0.78 – 2.13) | 0.314 |
| Other, n (%) | 0.974 (0.49-1.95) | 0.941 | 0.86 (0.42 – 1.74) | 0.674 |
| DNN Score, per SD | - | - | 2.88 (2.51-3.31) | <0.001 |
| LogReg Model 3a: Age, gender, race and BMI: AUC 0.801 (95% CI: 0.752 – 0.850) (n=1,033) | LogReg Model 3b: 3a + DNN score: AUC: 0.830 (95% CI: 0.787 – 0.873) (n=1,033) | |||
| Age, years | 1.04 (1.02 - 1.06) | <0.001 | 1.01 (0.99 – 1.04) | 0.189 |
| Males | Ref. | - | Ref. | - |
| Females | 0.67 (0.39–1.13) | 0.130 | 0.51 (0.30 – 0.88) | 0.015 |
| Race | 0.232 | 0.415 | ||
| Non-Hispanic White | Ref. | - | Ref. | - |
| Black or African American | 0.33 (0.04 –2.63) | 0.294 | 0.32 (0.04 – 2.63) | 0.291 |
| Hispanic, Latino or Spanish origin or ancestry | 1.22 (0.45 –3.35) | 0.696 | 1.08 (0.38 – 3.05) | 0.884 |
| Asian or Pacific Islander | 2.82 (0.97-8.22) | 0.058 | 2.36 (0.77 – 7.24) | 0.135 |
| Multi-ethnic | 0.416(0.12-1.45) | 0.168 | 0.46 (0.13 – 1.59) | 0.218 |
| Other/prefer not to disclose | 0 (0) | 0.999 | 0 (0) | 0.999 |
| BMI | 1.15 (1.11–1.19) | <0.001 | 1.08 (1.04-1.12) | <0.001 |
| DNN Score, per SD | - | - | 2.12 (1.53 – 2.94) | <0.001 |
| LogReg Model 4a: Heart Rate and Heart Rate Variability: AUC 0.586 (95% CI: 0.565 – 0.606) (n=11,313) | LogReg Model 4b: 4a + DNN score: AUC: 0.765 (0.748 – 0.782) (n=11,313) | |||
| HR, bpm | 1.02 (1.01–1.02) | <0.001 | 1.01 (1.00–1.01) | 0.024 |
| HRV - RMSSD, per 10 ms | 0.97 (0.94-0.99) | 0.027 | 1.02 (1.00 – 1.05) | 0.068 |
| DNN Score, per SD | - | - | 2.92 (2.65 – 3.21) | <0.001 |
| LogReg Model 5a: Comorbidities: AUC 0.784 (0.766 – 0.802) (n=11,313) | LogReg Model 5b: 5a + DNN score: AUC 0.830 (0.815 – 0.844) (n=11,313) | |||
| Hypertension, n (%) | 3.49 (2.93-4.16) | <0.001 | 2.57 (2.15 – 3.07) | <0.001 |
| Hypercholesterolemia, n (%) | 2.44 (2.05-2.89) | <0.001 | 1.97 (1.66 – 2.34) | <0.001 |
| Coronary artery disease, n (%) | 1.35 (1.04-1.76) | 0.024 | 1.22 (0.94 – 1.59) | 0.144 |
| Prior MI, n (%) | 1.04 (0.74-1.48) | 0.815 | 1.06 (0.74 – 1.50) | 0.765 |
| CHF, n (%) | 2.39 (1.67-3.42) | <0.001 | 2.09 (1.46 – 2.98) | <0.001 |
| PVD, n (%) | 1.49 (1.00 -2.21) | 0.051 | 1.43 (0.97 – 2.11) | 0.075 |
| Prior Stroke, n (%) | 1.91 (1.39-2.61) | <0.001 | 1.74 (1.27 – 2.38) | 0.001 |
| Sleep apnea n (%) | 2.06 (1.72-2.46) | <0.001 | 1.85 (1.54 – 2.22) | <0.001 |
| DNN Score, per SD | - | - | 2.22 (2.00 – 2.46) | <0.001 |
Abbreviations: LogReg: logistic regression; OR: diagnostic odds-ratio; BMI: body mass index; CI: Confidence Interval; DNN: Deep neural network; SD: standard deviation; AUC: area under the receiver operating characteristic curve; HR: Heart Rate; HRV: Heart Rate Variability; RMSSD: Root Mean Square of Successive RR interval differences; y: years. Independent variables were standardized using the Z-score.
p-value is calculated using the Wald test for the multivariable adjusted odds ratio (two-sided).
We performed several sensitivity analyses for hypertension specifically, since it is co-morbid with diabetes and may directly cause PPG-measurable vascular changes. A subset of Test Dataset participants provided Bluetooth-linked, home-measured blood pressures within 3 months of a PPG recording, totaling 13,007 PPG-blood pressure recording pairs (55 patients with diabetes, 527 patients without diabetes). Though the systolic (but not diastolic) value was a significant univariate predictor of diabetes, after the DNN Score and other (non-hypertension) comorbidities were added into a multivariable model, systolic blood pressure was no longer a significant diabetes predictor; the DNN Score, however, remained strongly independent (odds-ratio: 3.53, 95% CI: 2.20–5.67; p<0.001). Furthermore, after excluding those with self-reported hypertension from the Test Dataset, DNN performance remained similar to that in the full Test Dataset at both user and recording-levels.
Due to the limitations of relying on self-reported diabetes in our primary analysis, we performed additional sensitivity analyses aimed at addressing this. We identified Health eHeart participants who had laboratory-confirmed diabetes based on fasting glucose or HbA1c drawn within 180 days of diabetes self-report (n=12,073). In this subset, the PPV of self-reported diabetes was 81.8% (1,816/2,220) and the NPV was 88.9% (8,767/9,853). We additionally examined the performance of the DNN amongst participants who had laboratory-confirmed diabetes within 180 days of a PPG measurement in the Test Dataset (n=152 users; 9,327 measurements) and Contemporary Cohort (n=94 users; 3,659 measurements). Sampling up to 5 measurements per participant, the DNN’s recording-level AUCs were similar when using laboratory-confirmed diabetes or self-reported diabetes in both the Test Dataset (0.670, 95% CI: 0.629–0.710; vs 0.650, 95% CI: 0.606–0.694) and the Contemporary Cohort (0.669, 95% CI 0.618–0.719; vs 0.705, 95% CI: 0.657–0.754).
In these laboratory-confirmed diabetes subsets (n=246), there was also evidence for a significant linear association between the continuous DNN Score and both HbA1c and fasting glucose: one standard-deviation increase in DNN Score was associated with 0.32% increase in HbA1c (beta-coefficient=2.28, 95% CI: 1.27–3.29; p≤0.001) and 0.11 mmol/L increase in fasting glucose (beta-coefficient=0.82, 95% CI: 0.30–1.34; p≤0.001). Similarly, among Clinic Cohort patients with an HbA1c measured within 7 days of the visit (n=93), there was a positive, borderline association between the DNN Score and HbA1c values (beta-coefficient=1.58, 95% CI: −0.021–3.187; p=0.053). Since longstanding poor glycemic control can adversely affect the vasculature and therefore PPG, we also performed a sensitivity analysis comparing DNN performance between HbA1c strata. Among Test Dataset participants with an HbA1c 7.0–8.0% within 6 months of a PPG measurement, we observed similar recording-level AUC=0.636 (95% CI: 0.587–0.686) to that in those with an HbA1c >8.0%, AUC=0.632 (95% CI: 0.585 – 0.679), suggesting similar DNN performance regardless of glycemic control. We also examined the diagnostic odds-ratio for a positive DNN prediction across different Test Dataset strata of gender, age, time of day, recording length and HR (Figure 2b, Extended Data Figure 5). DNN performance was the highest in those with >6 recordings and HR <100 BPM.
Finally, we performed several analyses to help illuminate the mechanisms by which PPG may capture diabetes-related information. We plotted activation maps from inner DNN layers that illustrate how it encodes input PPG recordings, and its behavior in the presence of artifact (Extended Data Figures 6-7). To investigate the role of PPG morphology to predict diabetes in isolation, we trained a separate DNN using a single cardiac cycle PPG waveform as the sole input; user-level AUC=0.691 (95% CI: 0.680–0.700) and recording-level AUC=0.605 (95% CI: 0.600–0.610). To investigate the role of HR and its derivatives in isolation, we trained a separate DNN using only peak-to-peak PPG intervals as the sole input (which removes all PPG morphology information); user-level AUC=0.721 (95% CI: 0.703–0.740) and recording-level AUC=0.645 (95% CI: 0.642–0.647).
Discussion
In this large-scale study and validation across 3 distinct cohorts, we show that smartphone-measured PPG, analyzed with deep learning, can serve as an independent, noninvasive digital biomarker of prevalent diabetes. Importantly, the ability of this PPG biomarker to predict diabetes was independent of standard risk factors and comorbidities, and discrimination further improved when adding easily obtainable covariates such as age, gender, race/ethnicity and BMI. Our validation of this digital biomarker in 3 cohorts demonstrated that the DNN generalizes to prospectively enrolled and real-world clinical populations. This digital biomarker of diabetes could serve as a readily attainable complement to other established tools, providing novel information about vascular and autonomic sequelae of diabetes for clinical applications ranging from screening to therapeutic monitoring. However additional research will be needed to determine its utility in these scenarios.
Our work effectively helps to expand the clinical utility of the PPG modality, since physicians do not currently interpret PPG in the context of diabetes. Prior work has reported associations between individually derived PPG features and diabetes-related physiologic changes, mostly using clinic-based pulse oximeters. The physiologic changes most commonly invoked include heart rate variability24, endothelial dysfunction14, arterial stiffness15 and combinations thereof24,25, providing important early indications that aspects of the PPG waveform contain diabetes-related information. Our study extends these findings, demonstrating that it is not necessary to derive (and be limited to) particular pre-defined PPG features; rather, the complete PPG recording—containing all the physiologic information—can be analyzed using a DNN to detect diabetes with strong predictive performance. This PPG-derived DNN biomarker is independent of comorbidities and can be augmented with clinical data, when available, to further improve performance. One of the real-world challenges of using remote sensor data to identify disease biomarkers in ambulatory patients is the multiple potential sources of environmental noise, user error and demographic heterogeneity. Our study makes this crucial translational step by using remotely-measured PPGs from commercially available smartphones in a free-living population.
There are various potential applications for a PPG-based digital biomarker of diabetes. Diabetes has numerous characteristics that make it an ideal candidate for screening, such as a prolonged asymptomatic period and the availability of disease modifying therapy. But since population-wide screening is not currently recommended, a widely accessible smart-device-based tool could be used to identify and encourage individuals at higher-risk of having prevalent diabetes to seek medical care and obtain a low-cost confirmatory diagnostic test like HbA1c26-28. Leveraging smart-devices to perform diabetes risk prediction without requiring clinic visits would significantly lower barriers to access given the widespread ownership of smartphones, facilitating measurement amongst many of the 224 million people living globally with undiagnosed diabetes1. The discriminative performance of our PPG biomarker is comparable to other commonly used tests such as mammography for breast cancer (AUC range 0.67–0.74)29 or cervical cytology for cervical cancer (AUC range 0.81–0.86)30. It compares favorably to existing diabetes-specific risk scores that have AUCs between 0.74–0.85, some of which require serum glucose measurement and none of which is in common clinical use23. Reported AUCs of serum-based diagnostic tests like HbA1c or fasting plasma glucose depend on the gold-standard comparator used, but for prevalent microvascular complications range from 0.82–0.9631. Comparatively, the ease and noninvasiveness of PPG make it widely scalable, and its painlessness makes it attractive for repeated testing. Furthermore, since the PPG biomarker is predictive independently of the demographic and comorbidity components comprising most risk scores, it could also be used to supplement existing scores by capturing complementary vascular and autonomic information.
Of the various mechanisms by which PPG may detect diabetes, PPG likely captures the majority of the HR and heart rate variability information as relates to diabetes10-13,32. Both predictors were attenuated in the presence of the DNN Score, and peak-to-peak PPG interbeat intervals had only modestly lower AUC (0.721) than the full PPG record (0.766). While interbeat intervals likely contain the predominant predictive information for diabetes, waveform morphologies likely additionally capture information on diabetic vascular changes ranging from endothelial dysfunction14 to arterial stiffening15.
Our study has several limitations. Participants elected to download the iOS smartphone app and therefore may have higher socioeconomic status, technological competence, or health literacy relative to the general population. Our reliance on self-reported diabetes is another limitation. However, our results generalized to the unselected Clinic Cohort, which had medical-record confirmed diabetes, and sensitivity analysis suggested high PPV/NPV against laboratory-confirmed diabetes. Also, misclassification due to self-report at the algorithm training stage would be expected to bias DNN performance toward the null during validation. In analyses that employed laboratory or blood pressure measurements, the time-windows we employed were large and mainly informative as sensitivity analyses. Future studies are needed to confirm this, and whether PPG signals from other sources, like smartwatches, or obtained from anatomic locations like the toe or ear would perform similarly. Given the lower overall prevalence of diabetes, the PPV of our PPG biomarker ranged from 10–32%, which is similar to existing diabetes risk scores whose PPVs mostly range between 10–25% depending on the population and threshold used23,33. While false positives are a concern, confirmatory HbA1c is relatively cost-effective; and since individuals with positive DNN predictions were also more likely to have cardiometabolic conditions, they would likely benefit from medical contact. Depending on the intended use of the biomarker, the DNN Score threshold can also be altered to maximize sensitivity or specificity for the intended application. The cross-sectional nature of our study design limited direct investigation of PPG as a diabetes screening tool, or prediction of incident diabetes. We also did not have sufficient data in the Primary Cohort on the type, severity, or medication use for diabetes. The DNN Score did perform similarly, however, in Clinic Cohort subsets with newly diagnosed diabetes and between HbA1c strata. Finally, we were limited in our attempts to compare our approach against standard diabetes risk scores due to the lack of necessary variables in our cohort. These data availability limitations, however, serve to illuminate the difficulty providers also encounter when deploying existing questionnaire-based prediction models, underscoring a strength of noninvasive, objective PPG-based diabetes detection.
In summary, we demonstrate that PPG recorded using consumer-owned smartphones can provide a readily attainable digital biomarker of prevalent diabetes that is independent of standard risk factors and comorbidities. Remote capture of diabetes-predictive PPG information from ambulatory users is feasible and provides an easily scalable, noninvasive complement to diabetes risk prediction. The linear association of the DNN Score with HbA1c suggests that PPG may additionally capture information about diabetes severity and control, but this requires further investigation. Though this study leverages a large dataset, additional research is needed ideally in targeted intended-use populations to determine how to best incorporate this digital biomarker into existing practice recommendations for diabetes screening and care—particularly in light of the potential for its wide deployment using existing smart-devices outside of the purview of traditional medical care.
Methods
Data sources and study population
The Primary Cohort:
The Primary Cohort was derived from 55,433 Health eHeart participants age ≥18 years, who self-reported a diabetes diagnosis by a healthcare provider and made at least one PPG recording between April 1, 2014 and April 30, 2018 (Figure 1a). Health eHeart is a worldwide, internet-based, longitudinal electronic cohort of English-speaking adults21. PPG waveforms were obtained by placing an index fingertip on the smartphone camera (Figure 1b, Extended Data Figure 8). To assess self-reported diabetes status, participants were asked, “Have you ever been told by a doctor, nurse or other healthcare provider that you have diabetes?” and provided the answer options of “Yes,” “No” or “Don’t know/prefer not to state.” Participants who answered “Don’t know/prefer not to state” were excluded from our analysis. Participants completed additional surveys regarding demographics, anthropometrics and medical history to varying degrees. We have demonstrated previously21 that self-reported past medical history in Health eHeart is strongly correlated with the medical record.
The Primary Cohort was randomly split into training (70%, n=37,709), development (10%, n=4,848) and Test (20%, n=11,313) datasets (Extended Data Figure 2; Life Sciences Reporting Summary). The training dataset was used for DNN development and training, and DNN hyperparameters were tuned in the development dataset. Final model performance is reported in the Test Dataset, which was kept completely separate until the final evaluation step.
Two Additional Validation Cohorts:
In addition to validating the performance of the DNN algorithm in the Primary Cohort Test Dataset, we additionally reported DNN performance in 2 validation cohorts (Figure 1a), providing 3 examples of validation in datasets separate from training data23. The first was the “Contemporary Cohort” which was composed of PPG recordings from 7,806 participants newly enrolled into Health eHeart between May 1, 2018 and December 31, 2018 (Extended Data Figure 3, Supplemental Table 3). This temporally distinct validation cohort helps to account for secular changes, such as changes in smartphone models and cameras, that could affect PPG recording. Then, to test the validity of our approach in a real-world clinical setting, we prospectively enrolled an in-person “Clinic Cohort” comprised of 181 consecutive patients referred to 3 cardiovascular prevention clinics (2 in San Francisco, one in Montreal) between November 1, 2018 and July 30, 2019 (Extended Data Figure 3, Supplemental Table 4). Clinic Cohort participants were consented, assessed for height, weight, body mass index (BMI), and a trained coordinator obtained at least 15 seconds of a single PPG recording using an iPhone and determined diabetes status by medical chart review. For the subset of Clinic Cohort patients who also had fasting glucose and HbA1c obtained within 7 days of the in-clinic visit, we used the American Diabetes Association diagnosis criteria to classify participants as having/not having diabetes34.
The UCSF Institutional Review Board approved the study and all participants gave informed consent.
PPG Waveform Acquisition and Preprocessing
PPG waveforms were obtained by placing the index fingertip35 on the smartphone camera using the Azumio Instant Heart Rate iOS smartphone application (Azumio, Inc). Though the app is available for Android and iOS operating systems, data was limited to iOS app versions in this study due to data availability in Health eHeart. Changes in reflected light intensity recorded by the smartphone camera are interpreted as pulsatile blood volume change. The waveforms were pre-processed by the Azumio algorithm for camera artifact removal, utilizing standard de-trending and low pass filter techniques (Figure 1). A Low pass ~0.4Hz, 2nd order, zero phase shift IIR filter is used to find the trend, the trend is subtracted to get the detrended signal. Another Low pass ~10Hz, 2nd order, zero phase shift IIR filter is used to remove high frequency noise. Individual beats corresponding to cardiac cycles were identified using the rising-edge of the PPG signal. If the recording does not have at least 5 seconds of continuous discernable peak-to-peak intervals, it was removed. Waveforms with a length under 5 seconds or with an amplitude of “0”, indicating a null signal, were also removed. We excluded outlier PPG measurements defined as HR values of outside of the biologically plausible range of 20–220 bpm. We limited waveforms in our dataset to those collected at either 100Hz or 120Hz, and upsampled recordings of 100 Hz to 120 Hz using the standard polyphase method36 to minimize variance due to sampling frequency. We derived the onset of each cardiac cycle by identifying the rising-edge of the waveform, used to determine HR and heart rate variability (using Root Mean Square of Successive peak-to-peak interval differences).
DNN Development and Performance
We built a 39-layer convolutional DNN to detect prevalent diabetes (Extended Data Figure 9). The DNN takes the PPG-waveform as the sole input, which consists of 2,560 samples equivalent to ~21.3 seconds (approximately the mean signal duration), and outputs a DNN Score between 0 and 1 per signal; higher scores suggest greater likelihood of diabetes. Shorter signals were zero-padded up to the fixed-length and longer examples were cropped. All PPG waveforms were standardized using the mean and standard deviation values of the entire training dataset. The network architecture had 39 layers organized in a block structure, consisting of convolutional layers with an initial filter size of 15 and filter number of 16. The size of the filters decreased, and the number of filters increased, as network depth increased. After each convolutional layer, we applied batch normalization37, rectified linear activation38 and dropout 39 with a probability of 0.2. The final flattened and fully connected softmax layer produced a distribution across the classes of diabetes/no diabetes40. Weights were initialized randomly as described by He et al41.
We used grid-search to tune the network hyperparameters by searching over the best optimizer, best initializer, number of convolutional layers, the stride size, the filter length, the number of filters, the class weight, the learning rate, the input length of the signal, the batch size, the dropout, the early stopping criteria and the amount of cropping of the start/end of the signal, based on the recording-level development dataset performance. The best performance was achieved by cropping 2 beats from the beginning and 1 beat from the end of the signal; this was applied to all PPG records. For all the models presented, we used the Rectified ADAM optimizer with the default parameters42, and a mini-batch size of 512. The learning rate was initialized at 1 × 10⁻³ and was adjusted based on the effects of variance and momentum during training42. We halted training after an absence of improvement in the loss within the development set for 8 consecutive epochs. A class weight of 10:1 for diabetes to non-diabetes recordings was applied to our loss function. The best performing model was chosen based on the development dataset recording-level AUC performance and was then applied to all validation sets. We explored different architectures involving recurrent layers, such as long-short-term memory cells and residual blocks (ResNet), and with age or hour of the day added as additional inputs to the DNN, but found no improvement in AUC despite substantial increases in model complexity and runtime. The DNN was trained for 18 epochs.
Grid-search of hyperparameters
We performed systematic search of hyperparameters among these values:
Model architecture: Convolutional neural network, ResNet, LSTM
Number of convolutional layers: 7, 15, 19, 25, 29, 35, 39
Filter length: 5, 7, 9, 11, 13, 15
Number of filters to start: 8, 16, 32, 64
Optimizer: Adam, Rectified Adam
Class weight for ‘diabetes’: 5, 10, 15, 20
Initializer: Glorot, He
Learning Rate: 10e-1 10e-2, 10e-3, 10e-4, 10e-5
Input shape [2560, 1]; [2048, 1]
Batch size: 64, 128, 256, 512
Dropout: 0.2, 0.4, 0.6
Early stopping criteria: 6, 8, 12, 20
(Preprocessing) Number of beats cropped at the start of the signal: 0, 1, 2, 3
(Preprocessing) Number of beats cropped at the end of the signal: 0, 1, 2, 3
We reported DNN performance using the area under the receiver operating characteristic curve (AUC)22 in 3 separate test datasets: 1) the Primary Cohort Test Dataset, 2) the Contemporary Cohort, and 3) the in-person Clinic Cohort. Since many participants contributed >1 recording, we assessed model performance both at the ‘recording-level,’ which treats each recording independently, and at the ‘user-level,’ which averages the DNN Score for all recordings provided by an individual user. Our primary aim was to evaluate the user-level DNN Score, since the clinical goal would be to classify a patient as having diabetes or not. Clinic cohort patients have only recording-level performance since only a single recording was obtained per patient during their visit. We also plotted the activation maps of several hidden convolutional layers of the trained DNN43 from an example PPG record to help illuminate some of the higher-level PPG features derived by the DNN (Extended Figures 8-9).
Sensitivity Analyses
To better ascertain the reliability of self-reported diabetes in the Primary Cohort, we described the PPV and NPV of self-reported diabetes in the larger Health eHeart study21 using fasting glucose or HbA1c drawn within 180 days of self-reported diabetes; if >1 lab value was available the value closest in time to self-report was used. Laboratory-confirmed diabetes was defined according to the ADA guidelines: HbA1c≥7.0%, fasting glucose (fasting glucose≥126 mg/dl or 7.0 mmol/L)34 or non-diabetic range of HbA1c/fasting glucose but self-report of taking diabetes medications. We also examined DNN performance among the subset of Test Dataset and Contemporary Cohort participants who had laboratory-confirmed diabetes using laboratory values drawn within 180 days of a PPG measurement. For those with multiple measurements, we randomly sampled up to 5 measurements. To understand the performance of the DNN according to glycemic control in the laboratory-confirmed diabetes cohort, we examined DNN performance in strata of HbA1c above and below 8.0%. Additionally, in the Clinic Cohort, we examined DNN performance after excluding those with a prior diagnosis of diabetes. Linear regression models were fit with the DNN Score as the predictor and either HbA1c or glucose value as the dependent variable in the Test Dataset and Contemporary Cohort. To investigate the role of HR in isolation, we trained a separate DNN to detect diabetes using only peak-to-peak intervals as input and the same architecture and training data as the primary DNN. To investigate the role of the PPG waveform in isolation, we trained a separate DNN using the PPG waveform from a single cardiac cycle, removing the time-domain contribution from consecutive cardiac cycles. In the Clinic Cohort, we also modeled the DNN Score against HbA1c as the dependent variable with linear regression.
Statistical Analysis
Basic demographics and previous medical conditions are presented for each dataset, and continuous data are presented as mean ± standard deviation. The “DNN Score” is the final layer of the DNN, which is an output distribution for diabetes based on the PPG input. We identified a discrimination threshold for the DNN Score that maximized the macro average sensitivity between the ‘diabetes’ and ‘no-diabetes’ classes in the training dataset44; this threshold is applied to all relevant performance metrics. We present sensitivity, specificity, positive predictive value (PPV) and negative predictive value (NPV) for each of our test datasets22. Confidence intervals for these metrics were derived by bootstrapping 80% of the test data over 1000 iterations to obtain 5th and 95th percentile values. The diagnostic odds-ratio (odds-ratio) is a measure of the effectiveness of a diagnostic test and is defined as the ratio of the odds of the DNN Score being positive for diabetes if the subject has diabetes, relative to the odds of the DNN Score being positive if the subject does not have diabetes45. Odds-ratios, 2-sided p-values for interaction (between the DNN Score, the covariates and diabetes, calculated by the Wald test), sensitivity and specificity were calculated separately between different strata of age, gender and PPG recording characteristics.
To understand the incremental contribution of PPG-based predictions alongside commonly available demographic and clinical predictors of diabetes, we built nested logistic regression (LogReg) models for prevalent diabetes both with and without the inclusion of the standardized DNN Score. LogReg-Model-1 included age as a covariate; LogReg-Model-2 additionally included gender and race/ethnicity; LogReg-Model-3 additionally included BMI. Since HR12,13 and heart rate variability46 are known independent predictors of diabetes and can be derived from the PPG signal, we examined the specific role of HR in the PPG-based prediction of diabetes by including the per-record average HR and heart rate variability (calculated using the root mean square of the successive peak-to-peak differences) as covariates in LogReg-Model-4. Finally, in LogReg-Model-5 we included clinical comorbidities commonly known to co-occur with diabetes, to ascertain the independent value of the PPG DNN Score for identifying diabetes. All continuous logistic regression variables were standardized using the Z-score to allow comparison between odds-ratios and we used complete-case analysis, excluding individuals with missing covariates. Tests for normality were performed and met by all continuous predictors, and there were no adjustments made for multiple comparisons.
A 2-sided p-value <0.05 was considered significant. The convolutional neural network was built in Python 2.7 using Keras (version 2.0.3) and TensorFlow (version 1.13.2). The LogReg models and AUC were derived in SPSS v24.0 (IBM).
Code Availability:
The code that supports this work is copyright of the Regents of the University of California and can be made available through license.
Extended Data
Extended Data Fig. 1. Baseline characteristics of the Primary Cohort by Diabetes Status.
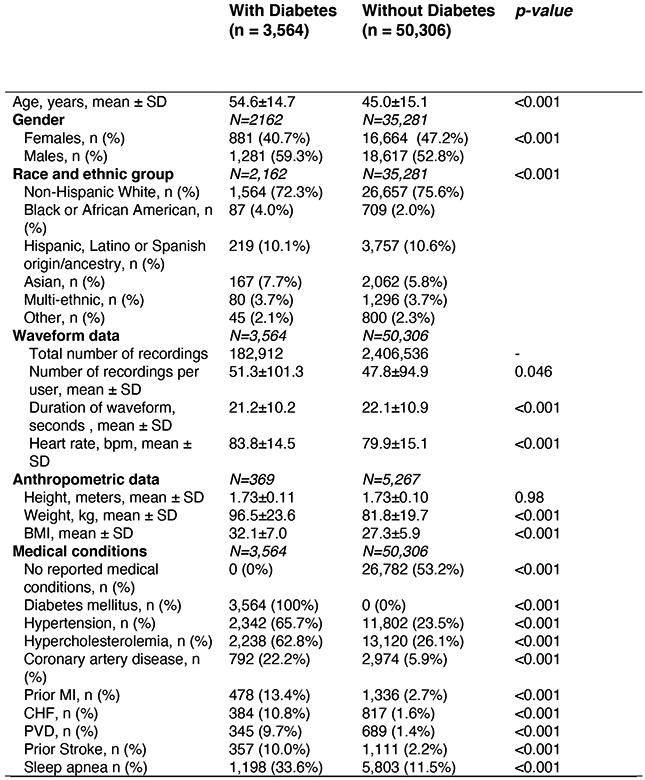
Primary Cohort sample size was 53,870 individual people. Where data was only available for subgroups of the full cohort, subgroup sample size is denoted by N. Differences in means of continuous variables between 2 groups were compared using the two-sample t-test. Differences in proportions of categorical variables between 2 groups were compared using the Chi-Squared test. Tests of significance were 2 sided. Abbreviations: bpm: beats per minute; CAD: Coronary artery disease; CHF: Congestive heart failure; COPD: Chronic obstructive pulmonary disease; HR: Heart rate, MI: Myocardial Infarction; PVD: Peripheral Vascular Disease.
Extended Data Fig. 2. Baseline Characteristics in the Primary Cohort Training, Development and Test Datasets.
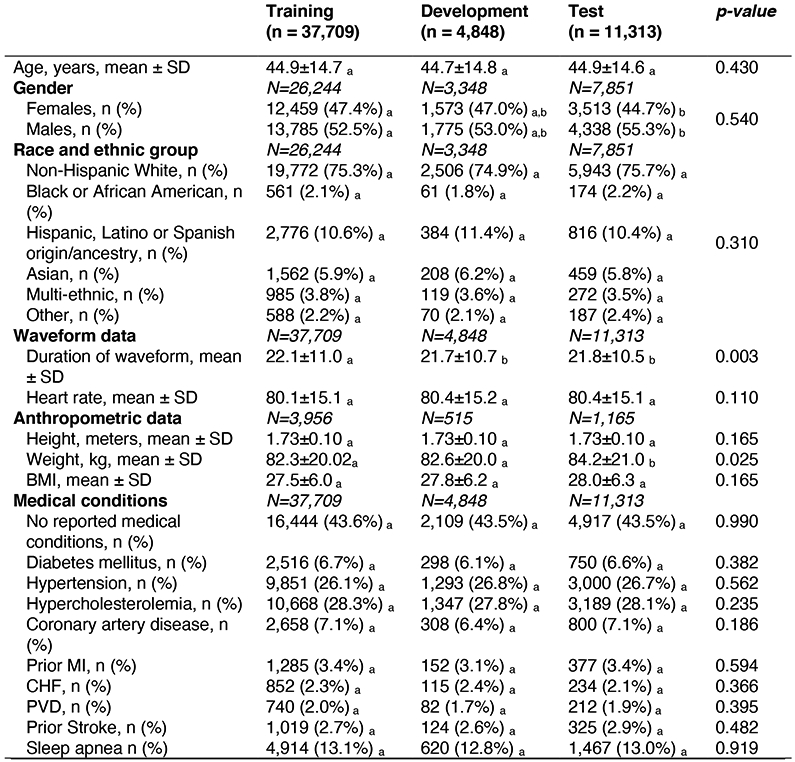
Primary cohort sample size was 53,870 individual people. Where data was only available for subgroups of the full cohort, subgroup sample size is denoted by N. Differences in means of continuous variables between 2 groups were compared using two-sample t-test. Differences in means of continuous variables between 3+ groups were compared using one-way ANOVA. Differences in proportions of categorical variables between the 2+ groups were compared using Chi-Squared. Tests of significance were 2 sided. a, b, c: Each subscript letter denotes a subset of dataset categories whose column proportions do not differ significantly from each other at the 0.05 level. Post-hoc analysis was performed using Fisher’s least significant differences to compare means of continuous variables between groups. Abbreviations: SD: Standard deviation; CAD: Coronary artery disease; CHF: Congestive heart failure; COPD: Chronic obstructive pulmonary disease; HR: Heart rate, MI: Myocardial Infarction; PVD: Peripheral Vascular Disease.
Extended Data Fig. 3. Baseline Characteristics of the Primary, Contemporary and Clinic Cohorts.
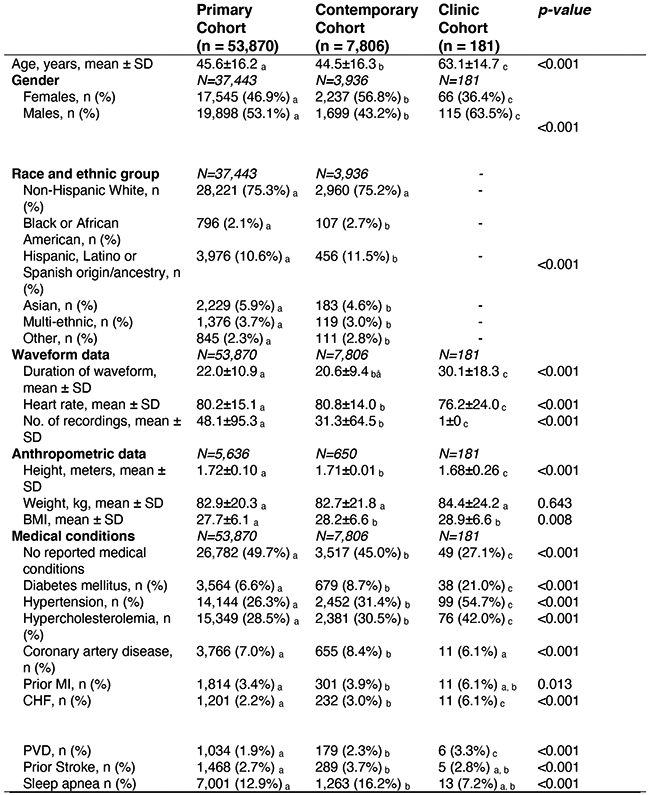
Where data was only available for subgroups of the full cohorts, subgroup sample size is denoted by N. Differences in means of continuous variables between 2 groups were compared using two-sample t-test. Differences in means of continuous variables between 3+ groups were compared using one-way ANOVA. Differences in proportions of categorical variables between the 2+ groups were compared using Chi-Squared. Tests of significance were 2 sided. a, b, c: Each subscript letter denotes a subset of dataset categories whose column proportions do not differ significantly from each other at the 0.05 level. Post-hoc analysis was performed using Fisher’s least significant differences to compare means of continuous variables between groups. Abbreviations: SD: Standard deviation; CAD: Coronary artery disease; CHF: Congestive heart failure; COPD: Chronic obstructive pulmonary disease; HR: Heart rate, MI: Myocardial Infarction; PVD: Peripheral Vascular Disease.
Extended Data Fig. 4. Data Figure 4. Confusion matrices for DNN performance in 3 validation datasets.

Confusion matrices for the predictions of the DNN in the Test Dataset (a-b), Contemporary Cohort (c-d), and Clinic Cohort (e-f), at both the recording and user-level. Total number of patients are presented in parentheses. The DNN Score cutoff used was 0.427.
Extended Data Fig. 5. DNN performance to predict diabetes according to time of day, recording length and heart rate in the Test dataset.
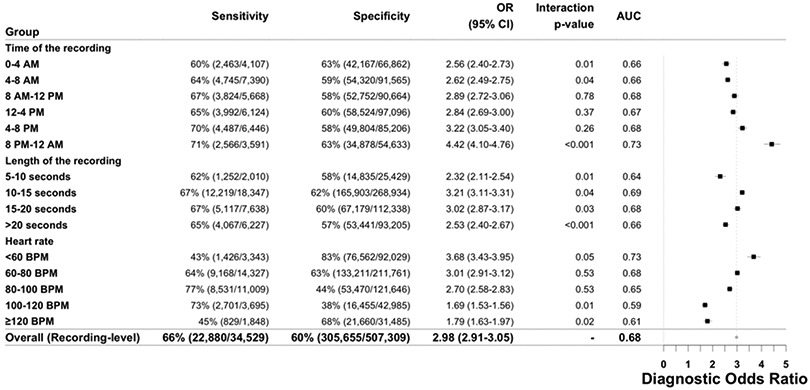
DNN sensitivity, specificity, diagnostic odds-ratio and AUC to detect prevalent diabetes are presented across strata of age, gender and number of recordings. The Test Dataset sample size is 11,313 individuals. Counts are provided in parentheses for all subgroup metrics. The diagnostic odds-ratio is the ratio of positive likelihood ratio (sensitivity / (1–specificity)) to the negative likelihood ratio ((1–sensitivity)/specificity). The diagnostic odds-ratio is presented at the recording-level with the associated 95% confidence interval. Interaction p-values are two-sided Wald tests for interaction between the DNN Score and the respective covariates for diabetes. Abbreviations: DNN: deep neural network; OR: diagnostic odds ratio; AUC: area under the curve; CI: confidence interval; BPM: beats per minute.
Extended Data Fig. 6. Activation maps from several hidden convolutional layers of the trained Deep Neural Network (DNN) for one photoplethysmography (PPG) record.

a. An example of a PPG recording which serves as the input into the DNN. b. The activation map of one example filter (out of 16) from the first convolutional layer of the neural network. This activation map is obtained after the example PPG recording is fed into the trained DNN. Each lighter colored band illustrates “activation” of a model parameter. At this early layer of the neural network, the lighter colored bands correspond directly to each cardiac cycle of the PPG waveform. Thicker lines likely indicate morphological features of the waveform. c. Visualization of the activation maps of the 16 filters from the first convolutional layer of the neural network, obtained after the input PPG is fed into the trained DNN. Each of the 16 filters can learn different sets of “features” from the input PPG recording. Filters with more purple bands have more inactive neurons, as compared to those with lighter colors (green being the strongest activation and dark purple being the weakest activation). Six filters appear completely inactivated (all purple), suggesting that the features these filters focus on are not present in this example input PPG. d. Visualization of the activation maps of the 7th convolutional layer of the DNN, comprised of 32 filters. Broadly, these activation maps from the 7th layer of the DNN are more complex compared to those from the 1st layer (b-c), demonstrating how deeper layers of the DNN encode increasingly abstract information representing higher level interactions and complex features.
Extended Data Fig. 7. Activation maps from hidden convolutional layers of the trained Deep Neural Network (DNN) for an example photoplethysmography (PPG) recording with artifacts.

a. An example PPG recording with 2 artifacts (blue and orange rectangles) which serves as the input into the DNN. b. Activation maps of the 16 filters from the first convolutional layer of the DNN. Each lighter colored band illustrates “activation” of a model parameter. Orange and blue arrow are placed on filters denoting the location of artifacts, highlighted by orange and blue rectangles (a), respectively. Some filters, such as the 4th image in the top row, seem to not have activation at the location of the artifactual beats (hollow orange and blue arrows), suggesting that the DNN is “ignoring” data from these artifact locations. Whereas other filters are have activation, suggested by lighter color bars, in the locations of the artifacts (full orange and blue arrows), such as the 2nd filter from the left in the top row, suggesting that the DNN is using data from these artifact locations. Some filters, such as the 2nd from the left in the bottom row “ignore” the artifactual beats by having uniform activation throughout the signal length (except where there are artifacts) likely representing the cardiac cycle. These findings suggest that the DNN is able to identify artifactual beats and differentiate them from good quality waveforms.
Extended Data Fig. 8. Example photoplethysmography (PPG) waveforms.

a. Examples of raw PPG recordings from individuals with and without diabetes (red/green recordings, respectively), which serve as inputs to the deep neural network. DNN Scores predicted for each recording are shown. PPG recordings are either cropped or zero-padded to the same fixed length (~20.3 seconds) before being input into the DNN. The “flat line” in three examples is a demonstration of zero-padding shorter records to the fixed length. DNN: Deep Neural Network; ms: milliseconds.
Extended Data Fig. 9. Deep Neural Network architecture.

The neural network had 39 layers organized in a block structure, consisting of convolutional layers with an initial filter size of 15 and filter number (N) of 16. The size of the filters decreased, and the number of filters increased as network depth increased, as shown. After each convolutional layer, we applied batch normalization, rectified linear activation and dropout with a probability of 0.2. The final flattened and fully connected softmax layer produced an output distribution across the classes of diabetes/no diabetes. This output distribution is referred to as the DNN Score. PPG: photoplethysmography; DNN: Deep Neural Network; Hz: Hertz.
Supplementary Material
Acknowledgements:
We acknowledge A. Markowitz for editorial support made possible by CTSI grant KL2 TR001870. Dr. Avram received support from the “Fonds de la recherche en santé du Québec » (Grant 274831). Dr. Tison received support from the National Institutes of Health NHLBI K23HL135274. Dr. Olgin, Dr. Pletcher and Dr. Marcus received support from the National Institute of Health (U2CEB021881). Dr. Pletcher is partially supported by a PCORI contract supporting the Health eHeart Alliance (PPRN-1306–04709). The funders had no role in study design, data collection and analysis, decision to publish or preparation of the manuscript.
Footnotes
Competing Interests: Dr. Olgin has received research funding from Samsung and iBeat. Dr. Marcus has received research funding from Medtronic, Jawbone, and Eight. Dr. Aschbacher received funding from Jawbone Health Hub. Peter Kuhar is an employee of Azumio. Dr. Tison has received research grants from Janssen Pharmaceuticals and Myokardia and is an advisor to Cardiogram, Inc. None of the remaining authors have potential conflicts of interest. Azumio provided no financial support for this study and only provided access to the data. Data analysis, interpretation and decision to submit the manuscript were performed independently from Azumio.
Data Availability:
The data that support the findings of this study are available from the authors and Azumio, but restrictions apply to the availability of these data, which were used under license for the current study, and so are not publicly available. Data are however available from the authors upon reasonable request and with permission of Azumio.
References
- 1.Cho NH et al. IDF Diabetes Atlas: Global estimates of diabetes prevalence for 2017 and projections for 2045. Diabetes Research and Clinical Practice 138, 271–281 (2018). [DOI] [PubMed] [Google Scholar]
- 2.Harris MI, Klein R, Welborn TA & Knuiman MW Onset of NIDDM occurs at least 4–7 yr before clinical diagnosis. Diabetes Care 15, 815–819 (1992). [DOI] [PubMed] [Google Scholar]
- 3.Bertoni AG, Krop JS, Anderson GF & Brancati FL Diabetes-related morbidity and mortality in a national sample of U.S. elders. Diabetes Care 25, 471–475 (2002). [DOI] [PubMed] [Google Scholar]
- 4.Allen J Photoplethysmography and its application in clinical physiological measurement. Physiol Meas 28, R1–39 (2007). [DOI] [PubMed] [Google Scholar]
- 5.Elgendi M et al. The use of photoplethysmography for assessing hypertension. npj Digital Medicine 2, 60 (2019). [DOI] [PMC free article] [PubMed] [Google Scholar]
- 6.Alty SR, Angarita-Jaimes N, Millasseau SC & Chowienczyk PJ Predicting Arterial Stiffness From the Digital Volume Pulse Waveform. IEEE Transactions on Biomedical Engineering 54, 2268–2275 (2007). [DOI] [PubMed] [Google Scholar]
- 7.Otsuka T, Kawada T, Katsumata M & Ibuki C Utility of Second Derivative of the Finger Photoplethysmogram for the Estimation of the Risk of Coronary Heart Disease in the General Population. Circ J 70, 304–310 (2006). [DOI] [PubMed] [Google Scholar]
- 8.Pew Research Center. Smartphone Ownership Is Growing Rapidly Around the World, but Not Always Equally. (2019).
- 9.Coravos A, Khozin S & Mandl KD Developing and adopting safe and effective digital biomarkers to improve patient outcomes. npj Digital Medicine 2, 14 (2019). [DOI] [PMC free article] [PubMed] [Google Scholar]
- 10.Singh JP et al. Association of hyperglycemia with reduced heart rate variability (The Framingham Heart Study). The American Journal of Cardiology 86, 309–312 (2000). [DOI] [PubMed] [Google Scholar]
- 11.Avram R et al. Real-world heart rate norms in the Health eHeart study. npj Digital Medicine 2, 58 (2019). [DOI] [PMC free article] [PubMed] [Google Scholar]
- 12.Carnethon Mercedes R, Golden Sherita H, Folsom Aaron R, William Haskell & Duanping Liao. Prospective Investigation of Autonomic Nervous System Function and the Development of Type 2 Diabetes. Circulation 107, 2190–2195 (2003). [DOI] [PubMed] [Google Scholar]
- 13.Guo Y et al. Genome-Wide Assessment for Resting Heart Rate and Shared Genetics With Cardiometabolic Traits and Type 2 Diabetes. Journal of the American College of Cardiology 74, 2162–2174 (2019). [DOI] [PubMed] [Google Scholar]
- 14.Martinez Lilia C & Gerson OS Endothelial Dysfunction Evaluated using Photoplethysmography in Patients with Type 2 Diabetes. J Cardiovasc Dis Diagn 03, (2015). [Google Scholar]
- 15.Pilt K, Meigas K, Ferenets R, Temitski K & Viigimaa M Photoplethysmographic signal waveform index for detection of increased arterial stiffness. Physiol. Meas. 35, 2027–2036 (2014). [DOI] [PubMed] [Google Scholar]
- 16.Schönauer M et al. Cardiac autonomic diabetic neuropathy. Diabetes and Vascular Disease Research 5, 336–344 (2008). [DOI] [PubMed] [Google Scholar]
- 17.LeCun Y, Bengio Y & Hinton G Deep learning. Nature 521, 436–444 (2015). [DOI] [PubMed] [Google Scholar]
- 18.Gulshan V et al. Development and Validation of a Deep Learning Algorithm for Detection of Diabetic Retinopathy in Retinal Fundus Photographs. JAMA 316, 2402–2410 (2016). [DOI] [PubMed] [Google Scholar]
- 19.Zhang H et al. Comparison of Physician Visual Assessment With Quantitative Coronary Angiography in Assessment of Stenosis Severity in China. JAMA Internal Medicine 178, 239–247 (2018). [DOI] [PMC free article] [PubMed] [Google Scholar]
- 20.Hannun AY et al. Cardiologist-level arrhythmia detection and classification in ambulatory electrocardiograms using a deep neural network. Nature Medicine 25, 1–11 (2019). [DOI] [PMC free article] [PubMed] [Google Scholar]
- 21.Dixit S et al. Secondhand smoke and atrial fibrillation: Data from the Health eHeart Study. Heart Rhythm 13, 3–9 (2016). [DOI] [PMC free article] [PubMed] [Google Scholar]
- 22.Fawcett T An introduction to ROC analysis. Pattern Recognition Letters 27, 861–874 (2006). [Google Scholar]
- 23.Noble D, Mathur R, Dent T, Meads C & Greenhalgh T Risk models and scores for type 2 diabetes: systematic review. BMJ 343, d7163–d7163 (2011). [DOI] [PMC free article] [PubMed] [Google Scholar]
- 24.Moreno EM et al. Type 2 Diabetes Screening Test by Means of a Pulse Oximeter. IEEE Trans Biomed Eng 64, 341–351 (2017). [DOI] [PubMed] [Google Scholar]
- 25.Nirala N, Periyasamy R, Singh BK & Kumar A Detection of type-2 diabetes using characteristics of toe photoplethysmogram by applying support vector machine. Biocybernetics and Biomedical Engineering 39, 38–51 (2019). [Google Scholar]
- 26.Selvin E, Steffes MW, Gregg E, Brancati FL & Coresh J Performance of A1C for the Classification and Prediction of Diabetes. Diabetes Care 34, 84–89 (2010). [DOI] [PMC free article] [PubMed] [Google Scholar]
- 27.Camacho JE, Shah VO, Schrader R, Wong CS & Burge MR Performance of A1C versus OGTT for the diagnosis of prediabetes in a community-based screening. Endocrine practice : official journal of the American College of Endocrinology and the American Association of Clinical Endocrinologists 22, 1288–1295 (2016). [DOI] [PMC free article] [PubMed] [Google Scholar]
- 28.Karakaya J, Akin S, Karagaoglu E & Gurlek A The performance of hemoglobin A1c against fasting plasma glucose and oral glucose tolerance test in detecting prediabetes and diabetes. Journal of Research in Medical Sciences : The Official Journal of Isfahan University of Medical Sciences 19, 1051–1057 (2014). [PMC free article] [PubMed] [Google Scholar]
- 29.Pisano ED et al. Diagnostic Performance of Digital versus Film Mammography for Breast-Cancer Screening. N Engl J Med 353, 1773–1783 (2005). [DOI] [PubMed] [Google Scholar]
- 30.Mathews Wm. C., Agmas W & Cachay E Comparative Accuracy of Anal and Cervical Cytology in Screening for Moderate to Severe Dysplasia by Magnification Guided Punch Biopsy: A Meta-Analysis. PLoS One 6, (2011). [DOI] [PMC free article] [PubMed] [Google Scholar]
- 31.World Health Organization. Use of Glycated Haemoglobin (HbA1c) in the Diagnosis of Diabetes Mellitus: Abbreviated Report of a WHO Consultation. (World Health Organization, 2011). [PubMed] [Google Scholar]
- 32.Kim D-I et al. The association between resting heart rate and type 2 diabetes and hypertension in Korean adults. Heart 102, 1757–1762 (2016). [DOI] [PubMed] [Google Scholar]
- 33.Lindström J & Tuomilehto J The Diabetes Risk Score: A practical tool to predict type 2 diabetes risk. Diabetes Care 26, 725–731 (2003). [DOI] [PubMed] [Google Scholar]
Methods-only References
- 34.American Diabetes Association. Classification and Diagnosis of Diabetes: Standards of Medical Care in Diabetes—2018. Diabetes Care 41, S13 (2018).29222373 [Google Scholar]
- 35.Elgendi M On the Analysis of Fingertip Photoplethysmogram Signals. Current Cardiology Reviews 8, 14–25 (2012). [DOI] [PMC free article] [PubMed] [Google Scholar]
- 36.Emami S New methods for computing interpolation and decimation using polyphase decomposition. IEEE Transactions on Education 42, 311–314 (1999). [Google Scholar]
- 37.Ioffe S & Szegedy C Batch Normalization: Accelerating Deep Network Training by Reducing Internal Covariate Shift. Proceedings of the 32nd International Conference on Machine Learning, 448–456 (2015). [Google Scholar]
- 38.Nair V & Hinton GE Rectified Linear Units Improve Restricted Boltzmann Machines. Proceedings of the 27th International Conference on Machine Learning, 807–814 (2010). [Google Scholar]
- 39.Srivastava N, Hinton GE, Krizhevsky A, Sutskever I & Salakhutdinov R Dropout: a simple way to prevent neural networks from overfitting. Journal of Machine Learning Research 15, 1929–1958 (2014). [Google Scholar]
- 40.Goodfellow I, Bengio Y & Courville A Deep Learning. (The MIT Press, 2016). [Google Scholar]
- 41.He K, Zhang X, Ren S & Sun J Delving Deep into Rectifiers: Surpassing Human-Level Performance on ImageNet Classification. arXiv:1502.01852 [cs] (2015). [Google Scholar]
- 42.Liu L et al. On the Variance of the Adaptive Learning Rate and Beyond. arXiv:1908.03265 [cs, stat] (2019). [Google Scholar]
- 43.Yosinski J, Clune J, Nguyen A, Fuchs T & Lipson H Understanding Neural Networks Through Deep Visualization. arXiv:1506.06579 [cs] (2015). [Google Scholar]
- 44.Ferri C, Hernández-Orallo J & Modroiu R An experimental comparison of performance measures for classification. Pattern Recognition Letters 30, 27–38 (2009). [Google Scholar]
- 45.Glas AS, Lijmer JG, Prins MH, Bonsel GJ & Bossuyt PMM The diagnostic odds ratio: a single indicator of test performance. J Clin Epidemiol 56, 1129–1135 (2003). [DOI] [PubMed] [Google Scholar]
- 46.Benichou T et al. Heart rate variability in type 2 diabetes mellitus: A systematic review and meta-analysis. PLoS ONE 13, e0195166 (2018). [DOI] [PMC free article] [PubMed] [Google Scholar]
Associated Data
This section collects any data citations, data availability statements, or supplementary materials included in this article.
Supplementary Materials
Data Availability Statement
The data that support the findings of this study are available from the authors and Azumio, but restrictions apply to the availability of these data, which were used under license for the current study, and so are not publicly available. Data are however available from the authors upon reasonable request and with permission of Azumio.