

Abstract
Rationale:
Epigenetic aging is a novel measure of biological age, reflecting exposures and disease risks independent of chronological age. It may serve as a useful biomarker of cardiovascular health (CVH) and/or cardiovascular disease (CVD) risk for early detection or prevention.
Objective:
To examine associations between GrimAge acceleration (GrimAA), a measure of epigenetic aging calculated from the residuals of GrimAge regressed on chronological age, and two repeated CVH measures: a full score for the AHA “Life’s Simple 7” (diet, smoking, physical activity, BMI, blood pressure, total cholesterol, and glucose) and a clinical CVH score (BMI, blood pressure, cholesterol, and glucose).
Methods and Results:
We used Illumina array DNA methylation data from two prospective cohort studies: The Coronary Artery Risk Development in Young Adults (CARDIA) study and Framingham Heart Study (FHS), to calculate GrimAA and model associations with CVH. CARDIA randomly selected 1,118 participants for assays at Y15 (2000–2001; mean age 40) and/or Y20 (2005–2006); in FHS, 2,106 Offspring participants had DNA methylation measured at exam 8 (2005–2008; mean age 66). We examined multiple cross-sectional and longitudinal models of GrimAA and each CVH score measured at CARDIA Y0-Y20 and FHS exams 7–8. In CARDIA clinical CVH score from Y0-Y20 was associated with Y15 and Y20 GrimAA (β range −0.41 to −0.21 years per 1-point increase in CVH; p range <0.01 to 0.01), as was full score (β range −0.65 to −0.67 years; p<0.01 for all). These findings were validated in FHS (clinical score β range −0.51 to −0.54 years; full score β range −0.76 to −0.83 years; p<0.01 for all).
Conclusions:
Our data demonstrate that faster GrimAA is associated with the loss of CVH from young age. Epigenetic age may be a useful biomarker of CVD risk and provides biological insight into the role of epigenetic mechanisms linking age-related CVH loss and CVD.
Keywords: Epidemiology, Epigenetics, Risk factors
Graphical Abstract
INTRODUCTION
The American Heart Association defined cardiovascular health (CVH) using the “Life’s Simple 7” metrics 1. These include four health factors (blood pressure, total cholesterol, body mass index [BMI], and fasting blood glucose) and three health behaviors (smoking, physical activity, and diet). Individuals who reach middle age with ideal CVH can greatly reduce their lifetime risk of cardiovascular disease (CVD), among other health benefits 2–10. However, prevalence of ideal CVH remains low11 despite decades of interventions to promote it (smoking cessation, exercise, etc.). This highlights the need for new approaches to CVD prevention beyond behavioral interventions, such as genetic and molecular biomarkers. Genetics can thus far only explain a small amount of CVD risk beyond already-established clinical biomarkers (e.g., lipids)12–14. Limited understanding of the molecular mechanisms for CVD risk factors hinders development of new interventions that include targeted, precision prevention; earlier and more reliable detection of at-risk individuals; and the ability to monitor efficacy at the biological (rather than behavioral) level.
The human epigenome, including the DNA methylome, represents a potentially important biological link between CVH in early and mid-life and CVD development later in life. A poor risk factor profile, as reflected in poor CVH metrics, can alter blood leukocyte DNA methylation15, 16 which in turn exacerbates poor CVH 17. A recently-developed summary measure of the epigenetic risks of age-related chronic diseases, epigenetic age acceleration18, 19, is calculated from blood leukocyte DNA methylation and defined as the residuals of a linear model of DNA methylation age and chronological age (to ensure that all acceleration measures are independent of chronological age). Resulting measures include: extrinsic epigenetic age acceleration (EEAA), a measure derived from Hannum’s DNA methylation age18 that is sensitive to environment and age-related changes in blood cell composition18; intrinsic epigenetic age acceleration (IEAA), a measure of cell aging derived from Horvath’s DNA methylation age19; and GrimAge acceleration (GrimAA) a measure designed to predict healthy lifespan20 that combines chronological age, sex, and DNA methylation-based surrogates for seven plasma proteins (adrenomedullin, beta-2-microglobulin, cystatin C, GDF-15, leptin, plasminogen activation inhibitor 1, and tissue inhibitor metalloproteinase 1) as well as smoking pack-years. GrimAA is noteworthy for its ability to predict time-to-death and other mortality outcomes.20 Epigenetic age acceleration has also been associated with cancer incidence and mortality 21, all-cause mortality 22, numerous individual CVH factors 23–27, and incident CVD 22, 28.
To our knowledge, no studies have longitudinally examined epigenetic age acceleration with composite CVH. Our objective was to prospectively examine associations between epigenetic age acceleration measures and CVH metrics measured from young age. We hypothesized that better CVH metrics would be associated with slower epigenetic age acceleration, in particular slower GrimAA as GrimAA was designed using blood protein markers. Our secondary objective was to examine potential mediation effects of GrimAA in the already established relationship between CVH and coronary artery calcium, an important precursor to CVD (which is not yet prevalent in our study population).
METHODS
Study populations.
Data for both cohorts may be requested through the NHLBI website, as described below.
The Coronary Artery Risk Development in Young Adults (CARDIA) study.
Requests for access to CARDIA data may be made through the NHLBI website (https://biolincc.nhlbi.nih.gov/studies/cardia/?q=CARDIA). CARDIA (NCT#00005130) is a prospective, multi-center cohort study designed to investigate the development of CVD. In 1985–1986, 5,115 Black and White men and women ages 18–30 were recruited from four urban sites in the US: Birmingham, AL; Chicago, IL; Minneapolis, MN; and Oakland, CA. CARDIA’s initial sample was approximately balanced with respect to race (black and white), sex, age (18–24 years and 25–30 years), and education (high school or less and more than high school). CARDIA participants have undergone in-person examinations at baseline (Year 0: Y0) and at Y2, Y5, Y7, Y10, Y15, Y20, Y25, and Y30; retention among surviving participants was 91%, 86%, 81%, 79%, 74%, 72%, 72%, and 71%, respectively. Additional study details have been reported previously 29. CARDIA was approved by the institutional review boards at all study sites, and all participants provided written informed consent, including for blood DNA collection.
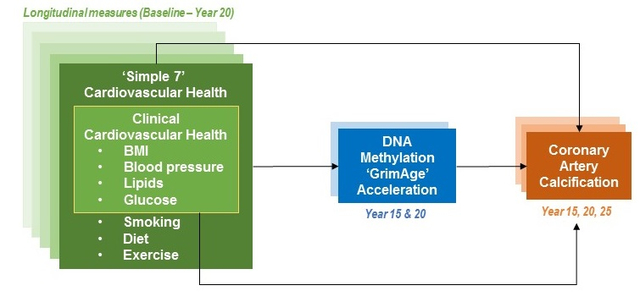
Figure 1 shows the study design flow chart for this study. This analysis included all participants with non-missing data and blood epigenetic measurements collected at Y15 and Y20 (N=1042 and 957, respectively; 881 participants at both).
Figure 1: Study design.

In CARDIA we examined DNA methylation collected at two time points (Y15 and Y20), then combined models using generalized estimating equations (GEEs). We then validated our findings in FHS, and used GEE models to conduct stratified and sensitivity analyses. Mediation analyses (not pictured) modeled CVH and GrimAA from each cohort and time point separately. A similar model structure was used to analyze IEAA and EEAA.
Validation population – the Framingham Heart Study (FHS).
For validation we used the FHS30, 31, a population-based, longitudinal study to understand CVD risks (NCT# 00005121). Requests for FHS data may also be made through the NHLBI website (https://biolincc.nhlbi.nih.gov/studies/framoffspring/). Methylation data were obtained between 2005–2008 (exam 8) from 2,567 participants in the Offspring Cohort, which was initiated in 1971 and is primarily of European ancestry. All participants for this analysis participated in exam 8, consented to genetic research, had a buffy coat/white blood cell sample, and had adequate DNA quality and quantity for the DNA methylation assay. We also examined CVH data from the prior visit, an average of six years prior to methylation data collection, corresponding to exam 7 (1998–2001).
CVH Score and Coronary Artery Calcium (CAC) Measurement.
Calculation of all seven CVH score components in CARDIA was described previously 32, as has data collection of all seven component metrics 29, 33–36. We separately examined CVH data from Y0, Y7, Y10, Y15, and Y20 and full CVH data from Y0, Y7, and Y20. Methods for measuring the CVH metrics in FHS were also used as described previously37 except dietary component score, which was measured using a different instrument than CARDIA but calculated using the same method as CARDIA38. However both instruments have been validated previously. CVH scores were calculated based on blood pressure, total cholesterol, fasting blood glucose, BMI, smoking status, and physical activity levels and diet. Each of these components was defined as ideal (two points), intermediate (one point), or poor (0 points), for a composite score range of 0–14 32. Briefly, CVH components were scored as follows, separately at each time point. For BMI, <25 kg/m2 was ideal, 25–29.9 kg/m2 intermediate, and ≥30 kg/m2 poor. For blood pressure, <120/<80 mm Hg without medications was ideal, SBP 120–139 mm Hg or DBP 80–89 mm Hg or successfully treated was intermediate, and SBP ≥140 or DBP ≥90 mm Hg poor. For total cholesterol <200 mg/dL without medication was ideal, 200–239 mg/dL or successfully treated was intermediate, and ≥240 mg/dL was poor. For fasting glucose, <100 mg/dL without medication was ideal, 100–125 mg/dL or successfully treated was intermediate, and ≥126 mg/dL was poor. For smoking, never smoking or quitting more than 12 months ago was ideal, quitting ≤12 months ago intermediate, and currently smoking poor. For physical activity, the top 40% on the physical activity questionnaire was defined as ideal, the second 40% as intermediate, and the lowest 20% as poor. For diet, the top 40% on the dietary quality questionnaire was defined as ideal, the second 40% as intermediate, and the lowest 20% as poor.
Because dietary data were only collected at a subset of CARDIA visits (Y0, Y7, and Y20), we also calculated the “clinical” CVH score based solely on the BMI, blood pressure, total cholesterol, and fasting blood glucose measurements to more thoroughly explore the longitudinal relationships of interest to this study across additional time points (e.g., Y10 and Y15). The clinical CVH score has a range of 0–8. Methods for measuring CAC in CARDIA have been described previously39, 40. Briefly, CAC was defined as the presence of any CAC (>0 Agatston units) at Y25 in participants without any CAC at Y15 or Y20, consistent with prior CAC studies in CARDIA40, 41. This was done to capture incident CAC and avoid potential problems of reverse causality (e.g., CAC affecting GrimAA). Methods for measuring subclinical coronary atherosclerosis in FHS have also been described previously, and were comparable to those used in CARDIA42. However, CAC data were only available for approximately half of the FHS participants, reducing our total sample size for the FHS mediation analysis to N=997.
Methylation Measurement.
In CARDIA, overnight fasting blood samples were collected to yield EDTA-plasma and serum, both processed within 90 minutes of collection and stored at −70 °C. DNA was extracted using a PureGene DNA extraction kit (Gentra Systems) and stored at −70 °C. Infinium MethylationEPIC BeadChip raw data (IDAT files) were generated from a total of 2,181 blood samples (1,089 at Y15 and 1,092 at Y20) loaded by the R package minfi. Quality control was conducted using the R package ENmix 43 with default parameter settings. Specifically, low-quality methylation measurements were identified by detection p-value <10−6 or number of beads <3 43. We excluded 6,209 CpGs with a detection rate <95% of samples and 87 samples with >5% low-quality methylation measurements or extremely low intensity of bisulfite conversion probes (less than 3 × standard deviation of the intensity across samples below the mean intensity) 43. After excluding low-quality CpGs and samples, we further removed 95 samples that were extreme outliers, as defined by Tukey’s method [i.e., <25th percentile – 3 * interquartile range (IQR) or >75th percentile + 3 * IQR] and based on the average total intensity value [intensity of the unmethylated signal (U) + intensity of the methylated signal (M)] or β value [M / (U + M + 100)] across CpG probes. As recommended in Horvath’s online calculator (https://dnamage.genetics.ucla.edu/new), the remaining samples were preprocessed using background correction provided by R package minfi (preprocessIllumina function) 44 and Houseman’s method used to account for blood cell type proportions.45
We conducted three steps to ensure that all epigenetic age acceleration factors were independent of technical bias factors, including batch effects. First, before DNA methylation measurement, we randomized sample layout on the array chips to minimize the impact of sample locations and batch. Second, the algorithm for calculating epigenetic age also includes an internal normalization step modified from the BMIQ normalization method46 to adjust for batch effects by aligning the distribution of our submitted methylation data to a gold standard methylation level that Steve Horvath designed specifically for the calculator. This procedure makes the epigenetic age calculation compatible with both the old and new array platform (450K vs. EPIC array) and is remarkably robust to batch effects (https://horvath.genetics.ucla.edu/html/dnamage/faq.htm). Finally, after we obtained epigenetic age estimation, we removed extreme outliers as defined by Tukey’s method [i.e., <25th percentile – 3 * interquartile range (IQR) or >75th percentile + 3*IQR] then carried out a linear regression model:
Epigenetic age ~ Chronological age + Technical principal components (PCs) + ε(residuals).
to compute the residuals as the epigenetic age acceleration measures. The regression model included technical principal components (PCs) as covariates calculated by the control probes built within the methylation array chip. These control probes were designed to capture various technical bias factors, including the batch effects, bisulfite conversion, etc., which may impact downstream association analysis. The top 8 PCs explained over 90% of the variance of the control probes (i.e., technical bias). We therefore included the top 8 PCs in the above regression model to remove any potential technical bias effects. Figure SI shows correlations between both GrimAA measures and principal components representing batch effects and technical bias factors. The final working dataset contains 860,627 CpG probes and 1999 samples (1042 from Y15, 957 from Y20, and 881 from both examinations). Methods for DNA methylation measurement in the FHS have been described previously.30, 31 Briefly, DNA samples were collected from consenting participants at FHS visit 8, conducted from 2005–2008. DNA extracted from the buffy coat was bisulfite-converted and methylation profiled using the Illumina HumanMethylation450 BeadChip (San Diego, CA) at the University of Minnesota (81% of samples) or Johns Hopkins University (19%). The methylation data were normalized using the “noob” normalization method implemented in the minfi R package,47, 48 and Houseman’s method used as above to account for blood cell type proportions.
Epigenetic Age Acceleration Calculation.
We calculated three measures of epigenetic age: EEAA, IEAA, and GrimAA. EEAA is calculated from the residuals of a linear model of Hannum’s DNA methylation age18 on chronological age, and weighted by cell blood type proportions. IEAA uses the DNA methylation age method published by Horvath, et al 19; its calculation is otherwise the same as for EEAA save that IEAA is adjusted for (i.e., independent of) blood cell type proportions. GrimAge was designed similarly to IEAA and EEAA, save that the methylated CpG sites forming the basis for its calculation were selected for their associations with seven plasma protein levels as well as pack-years of smoking and time to death.20 The final model uses a total of 1,030 CpG sites and the residuals from a model of GrimAge and chronological age to calculate GrimAA. All measures of epigenetic age acceleration were calculated online at https://dnamage.genetics.ucla.edu/new.
Statistical Analyses.
For our descriptive analysis we used chi-squared tests to examine the bivariate association between GrimAA and CVH score; trends were tested using linear regression models of CVH score treated as an ordinal variable. For all linear regression models, we assumed that the central limit theorem applied due to the sample sizes of our cohorts (N>900 for both CARDIA and FHS regardless of time point examined). Figure SII shows box plots of all CVH scores and all GrimAA values calculated for these analyses. Then to address potential sources of bias we ran multivariable models adjusted for field center, sex, race, education, and alcohol consumption based on our prior experience studying methylation in CARDIA (as well as the randomization steps described previously).49 Models of clinical CVH score additionally adjusted for smoking and physical activity. Save for sex, race, and center, covariates were included in the model as continuous variables. We first used linear regression to separately model Y15 and Y20 IEAA, EEAA, and GrimAA as the outcomes, and CVH score at each visit (from Y0 to Y20, also modeled separately) prior to epigenetic measurement as the independent variable of interest. The models for CVH at individual visits can be expressed as follows:
where Y represents each measure of EAA (IEAA, EEAA, and GAA) modeled separately, and CVH (clinical and full CVH score, modeled separately) is measured for each individual i. These models were repeated for each measurement of clinical and full CVH score available.
As EEAA was not significantly associated with CVH, it was excluded from subsequent analyses. Next, to fully examine long-term trends we modeled IEAA and GrimAA across both time measurements using generalized estimating equations (GEEs) with exchangeable correlation structures and robust variance estimators to combine the Y15 and Y20 models. GEEs capture within-individual variation over the repeated DNA methylation measurements in our study, and effectively allow for a larger sample size and thus more precise estimates of our associations of interest, averaged across two repeated measurements and with minimal underlying assumptions. To validate our primary findings in FHS we conducted linear mixed model of GrimAA on both the clinical and full CVH scores, adjusting for covariates as above (aside from race and center) with family structure as a random effect to account for the family relatedness. We also examined the above models stratified by sex (and by race in CARDIA) and tested appropriate product terms to explore potential effect modification. To interpret differences in association by the clinical and full CVH scores, and given that smoking pack-years was used in the design of GrimAge, we also conducted sensitivity analyses of all models of the full CVH score with additional adjustment for smoking status. Finally, we used the R package “mediation”50 to assess the extent to which GrimAA (Y15 and Y20) mediates the association of each CVH score measurement with incident coronary artery calcification (CAC) at Y25, and validated these results in FHS. Because some exposures were measured at the same time as the mediators (e.g., Y15 CVH and GrimAA), we ran additional sensitivity analyses testing the sequential ignorability assumption of our mediation models in CARDIA. To interpret differences in mediation by the clinical and full CVH scores, and given that smoking pack-years was used in the design of GrimAge, we also examined the correlation between GrimAA and the smoking sub-score in CARDIA. All analyses in CARDIA adjusted for multiple testing using the Benjamini-Hochberg False Discovery Rate procedure51, based on the total number of time points considered for the clinical and full CVH score analyses respectively, with false discovery rate (FDR) <0.05 considered significant. All analyses were performed using SAS (version 9.4, SAS Institute Inc., Cary NC), save the mediation analysis performed using R (R Foundation for Statistical Computing, Vienna, Austria).
RESULTS
Participant Characteristics.
Table 1 shows the characteristics of study participants. Characteristics by CVH group were described previously 32, and we previously found no substantial differences in participant characteristics by DNA methylation status either at Y15 or Y20.49 At CARDIA Y15, participants were on average 40.9±3.5 years old, with a mean GrimAge of 47.8±5.3 years old and a mean GrimAA of −0.05±4.58 years; 59.3% were white and 51.3% female. In FHS, participants were on average 66.2±8.8 years old, with a mean GrimAge of 59.5±8.8 years and a mean GrimAA of −0.18±4.8 years; 100% were white and 54.4% female. Online Table I shows our descriptive analyses of CVH score and GrimAA; we found evidence of decreasing GrimAA with increasing CVH score (p<0.01 for all).
Table 1:
Study Participant Characteristics
| CARDIA* | FHS | |
|---|---|---|
| N (all visits) | 1042 | 2106 |
| Age (y), mean (SD) | 40.89 (3.51) | 66.21 (8.82) |
| GrimAge, mean (SD) | 47.80 (5.36) | 59.49 (8.77) |
| GrimAge Acceleration (GrimAA), mean (SD) | −0.05 (4.71) | −0.18 (4.81) |
| CVH Measures at Baseline (CARDIA Y15, FHS Exam 7) | ||
| Body Mass Index (kg/m2), mean (SD) | 28.54 (6.24) | 27.95 (5.24) |
| Systolic Blood Pressure (mm Hg), mean (SD) | 112.26 (13.62) | 125.59 (18.06) |
| Diastolic Blood Pressure (mm Hg), mean (SD) | 74.05 (10.83) | 74.38 (9.51) |
| Total Cholesterol (mg/dL), mean (SD) | 186.38 (35.47) | 200.87 (35.62) |
| Fasting Glucose (mg/dL), mean (SD) | 86.27 (18.45) | 102.96 (25.61) |
| Smoking Status, n (%) | ||
| Never | 653 (62.79) | 782 (37.13) |
| Former | 181 (17.40) | 1087 (51.61) |
| Current | 206 (19.81) | 237 (11.25) |
| Dietary Quality Score, mean (SD) | 64.34 (10.32) | 1.41 (0.89) |
| Physical Activity, mean (SD), total intensity score | 350.02 (274.71) | NA |
| Moderate physical activity, n(%) | NA | 2041 (96.91%) |
| Race | ||
| White | 618 (59.31) | 2106 (100%) |
| Black | 424 (40.69) | 0 (0%) |
| Sex | ||
| Female | 535 (51.34) | 1146 (54.42%) |
| Male | 507 (48.66) | 960 (45.58%) |
| Field Center | ||
| Birmingham | 255 (24.47) | NA |
| Chicago | 225 (21.59) | NA |
| Minneapolis | 278 (26.68) | NA |
| Oakland | 284 (27.26) | NA |
| Education (y), mean (SD) | 15.07 (2.54) | NA |
| College/graduate degrees, n(%) | 499 (47.89%) | 824 (39.13%) |
| Alcohol Consumption(ml/day), mean (SD) | 12.05 (22.62) | NA |
| Excess alcohol drinking†, n(%) | 165 (15.83%) | 723 (34.33%) |
=All variables measured at Y15 unless otherwise specified
=Excessive drinking in FHS was defined as ≥14 drinks/week for men and ≥7 drinks/week for women
Epigenetic Age Acceleration Associations with Clinical CVH.
Table 2 shows the results of clinical CVH score and GrimAA at Y15 and Y20 in CARDIA. We found associations between clinical CVH score and GrimAA, regardless of when CVH data were collected; higher CVH score was associated with both lower Y15 GrimAA (β range −0.28 to −0.21 years per point increase in CVH; p-value range <0.01 to 0.01, FDR range <0.01 to 0.01) and lower Y20 GrimAA (β range −0.41 to −0.32 years per point increase in CVH; FDR all <0.01). While our race- and sex-stratified models (Online Table II) revealed modest differences in associations, our interaction tests showed no significant effect modification by either race or by sex (pinteraction>0.05 for both). Online Table III shows the results of these analyses with IEAA, which were generally similar but smaller in magnitude than the analyses of GrimAA. EEAA was not associated with CVH (data available upon request).
Table 2:
Associations of Clinical CVH Score from young age with GrimAge Acceleration
| Y15 GrimAA Measure (N=1042) | Y20 GrimAA Measure (N=957) | ||||||||||
|---|---|---|---|---|---|---|---|---|---|---|---|
| Exam Year of Clinical CVH Score | n | Age Range | β (95% CI)† | p | FDR | Exam Year of Clinical CVH Score | n | Age Range | β (95% CI)† | p | FDR |
|
| |||||||||||
| Prospective | |||||||||||
| Y0 | 1018 | 18–30 | −0.28 (−0.47, −0.10) | 0.0030 | 0.0039 | Y0 | 934 | 18–30 | −0.32 (−0.52, −0.13) | 0.0014 | 0.0021 |
| Y7 | 951 | 25–37 | −0.28 (−0.44, −0.11) | 0.00094 | 0.0017 | Y7 | 871 | 25–37 | −0.35 (−0.52, −0.18) | 0.000043 | 0.00013 |
| Y10 | 953 | 28–40 | −0.20 (−0.35, −0.04) | 0.013 | 0.013 | Y10 | 884 | 28–40 | −0.32 (−0.48, −0.17) | 0.000071 | 0.00016 |
| Y15 | 944 | 33–45 | −0.34 (−0.49, −0.19) | 0.0000078 | 0.000035 | ||||||
|
| |||||||||||
| Cross-sectional | |||||||||||
| Y15 | 1030 | 33–45 | −0.21 (−0.36, −0.07) | 0.0042 | 0.0047 | Y20 | 953 | 38–50 | −0.41 (−0.56, −0.27) | 0.000000012 | 0.00000011 |
= Statistically significant at FDR<0.05, after adjusting for all tests presented in this table.
=Beta coefficient estimates represent the change in GrimAA, in years, with each point increase in CVH. P-values for each row represent a two-sided test of whether the estimate is different from zero, corresponding to the beta-value and 95% confidence interval in each row.
All models used GrimAA as the dependent variable, clinical CVH score as the independent variable, and adjusted for field center, sex, race, education, alcohol consumption, smoking status, and physical activity.
CVH components were scored as follows:
For BMI, <25 kg/m2 was ideal, 25–29.9 kg/m2 intermediate, and >30 kg/m2 poor.
For blood pressure, <120/<80 mm Hg without medications was ideal, SBP 120–139 mm Hg or DBP 80–89 mm Hg or successfully treated was intermediate, and SBP >140 or DBP >90 mm Hg poor.
For total cholesterol <200 mg/dL without medication was ideal, 200–239 mg/dL or successfully treated was intermediate, and >240 mg/dL was poor.
For fasting glucose, <100 mg/dL without medication was ideal, 100–125 mg/dL or successfully treated was intermediate, and >126 mg/dL was poor.
GEE models of CVH scores and Epigenetic Age Acceleration.
Table 3 shows the results of our GEE models combining both Y15 and Y20 GrimAA measurements. Regardless of when CVH was measured, both the clinical and full scores were associated with GrimAA (clinical: β range −0.29 to −0.24 years per point increase in CVH, p-value and FDR <0.01 for all; full: β range −0.67 to −0.65 years per point increase in CVH, p-value and FDR <0.01 for all). We found no evidence of effect modification (pinteraction>0.05; Online Table IV). The results of GEE models for IEAA are displayed in Online Table V. Our sensitivity analyses found that additionally adjusting our models with the full CVH score for smoking status attenuated the CVH-GrimAA association to the point of being very similar to but slightly stronger than our reported associations with clinical CVH (Online Table VI; β range −0.31 to −0.35 years per point increase in CVH).
Table 3:
Generalized Estimating Equations of CVH score from young age with GrimAA at Y15 and Y20
| Exam Year of Clinical CVH Score | n | Age Range | β (95% CI)† | p | FDR | Exam Year of Full CVH score | n | Age Range | β (95% CI)† | p | FDR |
|---|---|---|---|---|---|---|---|---|---|---|---|
|
| |||||||||||
| Prospective | |||||||||||
| Y0 | 1091 | 18–30 | −0.28 (−0.44, −0.12) | 0.00047 | 0.00047 | Y0 | 1085 | 18–30 | −0.65 (−0.79, −0.52) | 1.00E-28 | 3.50E-28 |
| Y7 | 1015 | 25–37 | −0.29 (−0.44, −0.15) | 0.000086 | 0.00012 | Y7 | 995 | 25–37 | −0.66 (−0.79, −0.53) | 1.00E-28 | 3.50E-28 |
| Y10 | 1018 | 28–40 | −0.24 (−0.37, −0.11) | 0.00028 | 0.00033 | ||||||
|
| |||||||||||
| Cross-sectional | |||||||||||
| Y15 | 1103 | 33–45 | −0.26 (−0.38, −0.14) | 0.000030 | 0.000053 | Y20 | 840 | 38–50 | −0.67 (−0.81, −0.53) | 2.50E-21 | 5.83E-21 |
= Statistically Significant at FDR<0.05, after separately adjusting for all tests of clinical and full CVH score.
=Beta coefficient estimates represent the change in GrimAA, in years, with each point increase in CVH. P-values for each row represent a two-sided test of whether the estimate is different from zero, corresponding to the beta-value and 95% confidence interval in each row.
All models used GrimAA as the dependent variable, CVH score as the independent variable, and adjusted for field center, sex, race, education, and alcohol consumption. Models of the clinical CVH score additionally adjusted for smoking and physical activity.
CVH components were scored as follows:
For BMI, <25 kg/m2 was ideal, 25–29.9 kg/m2 intermediate, and >30 kg/m2 poor.
For blood pressure, <120/<80 mm Hg without medications was ideal, SBP 120–139 mm Hg or DBP 80–89 mm Hg or successfully treated was intermediate, and SBP >140 or DBP >90 mm Hg poor.
For total cholesterol <200 mg/dL without medication was ideal, 200–239 mg/dL or successfully treated was intermediate, and >240 mg/dL was poor.
For fasting glucose, <100 mg/dL without medication was ideal, 100–125 mg/dL or successfully treated was intermediate, and >126 mg/dL was poor.
For smoking, never smoking or quitting more than 12 months ago was ideal, quitting <12 months ago intermediate, and currently smoking poor.
For physical activity, the top 40% on the physical activity questionnaire was defined as ideal, the second 40% as intermediate, and the lowest 20% as poor.
For diet, the top 40% on the dietary quality questionnaire was defined as ideal, the second 40% as intermediate, and the lowest 20% as poor.
Validation.
Table 4 shows the results of our validation study in the older-aged FHS participants. In the retrospective analysis comparing exam 7 CVH to exam 8 GrimAA, both clinical and full CVH scores were associated with GrimAA (β=−0.51 years per point increase in CVH, p<0.01; β=−0.83 years, p<0.01, respectively). These associations were similar in the cross-sectional analysis; clinical CVH score was strongly associated with GrimAA (β=−0.54 years per point increase in CVH, p<0.01), and the full CVH score was even more strongly associated (β=−0.76 years per point increase in CVH, p<0.01). Neither model revealed evidence of effect modification by sex (pinteraction>0.05, Online Table VII).
Table 4:
Associations of CVH score with GrimAA in FHS (N=2106)
| Clinical CVH Score | Age Range | β (95% CI)† | P | Full CVH score | Age Range | β (95% CI)† | P |
|---|---|---|---|---|---|---|---|
|
| |||||||
| Prospective | |||||||
| Exam 7 | 33–85 | −0.51 (−0.60, −0.42) | 1.59E-27* | Exam 7 | 33–85 | −0.83 (−0.92, −0.74) | 8.35E-65* |
| Cross-sectional | |||||||
| Exam 8 | 40–92 | −0.54 (−0.64, −0.44) | 3.46E-25* | Exam 8 | 40–92 | −0.76 (−0.86, −0.67) | 4.16E-53* |
= Statistically Significant at p<0.05.
=Beta coefficient estimates represent the change in GrimAA, in years, with each point increase in CVH. P-values for each row represent a two-sided test of whether the estimate is different from zero, corresponding to the beta-value and 95% confidence interval in each row.
All models used GrimAA as the dependent variable, CVH score as the independent variable, and adjusted for field center, sex, race, education, and alcohol consumption. Models of the clinical CVH score additionally adjusted for smoking and physical activity.
CVH components were scored as follows:
For BMI, <25 kg/m2 was ideal, 25–29.9 kg/m2 intermediate, and >30 kg/m2 poor.
For blood pressure, <120/<80 mm Hg without medications was ideal, SBP 120–139 mm Hg or DBP 80–89 mm Hg or successfully treated was intermediate, and SBP >140 or DBP >90 mm Hg poor.
For total cholesterol <200 mg/dL without medication was ideal, 200–239 mg/dL or successfully treated was intermediate, and >240 mg/dL was poor.
For fasting glucose, <100 mg/dL without medication was ideal, 100–125 mg/dL or successfully treated was intermediate, and >126 mg/dL was poor.
For smoking, never smoking or quitting more than 12 months ago was ideal, quitting <12 months ago intermediate, and currently smoking poor.
For physical activity, the top 40% on the physical activity questionnaire was defined as ideal, the second 40% as intermediate, and the lowest 20% as poor.
For diet, the top 40% on the dietary quality questionnaire was defined as ideal, the second 40% as intermediate, and the lowest 20% as poor.
Mediation Analyses.
Figure 2 shows the results of mediation analyses in CARDIA and FHS (full tabular results are available in Table VIII). We estimate that Y15 GrimAA mediated between 5.8–6.7% of the effect of clinical CVH score (measured prior to Y15) on Y25 CAC, and 23.3% and 15.0% of the effect of the full CVH score (measured at Y0 and Y7, respectively) on Y25 CAC. We also found that Y20 GrimAA mediated 7.6–10.4% of the effect of clinical CVH score (measured at Y0, Y7, and Y15), 22.4% of the effect of the full CVH score (measured at Y0), and 19.1% of the effect of the full CVH score (measured at Y7), all on Y25 CAC. We were able to validate this in FHS, finding that GrimAA at exam 8 mediated 28.1% of the effect of exam 7 full CVH score on exam 8 CAC. Our sensitivity analysis testing sequential ignorability revealed that in order to diminish the natural indirect effect of our mediation analyses, there would need to be unmeasured confounders in the respective mediator and outcome models such that the product of the variance explained (R2) of between 0.01 and 0.02 (Online Figure III); these differences in R2 are not particularly meaningful so these findings suggest a roughly stable relationship with CVH over time. We found a correlation of r=−0.53 between GrimAA and smoking sub-score in CARDIA.
Figure 2:

Mediation Analyses in CARDIA and FHS. Figure illustrates study design in CARDIA. In CARDIA only, FDR values were calculated from all tests of clinical CVH and full CVH separately.
DISCUSSION
In this study, we found that better CVH starting at enrollment and throughout young adulthood was associated with slower GrimAA up to 20 year later. Few studies have examined epigenetic age acceleration in relation to overall age-related CVH loss from young age. We were able to validate our associations between GrimAA and the clinical and full CVH scores in FHS using both cross-sectional and prospective analyses. In addition, our mediation analysis in both studies found that GrimAA may mediate 5–23% of the association between CVH and CAC. GrimAA was designed as a long-term predictor of mortality; if its relationship to CVH factors and CVD is similar, it may be a useful molecular archive of the CVH factors and/or predictor of age-related CVD outcomes. These findings stand in contrast to the smaller associations in our analysis of IEAA, and null associations with EEAA. This pattern likely reflects differences in the goals and construction methods of each measure of epigenetic age acceleration. IEAA was designed as a multi-tissue measure of cell aging, and thus would be expected to be less sensitive to diseases and risk factors of the cardiovascular system compared to GrimAA (which was designed using blood proteins in particular, and included coronary heart disease as one outcome of interest. Similarly, EEAA was designed to capture changes in blood cell composition and effects of environmental factors not necessarily specific to CVD, whereas GrimAA was designed to capture total mortality (of which CVD is a major component). Whether the strong associations we observed with GrimAA reflect the primacy of the cardiovascular system in GrimAA’s design, or the primacy of CVD in total mortality, should be assessed in future research. Similarly, our findings suggest that GrimAA is a useful biomarker of CVH regardless of when CVH is measured. This will need to be confirmed in future studies with additional time points throughout the life course (including clinical events), but if true represents a clinically significant application of GrimAA as an early detection biomarker of CVD.
GrimAA and CVH Score.
GrimAA was designed to predict lifespan and “healthspan” (i.e., healthy lifespan), and was derived from several plasma protein markers as well as smoking pack-years (as evidenced by the correlation between smoking status and GrimAA in CARDIA). In addition to the original study that found strong mortality associations, recent research has linked GrimAA to individual CVH metrics52, 53. The full CVH score in younger adulthood most strongly contributed to GrimAA at middle age, regardless of the timing of CVH measurement and without substantial differences by race or sex. While some studies have found sex differences in associations between GrimAA and CVH components52, 53, as well as more general differences in epigenetic age acceleration by both race and sex,54–56 our evidence suggests that GrimAA may be a useful biomarker of CVH and CVD risk regardless of race or sex, particularly for the full CVH score. However, we note that in our GEE models (effectively averaging the Y15 and Y20 models), the cross-sectional and prospective associations between GrimAA and both CVH measures were largely the same. This suggests that GrimAA may be a useful biomarker of CVH measured in both early and mid-life, and potentially a viable predictor of CVD regardless of when CVH is measured in adulthood. It should also be noted that our sensitivity analysis found that smoking largely drives the difference in association between clinical CVH score (which does not include smoking) and full CVH score (which does). Comparing our sensitivity analysis to our main findings in Table 3, we find that the association between GrimAA and full CVH score after adjusting for smoking was ~10–20% higher than that between GrimAA and the clinical CVH score, suggesting a possible contribution by diet and/or exercise as well independent of the clinical CVH factors (BMI, blood pressure, glucose, and total cholesterol.
GrimAA as a Predictor of CAC.
Our results provide evidence suggesting that GrimAA may mediate the associations between CVH earlier in life and CAC later in life. This may occur through a mechanism such as inflammation or oxidative stress, which has been linked to both CVD and DNA methylation.16 As a summary biomarker of epigenetic aging, GrimAA captures age-related changes throughout the epigenome; these changes may be due to the accumulative burden of CVH through life. In CARDIA the mediation effects were stronger for the full CVH score, and for CVH measured earlier in life; this pattern is consistent with a prior study of CAC in CARDIA57. This suggests that GrimAA (as a biomarker of CAC risk) may be more sensitive to exposures earlier in life. Interestingly, this temporal pattern was only evidenced for the full CVH score- the mediation results of the clinical CVH score were similar regardless of when clinical CVH was measured, whereas GrimAA mediated the highest proportion of the full score at Y0 and over time the proportion mediated decreased. This suggests a potential ‘critical period’, whereby GrimAA is more sensitive to behavioral CVH exposures (smoking, diet, and exercise) earlier in life, potentially because this is when those factors exert a greater influence on CVD risk. Future research in longitudinal cohorts is needed to test this hypothesis.
These findings may also help explain the lack of validation of the clinical CVH score in FHS, whose population for DNA methylation data was older than that in CARDIA. Differences in the timing of CAC measurement and CVH measurement relative to DNA methylation data collection between CARDIA and FHS, or in the age ranges of the two populations (CARDIA, ages 33–45 years at Y15 vs. FHS, ages 40–92 years at exam 8) may also explain differences in our results. Alternatively, the smaller sample size for FHS participants with CAC data may simply mean that the lack of validation for our mediation analysis of clinical CVH score was due to a loss of statistical power. Interestingly, the associations between CVH and GrimAA were stronger in in FHS. This may be related to older age; FHS participants with high CVH could have had it for a longer time. Thus, GrimAA may reflect the cumulative effect of maintaining high CVH over time (cumulative CVH). GrimAA may therefore be useful for identifying individuals at risk of CVD, or asymptomatic CVD patients.
Strengths and Limitations.
This study’s strengths include a well-phenotyped cohort, longitudinal design, and independent validation. CARDIA’s data enable us to capture the transition from an at-risk but disease-free state to a state of biological/molecular changes, and to subclinical CVD, with minimal effects due to aging or aging-related diseases, while the data from FHS enabled us to validate our findings in an older population at greater risk for clinical CVD. However, this study was also subject to limitations. While the use of a blood-based epigenetic biomarker involves practical advantages, a weakness of this study is that we did not examine tissue-specific DNA methylation. Furthermore, we were unable to examine a minority population independent of CARDIA, as the FHS only includes white participants. Similarly GrimAA was developed using bioinformatics approaches in all-white populations, and may not be appropriate for others. Other differences between these two populations may also contribute to residual bias in our results- for example, the older age of FHS offspring participants (compared to CARDIA’s) means that greater error (or residual confounding) in GrimAA calculations for this population, and that they may be more susceptible to a survivorship bias (with less-healthy FHS members dying off, leaving more mostly healthy participants to continue). Our findings should be validated in additional, more diverse populations to address these concerns.
Conclusions.
Our findings provide important information demonstrating that GrimAA may be a useful marker of molecular aging, indicating the loss of CVH from young age throughout middle age, a critical time period for the transition from a healthy, disease-free state to subclinical CVD. This may prove a useful addition to current methods for risk assessment of CVH and in preventing CVD 58. In addition, epigenetic age acceleration may capture molecular underpinnings of CVD risk that could provide important mechanistic information on the pathophysiology of CVD. As the CARDIA study population ages, our findings may also help show useful links to clinical disease that can guide population-level interventions to interrupt the molecular effects of poor CVH and thus precisely prevent CVD. Additional validation of our longitudinal and mediation results, and of GrimAA as a biomarker of CVH in racial/ethnic minorities, is needed before our findings can be generalized.
Supplementary Material
NOVELTY AND SIGNIFICANCE.
What Is Known?
Common risk factors for cardiovascular disease (CVD) tend to accumulate throughout early and especially mid-life, culminating in CVD later in life.
Less is known about the early stages of this process, including processes at the genetic or molecular level that may lead to (or be early precursors of) CVD.
GrimAge acceleration (GrimAA) is an epigenetic measure of age that was designed to predict lifespan.
What New Information Does This Article Contribute?
Our findings suggest that GrimAA may be a useful biomarker of early stage CVD, before it is detectable using current technologies.
Studying specific genes used to calculate GrimAA could help provide insight into how CVD develops from exposure to risk factors.
Common risk factors for CVD include smoking, unhealthy BMI, and poor diet/exercise habits. These factors tend to accumulate during early and especially in mid-life, ultimately causing CVD in later life. Less is knows about the early stages of this process, including details at the genetic and cellular levels that may help predict later CVD. We studied GrimAA, an epigenetic measure of age previously developed to predict healthy lifespan. We found that GrimAA is associated with CVD risk factors measured at a variety of different ages, and that it may be a useful early detection biomarker of early stage CVD- before it can be detected using current technologies. Further studying these epigenetic changes in relation to CVD risk factors and early stage CVD could help provide additional insight into the mechanisms by which CVD develops.
ACKNOWLEDGEMENTS
This manuscript has been reviewed by CARDIA for scientific content.
SOURCES OF FUNDING
The Coronary Artery Risk Development in Young Adults Study (CARDIA) is conducted and supported by the National Heart, Lung, and Blood Institute (NHLBI) in collaboration with the University of Alabama at Birmingham (HHSN268201800005I & HHSN268201800007I), Northwestern University (HHSN268201800003I), University of Minnesota (HHSN268201800006I), and Kaiser Foundation Research Institute (HHSN268201800004I). CARDIA is also partially supported by the Intramural Research Program of the National Institute on Aging (NIA) and an intra-agency agreement between NIA and NHLBI (AG0005). The laboratory work and analytical component were funded by the American Heart Association (17SFRN33700278 & 14SFRN20790000, Northwestern University, PI: Dr. Lifang Hou). The mediation analysis in this work was partially supported by R21 AG063370 (PI: Liu and Hou). JM was supported by the National Heart, Lung, and Blood Institute Career Transition Award (1K22HL135075-01). LL was supported by the Longer Life Foundation (Grant # 2019-008). BJ was partially supported by an American Heart Association Career Development Award (Grant # 19CDA34630050).
Nonstandard Abbreviations and Acronyms:
- CAC
Coronary Artery Calcium
- CARDIA
The Coronary Artery Risk Development in Young Adults study
- CVD
Cardiovascular disease
- CVH
Cardiovascular Health
- EEAA
Extrinsic Epigenetic Age Acceleration
- FHS
Framingham Heart Study
- GrimAA
GrimAge Acceleration
- IEAA
Intrinsic Epigenetic Age Acceleration
Footnotes
DISCLOSURES
None.
REFERENCES
- 1.Lloyd-Jones DM, Hong Y, Labarthe D, Mozaffarian D, Appel LJ, Van Horn L, Greenlund K, Daniels S, Nichol G, Tomaselli GF, Arnett DK, Fonarow GC, Ho PM, Lauer MS, Masoudi FA, Robertson RM, Roger V, Schwamm LH, Sorlie P, Yancy CW, Rosamond WD. Defining and setting national goals for cardiovascular health promotion and disease reduction: The american heart association’s strategic impact goal through 2020 and beyond. Circulation. 2010;121:586–613 [DOI] [PubMed] [Google Scholar]
- 2.Stamler J, Stamler R, Neaton JD, Wentworth D, Daviglus ML, Garside D, Dyer AR, Liu K, Greenland P. Low risk-factor profile and long-term cardiovascular and noncardiovascular mortality and life expectancy: Findings for 5 large cohorts of young adult and middle-aged men and women. JAMA. 1999;282:2012–2018 [DOI] [PubMed] [Google Scholar]
- 3.Daviglus ML, Pirzada A, Liu K, Yan LL, Garside DB, Dyer AR, Hoff JA, Kondos GT, Greenland P, Stamler J. Comparison of low risk and higher risk profiles in middle age to frequency and quantity of coronary artery calcium years later. Am J Cardiol. 2004;94:367–369 [DOI] [PubMed] [Google Scholar]
- 4.Dong C, Rundek T, Wright CB, Anwar Z, Elkind MS, Sacco RL. Ideal cardiovascular health predicts lower risks of myocardial infarction, stroke, and vascular death across whites, blacks, and hispanics: The northern manhattan study. Circulation. 2012;125:2975–2984 [DOI] [PMC free article] [PubMed] [Google Scholar]
- 5.Ford ES, Greenlund KJ, Hong Y. Ideal cardiovascular health and mortality from all causes and diseases of the circulatory system among adults in the united states. Circulation. 2012;125:987–995 [DOI] [PMC free article] [PubMed] [Google Scholar]
- 6.Daviglus ML, Liu K, Greenland P, Dyer AR, Garside DB, Manheim L, Lowe LP, Rodin M, Lubitz J, Stamler J. Benefit of a favorable cardiovascular risk-factor profile in middle age with respect to medicare costs. N Engl J Med. 1998;339:1122–1129 [DOI] [PubMed] [Google Scholar]
- 7.Daviglus ML, Liu K, Pirzada A, Yan LL, Garside DB, Greenland P, Manheim LM, Dyer AR, Wang R, Lubitz J, Manning WG, Fries JF, Stamler J. Cardiovascular risk profile earlier in life and medicare costs in the last year of life. Arch Intern Med. 2005;165:1028–1034 [DOI] [PubMed] [Google Scholar]
- 8.Rasmussen-Torvik LJ, Shay CM, Abramson JG, Friedrich CA, Nettleton JA, Prizment AE, Folsom AR. Ideal cardiovascular health is inversely associated with incident cancer: The atherosclerosis risk in communities study. Circulation. 2013;127:1270–1275 [DOI] [PMC free article] [PubMed] [Google Scholar]
- 9.Pandey A, Omar W, Ayers C, LaMonte M, Klein L, Allen NB, Kuller LH, Greenland P, Eaton CB, Gottdiener JS, Lloyd-Jones DM, Berry JD. Sex and race differences in lifetime risk of heart failure with preserved ejection fraction and heart failure with reduced ejection fraction. Circulation. 2018;137:1814–1823 [DOI] [PMC free article] [PubMed] [Google Scholar]
- 10.Wilkins JT, Ning H, Berry J, Zhao L, Dyer AR, Lloyd-Jones DM. Lifetime risk and years lived free of total cardiovascular disease. Jama. 2012;308:1795–1801 [DOI] [PMC free article] [PubMed] [Google Scholar]
- 11.Younus A, Aneni EC, Spatz ES, Osondu CU, Shaharyar S, Roberson L, Ali SS, Ogunmoroti O, Ahmad R, Post J. Prevalence of ideal cardiovascular health among adults in the united states. Journal of the American College of Cardiology. 2015;66:1633–1634 [DOI] [PubMed] [Google Scholar]
- 12.Manolio TA. Genomewide association studies and assessment of the risk of disease. N Engl J Med. 2010;363:166–176 [DOI] [PubMed] [Google Scholar]
- 13.Manolio TA, Collins FS, Cox NJ, Goldstein DB, Hindorff LA, Hunter DJ, McCarthy MI, Ramos EM, Cardon LR, Chakravarti A, Cho JH, Guttmacher AE, Kong A, Kruglyak L, Mardis E, Rotimi CN, Slatkin M, Valle D, Whittemore AS, Boehnke M, Clark AG, Eichler EE, Gibson G, Haines JL, Mackay TF, McCarroll SA, Visscher PM. Finding the missing heritability of complex diseases. Nature. 2009;461:747–753 [DOI] [PMC free article] [PubMed] [Google Scholar]
- 14.Thanassoulis G, Vasan RS. Genetic cardiovascular risk prediction: Will we get there? Circulation. 2010;122:2323–2334 [DOI] [PMC free article] [PubMed] [Google Scholar]
- 15.Martino F, Magenta A, Pannarale G, Martino E, Zanoni C, Perla FM, Puddu PE, Barilla F. Epigenetics and cardiovascular risk in childhood. Journal of cardiovascular medicine (Hagerstown, Md.). 2016;17:539–546 [DOI] [PubMed] [Google Scholar]
- 16.Zhang Y, Ren J. Epigenetics and obesity cardiomyopathy: From pathophysiology to prevention and management. Pharmacology & therapeutics. 2016;161:52–66 [DOI] [PubMed] [Google Scholar]
- 17.Levy E, Spahis S, Bigras JL, Delvin E, Borys JM. The epigenetic machinery in vascular dysfunction and hypertension. Current hypertension reports. 2017;19:52. [DOI] [PubMed] [Google Scholar]
- 18.Hannum G, Guinney J, Zhao L, Zhang L, Hughes G, Sadda S, Klotzle B, Bibikova M, Fan JB, Gao Y, Deconde R, Chen M, Rajapakse I, Friend S, Ideker T, Zhang K. Genomewide methylation profiles reveal quantitative views of human aging rates. Molecular cell. 2013;49:359–367 [DOI] [PMC free article] [PubMed] [Google Scholar]
- 19.Horvath S DNA methylation age of human tissues and cell types. Genome biology. 2013;14:R115. [DOI] [PMC free article] [PubMed] [Google Scholar]
- 20.Lu A, Quach A, Wilson J, Reiner A, Aviv A, Raj K, Hou L, Baccarelli A, Li Y, Stewart J, Whitsel E, Assimes T, Ferrucci L, Horvath S. DNA methylation grimage strongly predicts lifespan and healthspan. Aging (Albany NY). 2019;In press [DOI] [PMC free article] [PubMed] [Google Scholar]
- 21.Zheng Y, Joyce BT, Colicino E, Liu L, Zhang W, Dai Q, Shrubsole MJ, Kibbe WA, Gao T, Zhang Z, Jafari N, Vokonas P, Schwartz J, Baccarelli AA, Hou L. Blood epigenetic age may predict cancer incidence and mortality. EBioMedicine. 2016;5:68–73 [DOI] [PMC free article] [PubMed] [Google Scholar]
- 22.Murabito JM, Zhao Q, Larson MG, Rong J, Lin H, Benjamin EJ, Levy D, Lunetta KL. Measures of biologic age in a community sample predict mortality and age-related disease: The framingham offspring study. The journals of gerontology. Series A, Biological sciences and medical sciences. 2017 [DOI] [PMC free article] [PubMed] [Google Scholar]
- 23.Quach A, Levine ME, Tanaka T, Lu AT, Chen BH, Ferrucci L, Ritz B, Bandinelli S, Neuhouser ML, Beasley JM, Snetselaar L, Wallace RB, Tsao PS, Absher D, Assimes TL, Stewart JD, Li Y, Hou L, Baccarelli AA, Whitsel EA, Horvath S. Epigenetic clock analysis of diet, exercise, education, and lifestyle factors. Aging (Albany NY). 2017;9:419–446 [DOI] [PMC free article] [PubMed] [Google Scholar]
- 24.Marioni RE, Shah S, McRae AF, Ritchie SJ, Muniz-Terrera G, Harris SE, Gibson J, Redmond P, Cox SR, Pattie A, Corley J, Taylor A, Murphy L, Starr JM, Horvath S, Visscher PM, Wray NR, Deary IJ. The epigenetic clock is correlated with physical and cognitive fitness in the lothian birth cohort 1936. International journal of epidemiology. 2015;44:1388–1396 [DOI] [PMC free article] [PubMed] [Google Scholar]
- 25.Irvin MR, Aslibekyan S, Do A, Zhi D, Hidalgo B, Claas SA, Srinivasasainagendra V, Horvath S, Tiwari HK, Absher DM, Arnett DK. Metabolic and inflammatory biomarkers are associated with epigenetic aging acceleration estimates in the goldn study. Clinical epigenetics. 2018;10:56. [DOI] [PMC free article] [PubMed] [Google Scholar]
- 26.Beach SR, Dogan MV, Lei MK, Cutrona CE, Gerrard M, Gibbons FX, Simons RL, Brody GH, Philibert RA. Methylomic aging as a window onto the influence of lifestyle: Tobacco and alcohol use alter the rate of biological aging. Journal of the American Geriatrics Society. 2015;63:2519–2525 [DOI] [PMC free article] [PubMed] [Google Scholar]
- 27.Grant CD, Jafari N, Hou L, Li Y, Stewart JD, Zhang G, Lamichhane A, Manson JE, Baccarelli AA, Whitsel EA, Conneely KN. A longitudinal study of DNA methylation as a potential mediator of age-related diabetes risk. GeroScience. 2017;39:475–489 [DOI] [PMC free article] [PubMed] [Google Scholar]
- 28.Roetker NS, Pankow JS, Bressler J, Morrison AC, Boerwinkle E. Prospective study of epigenetic age acceleration and incidence of cardiovascular disease outcomes in the aric study (atherosclerosis risk in communities). Circulation. Genomic and precision medicine. 2018;11:e001937. [DOI] [PMC free article] [PubMed] [Google Scholar]
- 29.Friedman GD, Cutter GR, Donahue RP, Hughes GH, Hulley SB, Jacobs DR Jr., Liu K, Savage PJ. Cardia: Study design, recruitment, and some characteristics of the examined subjects. Journal of clinical epidemiology. 1988;41:1105–1116 [DOI] [PubMed] [Google Scholar]
- 30.Dogan MV, Beach SRH, Philibert RA. Genetically contextual effects of smoking on genome wide DNA methylation. American journal of medical genetics. Part B, Neuropsychiatric genetics : the official publication of the International Society of Psychiatric Genetics. 2017;174:595–607 [DOI] [PMC free article] [PubMed] [Google Scholar]
- 31.Dogan MV, Grumbach IM, Michaelson JJ, Philibert RA. Integrated genetic and epigenetic prediction of coronary heart disease in the framingham heart study. PloS one. 2018;13:e0190549. [DOI] [PMC free article] [PubMed] [Google Scholar]
- 32.Desai CS, Ning H, Liu K, Reis JP, Gidding SS, Armstrong A, Lima JA, Lloyd-Jones DM. Cardiovascular health in young adulthood and association with left ventricular structure and function later in life: The coronary artery risk development in young adults study. Journal of the American Society of Echocardiography : official publication of the American Society of Echocardiography. 2015;28:1452–1461 [DOI] [PMC free article] [PubMed] [Google Scholar]
- 33.Warnick GR. Enzymatic methods for quantification of lipoprotein lipids. Methods in enzymology. 1986;129:101–123 [DOI] [PubMed] [Google Scholar]
- 34.Wagenknecht LE, Cutter GR, Haley NJ, Sidney S, Manolio TA, Hughes GH, Jacobs DR. Racial differences in serum cotinine levels among smokers in the coronary artery risk development in (young) adults study. American journal of public health. 1990;80:1053–1056 [DOI] [PMC free article] [PubMed] [Google Scholar]
- 35.Liu K, Slattery M, Jacobs D Jr., Cutter G, McDonald A, Van Horn L, Hilner JE, Caan B, Bragg C, Dyer A, et al. A study of the reliability and comparative validity of the cardia dietary history. Ethnicity & disease. 1994;4:15–27 [PubMed] [Google Scholar]
- 36.Parker ED, Schmitz KH, Jacobs DR Jr., Dengel DR, Schreiner PJ. Physical activity in young adults and incident hypertension over 15 years of follow-up: The cardia study. American journal of public health. 2007;97:703–709 [DOI] [PMC free article] [PubMed] [Google Scholar]
- 37.Hwang SJ, Onuma O, Massaro JM, Zhang X, Fu YP, Hoffmann U, Fox CS, O’Donnell CJ. Maintenance of ideal cardiovascular health and coronary artery calcium progression in low-risk men and women in the framingham heart study. Circulation. Cardiovascular imaging. 2018;11:e006209. [DOI] [PMC free article] [PubMed] [Google Scholar]
- 38.Liu K, Daviglus ML, Loria CM, Colangelo LA, Spring B, Moller AC, Lloyd-Jones DM. Healthy lifestyle through young adulthood and the presence of low cardiovascular disease risk profile in middle age: The coronary artery risk development in (young) adults (cardia) study. Circulation. 2012;125:996–1004 [DOI] [PMC free article] [PubMed] [Google Scholar]
- 39.Carr JJ, Nelson JC, Wong ND, McNitt-Gray M, Arad Y, Jacobs DR Jr., Sidney S, Bild DE, Williams OD, Detrano RC. Calcified coronary artery plaque measurement with cardiac ct in population-based studies: Standardized protocol of multi-ethnic study of atherosclerosis (mesa) and coronary artery risk development in young adults (cardia) study. Radiology. 2005;234:35–43 [DOI] [PubMed] [Google Scholar]
- 40.Laddu DR, Rana JS, Murillo R, Sorel ME, Quesenberry CP Jr., Allen NB, Gabriel KP, Carnethon MR, Liu K, Reis JP, Lloyd-Jones D, Carr JJ, Sidney S. 25-year physical activity trajectories and development of subclinical coronary artery disease as measured by coronary artery calcium: The coronary artery risk development in young adults (cardia) study. Mayo Clinic proceedings. 2017;92:1660–1670 [DOI] [PMC free article] [PubMed] [Google Scholar]
- 41.Allen NB, Siddique J, Wilkins JT, Shay C, Lewis CE, Goff DC, Jacobs DR Jr., Liu K, Lloyd-Jones D. Blood pressure trajectories in early adulthood and subclinical atherosclerosis in middle age. Jama. 2014;311:490–497 [DOI] [PMC free article] [PubMed] [Google Scholar]
- 42.Echouffo-Tcheugui JB, Short MI, Xanthakis V, Field P, Sponholtz TR, Larson MG, Vasan RS. Natural history of obesity subphenotypes: Dynamic changes over two decades and prognosis in the framingham heart study. The Journal of clinical endocrinology and metabolism. 2019;104:738–752 [DOI] [PMC free article] [PubMed] [Google Scholar]
- 43.Xu Z, Niu L, Li L, Taylor JA. Enmix: A novel background correction method for illumina humanmethylation450 beadchip. Nucleic Acids Res. 2016;44:e20. [DOI] [PMC free article] [PubMed] [Google Scholar]
- 44.Aryee MJ, Jaffe AE, Corrada-Bravo H, Ladd-Acosta C, Feinberg AP, Hansen KD, Irizarry RA. Minfi: A flexible and comprehensive bioconductor package for the analysis of infinium DNA methylation microarrays. Bioinformatics (Oxford, England). 2014;30:1363–1369 [DOI] [PMC free article] [PubMed] [Google Scholar]
- 45.Houseman EA, Accomando WP, Koestler DC, Christensen BC, Marsit CJ, Nelson HH, Wiencke JK, Kelsey KT. DNA methylation arrays as surrogate measures of cell mixture distribution. BMC Bioinformatics. 2012;13:86. [DOI] [PMC free article] [PubMed] [Google Scholar]
- 46.Teschendorff AE, Marabita F, Lechner M, Bartlett T, Tegner J, Gomez-Cabrero D, Beck S. A beta-mixture quantile normalization method for correcting probe design bias in illumina infinium 450 k DNA methylation data. Bioinformatics (Oxford, England). 2013;29:189–196 [DOI] [PMC free article] [PubMed] [Google Scholar]
- 47.Fortin J-P, Triche TJ Jr., Hansen KD. Preprocessing, normalization and integration of the illumina humanmethylationepic array with minfi. Bioinformatics (Oxford, England). 2017;33:558–560 [DOI] [PMC free article] [PubMed] [Google Scholar]
- 48.Triche TJ, Weisenberger DJ, Van Den Berg D, Laird PW, Siegmund KD. Low-level processing of illumina infinium DNA methylation beadarrays. Nucleic Acids Research. 2013;41:e90–e90 [DOI] [PMC free article] [PubMed] [Google Scholar]
- 49.Nannini DR, Joyce BT, Zheng Y, Gao T, Liu L, Yoon G, Huan T, Ma J, Jacobs DR Jr., Wilkins JT, Ren J, Zhang K, Khan SS, Allen NB, Horvath S, Lloyd-Jones DM, Greenland P, Hou L. Epigenetic age acceleration and metabolic syndrome in the coronary artery risk development in young adults study. Clinical epigenetics. 2019;11:160. [DOI] [PMC free article] [PubMed] [Google Scholar]
- 50.Tingley D, Yamamoto T, Hirose K, Keele L, Imai K. Mediation: R package for causal mediation analysis. 2014
- 51.Benjamini Y, Hochberg Y. Controlling the false discovery rate: A practical and powerful approach to multiple testing. Journal of the Royal Statistical Society. Series B (Methodological). 1995:289–300 [Google Scholar]
- 52.Zhao W, Ammous F, Ratliff S, Liu J, Yu M, Mosley TH, Kardia SLR, Smith JA. Education and lifestyle factors are associated with DNA methylation clocks in older african americans. International journal of environmental research and public health. 2019;16. [DOI] [PMC free article] [PubMed] [Google Scholar]
- 53.Arpon A, Milagro FI, Santos JL, Garcia-Granero M, Riezu-Boj JI, Martinez JA. Interaction among sex, aging, and epigenetic processes concerning visceral fat, insulin resistance, and dyslipidaemia. Frontiers in endocrinology. 2019;10:496. [DOI] [PMC free article] [PubMed] [Google Scholar]
- 54.Horvath S, Gurven M, Levine ME, Trumble BC, Kaplan H, Allayee H, Ritz BR, Chen B, Lu AT, Rickabaugh TM, Jamieson BD, Sun D, Li S, Chen W, Quintana-Murci L, Fagny M, Kobor MS, Tsao PS, Reiner AP, Edlefsen KL, Absher D, Assimes TL. An epigenetic clock analysis of race/ethnicity, sex, and coronary heart disease. Genome biology. 2016;17:171. [DOI] [PMC free article] [PubMed] [Google Scholar]
- 55.Javed R, Chen W, Lin F, Liang H. Infant’s DNA methylation age at birth and epigenetic aging accelerators. BioMed research international. 2016;2016:4515928. [DOI] [PMC free article] [PubMed] [Google Scholar]
- 56.Tajuddin SM, Hernandez DG, Chen BH, Noren Hooten N, Mode NA, Nalls MA, Singleton AB, Ejiogu N, Chitrala KN, Zonderman AB, Evans MK. Novel age-associated DNA methylation changes and epigenetic age acceleration in middle-aged african americans and whites. Clinical epigenetics. 2019;11:119. [DOI] [PMC free article] [PubMed] [Google Scholar]
- 57.Loria CM, Liu K, Lewis CE, Hulley SB, Sidney S, Schreiner PJ, Williams OD, Bild DE, Detrano R. Early adult risk factor levels and subsequent coronary artery calcification: The cardia study. J Am Coll Cardiol. 2007;49:2013–2020 [DOI] [PubMed] [Google Scholar]
- 58.Brindle P, Beswick A, Fahey T, Ebrahim S. Accuracy and impact of risk assessment in the primary prevention of cardiovascular disease: A systematic review. Heart (British Cardiac Society). 2006;92:1752–1759 [DOI] [PMC free article] [PubMed] [Google Scholar]
Associated Data
This section collects any data citations, data availability statements, or supplementary materials included in this article.