Abstract
The appropriate selection of passive and active defensive behaviors in threatening situations is essential for survival. Previous studies have shown that passive defensive responses depend on activity of the central nucleus of the amygdala (CeA), whereas active ones primarily rely on the nucleus accumbens (NAc). However, the mechanisms underlying flexible switching between these two types of responses remain unknown. Here, we show in mice that the paraventricular thalamus (PVT) mediates the selection of defensive behaviors through its interaction with the CeA and the NAc. We show that the PVT–CeA pathway drives conditioned freezing responses, whereas the PVT–NAc pathway is inhibited during freezing and instead signals active avoidance events. Optogenetic manipulations revealed that activity in the PVT–CeA or PVT–NAc pathway biases behavior toward the selection of passive or active defensive responses, respectively. These findings provide evidence that the PVT mediates flexible switching between opposing defensive behaviors.
INTRODUCTION
The use of Pavlovian conditioning paradigms has enabled scientists to obtain substantial knowledge of the neuronal circuits and cellular processes underlying fear conditioning and its associated behavioral Pavlovian fear responses (e.g., freezing, flight)1–4. In contrast, the mechanisms controlling instrumental defensive responses such as active avoidance and those that guide the selection of passive and active defensive behaviors, are far less studied5–8. This is surprising considering that in nature animals readily engage and switch between both types of defensive strategies depending on threat imminence8–10.
While studies on the neurobiology of defensive behaviors have pointed to the contributions of both cortical and subcortical networks to the expression of specific defensive behaviors8,10, it is generally recognized that Pavlovian reactions such as freezing and conditioned flight are driven by genetically-defined neuronal subpopulations of the CeA4,11,12 and that active defensive behaviors largely depend on the NAc13–15. Interestingly, reports from the last decade suggest that these two regions of the brain likely compete for the control of defensive behaviors13,16. Specifically, these studies demonstrated that while lesions and pharmacological manipulations of the CeA attenuate freezing and promote active avoidance behavior16,17, inactivation of the NAc decreases avoidance but enhances freezing13,14. Despite these seminal observations, the mechanisms dictating the balance of the competition between these two regions and behavioral outcomes remain unknown.
A potential candidate for mediating the selection of these two types of defensive behaviors is the basolateral amygdala (BLA), since it sends projections to both the NAc and the CeA18. Indeed, BLA projections to the CeA are known to mediate conditioned freezing responses19, whereas BLA projections to the NAc have been shown to support active avoidance behavior14. However, the necessity of the BLA for the expression of conditioned freezing and avoidance behaviors decreases with the passage of time20–22, suggesting that other brain regions likely contribute to arbitrating between these two defensive strategies. We predicted that the posterior portion of the PVT (pPVT) could be implicated in this process, considering its strong innervation of the CeA and the NAc23,24 as well as its documented role in mediating conditioned freezing responses, particularly at remote timepoints12,22. Consistent with this prediction, here we show that the pPVT drives active avoidance through its projections to the NAc. Moreover, we demonstrate that divergent projections from the pPVT to the NAc and CeA mediate the selection of active avoidance and freezing behavior, respectively. These findings highlight the existence of a previously unrecognized switch for the selection of passive and active defensive behaviors in the midline thalamus.
RESULTS
pPVTD2R neurons are inhibited during freezing
The posterior PVT (pPVT), is a stress-sensitive region of the thalamus that sends robust, largely non-overlapping projections to the CeA and the NAc (Fig. 1a-d)25. Unlike primates and carnivores, the rodent thalamus is largely devoid of GABAergic neurons26. Thus, projection neurons of the PVT are predominantly glutamatergic27. Although activation of CeA-projecting pPVT neurons is thought to be necessary for the retrieval of conditioned fear memory and its accompanying of freezing behavior12,22, the NAc is the main target of most pPVT neurons (Fig. 1e-j)25. Surprisingly, the contribution of pPVT–NAc neurons to fear-related behaviors is currently unknown. To investigate this, we first monitored the activity of dopamine D2 receptor expressing neurons of the pPVT (pPVTD2R) – a marker of stress-sensitive PVT neurons, the majority of which project to the NAc (Fig. 1g-j)28–30 – during fear conditioning (Extended Data Fig. 1, 2). Towards this goal, we expressed the genetically encoded calcium sensor GCaMP6s in pPVTD2R neurons of Drd2-Cre mice (Extended Data Fig. 1a). Next, following a habituation session (Day 0), on Day 1 mice were fear conditioned to an auditory cue (conditioned stimulus; CS) that co-terminated with a footshock (unconditioned stimulus; US), and on Day 2 a fear memory retrieval test was performed (Extended Data Fig. 1b-e). On both days, bulk changes in GCaMP6s fluorescence in pPVTD2R neurons were monitored using fiber photometry. We reasoned that since most pPVTD2R neurons project to the NAc, bulk GCaMP6s fluorescence gathered from this neuronal population with fiber photometry would likely be dominated by the activity of PVT–NAc neurons. Consistent with previous reports, pPVTD2R neurons were readily activated by the US during the conditioning session on Day 128,29 (Extended Data Fig. 1g, j, n, o). Notably, we also observed the emergence of small but consistent CS-evoked GCaMP6s responses in late conditioning trials, suggesting that the activity of these neurons is modulated by learning22 (Extended Data Fig. 1l, m). On Day 2, fear memory retrieval was associated with an average decrease in GCaMP6s fluorescence upon CS presentation (Extended Data Fig. 1h, k). These inhibitory GCaMP6s responses were variable and apparent in many but not all CS presentations (Extended Data Fig. 2a), suggesting that they could be tied to behavior. To explore this possibility, we classified all retrieval trials into three groups based on the percentage of freezing displayed and quantified the average CS-evoked response for each trial category (Extended Data Fig. 2a-d) (See Methods). As predicted, the average change in GCaMP6s fluorescence for each trial category varied as a function of freezing behavior, with the highest freezing scores being associated with the most robust inhibitory responses (Extended Data Fig. 2a-g). Notably, we did not observe any effect of retrieval trial number on the GCaMP6s signal (Extended Data Fig. 2h-j). These results indicate the existence of an inverse relationship between freezing behavior and pPVTD2R neuron activity. Consistent with this, pairwise comparisons of CS-evoked movement and GCaMP6s fluorescence uncovered a modest but positive correlation between these two parameters (Extended Data Fig. 2c). Importantly, no such correlation was observed on imaging data gathered during habituation, prior to fear conditioning (Extended Data Fig. 2e, f). As such, our collective results demonstrate that conditioned freezing is associated with decreased activity among pPVTD2R neurons.
Figure 1. pPVTD2R projections to NAc and CeA are partially segregated.
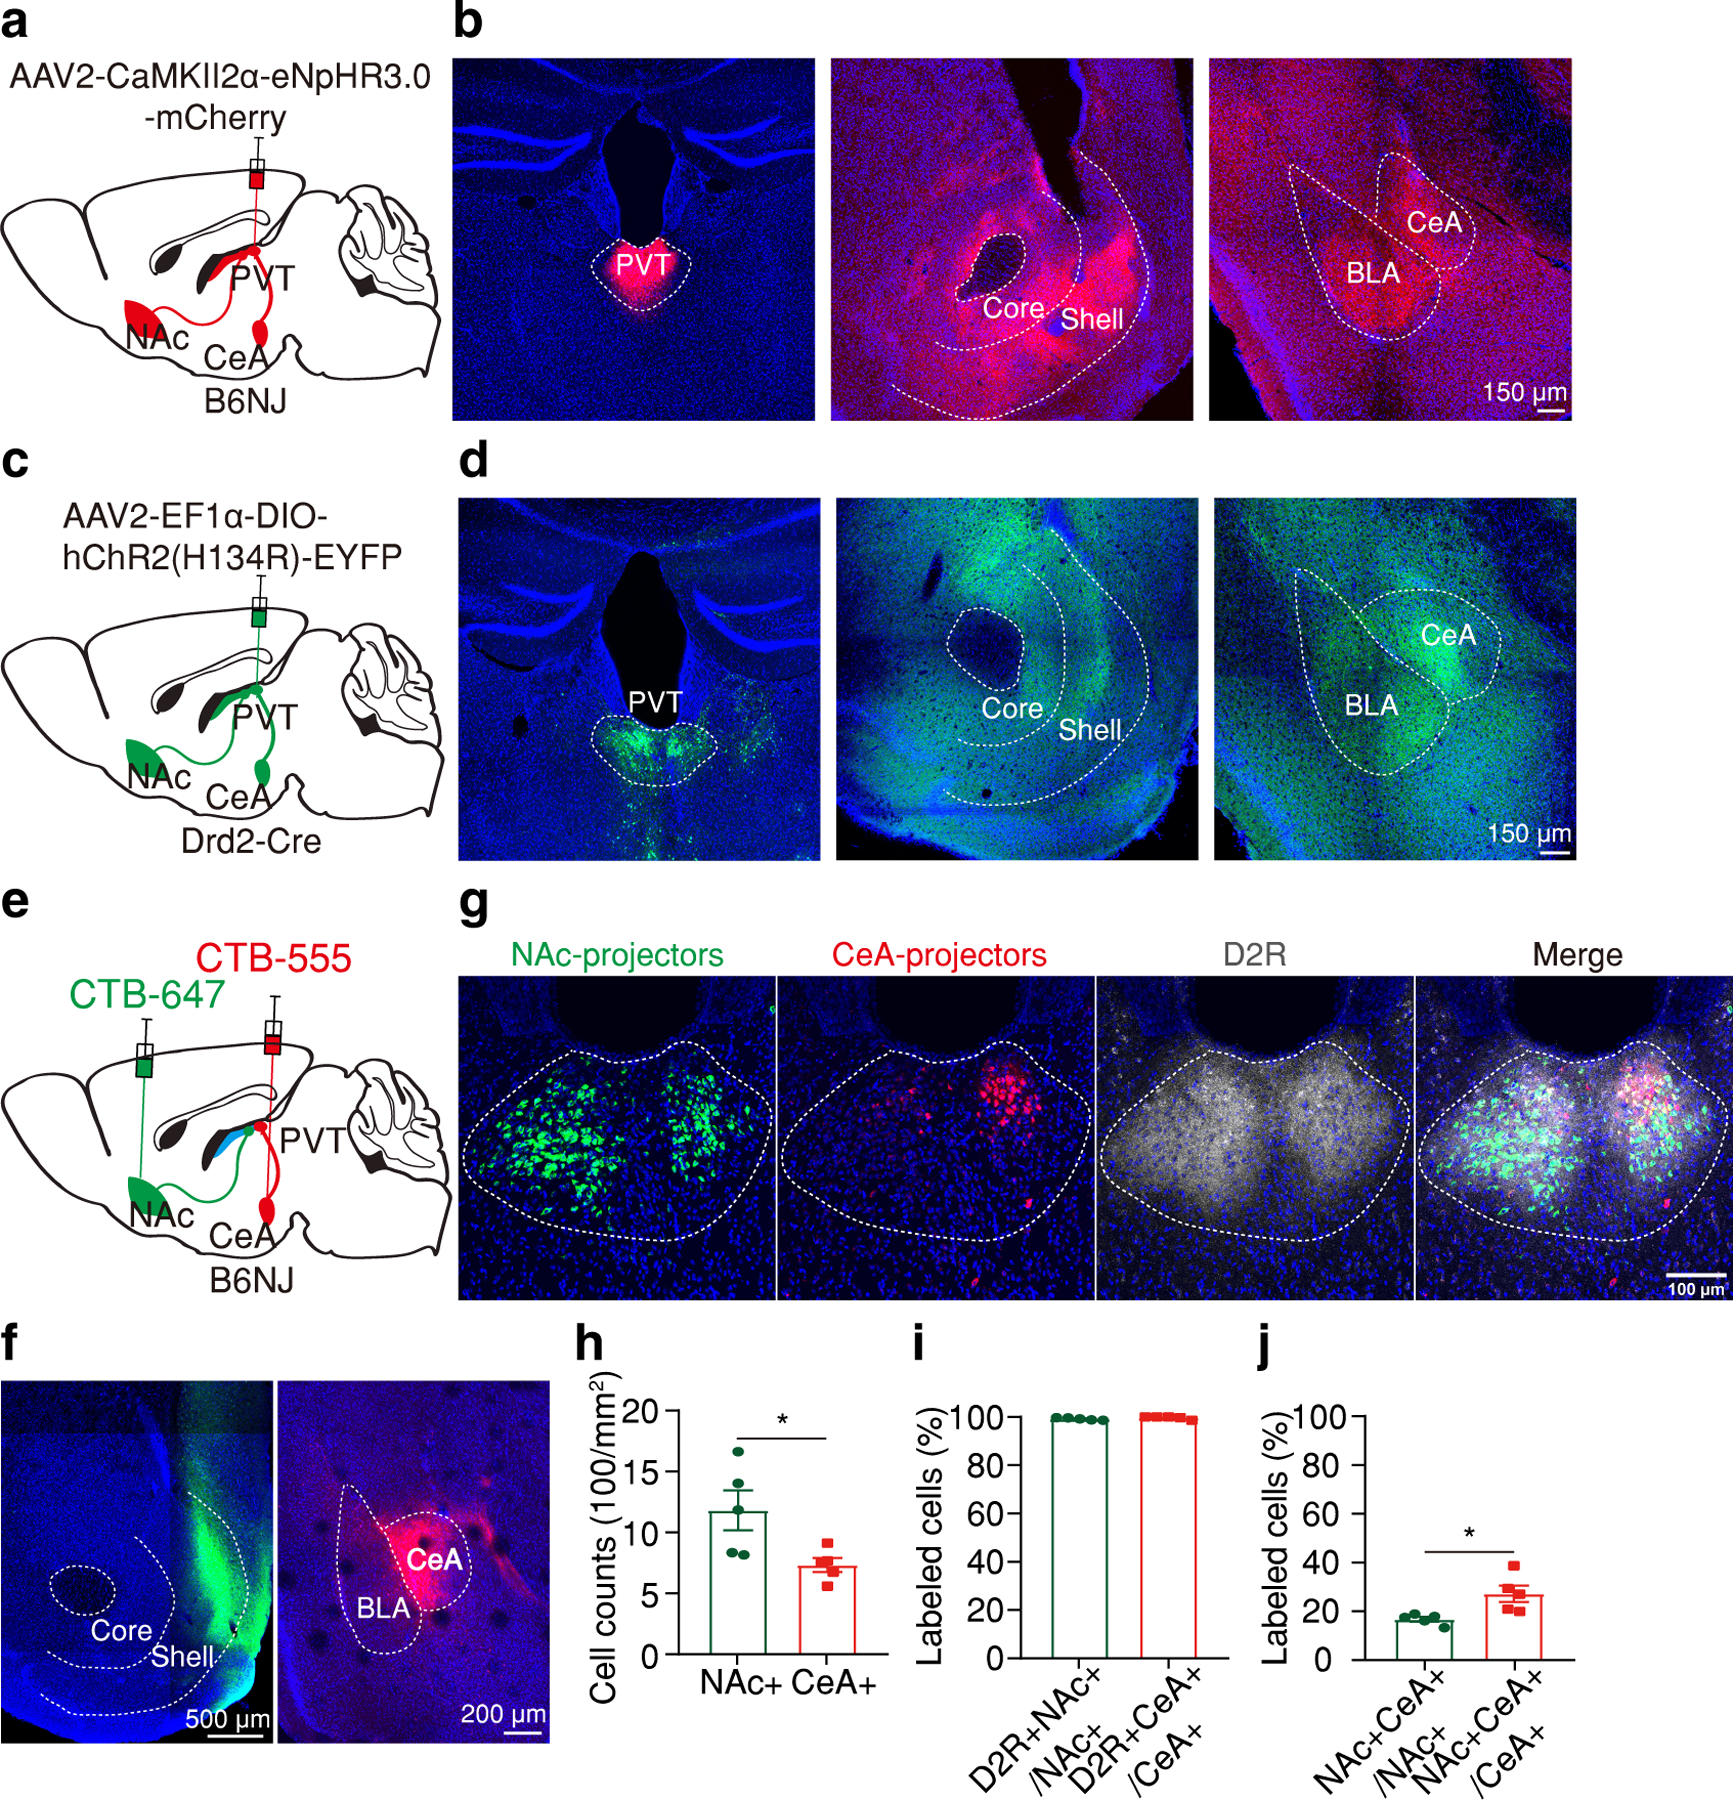
a, Schematic of the viral vector strategy for anterograde tracing pPVT projections. b, Representative images showing Halo-mCherry expression in neurons of the pPVT (left) and axon terminals within the NAc (middle) and the CeA (right). c, Schematic of the viral vector strategy for anterograde tracing pPVTD2R projections. d, Representative images showing ChR2-YFP expression in pPVTD2R neurons (left) and axon terminals within the NAc (middle) and the CeA (right). e, Schematic of the retrograde tracing strategy used for labeling CeA- and NAc-projecting pPVT neurons. f, Representative images showing the targets for dual-color CTB injections, green into the NAc (left) and red into the CeA (right). g, Representative images showing the retrograde labeled NAc-projecting cells (green) and CeA-projecting cells (red) are predominantly present in the D2R-labeled (grey) pPVT region. h, Quantification of the density of CeA- and NAc-projecting neurons in the pPVT. NAc-projectors (NAc+), 1180 ± 163.36; CeA-projectors (CeA+), 732.2 ± 57.97; n= 5 mice; two-tailed Student’s t-test, *P = 0.032. i, D2R protein expression of NAc-projecting and CeA-projecting pPVT cells. D2R+NAc+/NAc+, 99.21 ± 0.22%; D2R+CeA+/CeA+, 99.68 ± 0.26%; n= 5 mice; two-tailed Student’s t-test, P = 0.2. j, Quantification of the percentage of double-projecting cells in pPVT. NAc+CeA+/NAc+, 16.71 ± 0.96%; NAc+CeA+/CeA+, 27.18 ± 3.39%; n= 5 mice; two-tailed Student’s t-test, *P = 0.018. All anatomical experimented were repeated at least once, and similar results were obtained. All data in figure shown as mean ± s.e.m.
pPVTD2R neurons signal active avoidance
The emergence of a positive correlation between the calcium signal of pPVTD2R neurons and movement following fear conditioning, may reflect a link between the activity of this neuronal population and the selection of active coping strategies during fearful situations. To formally assess this possibility, after expressing GCaMP6s in pPVTD2R neurons of Drd2-Cre mice (Fig. 2a), we trained mice in a two-way signaled active avoidance task (2AA) where performing a specific action – moving to the neighboring compartment of a shuttle box – upon presentation of the CS, enables mice to avoid a footshock (US) (Fig. 2b). Mice that are well-trained on this task typically forgo passive (freezing) responses to CS presentation in favor of active (avoidance) responses (Fig. 2c) (Extended Data Fig. 3)6. Nevertheless, on a trial-by-trial basis, they do engage in both freezing and avoidance behavior upon CS presentation (Extended Data Fig. 3c, d). As such, this task provides an opportunity for assessing neuronal activity while animals transition between passive and instrumental fear-related behavioral responses within single test sessions. Consistent with previous reports, mice displayed prominent freezing behavior to the CS in early sessions of the 2AA task6(Fig. 2c) (Extended Data Fig. 3a). However, additional training led to progressive decreases in CS-evoked freezing and a concomitant increase in active avoidance responses (Fig. 2c) (Extended Data Fig. 3a). After three sessions of 2AA training (Days 1–3), pPVTD2R neurons were imaged using fiber photometry during two additional training sessions (Days 4 and 5) (Fig. 2c). Imaging trials were subsequently divided into two behaviorally relevant categories: trials in which mice avoided the US (avoidance) and trials in which they failed to do so (failure). Notably, during failure trials, mice reliably shuttled to the adjacent compartment in response to the US (Supplementary Video 1). The data for avoidance and failure trials are summarized in Figure 2 and Extended Data Figure 3 (Fig. 2d-h) (Extended Data Fig. 3b-d). Classifying trials in this manner revealed important differences in the activity of pPVTD2R neurons during avoidance and failure trials (Supplementary Video 1). First, CS presentation elicited robust increases in GCaMP6s fluorescence in pPVTD2R neurons during avoidance trials, whereas in failure trials it mostly induced strong decreases in the activity of these neurons (Fig. 2g). In addition, presentation of the US during failure trials was associated with robust activation of pPVTD2R neurons, consistent with our fear conditioning data as well as with previous reports (Fig. 2d, e)28,29. Interestingly, whereas mice engaged in instrumental responses during avoidance trials (by definition), they spent significantly more time freezing in response to the CS during failure trials compared to avoidance trials (Fig. 2f). This suggests that the differential dynamics of calcium signals of pPVTD2R neurons observed across these trial categories could be related to behavior. To investigate this possibility, we analyzed calcium transients time-locked to discrete task and behavioral events such as CS onset, maximum velocity and freezing behavior (Fig. 2h). These analyses revealed that while CS onset, maximum velocity and escape behavior (shuttling in response to the CS or US onset) were all associated with increases in GCaMP6s fluorescence, freezing behavior was accompanied by attenuated pPVTD2R neuronal activity for both avoidance and failure trials (Fig. 2h). Thus, while mean signal variations more accurately distinguish avoidance and failure trials (Fig. 2f, g), discrete fluctuations in calcium transients largely reflect moment-to-moment variation in behavior rather than trial type (Fig. 2h). It is interesting that rises in neuronal activity were correlated with maximum velocity particularly for avoidance trials (Fig. 2h). This result indicates a potential relationship between pPVTD2R neuron activity and vigor, such as that necessary to avoid or escape an impending thread. Collectively, our findings support the idea that, at the population level, pPVTD2R neurons signal instrumental defensive behaviors and are suppressed during freezing.
Figure 2. pPVTD2R neurons control active avoidance and are inhibited during freezing.
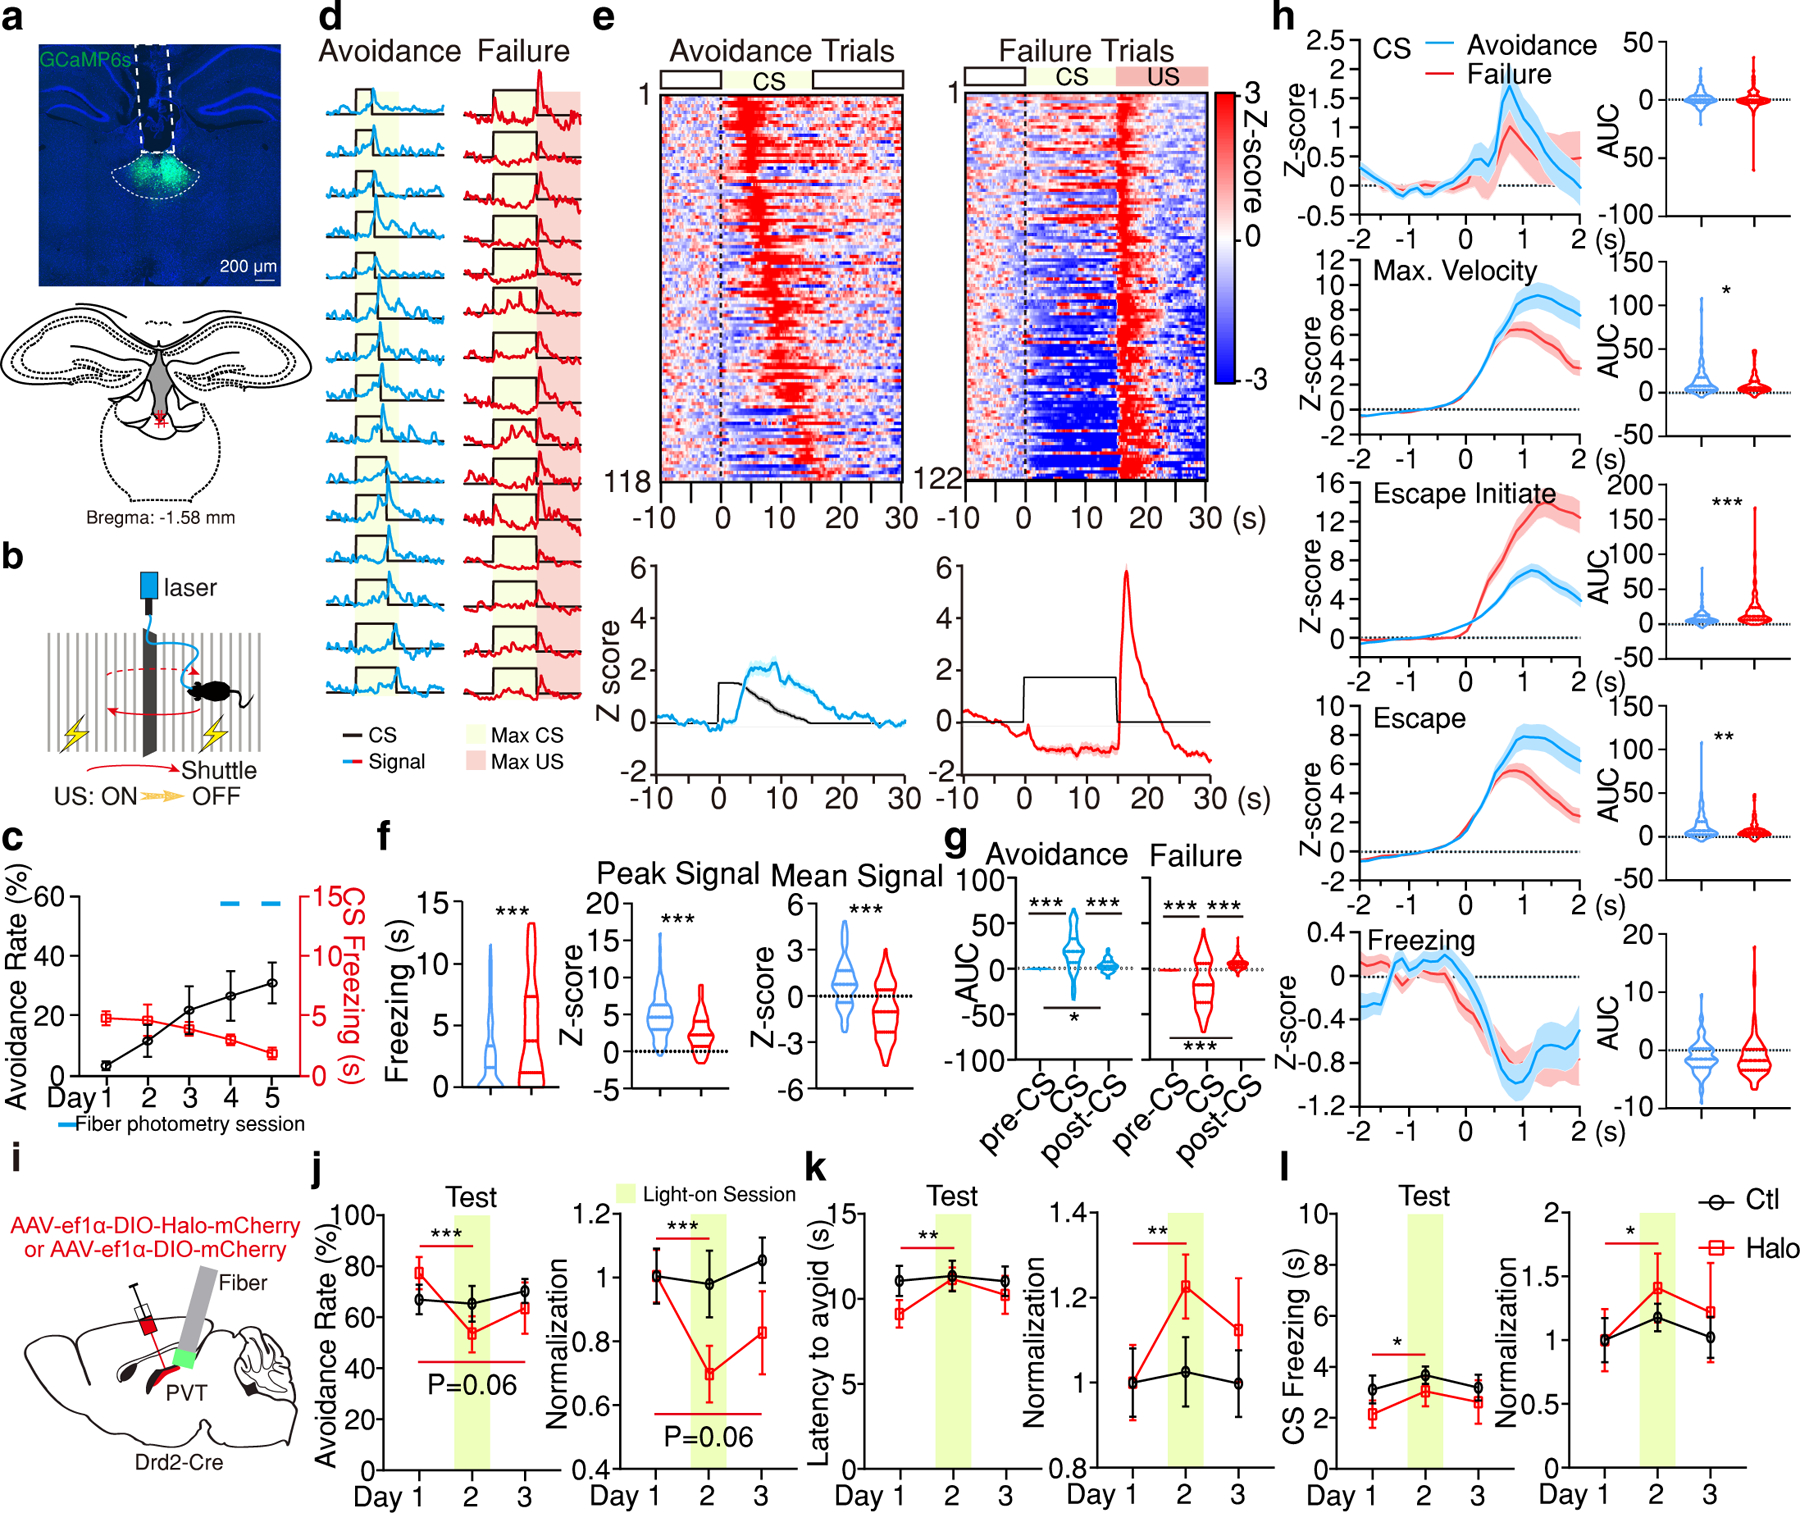
a, Representative image of GCaMP6s expression and fiber placements (n = 5 mice). b, Schematic of the 2AA task. c, Behavior performance during 2AA. d, Representative imaging traces for avoidance and failure trials. e, Top: Heatmaps of calcium responses. Bottom: Average calcium signal and CS (black line). f, Freezing, Peak, and Mean Signal during the CS for each trial type. Avoidance, n = 118 Trials; Failure, n = 122 Trials; two-tailed Student’s t-test. Freezing, ***P = 2.04E-06; Peak Signal, ***P = 1.19E-10; Mean Signal, ***P = 2.78E-15. g, Quantification of calcium signal for data in (e). AUC, One-way ANOVA followed by two-stage step-up procedure of Benjamini, Krieger and Yekutieli. Avoidance: n = 118 Trials; F(2, 351) = 75.89; group comparisons, pre-CS vs CS ***P < 0.001, pre-CS vs post-CS *P = 0.038, CS vs post-CS ***P < 0.001. Failure: n= 122 Trials; F(2, 363) = 66.54. ***P < 0.001. h, Left: Average responses for different events. Right: quantification of signal for each event on the left. AUC, two-tailed Student’s t-test. CS: Avoidance, n = 118 Events; Failure, n = 122 Events; P = 0.74. Max. Velocity: Avoidance, n = 117 Events; Failure, n = 122 Events; *P= 0.024. Escape initiate: Avoidance, n = 113 Events; Failure, n = 115 Events; ***P < 0.001. Escape: Avoidance, n = 118 Events; Failure, n = 122 Events; **P= 0.0064. Freezing: Avoidance, n = 92 Events; Failure, n = 157 Events; P = 0.98. i, Schematic for the silencing of pPVTD2R neurons. j-l, Avoidance rate (j), latency to avoid (k) and freezing during the CS (l). Behavior data normalized to Day 1 is included. Ctl, n = 8 mice; Halo, n= 9 mice, two-way ANOVA followed by two-stage linear step-up procedure of Benjamini, Krieger and Yekutieli. Avoidance Rate: F(2, 30) = 5.48; group comparisons, Halo, Day 1 vs Day 2 ***P < 0.001, Day 1 vs Day 3 P = 0.06. Latency to avoid: F(2, 30) = 2.48; group comparisons, Halo, Day 1 vs Day 2 **P = 0.0037. CS freezing: F(2, 30) = 0.19; group comparisons, Halo, Day 1 vs Day 2 *P = 0.04. All data in figure shown as mean ± s.e.m.
To investigate whether activation of pPVTD2R neurons is required for active avoidance, we expressed in these neurons the inhibitory opsin eNpHR3.0 (Halorhodopsin; Halo) and trained mice in the 2AA task as described above (Fig. 2i) (Extended Data Fig. 4a-j). After 2AA training, mice were subjected to three test sessions, Test Days 1–3 (Fig. 2j-l). On Test Day 1 (light off), both control and Halo-expressing mice displayed robust avoidance behavior (Fig. 2j, k). On Test Day 2 (light on), light stimulation during CS presentations significantly attenuated the avoidance rate of Halo-expressing but not control mice (Fig. 2j, k). This effect was accompanied by a significant increase in the latency to avoid and an increase in CS-evoked freezing behavior (Fig. 2k, l). These parameters partially recovered on Test Day 3 (light off) (Fig. 2j-l). Importantly, restricting optogenetic inhibition of pPVTD2R neurons to the inter-trial interval (ITI) did not significantly alter behavior (Extended Data Fig. 4k-t). Similarly, we did not observe any light stimulation-induced effect on locomotion in an open field arena (Extended Data Fig. 4j). In summary, these findings show that, at the population level, pPVTD2R neurons are required for active avoidance behavior and are inhibited during freezing.
pPVT–NAc projections drive avoidance and antagonize freezing
While most pPVTD2R neurons project to the NAc (Fig. 1)29, it is unclear whether pPVTD2R–NAc projections are modulated by passive and/or active responding in the 2AA task. To address this question, we expressed the genetically encoded calcium indicator GCaMP7s in pPVTD2R neurons and implanted an optical fiber unilaterally in the NAc to measure the activity of pPVTD2R–NAc projections using fiber photometry (Fig. 3a-e). We trained GCaMP7s-expressing mice in the 2AA task, classified individual test trials as either avoidance or failure as described above, and analyzed the corresponding change in fluorescent signal associated with presentations of the CS (Fig. 3f-k). To ensure sufficient numbers of avoidance and failure trials during imaging sessions, mice were only trained for three days before imaging started (Fig. 3d, e). These analyses revealed that pPVTD2R–NAc projections were rapidly engaged following CS presentation and were robustly activated during both avoidance and escape episodes irrespective of trial type (Fig. 3k). In contrast, CS-evoked freezing was associated with a reduction in GCaMP7s fluorescence in this projection (Fig. 3k). These calcium dynamics largely resembled those observed in pPVTD2R neurons (Fig. 2d-h) (Extended Data Fig. 3b). Together, these findings demonstrate that pPVTD2R–NAc projections signal active avoidance and are suppressed during freezing behavior.
Figure 3. pPVTD2R–NAc axon terminals signal active avoidance.
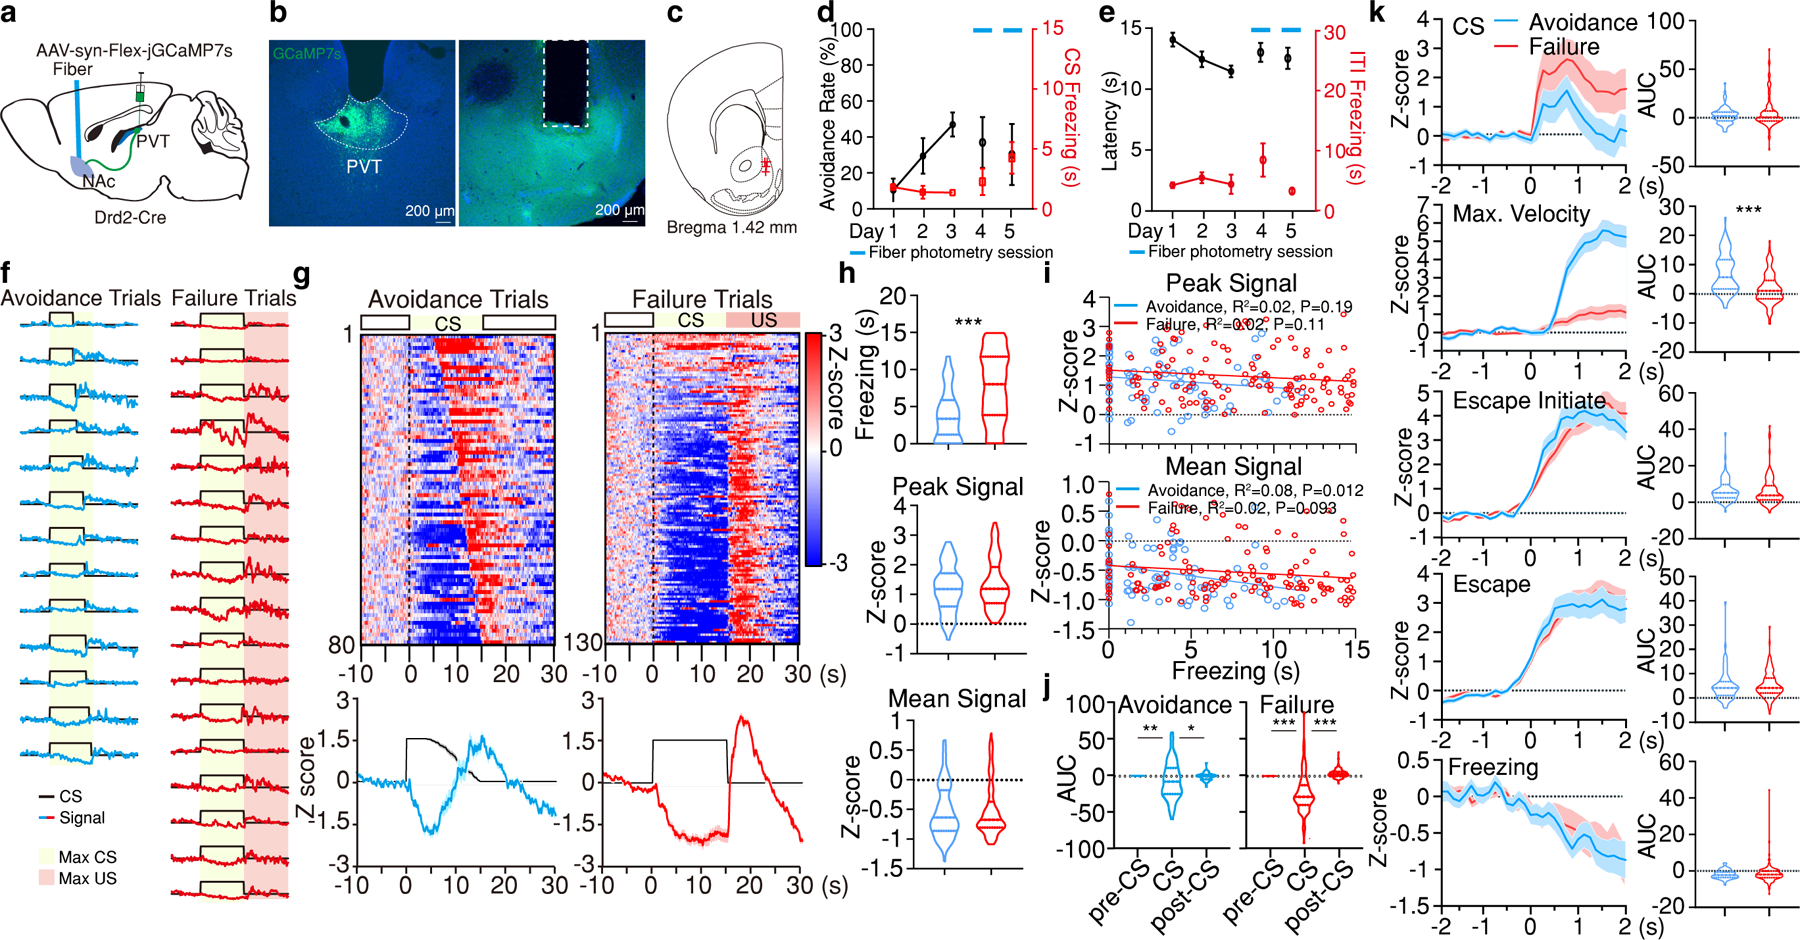
a, Schematic of the experimental approach for fiber photometry imaging of pPVTD2R–NAc terminals. b, Representative images of GCaMP7s expression in pPVTD2R neurons and optical fiber placement in NAc. c, Fiber placements (n = 4 mice). d, Avoidance Rate and CS Freezing across training and imaging sessions. e, Latency to avoid and ITI Freezing for data in (e). f, Representative imaging traces from sample subject. g, Top: Heatmaps of calcium responses for avoidance and failure trials. Bottom: Average calcium signal and CS duration. h, Freezing, Peak, and Mean Signal during the CS for each trial type. Two-tailed Student’s t-test. Avoidance, n = 80 Trials. Failure, n = 130 Trials. Freezing, ***P < 0.001. i, Linear regression of peak (top) and mean calcium signal (bottom) as a function of freezing time during the CS of avoidance and failure trials. j, Quantification of calcium signal for avoidance and failure trials. AUC, One-way ANOVA followed by two-stage linear step-up procedure of Benjamini, Krieger and Yekutieli. Avoidance: n = 80 Trials, F(2, 237) = 4.37; group comparisons, pre-CS vs CS **P = 0.0065, CS vs post-CS *P = 0.021. Failure: n = 130 Trials, F(2, 387) = 121.2; group comparisons, pre-CS vs CS ***P < 0.001, CS vs post-CS ***P < 0.001. k, Left: Average calcium responses during CS onset, CS maximal velocity, escape initiation, escape and CS freezing epochs for all avoidance and failure trials. Right: Quantification of calcium signal for each event on the left. AUC, two-tailed Student’s t-test. CS: Avoidance, n = 80 Events; Failure, n = 130 Events. Max. Velocity: Avoidance, n = 80 Events; Failure, n = 129 Events; ***P < 0.001. Escape initiate: Avoidance, n = 79 Events; Failure, n = 123 Events. Escape: Avoidance, n = 80 Events; Failure, n = 130 Events. Freezing: Avoidance, n = 76 Events; Failure, n = 175 Events. All data in figure shown as mean ± s.e.m.
It is important to highlight that, unlike calcium responses recorded from the cell bodies of pPVTD2R neurons, for which increases were readily observed during shuttling events (Fig. 2d), increases in GCaMP7 fluorescence in pPVTD2R–NAc terminals appeared to emerge mostly at the conclusion of avoidance behavior (CS offset) (Fig. 3f, g). One potential explanation to this finding is that calcium transients accompanying avoidance behavior could result in weaker fluorescent changes at pPVTD2R–NAc axon terminals, thereby limiting our ability to accurately detect these with fiber photometry. To circumvent this limitation, we employed a viral vector strategy that allowed us to record the cell bodies of NAc-projecting neurons directly in the pPVT (Fig. 4a, b). As with our axon terminal imaging experiment, mice were first trained in the 2AA task for three sessions and then fiber photometry imaging from the cell bodies of pPVT–NAc neurons was performed during two additional sessions (Fig. 4c, d). Notably, our results largely resembled those obtained from pPVTD2R neurons (Fig. 4e-j). In particular, we noticed that while pPVT–NAc neurons were strongly recruited during avoidance trials, they were mostly suppressed during failures (Fig. 4i). Moreover, pPVT–NAc neurons signaled active behavioral responses and were instead inhibited during freezing (Fig. 4e, j) (Supplementary Video 2). Together, these findings demonstrate that pPVT projections to the NAc predominantly signal active defensive responses.
Figure 4. NAc-projecting neurons of the pPVT signal active avoidance.
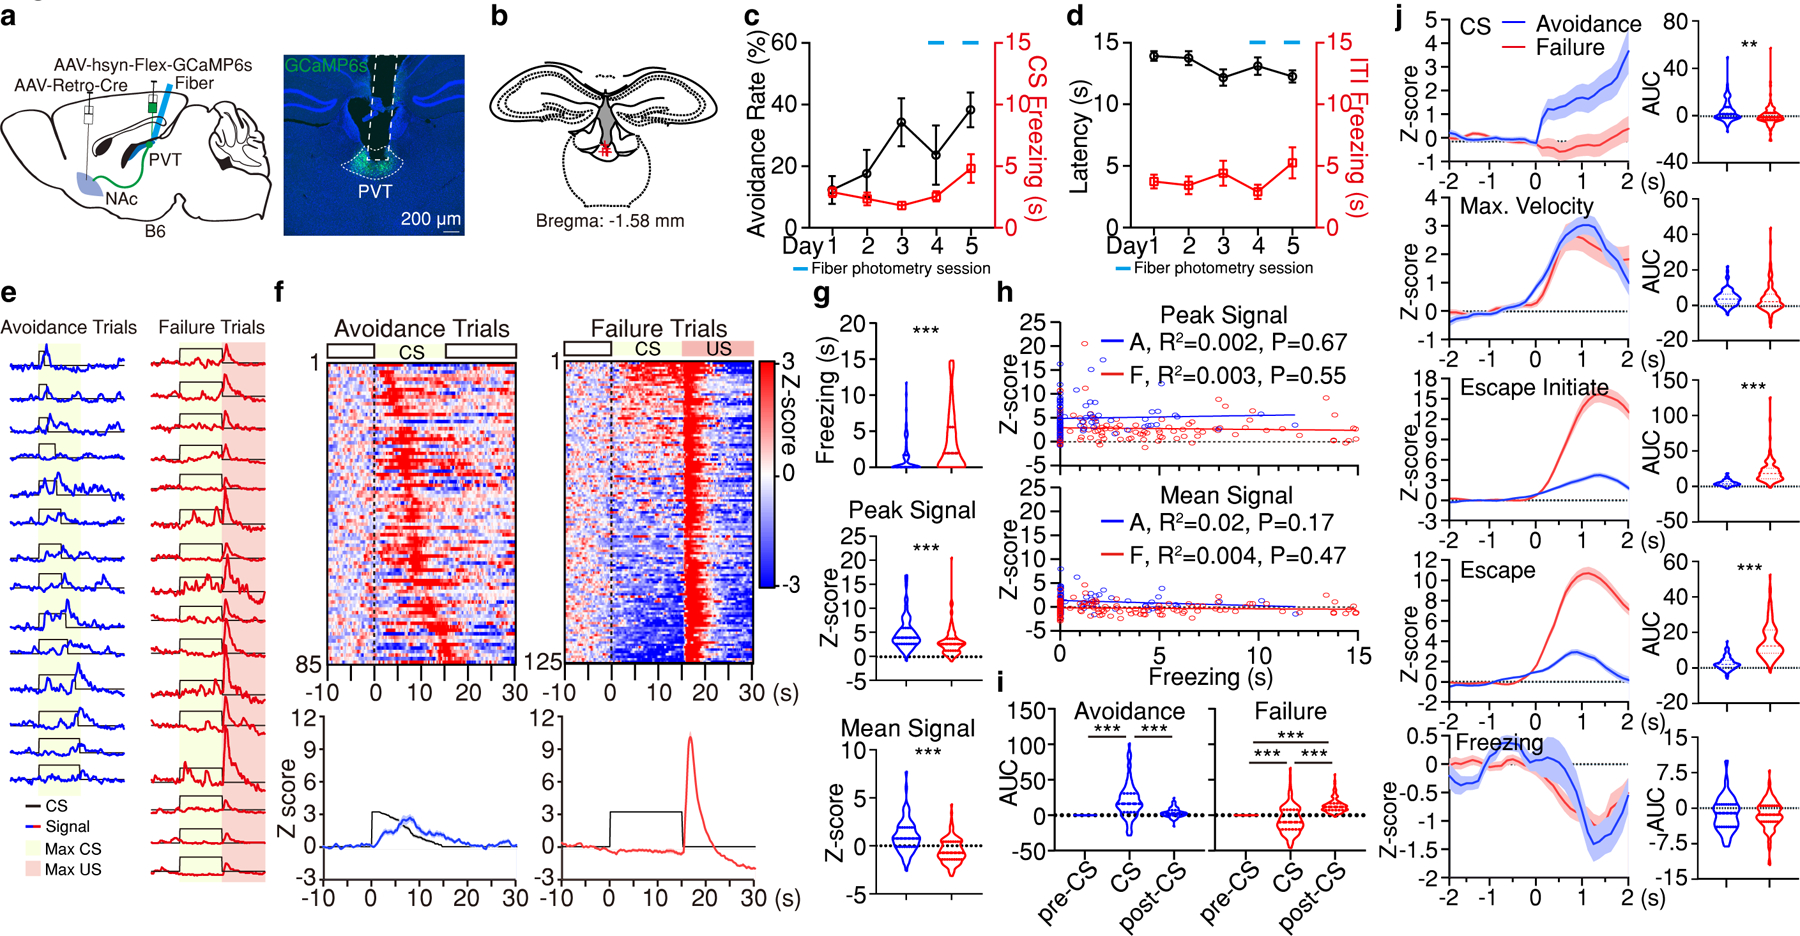
a, Schematic of the experimental approach for fiber photometry imaging from pPVT–NAc neurons. b, Fiber placements (n = 5 mice). c, Avoidance Rate and CS freezing across training and imaging sessions. d, Latency to avoid and ITI freezing for data in (c). e, Representative imaging traces from sample subject. f, Top: Heatmaps of calcium responses for avoidance and failure trials. Bottom: Average calcium signal and CS duration. g, Freezing, Peak, and Mean Signal during the CS for each trial type. Two-tailed Student’s t-test. Avoidance, n = 85 Trials. Failure, n = 125 Trials. Freezing, ***P < 0.001; Peak Signal, ***P < 0.001; Mean Signal, ***P < 0.001. h, Linear regression of peak (top) and mean calcium signal (bottom) as a function of freezing time during the CS of avoidance and failure trials. i, Quantification of calcium signal during pre-CS, CS and post-CS periods for avoidance and failure trials. AUC, One-way ANOVA followed by two-stage linear step-up procedure of Benjamini, Krieger and Yekutieli. Avoidance: n = 85 Trials, F(2, 252) = 45.22; group comparisons, pre-CS vs CS ***P < 0.001, pre-CS vs post-CS P = 0.11, CS vs post-CS ***P < 0.001. Failure: n = 125 Trials, F(2, 372) = 81.81; group comparisons, ***P < 0.001. j, Left: Average calcium responses during CS onset, CS maximal velocity, escape initiation, escape and CS freezing epochs for all avoidance and failure trials. Right: Quantification of calcium signal in each epoch duration. AUC, two-tailed Student’s t-test. CS: Avoidance, n = 85 Events; Failure, n = 125 Events; **P = 0.002. Max. Velocity: Avoidance, n = 85 Events; Failure, n = 125 Events. Escape initiate: Avoidance, n = 82 Events; Failure, n = 116 Events; ***P < 0.001. Escape: Avoidance, n = 85 Events; Failure, n = 125 Events; ***P < 0.001. Freezing: Avoidance, n = 76 Events; Failure, n = 169 Events. All data in figure shown as mean ± s.e.m.
Next, to investigate whether activation of pPVT–NAc projections is critical for active avoidance, we optogenetically inhibited pPVTD2R–NAc projections bilaterally using Halo in a cohort of mice displaying robust avoidance behavior following training (>70% initial avoidance rate; See Methods) (Fig. 5a-c). Similar to the experiment described above, following 2AA training (Fig. 5d-g) mice were subjected to three test sessions (Test Days 1–3), and on Test Day 2 light stimulation was delivered through optical fibers to silence pPVTD2R–NAc communication during CS presentations. Unlike in control subjects, light stimulation in Halo-expressing mice significantly decreased avoidance rate and increased the latency to avoid (Fig. 5h, i). In addition, these mice showed a concomitant increase in CS-evoked freezing on Test Day 2 (Fig. 5j, k). Importantly, pairwise comparison of light-evoked changes in freezing and avoidance behavior across test sessions revealed an inverse relationship between these two parameters (Fig. 5l). Together, these results demonstrate that silencing pPVTD2R–NAc communication biases defensive behavioral responses towards passive coping strategies. Notably, this effect is independent of the post-training avoidance rate, because similar observations were made in a cohort of mice in which the initial avoidance rate was markedly lower (Extended Data Fig. 5a-k). Moreover, our observation that optogenetic inhibition of pPVT–NAc projections on Test Day 2 lead to lasting behavioral effects on Test Day 3, indicates a potential role for this projection in the formation of persistent associations between fear cues and specific coping strategies. Finally, restricting optogenetic inhibition of pPVT–NAc projections to the ITI did not significantly alter behavior (Extended Data Fig. 5l-o). Similarly, as with pPVTD2R neurons, we did not observe any light stimulation-induced effect on locomotion (Extended Data Fig. 5p).
Figure 5. Optogenetic inhibition of pPVTD2R–NAc axon terminals decreases active avoidance and increases freezing.
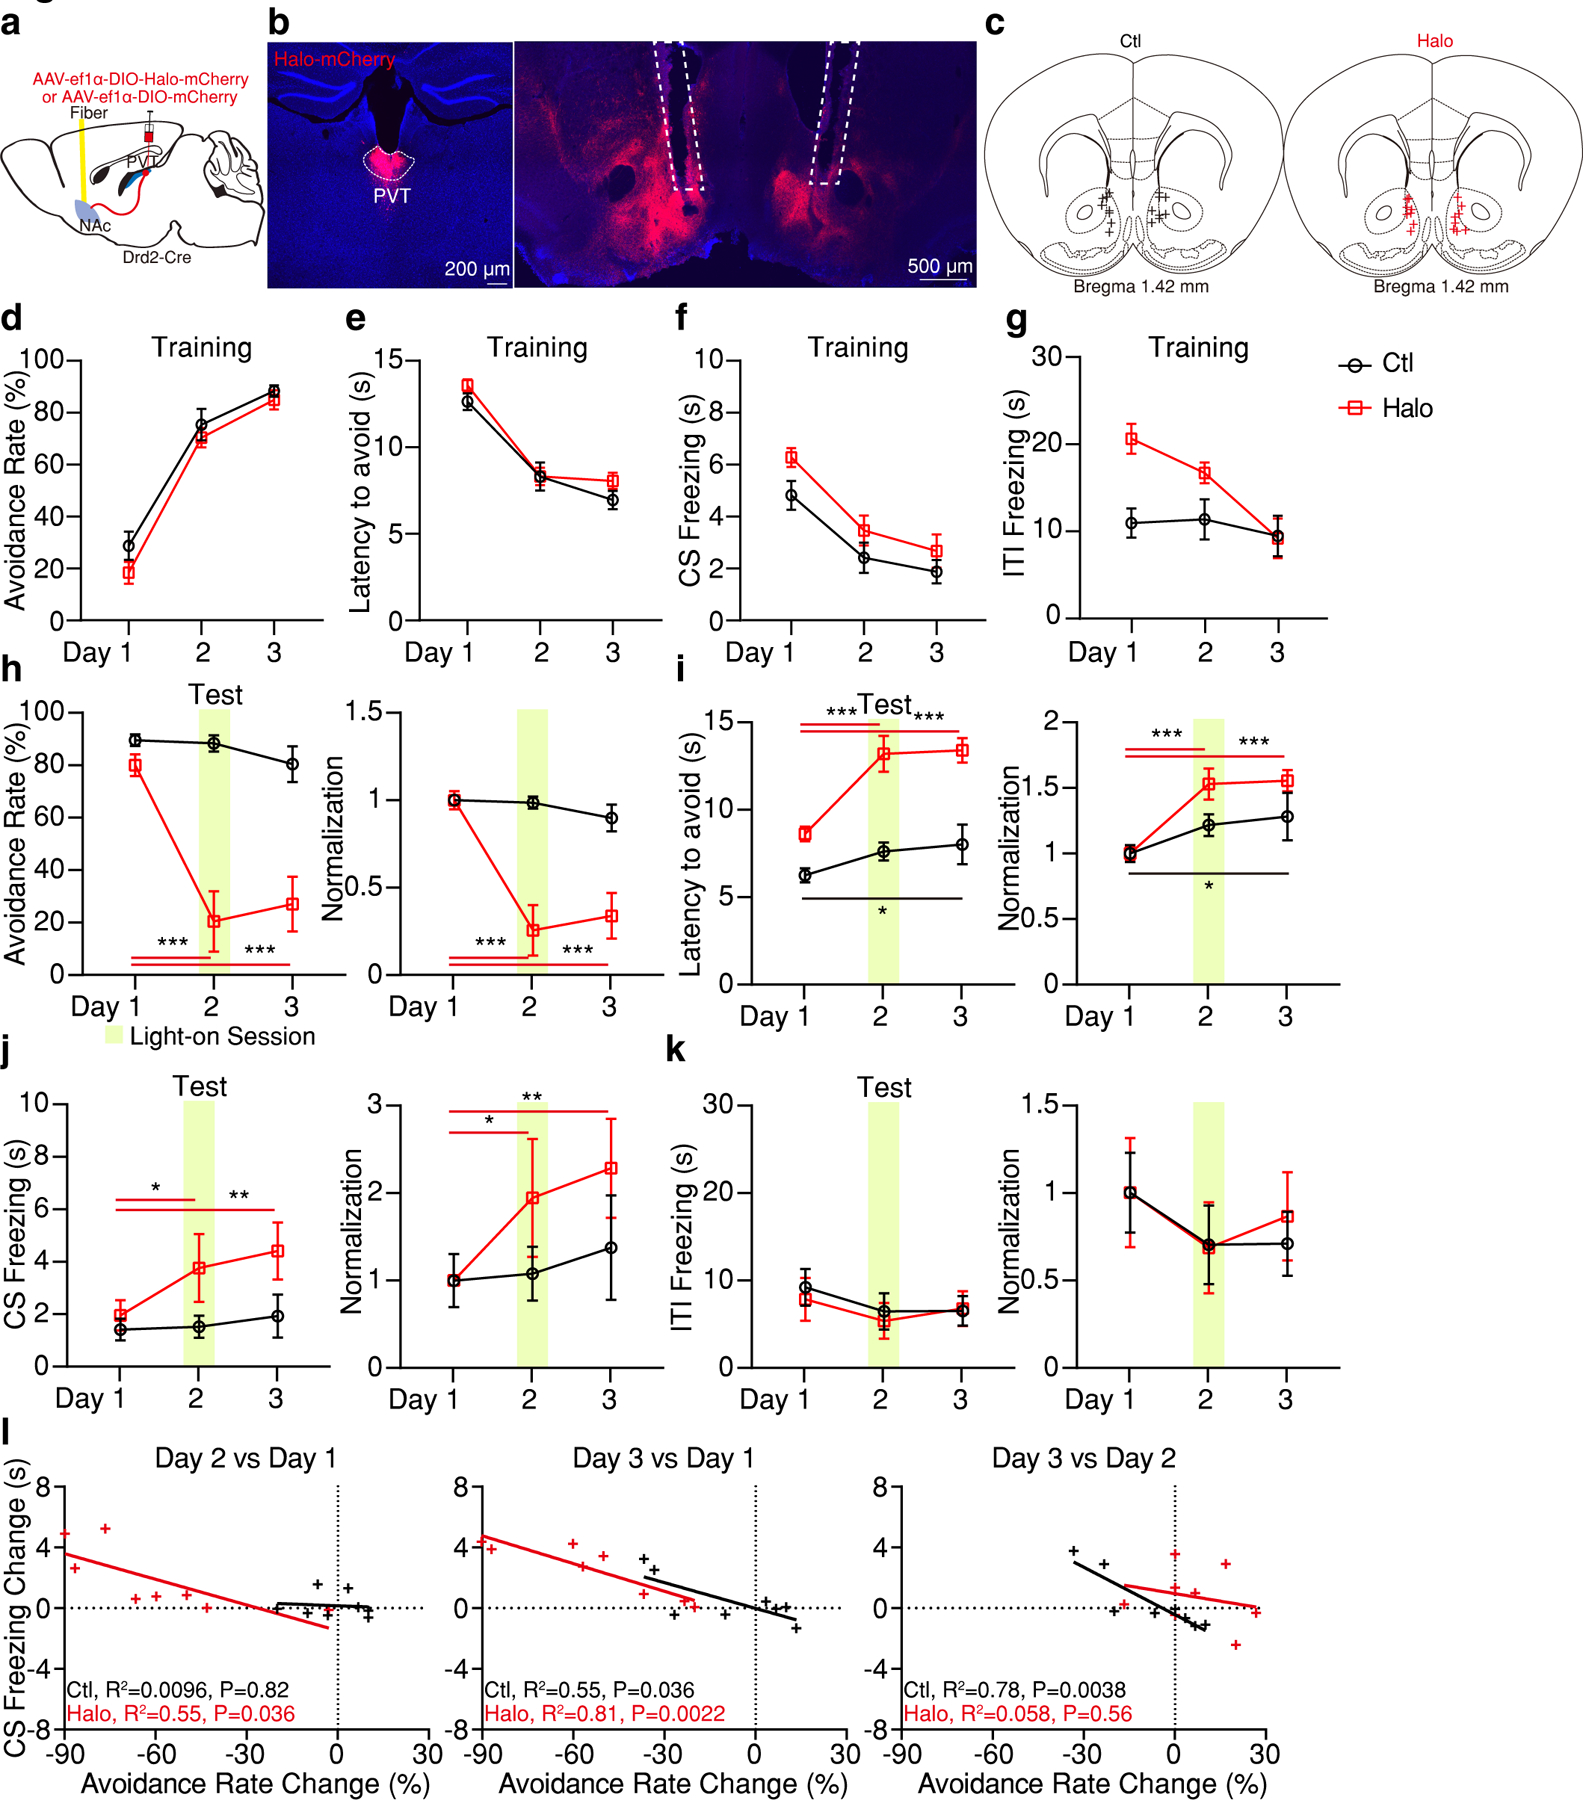
a, Schematic of the viral vector strategy and optical fiber placement for optogenetic silencing of pPVTD2R–NAc axon terminals in the 2AA task. b, Representative images from a mouse expressing Halo-mCherry in pPVTD2R neurons (left) and implanted with optical fibers in the NAc (right). c, Fiber placements (n = 8 mice per group). d-g, Avoidance rate (d), latency to avoid (e), freezing time during the CS (f) and ITI freezing (g) across all training sessions for both Ctl and Halo groups. h-k, Left: Optogenetic inhibition of pPVTD2R–NAc axon terminals persistently decreases avoidance rate (h), while increases latency to avoid (i) and freezing time during the CS (j) but has little effect on freezing time during the the ITI (k). Right: Normalization to Day 1 for each group. Two-way ANOVA followed by two-stage linear step-up procedure of Benjamini, Krieger and Yekutieli. Avoidance rate: F(2, 28) = 18.04; group comparisons, Halo, Day 1 vs Day 2 ***P < 0.001, Day 1 vs Day 3 ***P < 0.001. Latency to avoid: F(2, 28) = 5.63; group comparisons, Ctl, Day 1 vs Day 3 *P = 0.028; Halo, Day 1 vs Day 2 ***P < 0.001, Day 1 vs Day 3 ***P < 0.001. CS freezing: F(2, 28) = 1.45; group comparisons, Halo, Day 1 vs Day 2 *P = 0.049, Day 1 vs Day 3 **P = 0.0092. ITI freezing: F(2, 28) = 0.149. l, Linear regression of the changes in freezing behavior across test sessions as a function of changes in avoidance behavior. All data in figure shown as mean ± s.e.m.
pPVT–CeA projections signal failure to avoid
As described above, pPVTD2R neurons that project to the NAc are mostly distinct from those that project to the CeA (Fig. 1)25. However, these anatomical differences do not necessarily imply that functional distinctions exist between the two efferent pathways. Thus, to investigate how pPVTD2R–CeA projections are modulated in the 2AA task, we expressed GCaMP7s in pPVTD2R neurons of Drd2-Cre mice and implanted an optical fiber unilaterally in the CeA to measure the activity of pPVTD2R–CeA projections with fiber photometry (Fig. 6a-d). These experiments showed that unlike pPVTD2R–NAc terminals, pPVTD2R–CeA projections are not positively modulated by avoidance (Fig. 6e-j). Surprisingly, CS-evoked freezing behavior was not associated with significant changes in GCaMP7s fluorescence (Fig. 6j). In contrast, pPVTD2R–CeA neurons were predominantly active during failure trials (Fig. 6g, j), suggesting a link between engagement of pPVTD2R–CeA projections and failure to avoid. Notably, previous studies have linked pPVT–CeA communication to the expression of conditioned fear – where Pavlovian reactions dominate behavior12,22. Altogether, these findings suggest the existence of functional differences between pPVTD2R–CeA and pPVTD2R–NAc projections, with the activity of pPVTD2R–CeA projections increasing during failures (when freezing dominates [Fig. 6g]).
Figure 6. Fiber photometry imaging of GCaMP7s fluorescence from the CeA terminals of pPVTD2R neurons in the 2AA task.
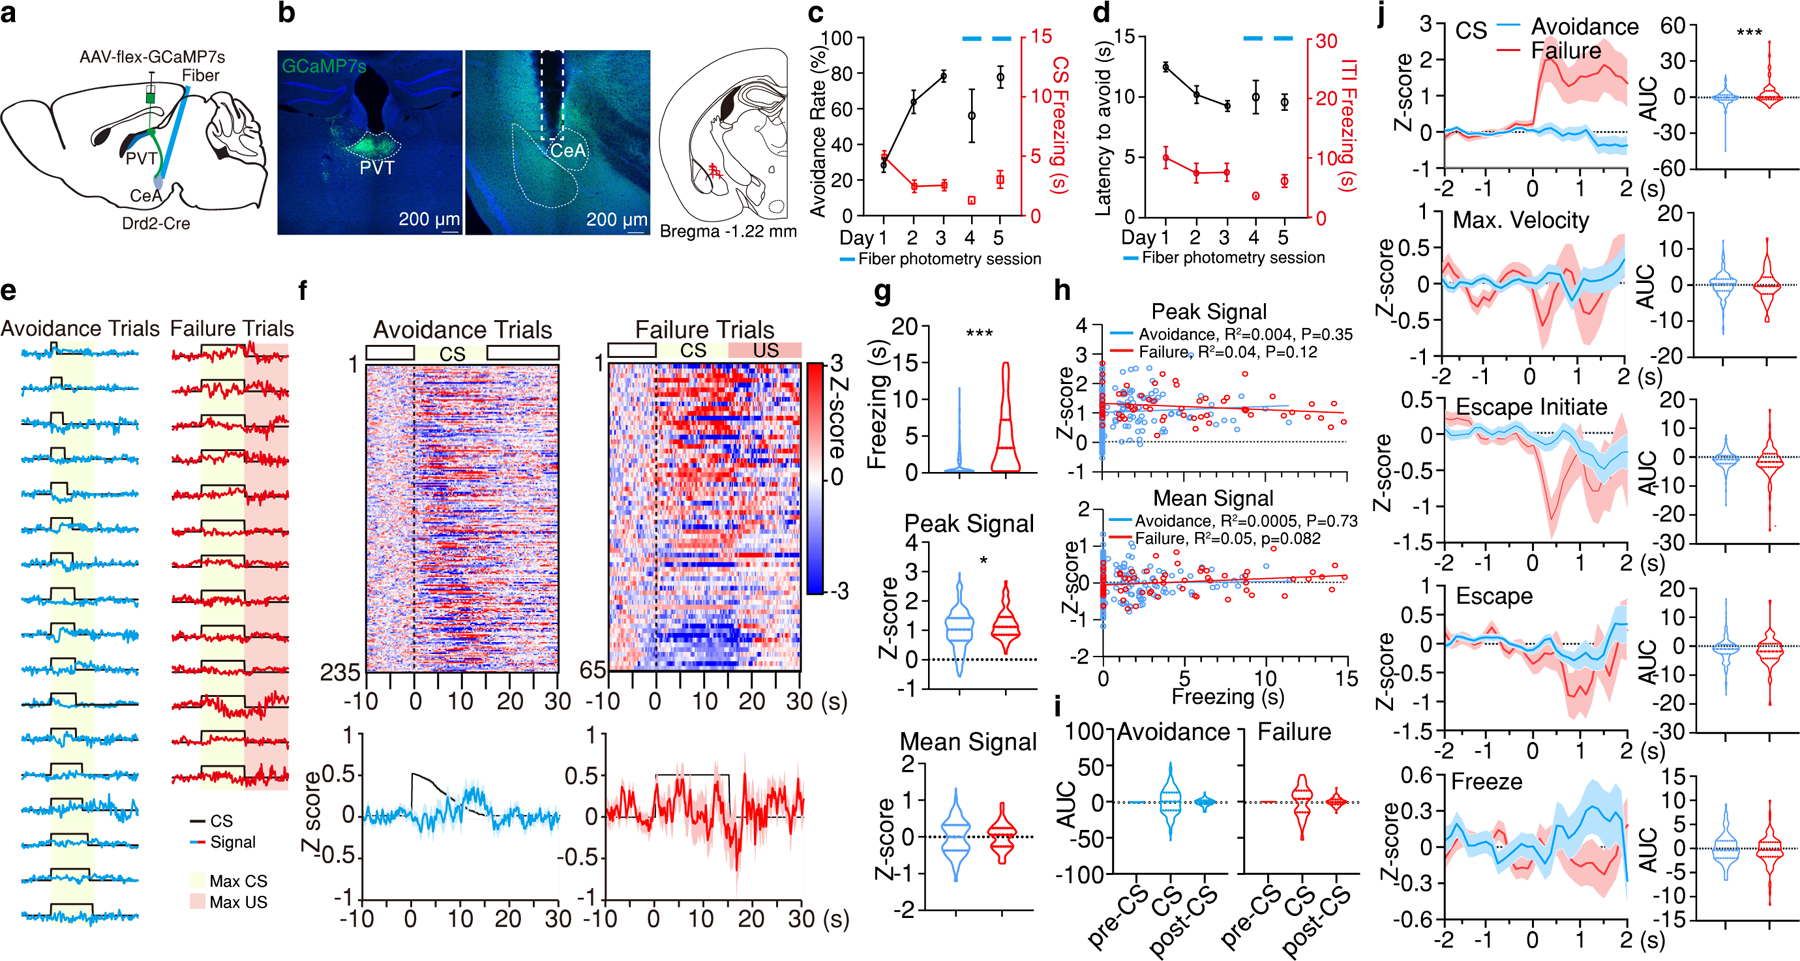
a, Schematic of the experimental approach for fiber photometry imaging pPVT–CeA terminals. b, Left: Representative images of GCaMP7s expression and fiber placement. Right: Fiber placements (right, n = 5 mice). c, Avoidance Rate and CS freezing across training and imaging sessions. d, Latency to avoid and ITI freezing for data in (c). e, Representative imaging traces from sample subject. f, Top: Heatmaps of calcium responses for avoidance and failure trials. Bottom: Average calcium signal and CS duration. g, Freezing, Peak, and Mean Signal during the CS for each trial type. Two-tailed Student’s t-test. Avoidance, n = 235 Trials. Failure, n = 65 Trials. Freezing, ***P < 0.001. Peak Signal, *P = 0.026. h, Linear regression of peak (top) and mean calcium signal (bottom) as a function of freezing time during the CS of avoidance and failure trials. i, Quantification of calcium signal during pre-CS, CS and post-CS periods for avoidance and failure trials. AUC, One-way ANOVA followed by two-stage linear step-up procedure of Benjamini, Krieger and Yekutieli. Avoidance, n = 235 Trials, F(2, 702) = 1; Failure, n = 65 Trials, F(2, 192) = 0.025; group comparisons, non-significant. j, Left: Average calcium responses during CS onset, CS maximal velocity, escape initiation, escape and CS freezing epochs for all avoidance and failure trials. Right: Quantification of calcium signal for each event on the left. AUC, two-tailed Student’s t-test. CS: Avoidance, n = 235 Events; Failure, n = 65 Events; ***P < 0.001. Max. Velocity: Avoidance, n = 234 Events; Failure, n = 62 Events. Escape initiate: Avoidance, n = 173 Events; Failure, n = 101 Events. Escape: Avoidance, n = 234 Events; Failure, n = 65 Events. Freezing: Avoidance, n = 100 Events; Failure, n = 116 Events. All data in figure shown as mean ± s.e.m.
pPVT–CeA projections inhibit active avoidance
Previous reports demonstrated that active avoidance is under negative control by the CeA, which controls Pavlovian reactions16,17. Specifically, these studies showed that blocking protein synthesis in the CeA promotes active avoidance17, whereas CeA lesions can unmask avoidance behavior in animals that initially fail to avoid after 2AA training16. A major conclusion drawn from these studies is that CeA-driven Pavlovian reactions compete with and thereby prevent the expression of instrumental defensive behaviors. Because pPVT–CeA communication has been previously shown to support conditioned freezing behavior12,22, we hypothesized that attenuating activity in pPVT–CeA projections could boost active avoidance. Consistent with this prediction, optogenetic silencing of pPVT–CeA projections using Halo reduced freezing behavior and promoted avoidance behavior (Extended Data Fig. 6a-k). Notably, this manipulation did not impact behavior when light simulation was restricted to the ITI period (Extended Data Fig. 6l-o). Together, these results suggest that silencing pPVT–CeA communication biases behavior away from passive defensive behavior and in favor of active ones. Similarly, we did not observe any light stimulation-induced effect on locomotion (Extended Data Fig. 6p).
Of note, Halo-mediated silencing of pPVT–CeA projections also promoted active avoidance behavior in a subset of mice that failed to achieve >30% avoidance rate after the third 2AA session (See Methods) (Fig. 7) (Extended Data Fig. 7). Consistent with previous manipulations, the increase in avoidance behavior was accompanied by a reduction in the latency to avoid and a reduction in CS-evoked freezing (Fig. 7h, i). Moreover, pairwise comparisons revealed that, consistent with the idea that in the 2AA task animals switch between Pavlovian and instrumental defensive strategies, increases in active avoidance induced by silencing pPVT–CeA projections were linked to a reduction in freezing behavior (Extended Data Fig. 7c). Altogether, these results suggest that silencing pPVT–CeA communication biases behavior away from freezing and in favor of avoidance.
Figure 7. Optogenetic inhibition pPVTD2R–CeA axon terminals increases active avoidance and reduces freezing.
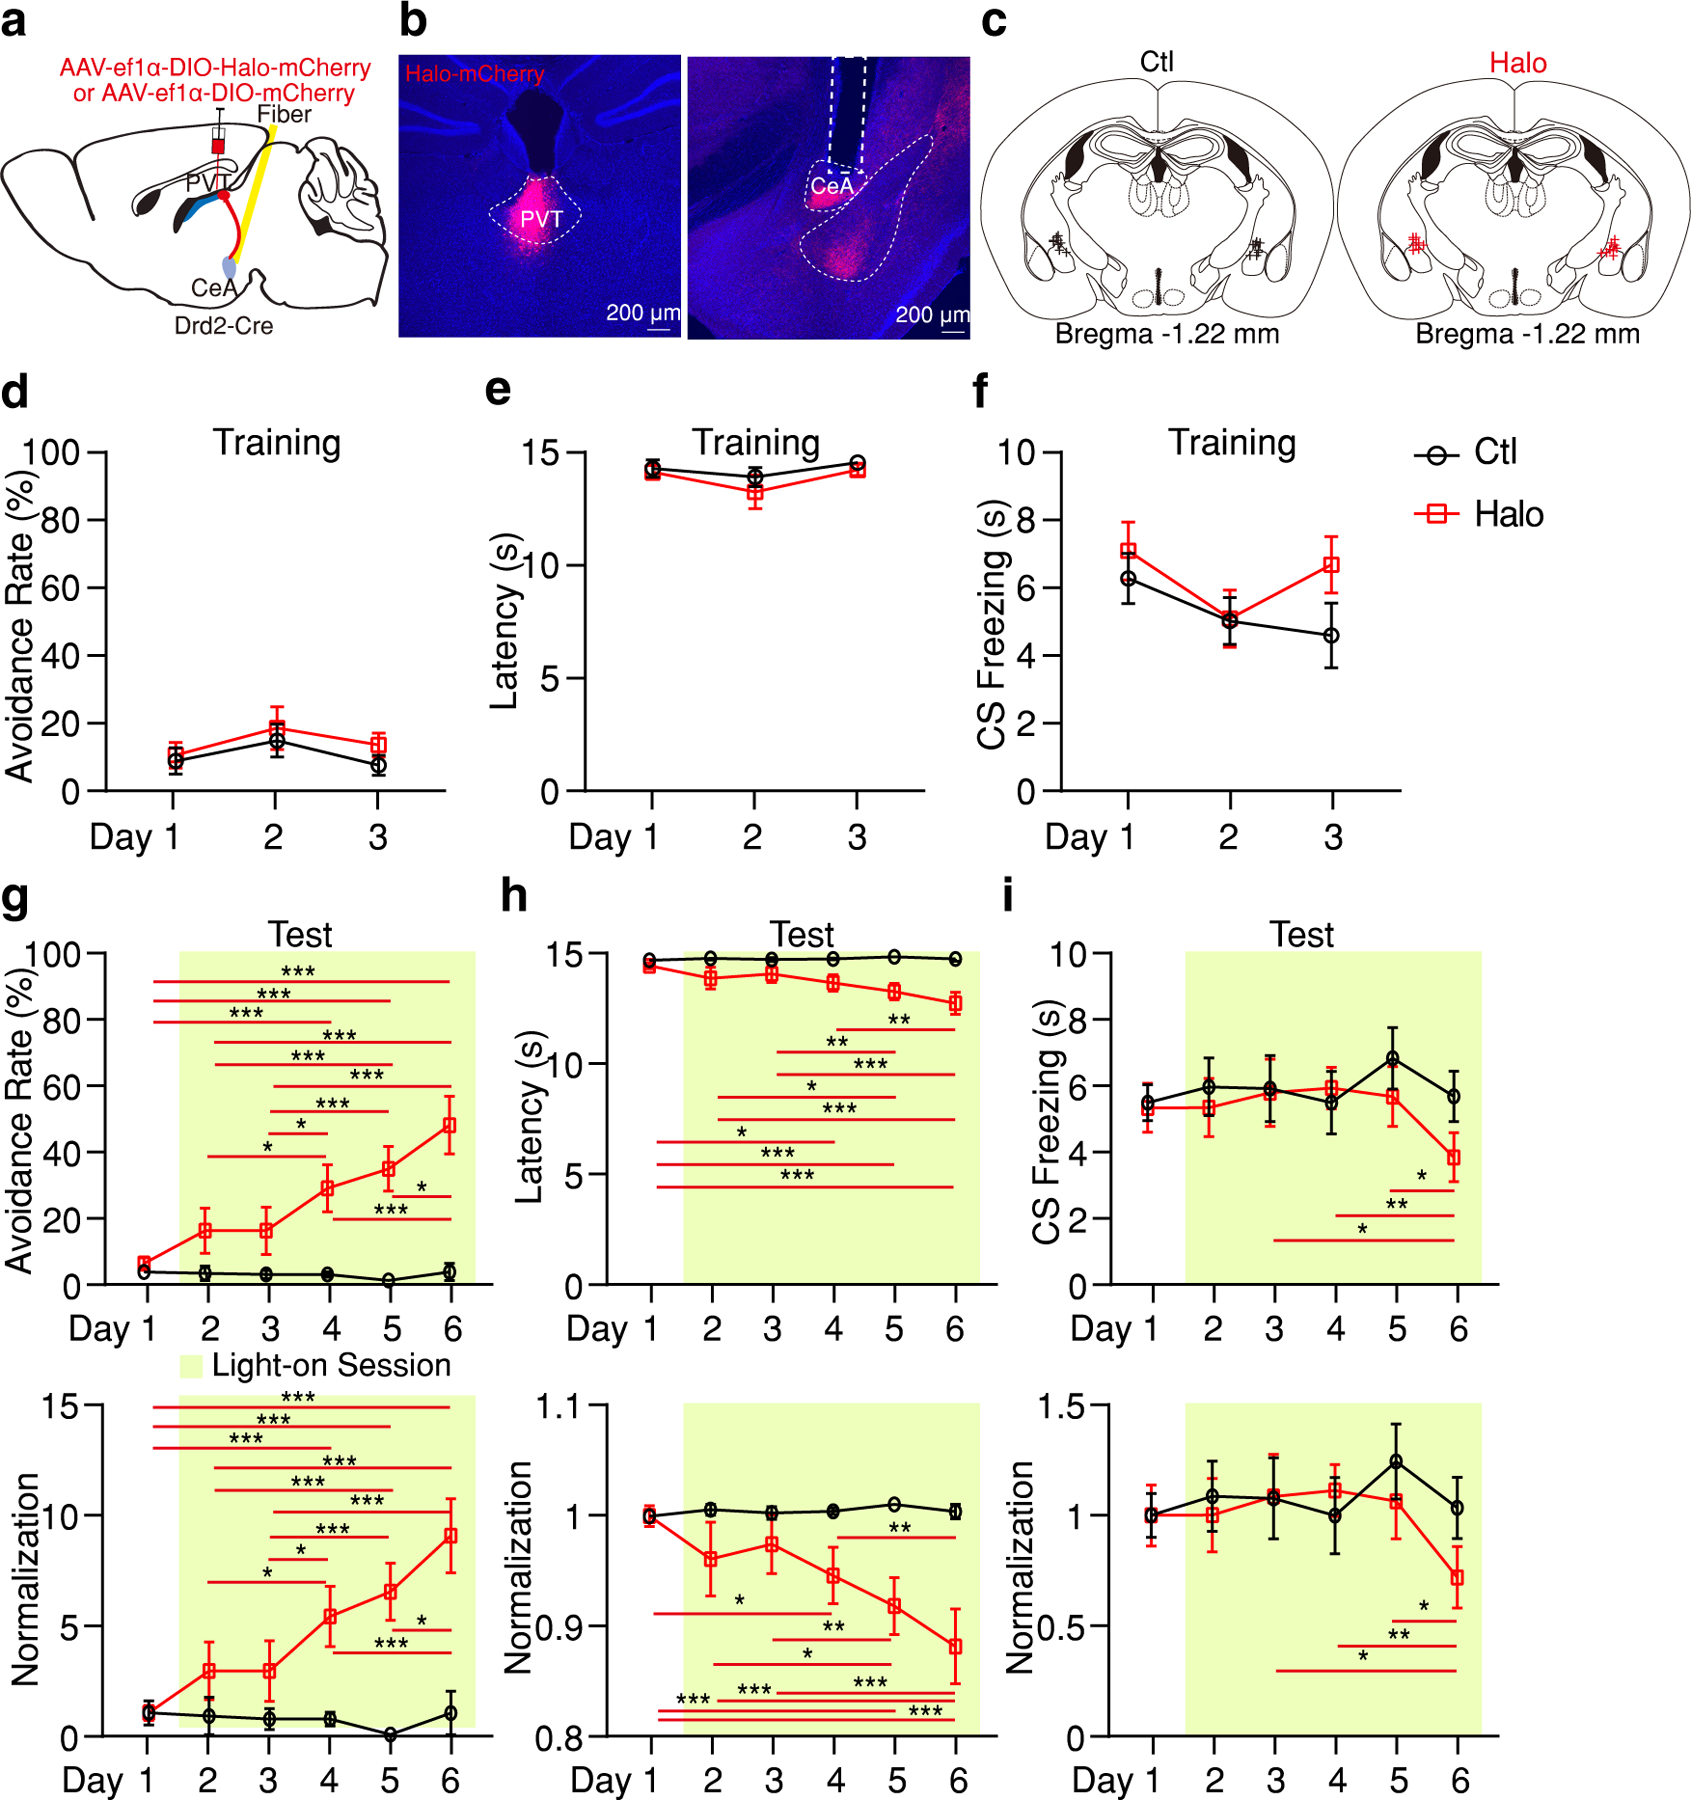
a, Schematic of the viral vector strategy and optical fiber placement used for optogenetic silencing of pPVTD2R–CeA axon terminals. b, Representative images from a mouse expressing Halo-mCherry in pPVTD2R neurons and implanted with optical fibers in the CeA. c, Fiber placements (n = 9 mice per group). d-f, Avoidance rate (d), latency to avoid (e) and freezing time during the CS (f) across all training days in both Ctl and Halo groups. g-i, Top: Avoidance rate (g), latency to avoid (h) and freezing time during the CS (i) during optogenetic inhibition of pPVTD2R–CeA axon terminals. Bottom: Normalization to Day 1 for each group. Two-way ANOVA followed by two-stage linear step-up procedure of Benjamini, Krieger and Yekutieli. Avoidance rate: F(5, 80) = 9.05; group comparisons, Halo, Day 1 vs Day 4 ***P < 0.001, Day 1 vs Day 5 ***P < 0.001, Day 1 vs Day 6 ***P < 0.001, Day 2 vs Day 4 *P = 0.015, Day 2 vs Day 5 ***P < 0.001, Day 2 vs Day 6 ***P < 0.001, Day 3 vs Day 4 *P = 0.015, Day 3 vs Day 5 ***P = 0.0005, Day 3 vs Day 6 ***P < 0.001, Day 4 vs Day 6 ***P < 0.001, Day 5 vs Day 6 *P = 0.012. Latency to avoid: F(5, 80) = 4.52; group comparison, Halo, Day 1 vs Day 4 *P = 0.011, Day 1 vs Day 5 ***P < 0.001, Day 1 vs Day 6 ***P < 0.001, Day 2 vs Day 5 *P = 0.043, Day 2 vs Day 6 ***P = 0.0003, Day 3 vs Day 5 **P = 0.0085, Day 3 vs Day 6 ***P < 0.001, Day 4 vs Day 6 **P = 0.0027. CS freezing: F(5, 80) = 1.17; group comparisons, Halo, Day 3 vs Day 6 *P = 0.012, Day 4 vs Day 6 **P = 0.007, Day 5 vs Day 6 *P = 0.018. All data in figure shown as mean ± s.e.m.
Our collective observations indicate that task-related activity within the pPVT–NAc or the pPVT–CeA pathway biases defensive behavior towards active or passive responses, respectively. To investigate whether artificial stimulation of either pathway can generate behavioral bias, we expressed the red-shifted channelrhodopsin-2 variant ChimsonR in pPVTD2R neurons and implanted optical fibers bilaterally over the NAc or the CeA. Consistent with our model, we observed that while optogenetic stimulation of pPVT–NAc terminals potentiated avoidance behavior, stimulation of pPVT–CeA projections reduced it (Extended Data Fig. 8). These results lend further support to our conclusion that divergent projections of the pPVT mediate the selection of opposing defensive behaviors.
pPVT flexibly control the selection of defensive behaviors
A recurrent theme in our reported observations is the idea the pPVT projections to the NAc and the CeA can bias the selection of passive and active defensive behaviors. But whether these projections flexibly control defensive behavior is unclear. To assess this, we selectively silenced pPVT projections to the NAc and the CeA in the same subjects across two test sessions (Fig. 8) (Extended Data Fig. 9). Notably, we found that while silencing pPVT–NAc projections impaired avoidance behavior (consistent with the above results), inhibition of pPVT–CeA terminals the following day fully restored active avoidance (Fig. 8e, f). Interestingly, an opposing but similarly dynamic modulation of freezing behavior was observed across sessions (Fig. 8g) (Extended Data Fig. 9d). In conclusion, these data demonstrate that the pPVT can flexibly bias defensive behaviors via projections to NAc and CeA. Future studies should aim at identifying the local circuit dynamics and upstream mechanisms that guide or determine which type of defensive response is selected. As a start, using monosynaptic rabies tracing, we identified regions of the mouse brain that preferentially innervate pPVT–CeA or pPVT–NAc neurons (Extended Data Fig. 10).
Figure 8. pPVTD2R projections to the NAc and the CeA flexibly bias the selection of defensive behaviors.
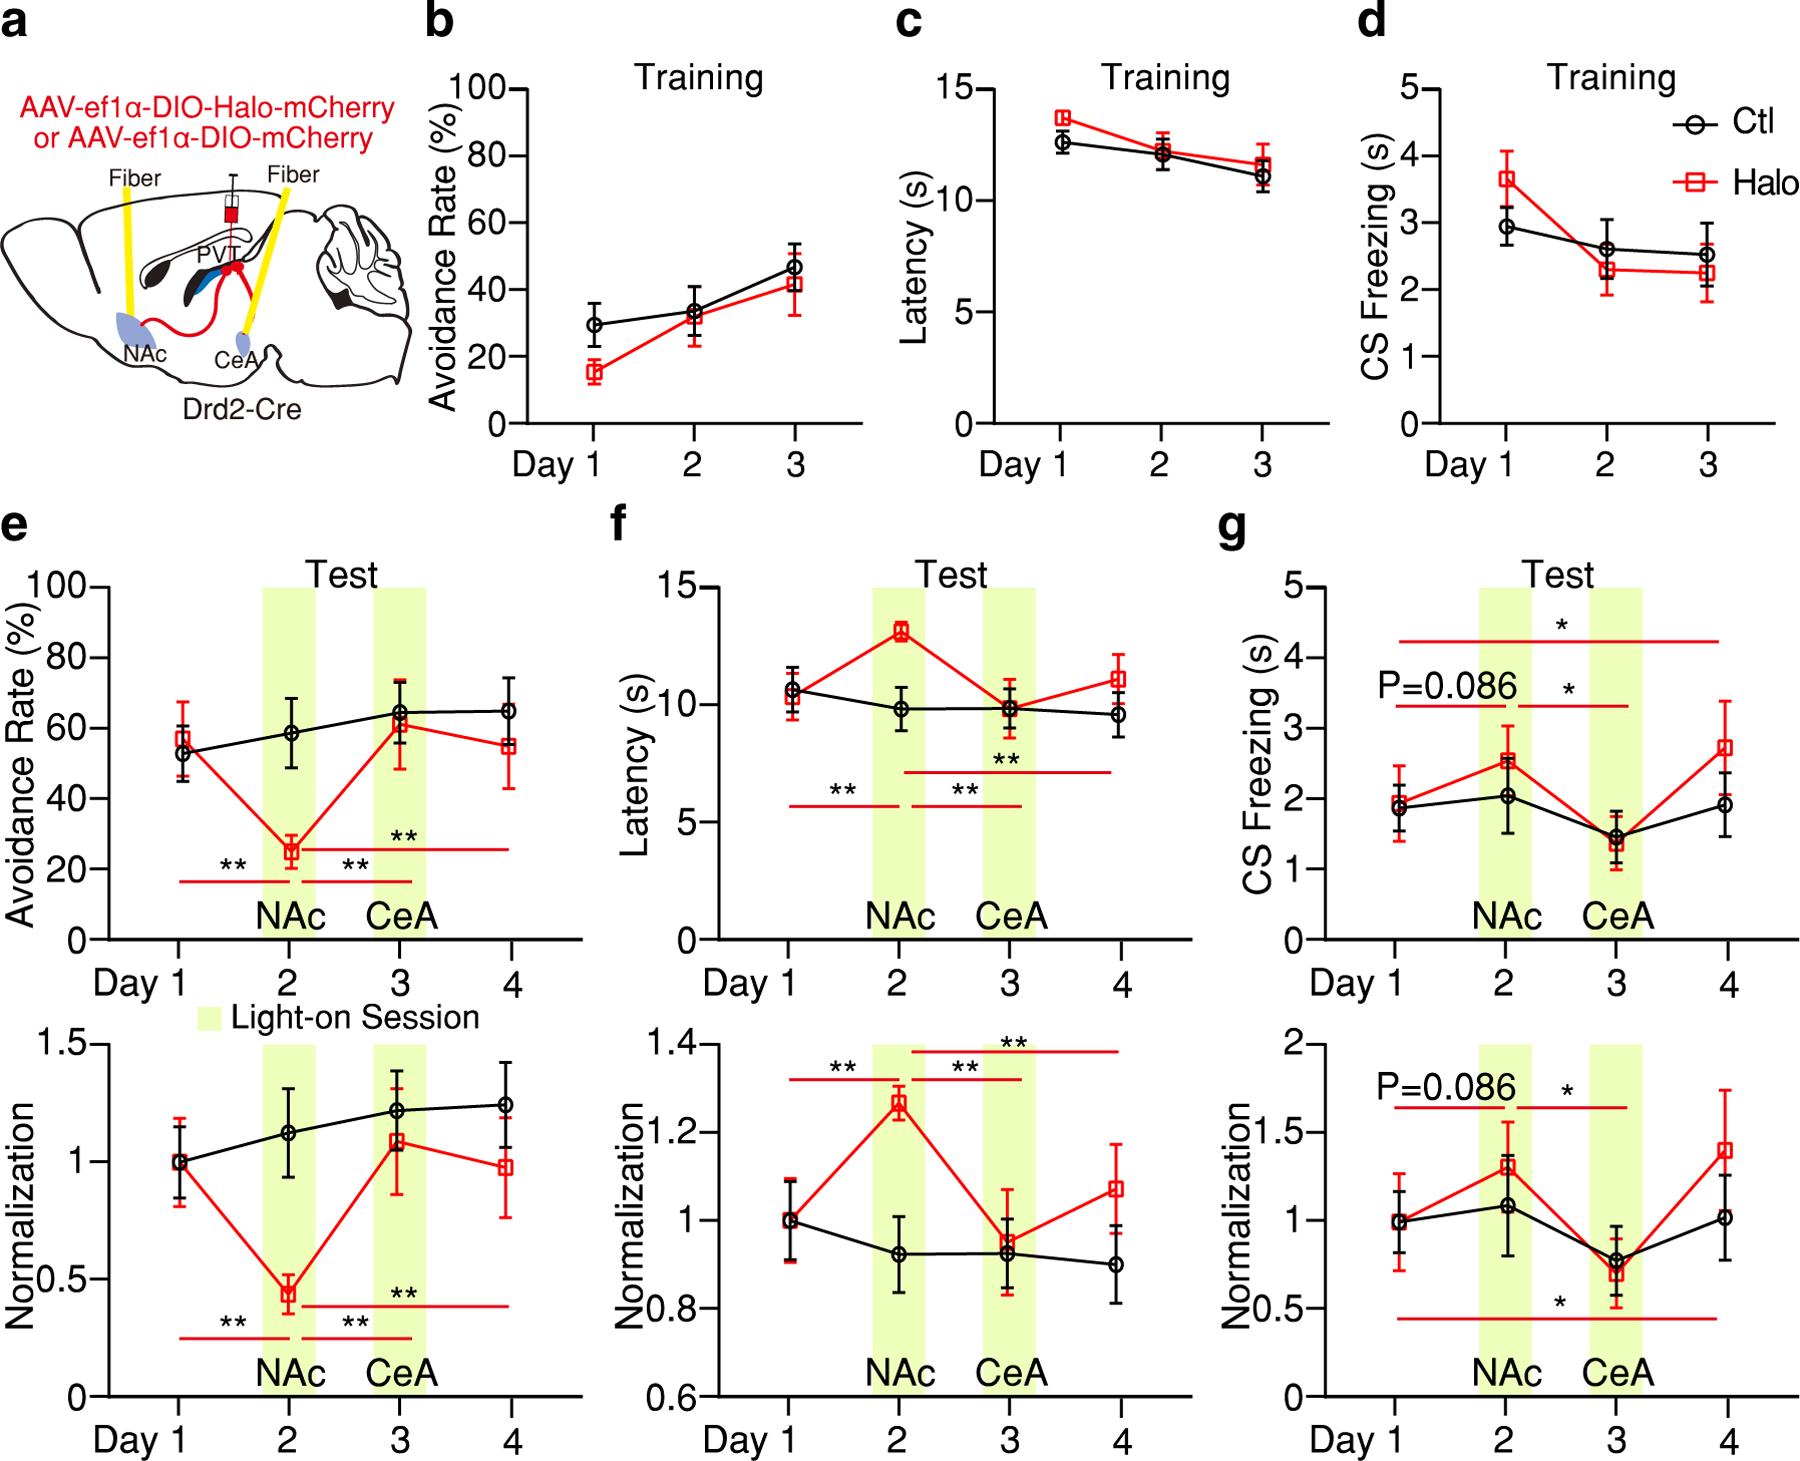
a, Schematic of the viral vector strategy and optical fiber placement for optogenetic silencing of pPVTD2R–NAc or pPVTD2R–CeA axon terminals in the same subject. b-d, Avoidance rate (b), latency to avoid (c) and freezing time during the CS (d) across all training sessions for both Ctl and Halo groups (n = 8 mice per group). e-g, Top: Optogenetic inhibition of pPVTD2R–NAc axon terminals (Day 2) decreases avoidance rate (e), increases latency to avoid (f) and freezing time during the CS (g), while following optogenetic inhibition of pPVTD2R–CeA axon terminals (Day 3) reverses these changes. Bottom: Normalization to Day 1 for each group. Two-way ANOVA followed by two-stage linear step-up procedure of Benjamini, Krieger and Yekutieli. Avoidance rate: F(3, 42) = 6.09; group comparisons, Halo, Day 1 vs Day 2 **P = 0.0017, Day 2 vs Day 3 ** P= 0.0072, Day 2 vs Day 4 **P = 0.0078. Latency to avoid: F(3, 42) = 5.56; group comparisons, Halo, Day 1 vs Day 2 **P = 0.0029, Day 2 vs Day 3 *P = 0.012, Day 2 vs Day 4 *P = 0.02. CS freezing: F(3, 42) = 0.74; group comparisons, Halo, Day 1 vs Day 2 P = 0.086, Day 1 vs Day 4 *P = 0.013, Day 2 vs Day 3 *P = 0.043. All data in figure shown as mean ± s.e.m.
DISCUSSION
In the present study, we have identified the pPVT as a key brain structure that mediates the selection of competing defensive strategies, namely Pavlovian freezing and instrumental behavior. These findings add to a growing body of literature that places the PVT as an important regulator of emotional and motivational processes31,32. Importantly, we uncovered that the anatomical and functional segregation of PVT projections to the CeA and the NAc underscores its role in biasing behavioral selection. Collectively, these findings expand on previous studies linking PVT function to passive defensive responses12,22,28,33, provide a circuit mechanism by which opposing defensive strategies are leveraged8, and support the notion that the PVT is critical for the orchestration of adaptive behavioral responses32,34,35.
Recent literature shows that the pPVT is predominantly sensitive to aversive stimuli28,29. In turn, the pPVT appears to orchestrate adaptive responses that allow animals to cope with ongoing demands36. Consistent with this view and in addition to its role in driving Pavlovian defensive reactions, the pPVT is now recognized to promote goal-directed instrumental responses including food seeking, drug seeking and maternal behaviors37–41. Importantly, some of these studies have directly implicated NAc projections of the pPVT as guiding instrumental behaviors during aversive states38–43. In light of these recent reports, our finding that the pPVT–NAc pathway also regulates instrumental defensive behaviors suggests that these projections may generally promote goal-directed behaviors. From this perspective, the pPVT–CeA pathway could support behavioral strategies that favor Pavlovian responding irrespective of whether responses are reward oriented or defensive in nature36. Accordingly, it was recently proposed that pPVT–CeA projections drive morphine-induced conditioned place preference likely through Pavlovian incentive motivation44.
The pPVT is not the only brain region that innervates both the NAc and the CeA. Indeed, the BLA and the insular cortex also send divergent projection to these structures and these projections have been implicated in emotional and motivational processes14,19,45–47. Particularly relevant to the present study is the notion that the BLA has been shown to contribute to both conditioned freezing and active avoidance behavior via its projections to the CeA and the NAc, respectively. This leads to the question of what the differential contributions of the BLA and the PVT are to these opposing defensive behaviors. One possibility discussed earlier in this manuscript is that the BLA’s contribution to conditioned passive and active defensive behaviors decreases over time20–22. As such the PVT may increasingly become the dominant pathway by which freezing and active avoidance behaviors are regulated. Alternatively, and possibly in addition to this time-dependent role, the PVT may serve to contextualize aversive memories by integrating these with information about internal state (owing to its strong innervation by the hypothalamus and the brainstem). Consistent with this idea, the PVT has been recently proposed to arbiter amid motivational conflicts32. Future studies should aim to identify the precise mechanisms by which the PVT regulates behavior and how these differ from those of other regions known to regulate the same behaviors.
Emergent studies support the notion that the neuronal circuits of the PVT are functionally diverse31. Indeed, we recently identified two major classes of PVT neurons that can be distinguished on the basis of genetic, anatomic (connectional) and functional differences29. Specifically, it was suggested that PVT neuronal subtypes could be identified by their expression, or lack thereof, of the Drd2 gene (and D2R protein). Functionally, compared to D2R-negative PVT neurons which at the population level appear to be modulated by stimulus salience, D2R-expressing neurons are primarily sensitive to aversive stimuli28,29. Our results expand on this recent report by showing further anatomical and functional heterogeneity among aversive-sensitive pPVTD2R neurons.
It is important to note that non-D2R-expressing PVT neurons also project to the NAc and the amygdala29. Yet the contributions of these parallel projections (and how they differ to those of D2R-expressing neurons) to defensive behaviors remain unaddressed. Our findings should encourage future studies to classify PVT neurons based on the intersection of genetic markers and projection target31, an approach that has led to the discovery of functional segregation in other brain areas48–52. In addition, implementing imaging techniques with cellular resolution should facilitate the identification of functionally distinct PVT cell types that may have remained undetected in our experiments using bulk imaging approaches from projection-defined neurons.
The observation that optogenetic inhibition of pPVT–NAc projections leads to lasting reductions in active avoidance behavior is reminiscent of a previous report demonstrating that silencing pPVT–CeA projections produces similar lasting effects in freezing behavior during fear memory retrieval22. In that study, the authors concluded that the persistent reduction in freezing behavior indicated an overall role for this pathway in controlling the maintenance of fear memories. Our findings are at odds with this interpretation. Specifically, we found that although silencing of pPVT–NAc projections reduced active avoidance, it led to a concomitant increase in CS-evoked freezing. As such, our findings do not support a conclusion in which persistent reductions in avoidance behavior resulting from pPVT–NAc silencing are due to deficits in fear memory maintenance. Instead, in light of this previous report and our collective findings, we propose that the activation of pPVT projections to the NAc and the CeA links fear (CS/US) associations to the selection of specific defensive strategies. As such, our findings help remodel current views on the role that the PVT plays in the formation and maintenance of aversive memories. Subsequent studies in this topic should aim at identifying the local and upstream circuit mechanisms that promote behavioral bias.
A major focus of the present study was to uncover the neural circuit mechanisms by which animals switch between two opposing defensive behaviors: freezing and active avoidance. In nature, animals typically engage in these different defensive behaviors as a function of threat imminence8–10. From this perspective, active avoidance is thought to have evolved as a way to deal with temporally and spatially distant threats (pre-encounter)53, whereas freezing behavior and other reactive responses such as flight mostly emerge during highly imminent threats (post-encounter and circa-strike)10. Within this framework, the idea that the 2AA task yields a subset of animals that fail to engage in avoidance behavior (low avoiders) may seem to suggest that this task is not suitable for studying ethologically relevant defensive strategies. However, a potential explanation for the variability in behavioral outcome observed with the current task, particularly the low avoider phenotype, could be that due to the short duration of the CS (15 s) some animals view the threat (US) as highly imminent and thus display freezing behavior when avoidance is possible. Consistent with this notion, a recent study demonstrated that reducing threat imminence by increasing the duration of the CS virtually eliminates low avoiders53. This study underscores the notion that parameters of the 2AA task (including CS and ITI duration) can be optimized to mimic naturalistic differences in threat imminence. In the current study we exploited individual differences in animal performance that are harnessed by standard 2AA protocols to obtain information about the mechanisms that mediate switches in defensive behavior strategy. We predict that the circuit mechanisms described in our study for biasing the selection of opposing defensive behaviors mirror those engaged when animals switch defensive strategies as a function of threat imminence. Developing ethologically relevant behavioral models in which animals engage in both pre-encounter (active) and post-encounter reactive defensive modes (e.g., freezing) with varying degrees of threat imminence would allow for further exploring the neurobiology of defensive behavior selection. Of note, ethologically relevant behavioral tasks have been recently developed to assess transitions between post-encounter and circa-strike elicited defense54.
[Au: please add some more general discussion (probably at the start of this paragraph) about the limitation of the shuttle-box paradigm in terms of studying selection of optimal behavioural strategies depending on context and how that relates to the interpretation of the findings of this study. This can be brief but needs to be included in the current Discussion, as it was recommended by both referee #1 and Nature referee #2 as a solution to the deadlock w.r.t. the comments by Nature referee #3 (= NN referee #2).]
Data Availability
All the data that support the findings presented in this study are available from the corresponding author upon reasonable request. Source Data are provided with this paper, and are publicly available at the following repository: https://github.com/Penzolab/Source-Data-07092021.git.
Code Availability
R code used to analyze active avoidance behavior and photometric signal is available at the following repository: https://github.com/Penzolab/Data-analysis-of-Two-way-active-avoidance-task.git.
METHODS
Mice
All procedures were performed in accordance with the Guide for the Care and Use of Laboratory Animals and were approved by the National Institute of Mental Health (NIMH) Animal Care and Use Committee. Mice used in this study were group housed under a 12-h light-dark cycle (6 a.m. to 6 p.m. light), at temperature of 70–74 °F and 40–65% humidity, with food and water available ad libitum. After surgery, mice were singly housed. Drd2-Cre mice were obtained from GENSAT (founder line ER44). In addition, we used C57BL/6NJ strain mice (The Jackson Laboratory). Both male and female mice 8–20 weeks of age were used for all experiments. Animals were randomly allocated to the different experimental conditions reported in this study.
Viral vectors
AAV9-hSyn-Flex-GCaMP6s-WPRE-SV40 was produced by the Vector Core of the University of Pennsylvania. AAV9-EF1α-DIO-eNpHR3.0-mCherry, AAV2-CaMKII2α-eNpHR3.0-mCherry, AAV2-CaMKII2α-mCherry, AAV2-EF1α-DIO-hChR2(H134R)-YFP-WPRE and AAV2-EF1α-DIO-mCherry were produced by the Vector Core of the University of North Carolina. AAV5-hSyn-FLEX-ChrimsonR-tdTomato (Addgene plasmid 62723), AAV9-CAG-FLEX-tdTomato (Addgene plasmid # 28306) and AAV9-Syn-Flex-jGCaMP7s-WPRE (Addgene plasmid # 104491) were purchased from Addgene. AAV2(retro)-CAG-iCre (Addgene plasmid # 81070) was produced by Vector Biolabs. AAV9-EF1a-FLEX-TVA-mCherry (Addgene plasmid # 38044) and AAV9-CAG-FLEX-RG (Addgene plasmid # 38043) were produced by Vigene Biosciences, Inc. EnvA-SAD-ΔG-eGFP (Addgene plasmid # 32635) was produced by the Viral Vector Core of the Salk Institute for Biological Studies. All viral vectors were stored in aliquots at −80°C until use.
Stereotaxic surgery
All viral injections were performed using previously described procedures55 and an AngleTwo stereotaxic device (Leica Biosystems) at the following stereotaxic coordinates: pPVT, −1.60 mm from bregma, 0.06 mm lateral from midline, and −3.30 mm vertical from cortical surface, 6.12° angle for both fiber photometry and optogenetics; NAc, 1.70 mm from bregma, 0.60 mm lateral from midline, and −4.60 mm vertical from cortical surface, 9.99° angle for optogenetics; CeA, −1.42 mm from bregma, 2.90 mm lateral from midline, and −4.80 mm vertical from cortical surface. For fiber photometry and optogenetic experiments, an optical fiber (400 μm for photometry, Doric Lenses; 200 μm for optogenetics, Thorlabs) was implanted over the target immediately after viral injections and cemented using Metabond Cement System (Parkell) and Jet Brand dental acrylic (Lang Dental Manufacturing). For retrograde tracing of NAc-projecting and CeA-projecting pPVT cells, CTB-647 and CTB-555 (1.0% in PBS; ThermoFisher Scientific) were injected into the NAc (0.5 μL) and CeA (0.3 μL), respectively and allowed 4 days for retrograde transport. Following all surgical procedures, animals were returned to their home cages and placed on a heating pad for 24 h postsurgical recovery and monitoring. Animals received subcutaneous injections with Metacam (meloxicam, 1–2 mg/kg) for analgesia and anti-inflammatory purposes. Mice without correct targeting of optical fibers, tracers or vectors were excluded from this study.
Fiber photometry
Fiber photometry was performed as previously described56,57. Briefly, mice were allowed to habituate to the fiber patch cord in their home cage for approximately 5 min before each behavior test. GCaMP fluorescence and isosbestic autofluorescence signals were excited by the fiber photometry system (Doric Lenses) using two sinusoidally modulated 473 nm (211 Hz) and 405 nm (531 Hz) LEDs (DC4100, ThorLabs). Both LEDs were combined via a commercial Mini-cube fiber photometry apparatus (Doric Lenses) into a fiber patch-cord (400 μm core, 0.48 NA) connected to the brain implant in each mouse. The light intensity at the interface between the fiber tip and the animal was adjusted from 10 to 20 μW (but was constant throughout each test session for each mouse). An RZ5P fiber photometry acquisition system with Synapse software (Tucker-Davis Technologies) collected and saved real-time demodulated emission signals and behavior relevant TTL inputs. For each trial, GCaMP signals (F473 nm) were compared with autofluorescence signals (F405 nm) to control for movement and bleaching artefacts. Signal data was de-trended by first applying a least-squares linear fit to produce Ffitted 405 nm, and dF/F was calculated as (F473 nm – Ffitted 405 nm)/Ffitted 405 nm. All GCaMP signal data is presented as the z-score of the dF/F from baseline (pre-CS) segments.
Fear conditioning
Prior to training, mice were handled and habituated to the fiber patch cord in the conditioning context. Mice were fear conditioned in a Mouse Test Cage (18 cm x 18 cm x 30 cm) equipped with an electrifiable floor connected to a shock generator (H13–15; Coulbourn instruments) and placed inside a sound attenuated cabinet (H10–24A; Coulbourn Instruments). The auditory fear conditioning procedure was carried in two different contexts: a Context A (habituation and conditioning) and a Context B (retrieval). The cabinet was illuminated at all times and the subject’s behavior was captured with a USB camera (ACT-VP-02; Coulbourn Instruments) at 3.7 Hz during each session. FreezeFrame software (ActiMetrics) was used to control the delivery of both 4-kHz, 75-dB tones (30 s; CS) and 0.6-mA footshocks (2 s; US).
For habituation, a 120-s pre-stimulus interval (PSI) was followed by 4 trials of CS presentations with pseudorandom 30–60-s inter-trial interval (ITI) in Context A. Fear conditioning was conducted in Context A. Same PSI was followed by 5 trials of CS presentations that co-terminated with the US, with pseudorandom 30–60-s ITI. A fear memory retrieval session was conducted in Context B. Same PSI was followed by 8 trials of unreinforced CS presentations with pseudorandom 30–120-s ITI. Freezing behavior was recorded and analyzed with FreezeFrame. For the retrieval session, the freezing data of all the trials were linearly aligned from maximus to minimum (Extended Data Figure 2a-b). Based on the distribution, all trials were divided into three groups: Low freezing (L; Freezing< 40%; n= 20 trials), moderate freezing (M; 40% ≤ Freezing≤ 60%; n= 16 trials) and high freezing (H; Freezing> 60%; n= 12 trials).
Two-way signaled active avoidance (2AA)
Mice were trained on the two-way signaled active avoidance as previously described58. Briefly, the behavioral apparatus consisted of a custom-built shuttle box (18 cm x 36 cm x 30 cm) that contained two identical chambers separated by a hurdle (17.5 cm x 6 cm). The hurdle projected 3 cm above the floor and allowed mice easy access to both chambers. The floor consisted of electrifiable metal rods (H10–11M-TC-SF, Coulbourn Instruments) and was connected to a shock generator (H13–15; Coulbourn instruments). Before each subject was trained/tested, the shuttle box was wiped clean with 70% ethanol. The mouse’s behavior was captured with a USB camera during each session. A speaker located on the top of the shuttle box (50 cm high) was used to deliver the CS. Subjects’ movement and TTLs of CS, US and optogenetic stimulation were recorded by ANY-maze version 5 (Stoelting).
After a 5-min habituation period, mice were trained with daily sessions of 2AA, each consisting of 30 presentations of the CS (lasting up to 15 s each). Trials in which subjects failed to shuttle to the adjacent chamber prior to the termination of the CS resulted in the presentation of the US (lasting up to 15 s each) until subjects escaped to the opposite chamber (failure trials). For trials in which subjects shuttled to the opposite chamber during the CS, the CS was abruptly terminated, and the US was also prevented (avoidance trials). Avoidance rate was calculated as the percentage of the number of avoidance trials over the total number of trials.
In Figure 2a-h, mice were subjected to five 2AA sessions (1 session/day) and the GCaMP signal was collected on Days 4–5 as described above. In Figure 2i-l, mice were initially trained for 5 days. If a subject did not reach 30% of avoidance rate by Day 5, it was not used in further test sessions. Test sessions consisted of CS presentations (no US). In the second test session, subjects received light stimulation with a yellow light source (Ce:YAG + LED Driver; Doric Lenses) during each CS presentation (light onset was 5 s prior to the onset of the CS and culminated 5 s after the offset of the CS). The light intensity at the interface between the fiber tip and the mouse was ~10 mW. In Figure 3, 4, 6, mice were initially trained for 3 days. GCaMP signal was collected across Days 4–5 . In Figure 5, mice were initially trained for 3 days. If a subject did not reach 70% of avoidance rate by Day 3, it was not used in further testing sessions. As described above, these test sessions involved CS presentations (no US) and the subjects received light stimulation paired to CS presentations during the second test session. In Figure 7, we selectively screened for poor avoiders as follows: mice with ≤ 30% of avoidance rate by Training Day 3 were poor avoiders used for further test. As these are essentially mice that failed to learn active avoidance, subsequent test sessions involved presentations of both the CS and the US while subjects received light stimulation paired to the CS from the second to the sixth test sessions. In Extended Data Figure 5, 6, 7, 8, mice were initially trained for 3 days and tested with another 3 days subsequently. These test sessions involved both CS and US presentations and the subjects received light stimulation paired to CS presentations during the second test session. For experiments in which we optogenetically manipulated pPVT or its circuits during ITIs (Extended Data Figure 4, 5, 6), mice were initially trained for 3 days and tested with another 3 days subsequently. These test sessions involved both CS and US presentations and the subjects received light stimulation paired to ITIs during the second test session. In Figure 8, Extended Data Figure 9, mice were initially trained for 3 days and tested with another 4 days subsequently. These test sessions involved both CS and US presentations and the subjects received light stimulation paired to CS presentations through NAc-implanted opto fibers during the second test session and CeA-implanted opto fibers during the third test session.
Data analysis for two-way signaled active avoidance
We performed post-hoc position tracking of the animal’s nose and body center from video in the software TopScan (CleverSys). CS and US times from ANY-maze and raw video tracking position values from TopScan were exported and analysis was performed with custom routines in the R statistical computing environment (R core Team 2019; R Foundation).
Missing positions up to 10 successive frames were linearly interpolated with custom routines in R. For imaging sessions, video tracking and ANY-maze TTL pulse timestamps were zero corrected to align behavioral and calcium signal timestamps. Next, calcium signals and/or position frames during US and CS were flagged by matching the relevant timestamps to TTL pulse times from ANY-maze, and the frame-by-frame distance traveled for the nose and body center was calculated for the tracking data. In order to minimize the effects of noise in the tracking data, we calculated the 40% quantile of the frame-by-frame distance traveled by the animal’s nose and body center for each session; in all cases, this yielded a distance value of 0 or 1 mm. This quantile value served as a movement threshold, i.e. an inter-frame distance traveled less than or equal to the quantile value was considered non-movement. We then created a binary vector and frames with coincident immobility of the nose and center body were set to 1. Changepoint analysis59 (R package version 2.2.2, URL:https://CRAN.R-project.org/package=changepoint), with a minimum segment length of 30 video frames, was then applied to this vector. This approach allowed us to statistically determine when transitions to (and from) coincident periods of non-movement of nose and body occurred which were used as a proxy for freezing behavior. Next, each sustained bout of non-movement was isolated, and we probed whether there was any movement that lasted for ≥ 5 consecutive video frames. If such movement did occur, we truncated the bout of immobility at the start of movement. Finally, immobility bouts with a duration ≥ 1 s were considered freezing. To ensure robustness of our method, we compared statistically derived event flags against manually scored videos in a subset of behavioral sessions.
We isolated freezing events (see Freeze detection section above) which occurred during the CS as CS freezing and those occurred during ITI as ITI freezing. For each trial we calculated the time interval between the moment of animal crossing the hurdle and the CS onset, named Latency to avoid. CS, ITI freezing or latency to avoid were average within session and then within each group and plotted as mean ± s.e.m.
For Fiber photometry, GCaMP data was normalized as dF/F. Next, we used the behavioral flags calculated from the video tracking to create average peri-event time histograms (PETH) time locked to the onset of the behavior events of interest, including CS onset (CS), highest movement velocity during the CS (Max. Velocity), escape or avoidance movement onset (Escape Initiate), escape or avoidance moment (Escape) and freezing onset during the CS (Freezing). All trials in each session were separated into avoidance and failure trials as described above. For each trial type, the Z-score from 10 s before to 30 s after CS onset was plotted in heatmaps for all trials in test sessions. The mean of all recorded activity for each trial type was plotted below the corresponding heatmap. We isolated the calcium signal from 2 s before to 2 s after the onset of each behavior event from avoidance and failure trials separately. Using the 2 s before the onset as a baseline for each event, we calculated Z-scores and AUC of the Z-score from 2 s after the onset of each behavior event. Lastly, we plotted the mean of signal transitions and AUC for each event type from each trial type. All 2AA photometric signals and behavioral performance were analyzed blind.
Optogenetic inhibition of pPVT neurons and projections in an open field arena
After habituating to the fiber patch cord in the home cage for 10 min, mice were placed in a square enclosure (50 × 50cm) to roam freely for 6 min. Mice received 2 min of light stimulation 2 min after the beginning of the test (min 2–4) The light intensity at the interface between the fiber tip and the mouse was ~10 mW. The cumulative distance traveled in the open field apparatus was tracked, recorded, and quantified using ANY-maze behavioral tracking software.
Monosynaptic tracing of inputs to NAc-projecting or CeA-projecting neurons of the PVT
To limit monosynaptic rabies tracing to NAc-projecting or CeA-projecting neurons of the PVT, AAV2(retro)-CAG-iCre was bilaterally injected into the NAc (0.5 μl per injection) or CeA (0.3 μl per injection) of C57BL/6NJ mice. Within the same surgical procedure, a virus mixture of AAV9-EF1a-FLEX-TVA-mCherry and AAV9-CAG-FLEX-RG at a 1:1 ratio was injected into the pPVT (1.5 μl), followed by an injection of the pseudotyped rabies virus EnvA-SAD-ΔG-eGFP (1.5 μl) in the same location of pPVT two weeks later. Mouse brain tissues were collected and subjected to analysis one week later. Brain sections were scanned by an AxioScan (Carl Zeiss) with a 5x objective. Cells were detected and quantified on NeuroInfo (MBF Bioscience). Starter cell count was generated by quantifying number of mCherry and GFP double positive pPVT cells. We generated a connectivity index by normalizing the fraction of retrogradely labeled (GFP+) cells for a given brain region, to the number of starter cells. Connectivity indices for each region were average within groups (CeA-projecting and NAc-projecting). Regions neighboring the pPVT (midline and medial thalamic nuclei) were excluded from our analyses due to the possibility of artifacts related to the injection site. All monosynaptic rabies tracing data were analyzed by a blind experimenter.
Histology and immunofluorescence
Animals were deeply anesthetized with euthanasia solution (Vet One) and transcardially perfused with PBS (pH 7.4, 4 °C), followed by paraformaldehyde solution (PFA, 4% in PBS, 4 °C). After extraction, brains were post-fixed in 4% PFA at 4 °C for a minimum of 2 h, and subsequently cryoprotected by transferring to a 30% PBS-buffered sucrose solution until brains were saturated (for over 24 h). Coronal brain sections (50 μm) were cut using a freezing microtome (SM 2010R, Leica). For immunofluorescence staining, brain sections were incubated in PBS (pH 7.4) with 10% normal goat serum (NGS) and 0.1% Triton X-100 (Sigma Aldrich) for 1 h, and then incubated using the following antibody (overnight, at 4 °C): anti-D2R (1:300, rabbit, Frontier Institute, D2R-Rb-Af960). After washing, Alexa-Fluor-488 conjugated secondary antibodies (1:500, goat anti-mouse, Molecular Probes A-11001). Finally, sections were subsequently mounted onto glass slides for imaging (LSM 780 laser-scanning confocal microscope, Carl Zeiss). Image analysis and cell counting were performed using ImageJ software (Fiji, version 1.52p). Optical fiber placements for all mice included in this study are presented in Figure 2a, Figure 3c, Figure 4b, Figure 5c, Figure 6b, Figure 7c, Extended Data Figure 1a, Extended Data Figure 4b and 4l, Extended Data Figure 5b, Extended Data Figure 6b, Extended Data Figure 8b and 8m and Extended Data Figure 9a.
Statistics and Reproducibility
All data were plotted and analyzed with OriginPro version 2016 & version 2018 (OriginLab) and GraphPad Prism (Version 8.0.1; GraphPad Software). All data are presented as mean ± s.e.m. There were no assumptions or corrections made before data analysis. Differences between two groups were tested with a two-tailed Student’s t-test; differences among multiple groups were examined with analysis of variance (ANOVA, one-way and two-way repeated measures) followed by two-stage linear step-up procedure of Benjamini, Krieger and Yekutieli; P< 0.05 was considered significant. The sample sizes used in our study, such as the numbers of animals, are typically the same or exceed those estimated by power analysis (power = 0.80, α = 0.05). For tracing experiments, the sample size is 2–5 mice. For fiber photometry experiments, the sample size is 4–6 mice. For optogenetic experiments, the sample size is 4–13 mice. All experiments were replicated at least once, and similar results were obtained. All experiments were randomized, and investigators were blinded to allocation during experiments. Data distribution was assumed to be normal, but this was not formally tested
Life Sciences Reporting Summary
Additional information on experimental design and materials used in our study is available in the Life Sciences Reporting Summary.
Extended Data
Extended Data Figure 1. pPVTD2R neuron activity during fear conditioning and retrieval.
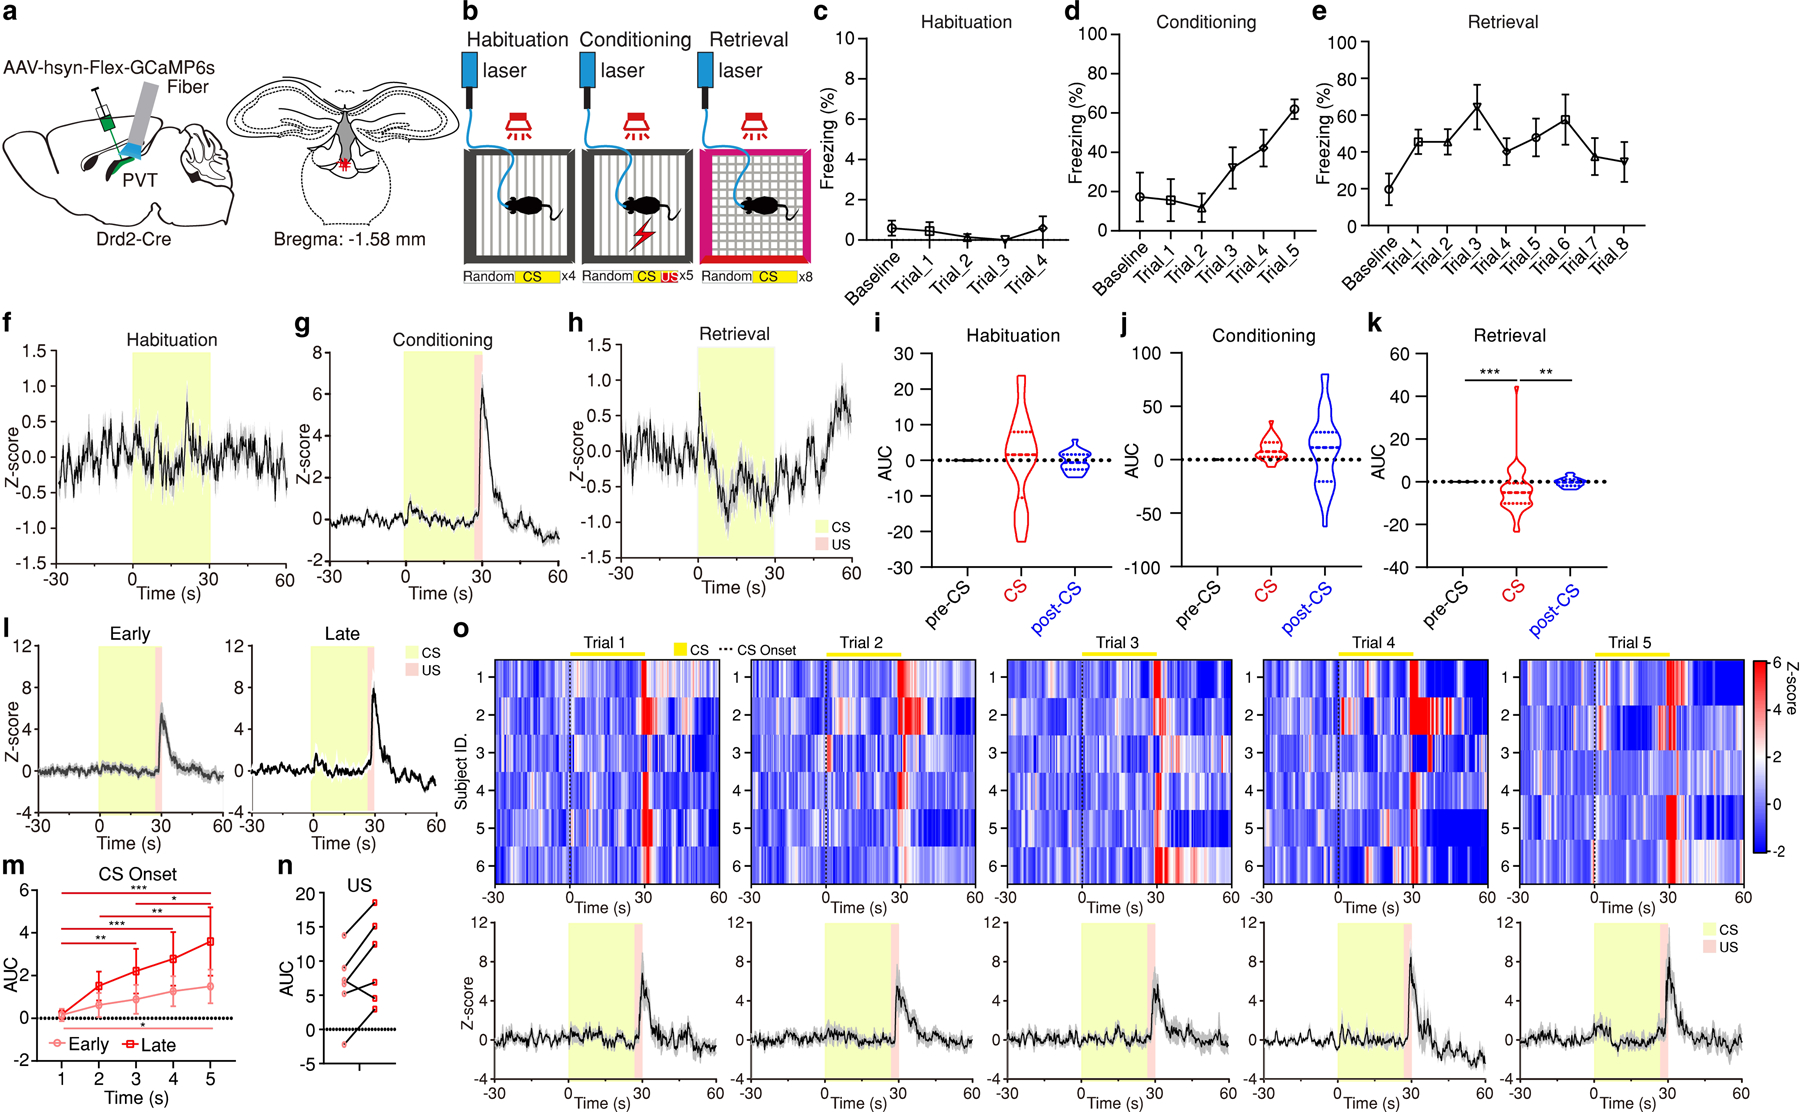
a, Representative image of GCaMP6s expression in pPVTD2R neurons and optical fiber placements (n = 6 mice). b, Experimental paradigm. c-e, Freezing behavior during the habituation (c), conditioning (d) and retrieval (e) sessions. f-h, Average calcium responses during the habituation (f), conditioning (g) and retrieval (h) sessions. i-k, Quantification of calcium signal during habituation (i), conditioning (j) and retrieval (k) sessions. AUC, One-way ANOVA followed by two-stage linear step-up procedure of Benjamini, Krieger and Yekutieli. Habituation: n = 20 Trials; F(2, 57) = 0.1. Conditioning: n = 30 Trials; F(2, 87) = 2.17. Retrieval: n = 48 Trials; F(2, 141) = 7.7; group comparisons, pre-CS vs CS ***P = 0.0006, CS vs post-CS **P = 0.0012. l, Average calcium responses during early (Trials 1–3; left) and late (Trials 4–5; right) conditioning trials. m, Quantification of calcium signal during the first 5 s following the onset of CS during conditioning sessions. AUC, Two-way ANOVA followed by two-stage linear step-up procedure of Benjamini, Krieger and Yekutieli, n = 12 Trials; F(4, 112) = 1.49. Group comparisons: Early, 1 s vs 4 s P = 0.054, 1 s vs 5 s *P = 0.021; Late, 1 s vs 3 s **P = 0.0043, 1 s vs 4 s ***P = 0.0003, 1 s vs 5 s ***P < 0.001, 2 s vs 5 s **P = 0.0035, 3 s vs 5 s *P = 0.049. n, Calcium signal during US presentation in the late trials is higher than the early trials (n = 6 mice; two-tailed paired Student’s t-test, P = 0.054). o, Top: Heatmaps showing calcium responses of Conditioning Trials 1–5 from individual subjects, respectively. Bottom: Average calcium responses of the top panels. All data in figure shown as mean ± s.e.m.
Extended Data Figure 2. The activity of pPVTD2R neurons is positively correlated with movement during the CS following fear memory retrieval.
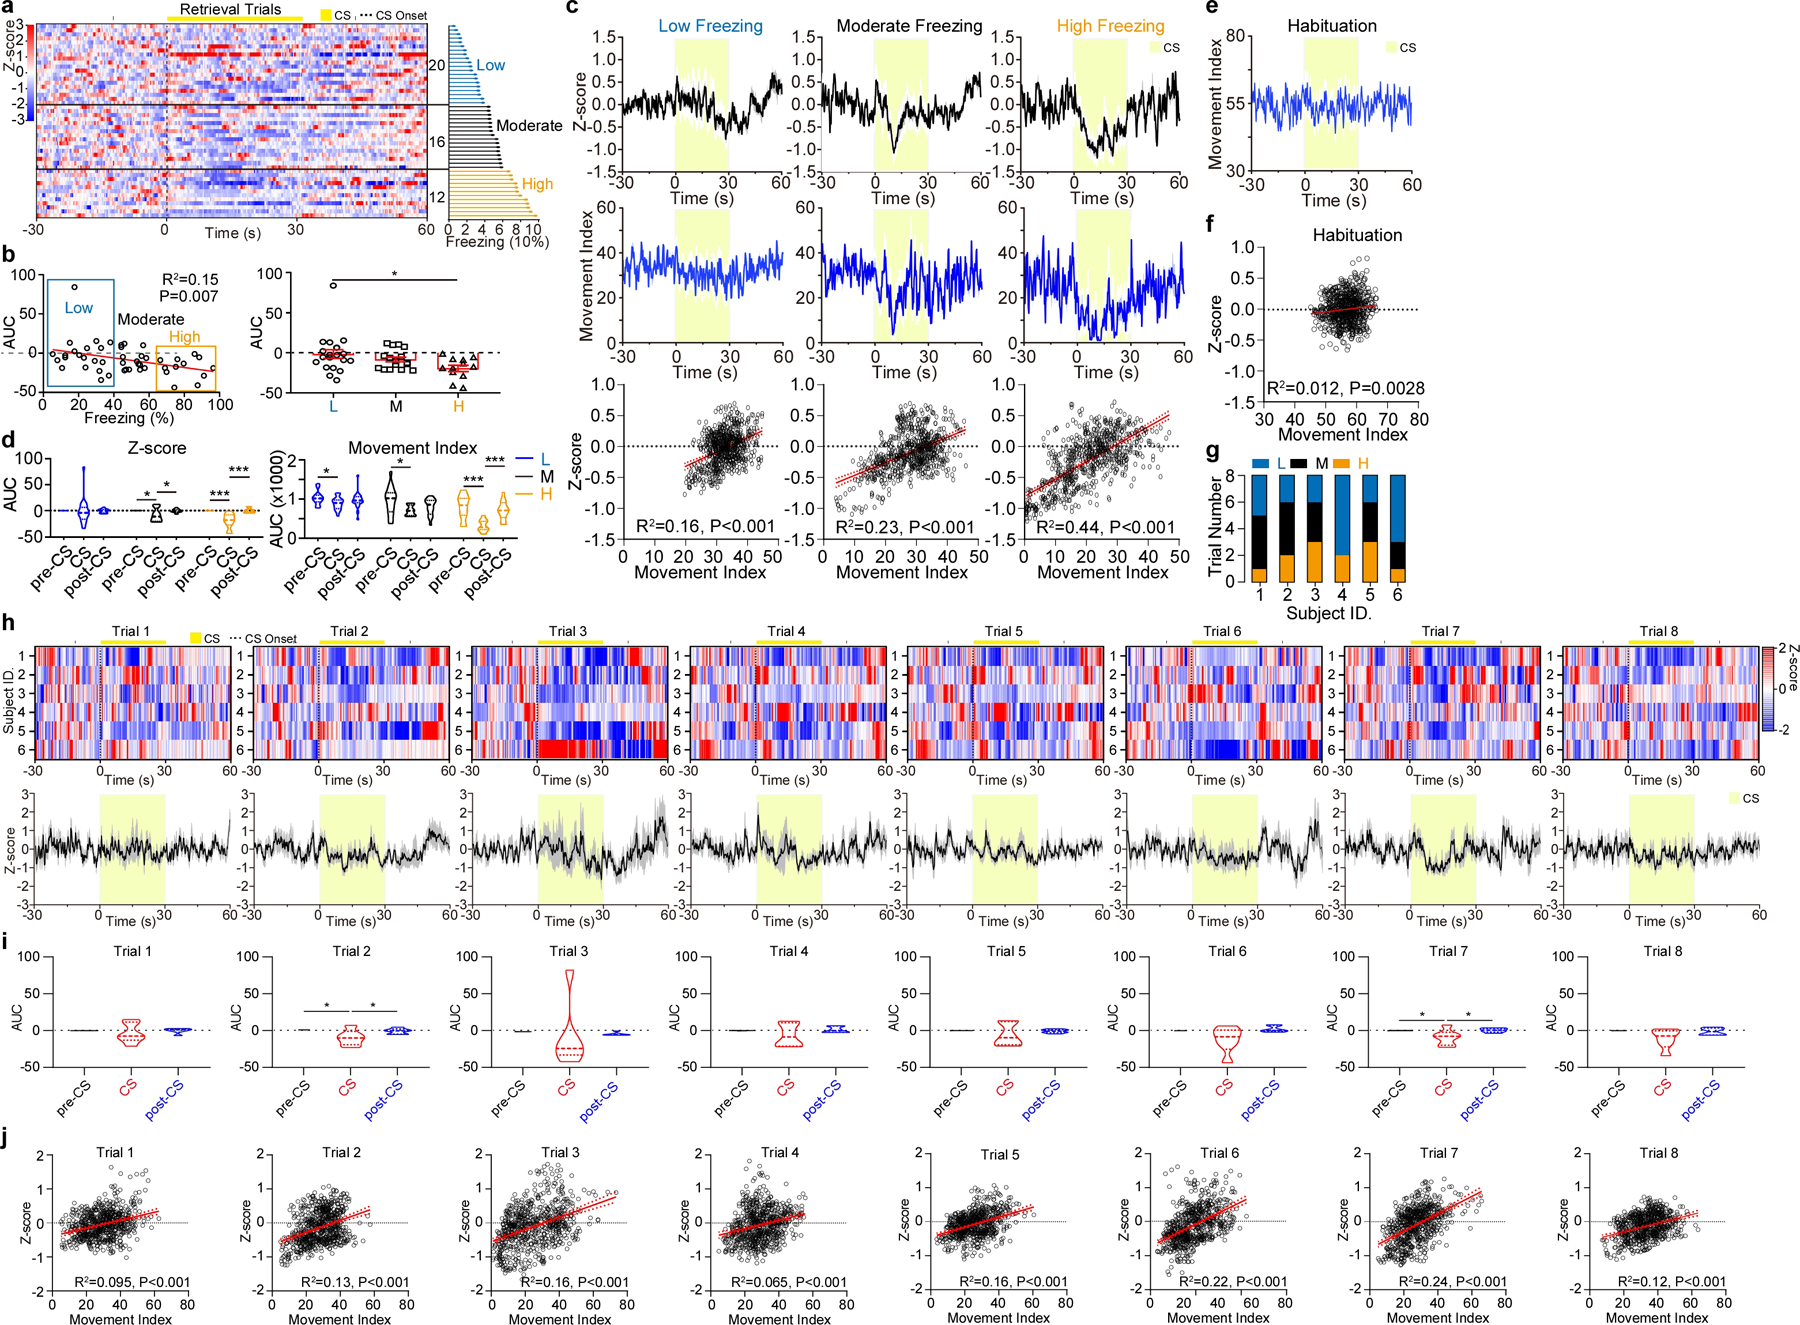
a, Calcium responses of individual retrieval trials aligned by percentage CS freezing (See Methods) (right). n = 6 mice, 8 trials per mouse. b, Left: Linear regression of CS calcium signal and freezing percentage for each trial. Right: Average CS calcium signal for each group (L, n = 20 trials; M, n = 16 trials; H, n = 12 trials). AUC, F(2, 45) = 3.3, one-way ANOVA followed by two-stage linear step-up procedure of Benjamini, Krieger and Yekutieli. Group comparisons, L vs H, *P = 0.013. c, Average calcium responses (top), average movement index (middle) and linear regression of average calcium signal and movement index during the CS (bottom) for each group. d, Comparison of calcium signal (left) and movement index (right) for each group (L, n = 20 trials; M, n = 16 trials; H, n = 12 trials). AUC, two-way ANOVA followed by two-stage linear step-up procedure of Benjamini, Krieger and Yekutieli. Calcium signal: F(4, 90) = 3.37; movement index: F(4, 90) = 3.6; for group comparisons ***P < 0.001, *P < 0.05. e-f, Average movement index (e) and linear regression of average calcium signal and movement index during the CS (f) for the habituation session. g, Individual subjects contributing to each group. h, Calcium responses of Trials 1–8 and average in bottom panels. i, Quantification of calcium signal during the Trials 1–8. AUC, One-way ANOVA followed by two-stage linear step-up procedure of Benjamini, Krieger and Yekutieli. n = 6; Trial 1, F(2, 10) = 1.36; Trial 2, F(2, 10) = 4.55; Trial 3, F(2, 10) = 0.092; Trial 4, F(2, 10) = 1.55; Trial 5, F(2, 10) = 0.74; Trial 6, F(2, 10) = 2.83; Trial 7, F(2, 10) = 4.94; Trial 8, F(2, 10) = 2.71; for group comparisons *P < 0.05. j, Linear regression of average calcium signal and movement index from Trials 1–8. All data in figure shown as mean ± s.e.m.
Extended Data Figure 3. The activity of pPVTD2R neurons in the 2AA task, related to Figure 2.
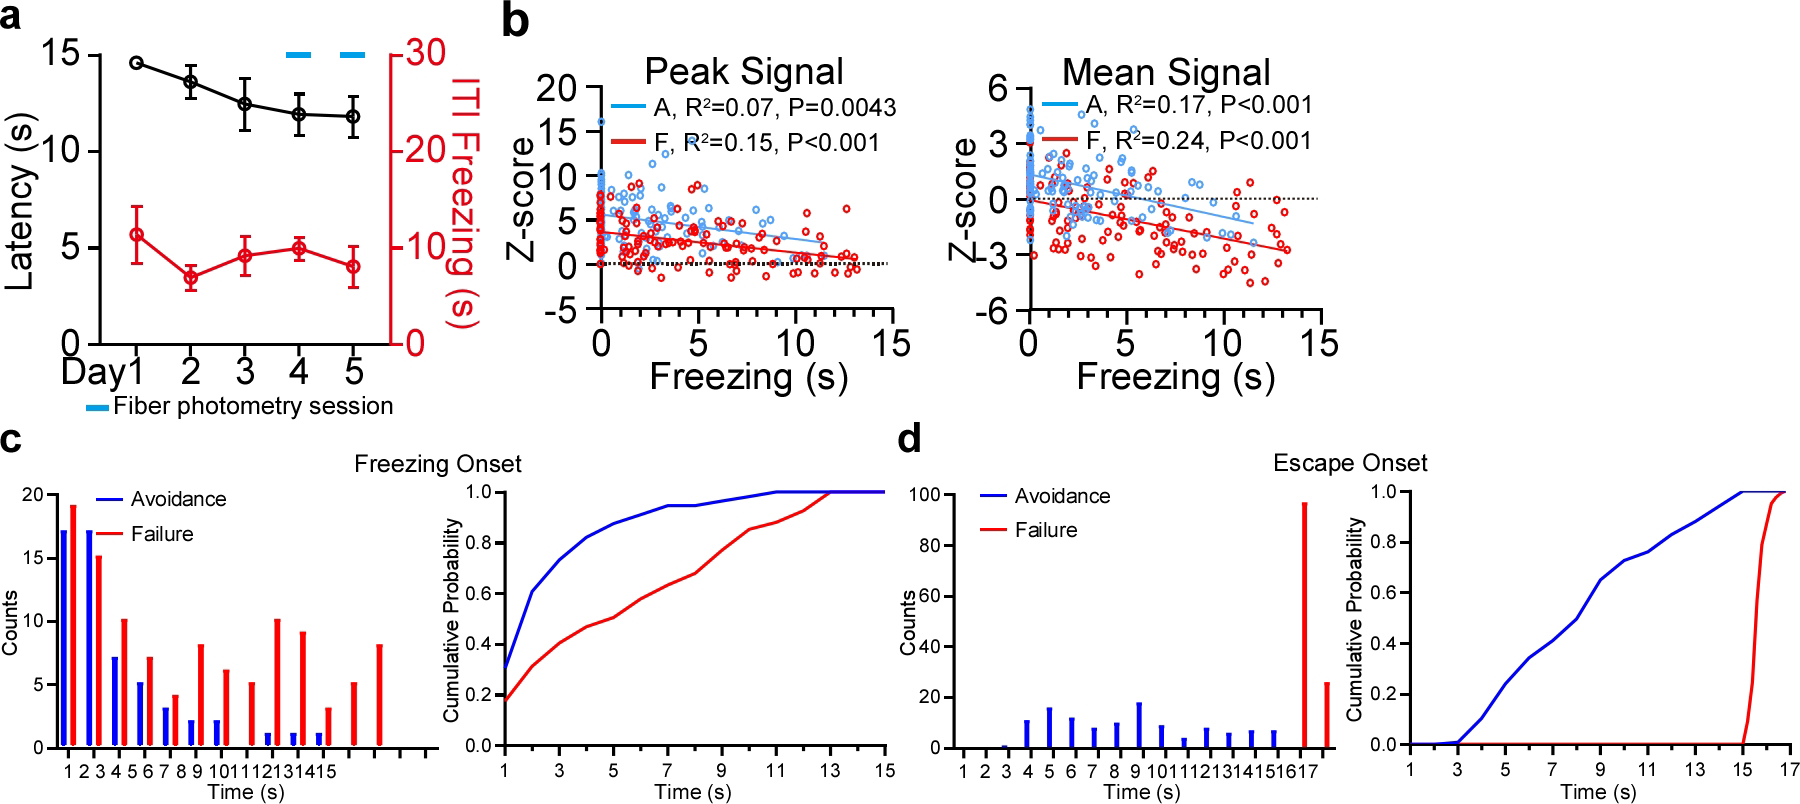
a, Latency to avoid and freezing time during the ITI across days (n = 5 mice). b, Left: Linear regression of peak calcium signal and freezing time during the CS for avoidance (blue; A; R2 = 0.069, P = 0.0043) and failure trials (red; F; R2 = 0.15, P < 0.001). Right: Linear regression of average calcium signal and freezing time during the CS for avoidance (blue; A; R2 = 0.17, P < 0.001) and failure trials (red; F; R2 = 0.24, P < 0.001). c, Quantification of the latency to freezing after CS onset for avoidance and failure trials. Left: Counts of the freezing latency. Right: cumulative probability plots for the Left panel. Avoidance, n = 56 Events; Failure, n = 109 Events. d, Quantification of the latency to escape after CS onset for avoidance and failure trials. Left: Counts of the escape latency. Right: cumulative probability plots for the Left panel. Avoidance, n = 118; Failure, n= 122 Trials. All data in figure shown as mean ± s.e.m.
Extended Data Figure 4. Optogenetic inhibition of pPVTD2R neurons in the 2AA task.
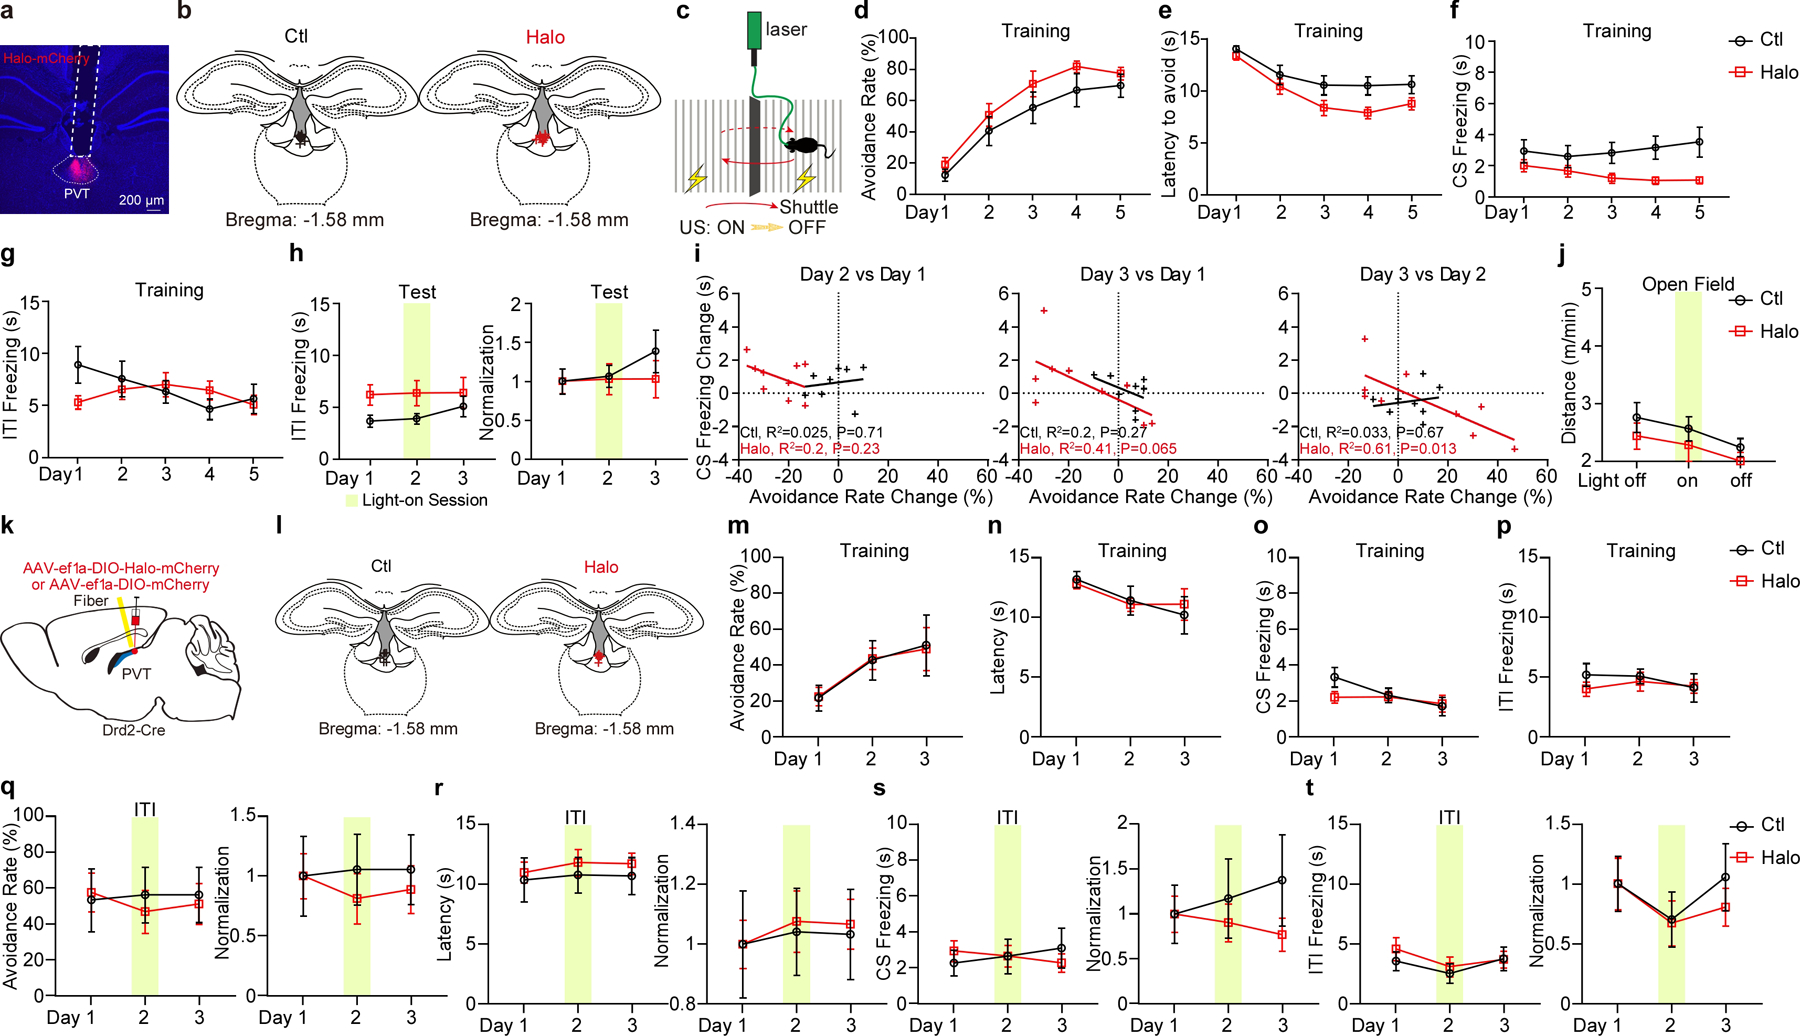
a, Representative image from a mouse expressing Halo-mCherry in pPVTD2R neurons and implanted with an optical fiber. b, Fiber placements (Ctl, n = 8 mice; Halo, n = 9 mice). c, Schematic of the 2AA task. d-g, Avoidance rate (d), latency to avoid (e) and freezing time during the CS (f) and the ITI (g) across training days for each group. h, Left: Freezing time during the ITI. Right: Normalization to Day 1 for each group. ITI freezing in s, two-way ANOVA followed by two-stage linear step-up procedure of Benjamini, Krieger and Yekutieli. F(2, 30) = 0.36, Non-significant. i, Linear regression of the changes in freezing behavior across test sessions as a function of changes in avoidance behavior. j. Moving distance in the open field. Ctl, n = 8 mice; Halo, n = 5 mice. k, Schematic of the viral vector strategy and optical fiber placement used for optogenetic silencing of pPVTD2R neurons in the 2AA task. l, Fiber placements (Ctl, n = 6 mice; Halo, n = 7). m-p, Avoidance rate (m), latency to avoid (n) and freezing time during the CS (o) and the ITI (p) across training days in both Ctl and Halo groups. q-t, Left: Effect of optogenetic inhibition of pPVTD2Rneurons during the ITI on avoidance rate (q), the latency to avoid (r) and freezing time during the CS (s) and the ITI (t). Right: Normalization to Day 1 for each group. Two-way ANOVA followed by two-stage linear step-up procedure of Benjamini, Krieger and Yekutieli. Avoidance rate, F(5, 80) = 9.05; latency to avoid, F(5, 80) = 4.52; CS freezing, F(5, 80) = 1.17; ITI freezing, F(5, 80) = 0.44; non-significant change among each group comparison. All data in figure shown as mean ± s.e.m.
Extended Data Figure 5. Optogenetic inhibition of pPVT–NAc axon terminals in the 2AA task.
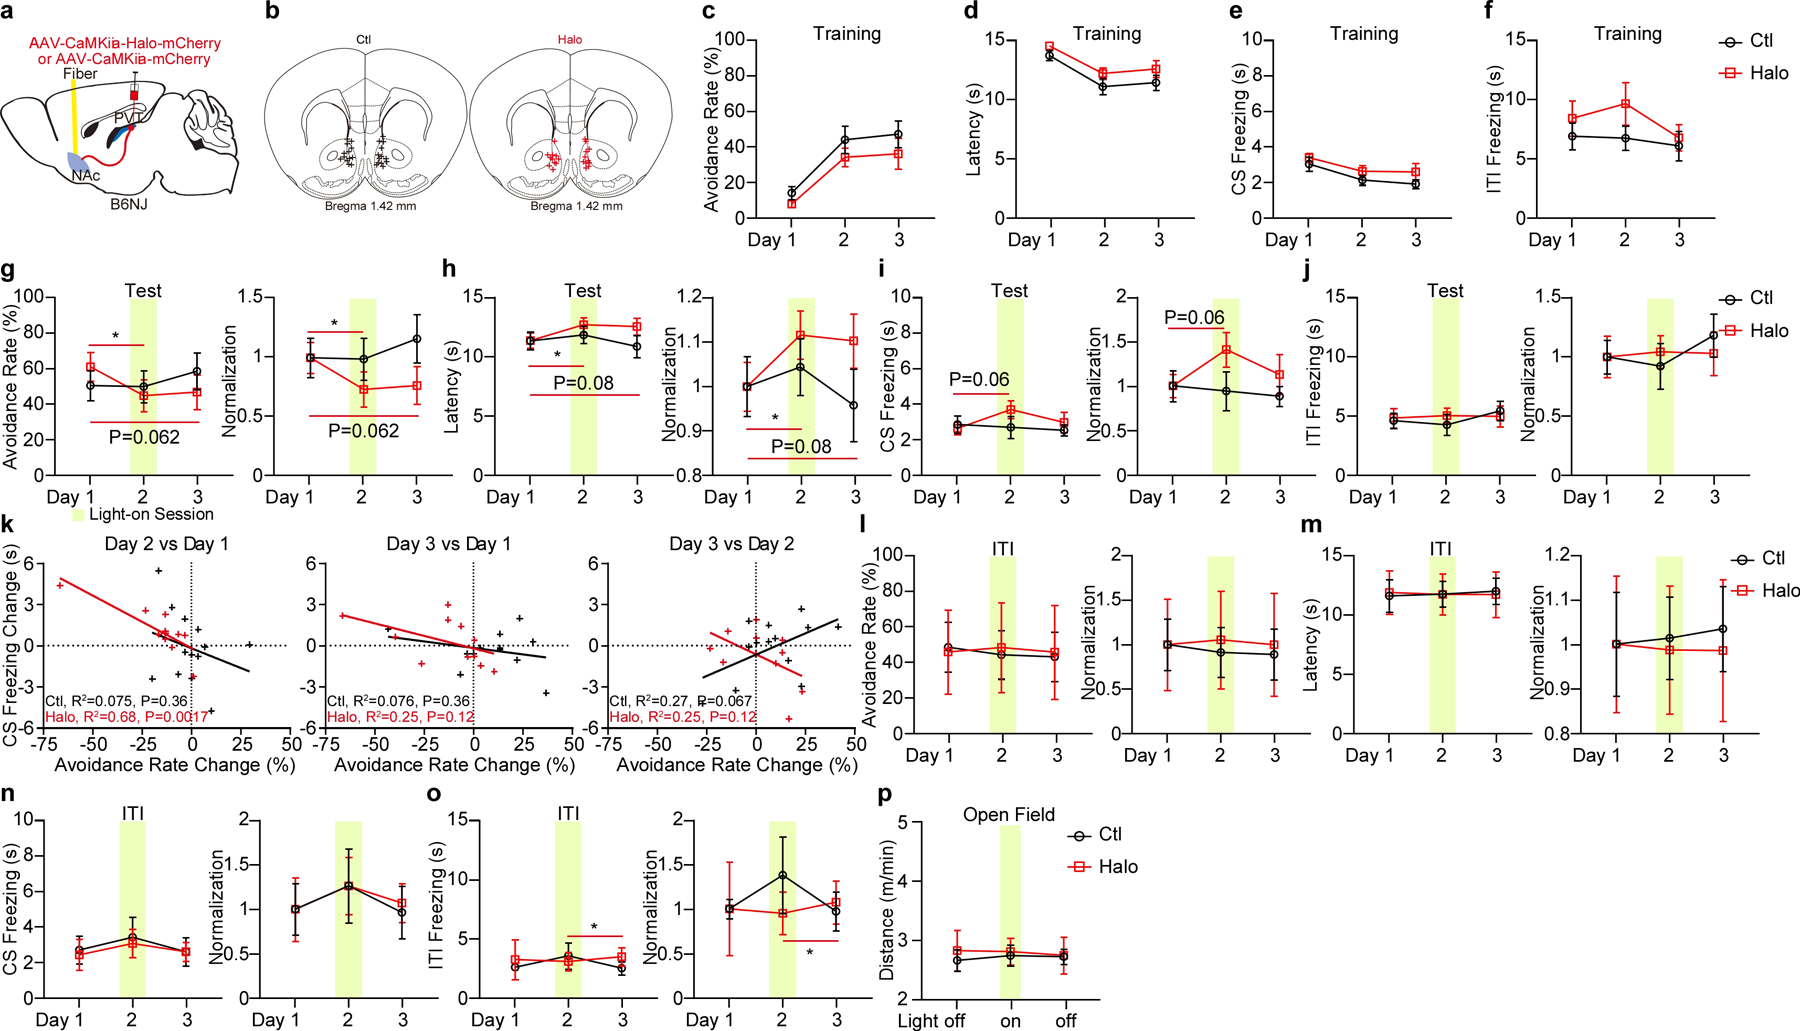
a, Schematic of the viral vector strategy and optical fiber placement for optogenetic silencing of pPVT–NAc axon terminals in the 2AA task. b, Fiber placements (Ctl, n = 13 mice; Halo, n = 11 mice). c-f, Avoidance rate (c), latency to avoid (d) and freezing time during the CS (e) and ITI (f) across training sessions for each group. g-j, Left: Avoidance rate (g), latency to avoid (h), freezing time during the CS (i) and the ITI (j) during optogenetic inhibition of pPVT–NAc axon terminals. Right: Normalization to Day 1 for each group. Two-way ANOVA followed by two-stage linear step-up procedure of Benjamini, Krieger and Yekutieli. Avoidance rate: F(2, 44) = 4.89; group comparisons, Halo, Day 1 vs Day 2 *P = 0.013. Latency to avoid: F(2, 44) = 2.88; group comparisons, Halo, Day 1 vs Day 2 *P = 0.024. CS freezing: F(2, 44) = 1.1. ITI freezing: F(2, 44) = 0.46; non-significant change among other group comparison. k, Linear regression of the changes in freezing behavior across test sessions as a function of changes in avoidance behavior. l-o, Left: Optogenetic inhibition of pPVT–NAc axon terminals during the ITI has little effect on avoidance rate (l), the latency to avoid (m) and freezing time during the CS (n) and the ITI (o). Right: Normalization to Day 1 for each group. Ctl, n = 7 mice; Halo, n = 4 mice. Two-way ANOVA followed by two-stage linear step-up procedure of Benjamini, Krieger and Yekutieli. Avoidance rate, F(2, 18) = 0.16; latency to avoid, F(2, 18) = 0.22; CS freezing, F(2, 18) = 0.037; ITI freezing, F(2, 18) = 0.48, Halo, Day 2 vs Day 3 *P = 0.022; non-significant change among other group comparison. p. Moving distance in the open field. Ctl, n = 9 mice; Halo, n = 8 mice. All data in figure shown as mean ± s.e.m.
Extended Data Figure 6. Optogenetic inhibition of pPVT–CeA axon terminals in the 2AA task.
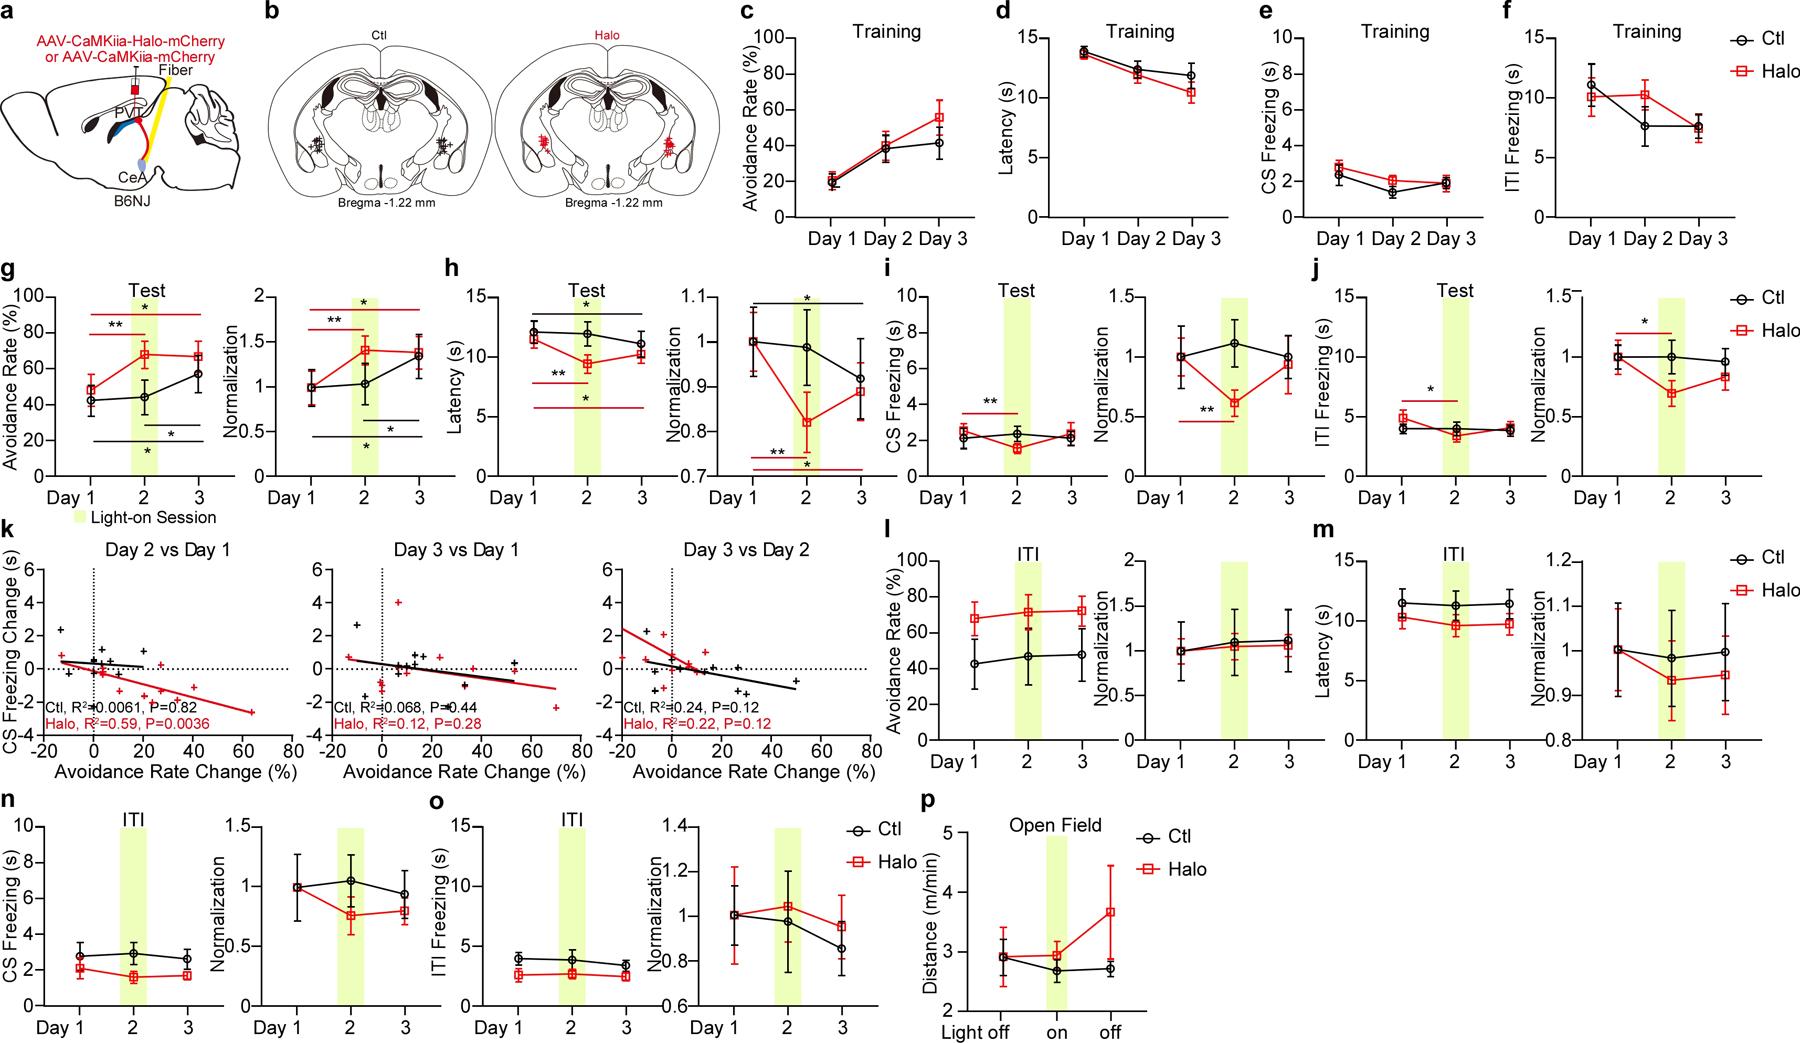
a, Schematic of the viral vector strategy and optical fiber placement for optogenetic silencing of pPVT–CeA axon terminals in the 2AA task. b, Fiber placements (Ctl, n = 11 mice; Halo, n = 12 mice). c-f, Avoidance rate (c), latency to avoid (d) and freezing time during the CS (e) and ITI (f) across training sessions for each group. g-j, Left: Avoidance rate (g), latency to avoid (h) and freezing time during the CS (i) and the ITI (j) of optogenetic inhibition of pPVT–CeA axon terminals. Right: Normalization to Day 1 for each group. Two-way ANOVA followed by two-stage linear step-up procedure of Benjamini, Krieger and Yekutieli. Avoidance rate: F(2, 42) = 3.27. Latency to avoid: F(2, 42) = 5.35. CS freezing: F(2, 42) = 2.77. ITI freezing: F(2, 42) = 1.67. For group comparisons **P < 0.01, *P < 0.05. k, Linear regression of the changes in freezing behavior across test sessions as a function of changes in avoidance behavior. l-o, Left: Avoidance rate (l), the latency to avoid (m) and freezing time during the CS (n) and the ITI (o) during optogenetic inhibition of pPVT–CeA axon terminals during the ITI. Right: Normalization to Day 1 for each group. Ctl, n = 6 mice; Halo, n = 10 mice. Two-way ANOVA followed by two-stage linear step-up procedure of Benjamini, Krieger and Yekutieli. Avoidance rate, F(2 ,28) = 0.0052; latency to avoid, F(2, 28) = 0.22; CS freezing, F(2, 28) = 0.61; ITI freezing, F(2, 28) = 0.086; non-significant change among each group comparison. p. Moving distance in the open field. Ctl, n = 8 mice; Halo, n = 9 mice. All data in figure shown as mean ± s.e.m.
Extended Data Figure 7. Optogenetic inhibition of pPVTD2R–CeA axon terminals in the 2AA task, related to Figure 7.
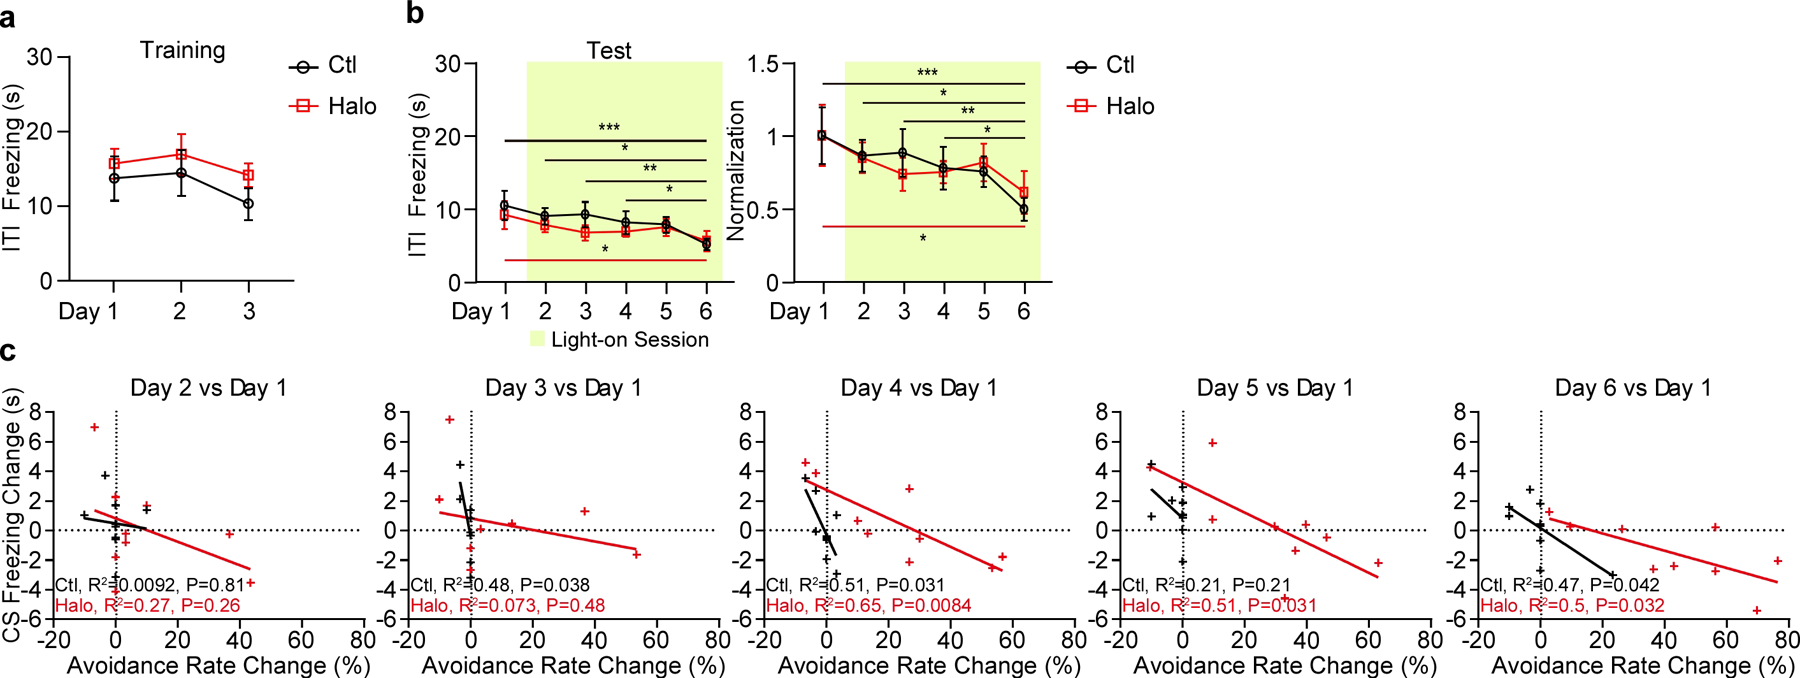
a, Freezing time during the ITI across training days in both Ctl and Halo groups. n = 9 mice per group. b, Left: Optogenetic inhibition of pPVTD2R–CeA axon terminals gradually reduces freezing time during the the ITI. Right: Normalization to Day 1 for each group. Two-way ANOVA followed by two-stage linear step-up procedure of Benjamini, Krieger and Yekutieli. F(5, 80) = 0.44; group comparisons, Ctl, Day 1 vs Day 6 ***P = 0.0006, Day 2 vs Day 6 *P = 0.011, Day 3 vs Day 6 **P = 0.0074, Day 4 vs Day 6 *P = 0.048; Halo, Day 1 vs Day 6 *P = 0.017. c, Linear regression of the changes in freezing behavior between Test Day 1 and other test sessions as a function of changes in avoidance behavior. All data in figure shown as mean ± s.e.m.
Extended Data Figure 8. Optogenetic stimulation of pPVTD2R–NAc or pPVTD2R–CeA axon terminals in the 2AA task.
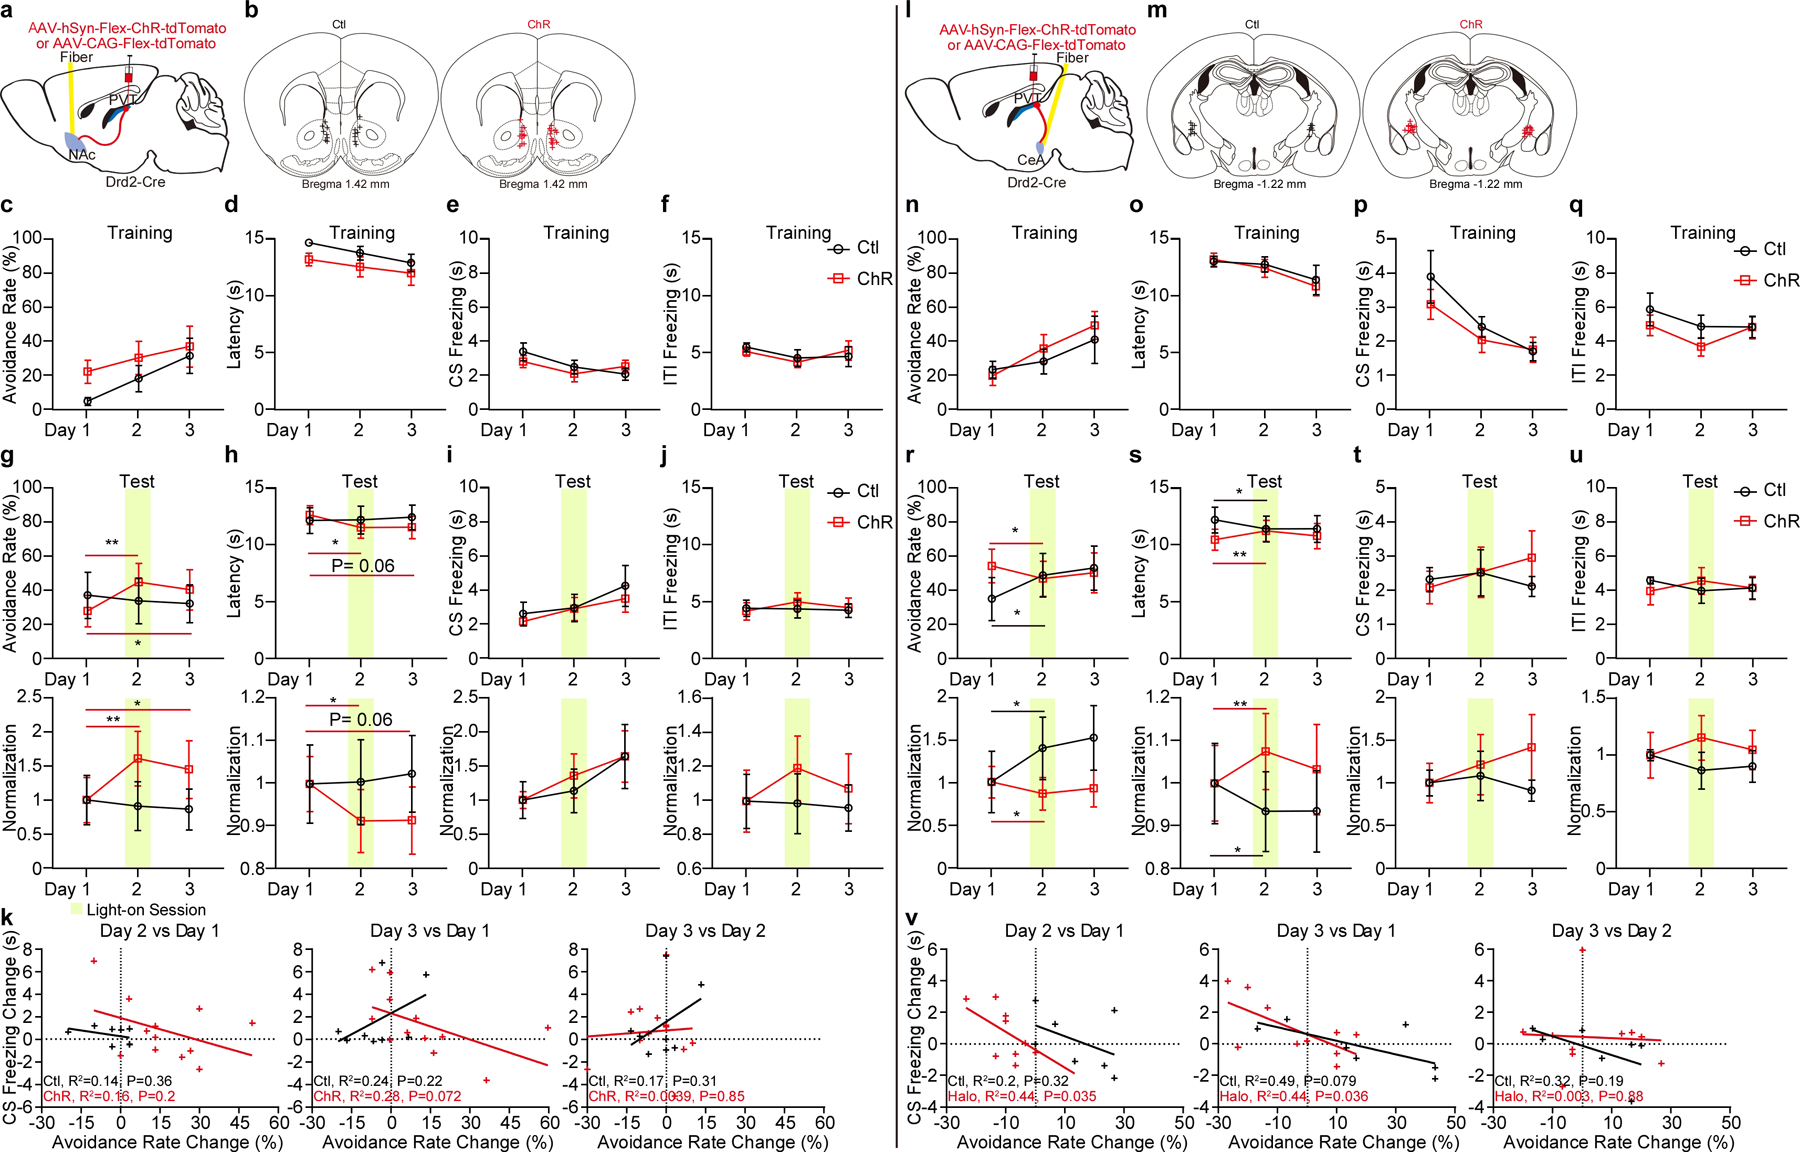
a, Schematic of the viral vector strategy and optical fiber placement for optogenetic stimulation of pPVTD2R–NAc axon terminals in the 2AA task. b, Fiber placements (Ctl, n = 8 mice; ChR, n = 12 mice). c-f, Avoidance rate (c), latency to avoid (d) and freezing time during the CS (e) and ITI (f) across training sessions for each group. g-j, Top: Avoidance rate (g), latency to avoid (h) and freezing time during the CS (i) and the ITI (j) during optogenetic stimulation of pPVTD2R–NAc axon terminals. Bottom: Normalization to Day 1 for each group. Two-way ANOVA followed by two-stage linear step-up procedure of Benjamini, Krieger and Yekutieli. Avoidance rate: F(2, 36) = 6.21. Latency to avoid: F(2, 36) = 3.34. CS freezing: F(2, 36) = 0.16; ITI freezing: F(2, 36) = 0.21. For group comparisons **P < 0.01, *P < 0.05 k, Linear regression of the changes in freezing behavior across test sessions as a function of changes in avoidance behavior. l, Schematic of the viral vector strategy and optical fiber placement for optogenetic stimulating of pPVTD2R–CeA axon terminals in the 2AA task. m, Fiber placements (Ctl, n = 7 mice; ChR, n = 10 mice). n-q, Avoidance rate (n), latency to avoid (o) and freezing time during the CS (p) and ITI (q) across training sessions for both groups. r-u, Top: Avoidance rate (r), latency to avoid (s) and freezing time during the CS (t) and the ITI (u) during optogenetic stimulation of pPVTD2R–CeA axon terminals. Bottom: Normalization to Day 1 for each group. Two-way ANOVA followed by two-stage linear step-up procedure of Benjamini, Krieger and Yekutieli. Avoidance rate: F(2, 30) = 5.43. Latency to avoid: F(2, 30) = 1.89. CS freezing: F(2, 30) = 0.88; ITI freezing: F(2, 30) = 0.66. For group comparisons **P < 0.01, *P < 0.05. v, Linear regression of the changes in freezing behavior across test sessions as a function of changes in avoidance behavior. All data in figure shown as mean ± s.e.m.
Extended Data Figure 9. Optogenetic inhibition of pPVTD2R–NAc or pPVTD2R–CeA axon terminals in the 2AA task, related to Figure 8.
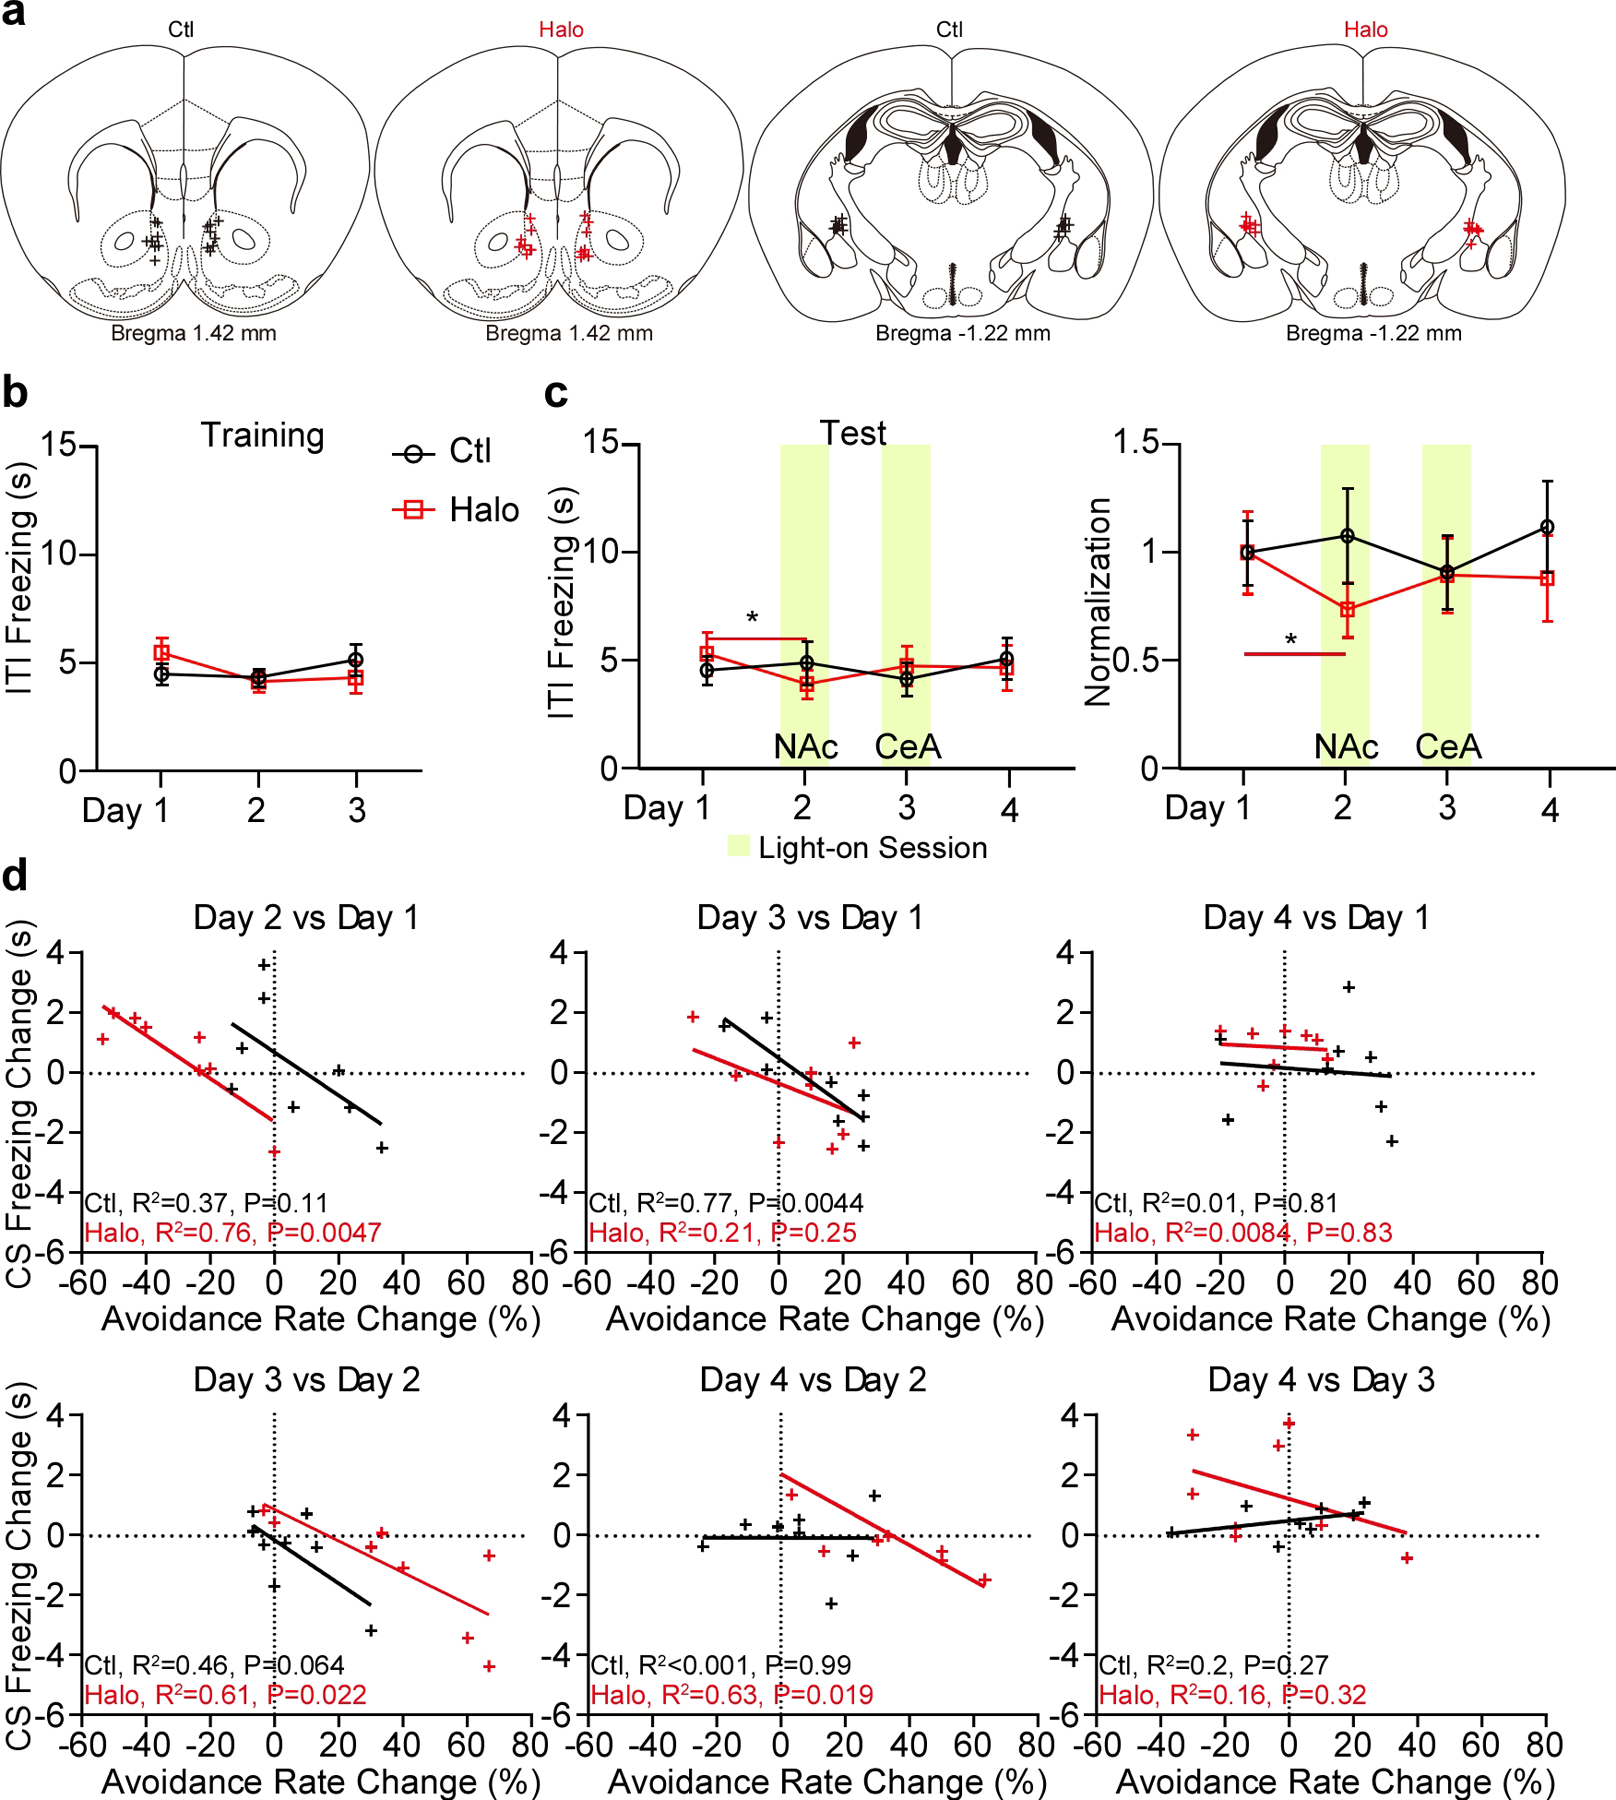
a, Optical fiber placements (n = 8 mice per group). b, Freezing time during the ITI across training sessions for both Ctl and Halo groups. c, Left: Effect of optogenetic inhibition of pPVTD2R–NAc axon terminals (Day 2) and pPVTD2R–CeA axon terminals (Day 3) on ITI freezing. Right: Normalization to Day 1 for each group. Two-way ANOVA followed by two-stage linear step-up procedure of Benjamini, Krieger and Yekutieli. F(3, 42) = 1.08; Halo, Day 1 vs Day 2 *P = 0.032. d, Linear regression of the changes in freezing behavior across test sessions as a function of changes in avoidance behavior. All data in figure shown as mean ± s.e.m.
Figure 10. Monosynaptic inputs of NAc– and CeA–projecting neurons of the pPVT.
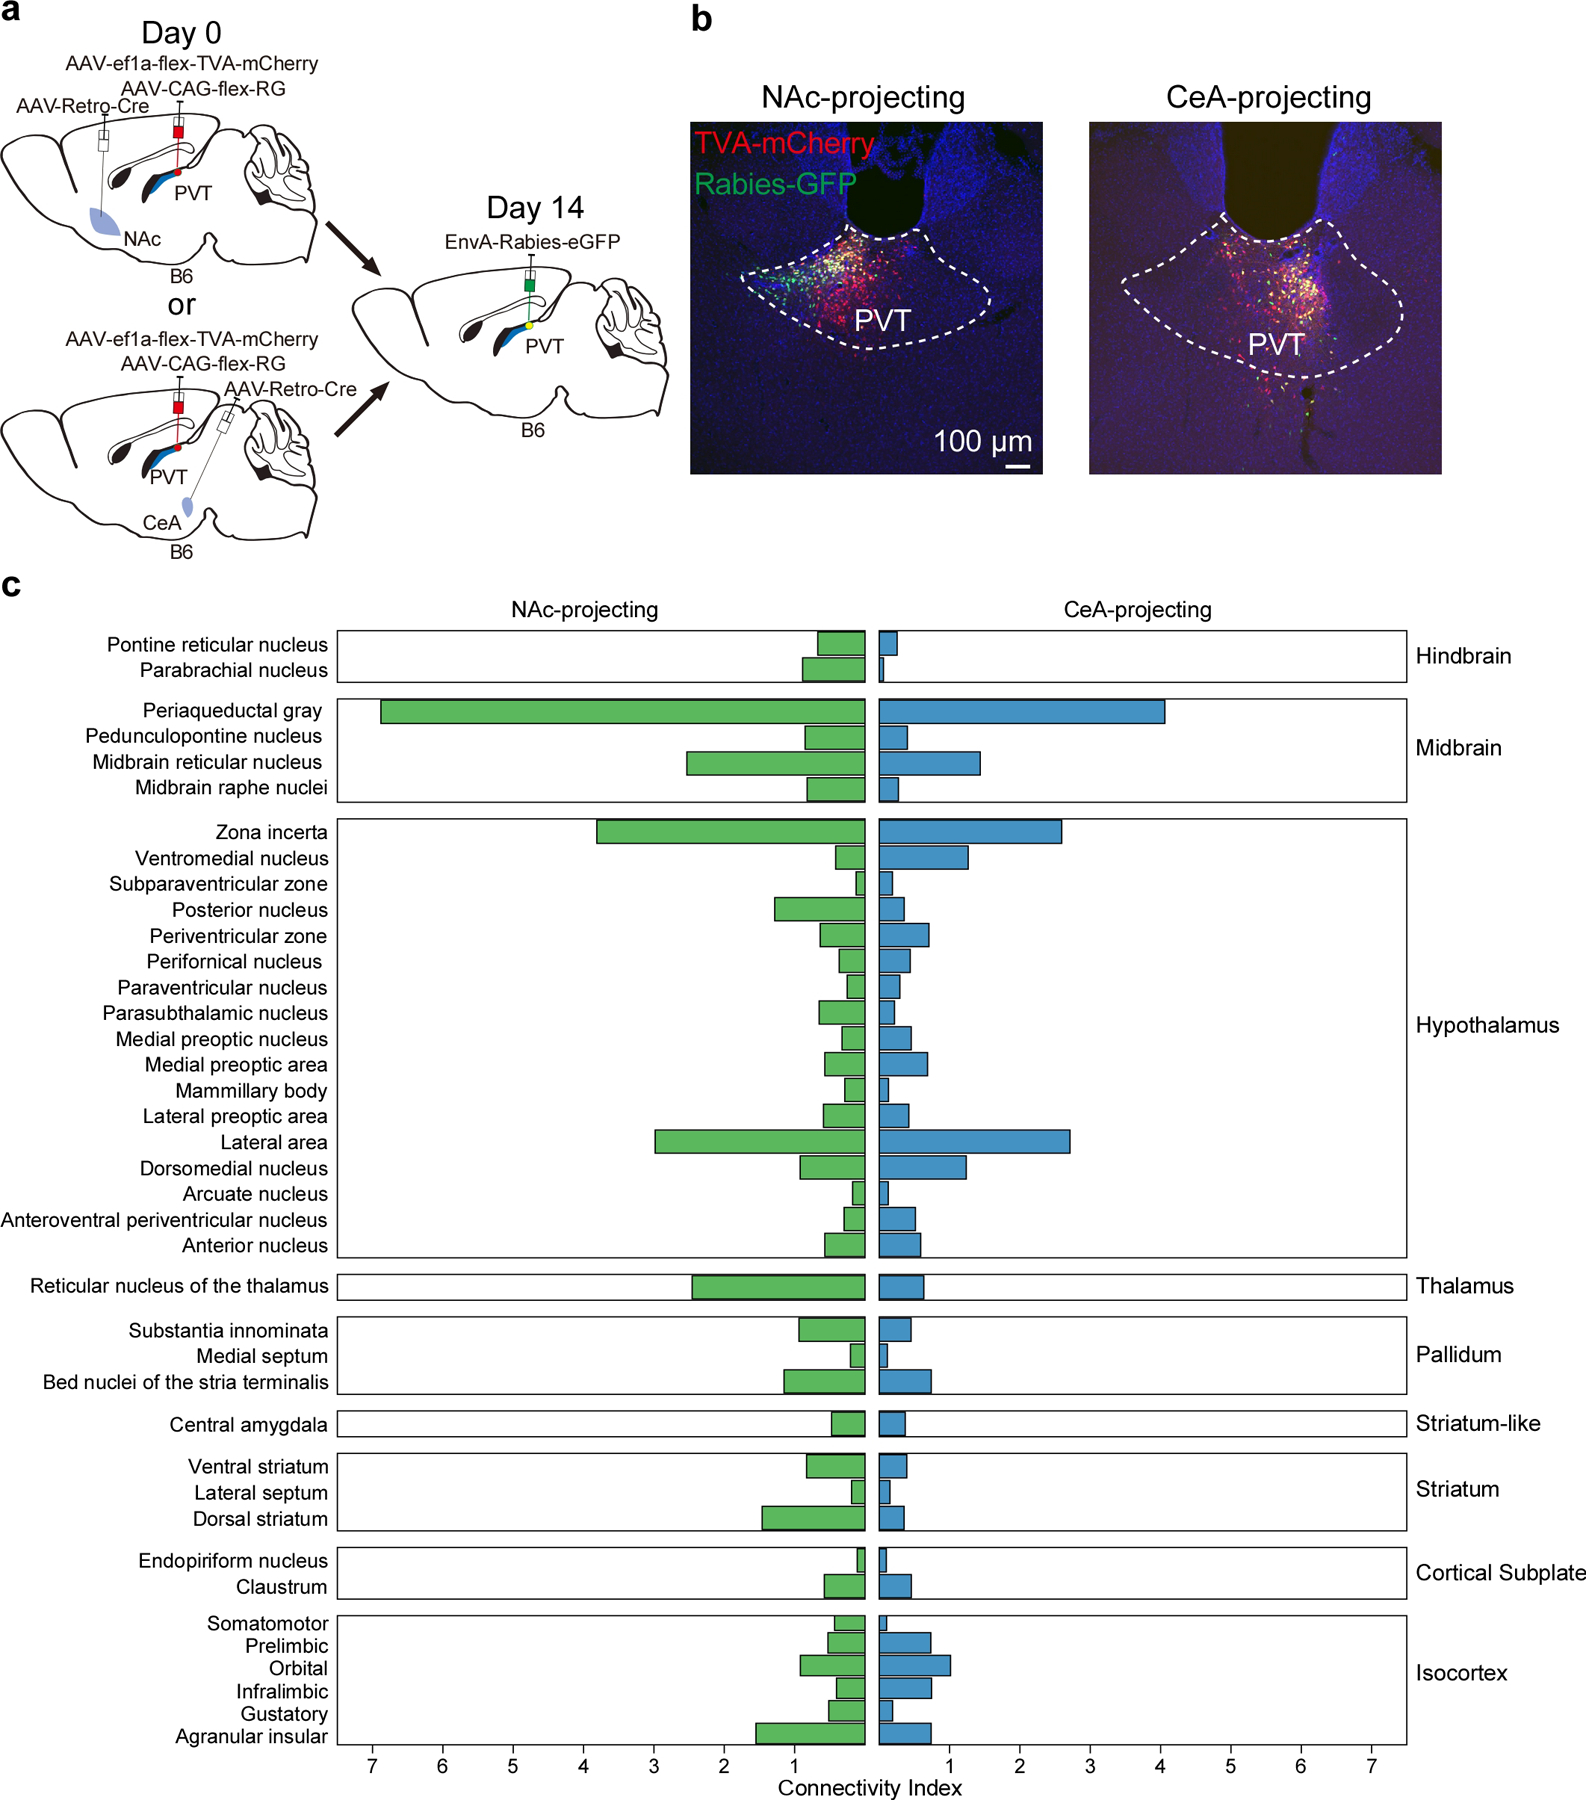
a, Schematic of the viral vector strategy to trace the inputs to NAc–projectors or CeA–projectors in pPVT. b, Representative images showing the rabies starter cells (Rabies-GFP and TVA-mCherry double-labelled cells) in pPVT neurons. c, Quantification of monosynaptic inputs to NAc–projectors or CeA–projectors in pPVT. NAc–projectors, n = 3 mice; CeA–projectors, n = 2 mice. To normalize retrogradely labeled (GFP+) cells between subjects, a connectivity index for each brain region was computed by dividing the number of retrogradely labeled cells by the number of starter cells (See Methods).
Supplementary Material
ACKNOWLEDGEMENTS
We thank former NIMH postbac Nicholas Ringelberg for gathering preliminary findings that encouraged some aspects of the present study. In addition, we thank the NIMH IRP Rodent Behavioral Core for their support with the development of the custom apparatus for the 2AA task, the NIMH IRP Systems Neuroscience Imaging Resource for their support with the quantification of the rabies data, and Drs. Mark Hoon (NICHD) and Fabricio Do Monte (UT Health) for offering scientific and writing feedback. This work was supported by the NIMH Intramural Research Program (1ZIAMH002950, to M.A.P.; MH002951 and MH002952, to Y.C.)
Footnotes
COMPETING INTERESTS
The authors declare no competing interests.
REFERENCES
- 1.LeDoux JE Emotion circuits in the brain. Annu Rev Neurosci 23, 155–184, doi: 10.1146/annurev.neuro.23.1.155 (2000). [DOI] [PubMed] [Google Scholar]
- 2.Duvarci S & Pare D Amygdala microcircuits controlling learned fear. Neuron 82, 966–980, doi: 10.1016/j.neuron.2014.04.042 (2014). [DOI] [PMC free article] [PubMed] [Google Scholar]
- 3.Fanselow MS & Poulos AM The neuroscience of mammalian associative learning. Annu Rev Psychol 56, 207–234, doi: 10.1146/annurev.psych.56.091103.070213 (2005). [DOI] [PubMed] [Google Scholar]
- 4.Fadok JP et al. A competitive inhibitory circuit for selection of active and passive fear responses. Nature 542, 96–100, doi: 10.1038/nature21047 (2017). [DOI] [PubMed] [Google Scholar]
- 5.LeDoux JE, Moscarello J, Sears R & Campese V The birth, death and resurrection of avoidance: a reconceptualization of a troubled paradigm. Mol Psychiatry 22, 24–36, doi: 10.1038/mp.2016.166 (2017). [DOI] [PMC free article] [PubMed] [Google Scholar]
- 6.Cain CK Avoidance Problems Reconsidered. Curr Opin Behav Sci 26, 9–17, doi: 10.1016/j.cobeha.2018.09.002 (2019). [DOI] [PMC free article] [PubMed] [Google Scholar]
- 7.Krypotos AM, Effting M, Kindt M & Beckers T Avoidance learning: a review of theoretical models and recent developments. Front Behav Neurosci 9, 189, doi: 10.3389/fnbeh.2015.00189 (2015). [DOI] [PMC free article] [PubMed] [Google Scholar]
- 8.Mobbs D, Headley DB, Ding W & Dayan P Space, Time, and Fear: Survival Computations along Defensive Circuits. Trends Cogn Sci 24, 228–241, doi: 10.1016/j.tics.2019.12.016 (2020). [DOI] [PubMed] [Google Scholar]
- 9.Fanselow MS & Lester LS in Evolution and learning 185–212 (Lawrence Erlbaum Associates, Inc, 1988). [Google Scholar]
- 10.Mobbs D The ethological deconstruction of fear(s). Curr Opin Behav Sci 24, 32–37, doi: 10.1016/j.cobeha.2018.02.008 (2018). [DOI] [PMC free article] [PubMed] [Google Scholar]
- 11.Li H et al. Experience-dependent modification of a central amygdala fear circuit. Nat Neurosci 16, 332–339, doi: 10.1038/nn.3322 (2013). [DOI] [PMC free article] [PubMed] [Google Scholar]
- 12.Penzo MA et al. The paraventricular thalamus controls a central amygdala fear circuit. Nature 519, 455–459, doi: 10.1038/nature13978 (2015). [DOI] [PMC free article] [PubMed] [Google Scholar]
- 13.Bravo-Rivera C, Roman-Ortiz C, Brignoni-Perez E, Sotres-Bayon F & Quirk GJ Neural structures mediating expression and extinction of platform-mediated avoidance. J Neurosci 34, 9736–9742, doi: 10.1523/JNEUROSCI.0191-14.2014 (2014). [DOI] [PMC free article] [PubMed] [Google Scholar]
- 14.Ramirez F, Moscarello JM, LeDoux JE & Sears RM Active avoidance requires a serial basal amygdala to nucleus accumbens shell circuit. J Neurosci 35, 3470–3477, doi: 10.1523/JNEUROSCI.1331-14.2015 (2015). [DOI] [PMC free article] [PubMed] [Google Scholar]
- 15.Oleson EB, Gentry RN, Chioma VC & Cheer JF Subsecond dopamine release in the nucleus accumbens predicts conditioned punishment and its successful avoidance. J Neurosci 32, 14804–14808, doi: 10.1523/JNEUROSCI.3087-12.2012 (2012). [DOI] [PMC free article] [PubMed] [Google Scholar]
- 16.Choi JS, Cain CK & LeDoux JE The role of amygdala nuclei in the expression of auditory signaled two-way active avoidance in rats. Learn Mem 17, 139–147, doi: 10.1101/lm.1676610 (2010). [DOI] [PMC free article] [PubMed] [Google Scholar]
- 17.Moscarello JM & LeDoux JE Active avoidance learning requires prefrontal suppression of amygdala-mediated defensive reactions. J Neurosci 33, 3815–3823, doi: 10.1523/JNEUROSCI.2596-12.2013 (2013). [DOI] [PMC free article] [PubMed] [Google Scholar]
- 18.Beyeler A et al. Organization of Valence-Encoding and Projection-Defined Neurons in the Basolateral Amygdala. Cell Rep 22, 905–918, doi: 10.1016/j.celrep.2017.12.097 (2018). [DOI] [PMC free article] [PubMed] [Google Scholar]
- 19.Jimenez SA & Maren S Nuclear disconnection within the amygdala reveals a direct pathway to fear. Learn Mem 16, 766–768, doi: 10.1101/lm.1607109 (2009). [DOI] [PMC free article] [PubMed] [Google Scholar]
- 20.Maren S Neurotoxic basolateral amygdala lesions impair learning and memory but not the performance of conditional fear in rats. J Neurosci 19, 8696–8703 (1999). [DOI] [PMC free article] [PubMed] [Google Scholar]
- 21.Poremba A & Gabriel M Amygdala neurons mediate acquisition but not maintenance of instrumental avoidance behavior in rabbits. J Neurosci 19, 9635–9641 (1999). [DOI] [PMC free article] [PubMed] [Google Scholar]
- 22.Do-Monte FH, Quinones-Laracuente K & Quirk GJ A temporal shift in the circuits mediating retrieval of fear memory. Nature 519, 460–463, doi: 10.1038/nature14030 (2015). [DOI] [PMC free article] [PubMed] [Google Scholar]
- 23.Vertes RP & Hoover WB Projections of the paraventricular and paratenial nuclei of the dorsal midline thalamus in the rat. J Comp Neurol 508, 212–237, doi: 10.1002/cne.21679 (2008). [DOI] [PubMed] [Google Scholar]
- 24.Li S & Kirouac GJ Projections from the paraventricular nucleus of the thalamus to the forebrain, with special emphasis on the extended amygdala. J Comp Neurol 506, 263–287, doi: 10.1002/cne.21502 (2008). [DOI] [PubMed] [Google Scholar]
- 25.Dong X, Li S & Kirouac GJ Collateralization of projections from the paraventricular nucleus of the thalamus to the nucleus accumbens, bed nucleus of the stria terminalis, and central nucleus of the amygdala. Brain Struct Funct 222, 3927–3943, doi: 10.1007/s00429-017-1445-8 (2017). [DOI] [PubMed] [Google Scholar]
- 26.Arcelli P, Frassoni C, Regondi MC, De Biasi S & Spreafico R GABAergic neurons in mammalian thalamus: a marker of thalamic complexity? Brain Res Bull 42, 27–37 (1997). [DOI] [PubMed] [Google Scholar]
- 27.Fremeau RT Jr., Voglmaier S, Seal RP & Edwards RH VGLUTs define subsets of excitatory neurons and suggest novel roles for glutamate. Trends Neurosci 27, 98–103, doi: 10.1016/j.tins.2003.11.005 (2004). [DOI] [PubMed] [Google Scholar]
- 28.Beas BS et al. The locus coeruleus drives disinhibition in the midline thalamus via a dopaminergic mechanism. Nat Neurosci, doi: 10.1038/s41593-018-0167-4 (2018). [DOI] [PMC free article] [PubMed] [Google Scholar]
- 29.Gao C et al. Two genetically, anatomically and functionally distinct cell types segregate across anteroposterior axis of paraventricular thalamus. Nat Neurosci 23, 217–228, doi: 10.1038/s41593-019-0572-3 (2020). [DOI] [PMC free article] [PubMed] [Google Scholar]
- 30.Clark AM et al. Dopamine D2 Receptors in the Paraventricular Thalamus Attenuate Cocaine Locomotor Sensitization. eNeuro 4, doi: 10.1523/ENEURO.0227-17.2017 (2017). [DOI] [PMC free article] [PubMed] [Google Scholar]
- 31.McGinty JF & Otis JM Heterogeneity in the Paraventricular Thalamus: The Traffic Light of Motivated Behaviors. Frontiers in Behavioral Neuroscience 14, doi: 10.3389/fnbeh.2020.590528 (2020). [DOI] [PMC free article] [PubMed] [Google Scholar]
- 32.McNally GP Motivational competition and the paraventricular thalamus. Neurosci Biobehav Rev, doi: 10.1016/j.neubiorev.2021.02.021 (2021). [DOI] [PubMed] [Google Scholar]
- 33.Li Y, Dong X, Li S & Kirouac GJ Lesions of the posterior paraventricular nucleus of the thalamus attenuate fear expression. Front Behav Neurosci 8, 94, doi: 10.3389/fnbeh.2014.00094 (2014). [DOI] [PMC free article] [PubMed] [Google Scholar]
- 34.Kirouac GJ Placing the paraventricular nucleus of the thalamus within the brain circuits that control behavior. Neurosci Biobehav Rev 56, 315–329, doi: 10.1016/j.neubiorev.2015.08.005 (2015). [DOI] [PubMed] [Google Scholar]
- 35.Choi EA & McNally GP Paraventricular Thalamus Balances Danger and Reward. The Journal of neuroscience : the official journal of the Society for Neuroscience 37, 3018–3029 (2017). [DOI] [PMC free article] [PubMed] [Google Scholar]
- 36.Penzo MA & Gao C The paraventricular nucleus of the thalamus: an integrative node underlying homeostatic behavior. Trends Neurosci 44, 538–549, doi: 10.1016/j.tins.2021.03.001 (2021). [DOI] [PMC free article] [PubMed] [Google Scholar]
- 37.Watarai A et al. The blockade of oxytocin receptors in the paraventricular thalamus reduces maternal crouching behavior over pups in lactating mice. Neurosci Lett 720, 134761, doi: 10.1016/j.neulet.2020.134761 (2020). [DOI] [PubMed] [Google Scholar]
- 38.Zhu Y, Wienecke CF, Nachtrab G & Chen X A thalamic input to the nucleus accumbens mediates opiate dependence. Nature 530, 219–222, doi: 10.1038/nature16954 (2016). [DOI] [PMC free article] [PubMed] [Google Scholar]
- 39.Meffre J et al. Orexin in the Posterior Paraventricular Thalamus Mediates Hunger-Related Signals in the Nucleus Accumbens Core. Curr Biol, doi: 10.1016/j.cub.2019.07.069 (2019). [DOI] [PubMed] [Google Scholar]
- 40.Otis JM et al. Paraventricular thalamus projection neurons integrate cortical and hypothalamic signals for cue-reward processing. Neuron 102, doi: 10.1016/j.neuron.2019.05.018. (2019). [DOI] [PMC free article] [PubMed] [Google Scholar]
- 41.Labouebe G, Boutrel B, Tarussio D & Thorens B Glucose-responsive neurons of the paraventricular thalamus control sucrose-seeking behavior. Nat Neurosci 19, 999–1002, doi: 10.1038/nn.4331 (2016). [DOI] [PMC free article] [PubMed] [Google Scholar]
- 42.Beas BS et al. A ventrolateral medulla-midline thalamic circuit for hypoglycemic feeding. Nat Commun 11, 6218, doi: 10.1038/s41467-020-19980-7 (2020). [DOI] [PMC free article] [PubMed] [Google Scholar]
- 43.Ong ZY, Liu JJ, Pang ZP & Grill HJ Paraventricular Thalamic Control of Food Intake and Reward: Role of Glucagon-Like Peptide-1 Receptor Signaling. Neuropsychopharmacology 42, 2387–2397, doi: 10.1038/npp.2017.150 (2017). [DOI] [PMC free article] [PubMed] [Google Scholar]
- 44.Keyes PC et al. Orchestrating Opiate-Associated Memories in Thalamic Circuits. Neuron 107, 1113–1123e1114, doi: 10.1016/j.neuron.2020.06.028 (2020). [DOI] [PMC free article] [PubMed] [Google Scholar]
- 45.Namburi P et al. A circuit mechanism for differentiating positive and negative associations. Nature 520, 675–678, doi: 10.1038/nature14366 (2015). [DOI] [PMC free article] [PubMed] [Google Scholar]
- 46.Rogers-Carter MM, Djerdjaj A, Gribbons KB, Varela JA & Christianson JP Insular Cortex Projections to Nucleus Accumbens Core Mediate Social Approach to Stressed Juvenile Rats. J Neurosci 39, 8717–8729, doi: 10.1523/JNEUROSCI.0316-19.2019 (2019). [DOI] [PMC free article] [PubMed] [Google Scholar]
- 47.Schiff HC et al. An Insula-Central Amygdala Circuit for Guiding Tastant-Reinforced Choice Behavior. J Neurosci 38, 1418–1429, doi: 10.1523/JNEUROSCI.1773-17.2017 (2018). [DOI] [PMC free article] [PubMed] [Google Scholar]
- 48.Beier KT et al. Circuit Architecture of VTA Dopamine Neurons Revealed by Systematic Input-Output Mapping. Cell 162, 622–634, doi: 10.1016/j.cell.2015.07.015 (2015). [DOI] [PMC free article] [PubMed] [Google Scholar]
- 49.Heymann G et al. Synergy of Distinct Dopamine Projection Populations in Behavioral Reinforcement. Neuron 105, 909–920e905, doi: 10.1016/j.neuron.2019.11.024 (2020). [DOI] [PMC free article] [PubMed] [Google Scholar]
- 50.Kim EJ, Juavinett AL, Kyubwa EM, Jacobs MW & Callaway EM Three Types of Cortical Layer 5 Neurons That Differ in Brain-wide Connectivity and Function. Neuron 88, 1253–1267, doi: 10.1016/j.neuron.2015.11.002 (2015). [DOI] [PMC free article] [PubMed] [Google Scholar]
- 51.Ren J et al. Anatomically Defined and Functionally Distinct Dorsal Raphe Serotonin Sub-systems. Cell 175, 472–487e420, doi: 10.1016/j.cell.2018.07.043 (2018). [DOI] [PMC free article] [PubMed] [Google Scholar]
- 52.Wallace ML et al. Genetically Distinct Parallel Pathways in the Entopeduncular Nucleus for Limbic and Sensorimotor Output of the Basal Ganglia. Neuron 94, 138–152e135, doi: 10.1016/j.neuron.2017.03.017 (2017). [DOI] [PMC free article] [PubMed] [Google Scholar]
- 53.Laughlin LC, Moloney DM, Samels SB, Sears RM & Cain CK Reducing shock imminence eliminates poor avoidance in rats. Learn Mem 27, 270–274, doi: 10.1101/lm.051557.120 (2020). [DOI] [PMC free article] [PubMed] [Google Scholar]
- 54.De Franceschi G, Vivattanasarn T, Saleem AB & Solomon SG Vision Guides Selection of Freeze or Flight Defense Strategies in Mice. Curr Biol 26, 2150–2154, doi: 10.1016/j.cub.2016.06.006 (2016). [DOI] [PubMed] [Google Scholar]
REFERENCES CITED IN METHODS
- 55.Penzo MA et al. The paraventricular thalamus controls a central amygdala fear circuit. Nature 519, 455–459, doi: 10.1038/nature13978 (2015). [DOI] [PMC free article] [PubMed] [Google Scholar]
- 56.Beas BS et al. The locus coeruleus drives disinhibition in the midline thalamus via a dopaminergic mechanism. Nat Neurosci, doi: 10.1038/s41593-018-0167-4 (2018). [DOI] [PMC free article] [PubMed] [Google Scholar]
- 57.Gao C et al. Two genetically, anatomically and functionally distinct cell types segregate across anteroposterior axis of paraventricular thalamus. Nat Neurosci 23, 217–228, doi: 10.1038/s41593-019-0572-3 (2020). [DOI] [PMC free article] [PubMed] [Google Scholar]
- 58.Choi JS, Cain CK & LeDoux JE The role of amygdala nuclei in the expression of auditory signaled two-way active avoidance in rats. Learn Mem 17, 139–147, doi: 10.1101/lm.1676610 (2010). [DOI] [PMC free article] [PubMed] [Google Scholar]
- 59.Haynes K, Fearnhead P & Eckley IA A computationally efficient nonparametric approach for changepoint detection. Stat Comput 27, 1293–1305, doi: 10.1007/s11222-016-9687-5 (2017). [DOI] [PMC free article] [PubMed] [Google Scholar]
Associated Data
This section collects any data citations, data availability statements, or supplementary materials included in this article.
Supplementary Materials
Data Availability Statement
All the data that support the findings presented in this study are available from the corresponding author upon reasonable request. Source Data are provided with this paper, and are publicly available at the following repository: https://github.com/Penzolab/Source-Data-07092021.git.


