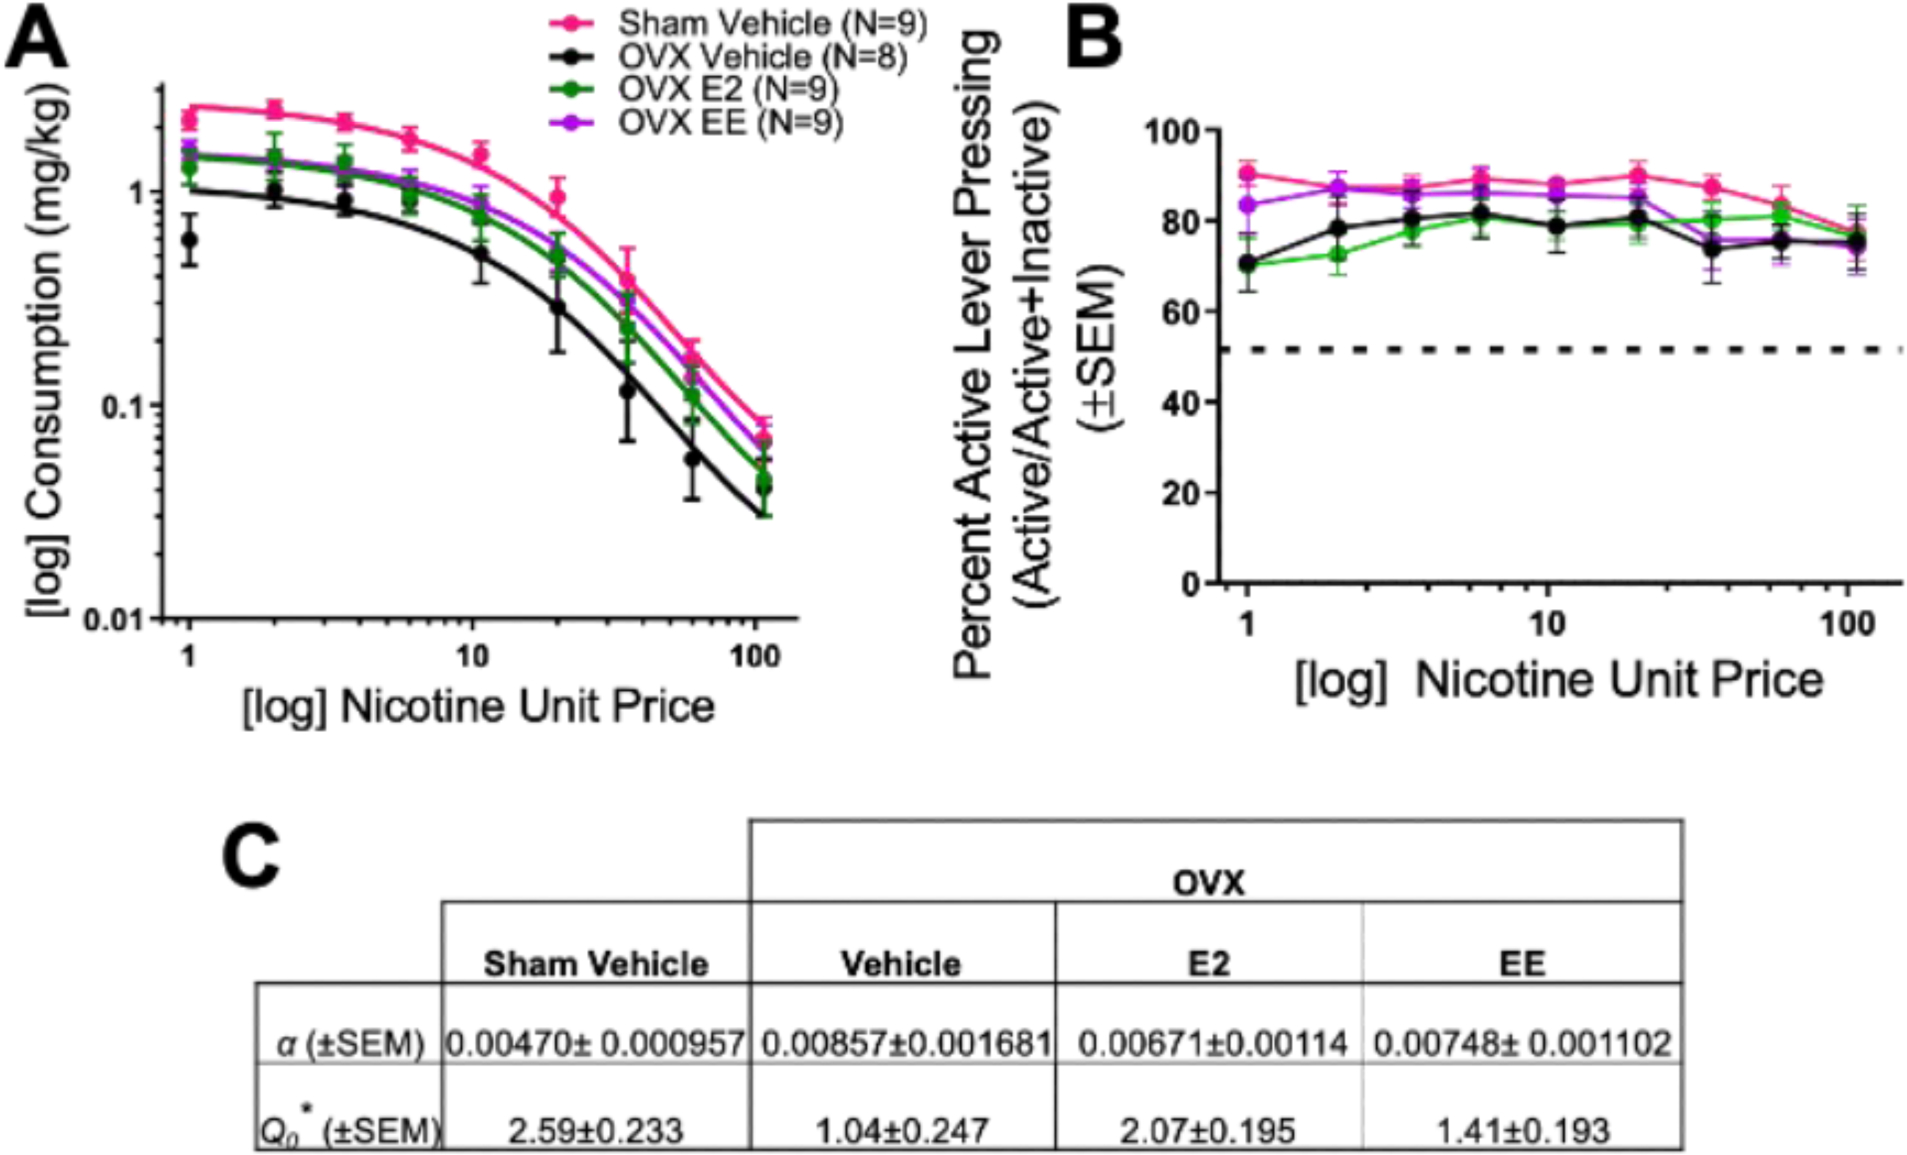
Figure 2.

Nicotine demand data for sham and OVX groups are shown in (A), with the percent active lever pressing (active lever presses divided by active + inactive lever presses) across increasing unit price during the demand phase (B; the dotted line represents chance at 50%). (C) Parameter estimates for Q0 and α (asterisks indicates significant main effect of group, p < 0.0001). SEM = standard error of the mean; OVX = ovariectomized.
