

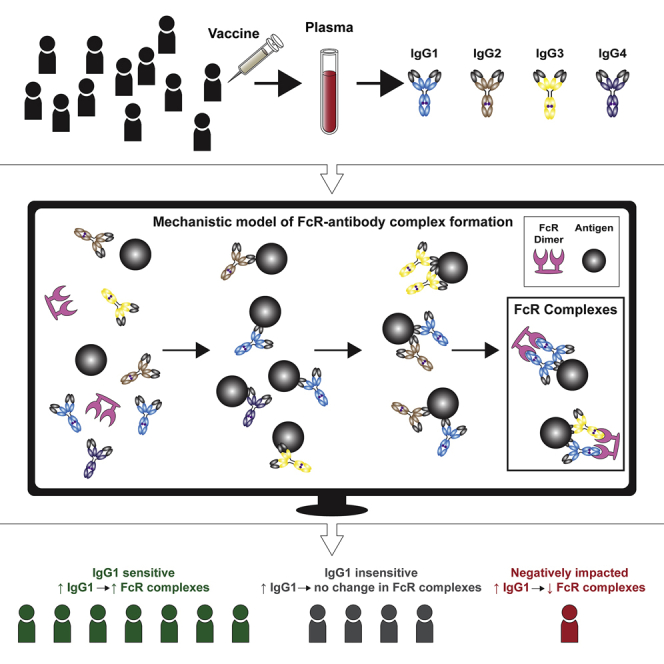
Summary
Immunoglobulin G (IgG) antibodies that activate Fc-mediated immune functions have been correlated with vaccine efficacy, but it is difficult to unravel the relative roles of multiple IgG and Fc receptor (FcR) features that have the capacity to influence IgG-FcR complex formation but vary on a personalized basis. Here, we develop an ordinary differential-equation model to determine how personalized variability in IgG subclass concentrations and binding affinities influence IgG-FcγRIIIa complex formation and validate it with samples from the HIV RV144 vaccine trial. The model identifies individuals who are sensitive, insensitive, or negatively affected by increases in HIV-specific IgG1, which is validated with the addition of HIV-specific IgG1 monoclonal antibodies to vaccine samples. IgG1 affinity to FcγRIIIa is also prioritized as the most influential parameter for dictating activation broadly across a population. Overall, this work presents a quantitative tool for evaluating personalized differences underlying FcR activation, which is relevant to ongoing efforts to improve vaccine efficacy.
Keywords: systems serology, Fc receptor, IgG, RV144, HIV, vaccine, ADCC, ODE model, sensitivity analysis, precision medicine
Graphical abstract
Highlights
Fc-mediated immune functions have been correlated with protection in HIV vaccine trials
A model reveals personalized mechanisms that drive variation in FcγR activation
The model predicts individuals who are sensitive to changes in IgG1 concentration
IgG1 affinity to FcγR best dictates activation across a heterogeneous population
Fc-mediated immune functions have been identified as a correlate of protection in vaccine trials for HIV and other pathogens. Lemke et al. present a quantitative tool to understand how personalized differences in antibody and Fc receptor features contribute to variation in FcR activation after vaccination.
Introduction
Vaccines are a cornerstone of modern-day global public health interventions, with neutralizing antibody (Ab) titers used as the most common correlate of protection.1,2 For antigenically variable pathogens (including HIV), induction of long-lasting, broadly neutralizing antibodies via vaccination has been challenging because they quickly escape the highly specific antibody recognition required for neutralization.1, 2, 3, 4 Instead, a number of recent studies have highlighted the importance of cellular Fc effector functions, including Ab-dependent cellular cytotoxicity (ADCC) and Ab-dependent cellular phagocytosis (ADCP), which are activated when the Ab Fc region forms immune complexes with antigens and Fc receptors on innate immune cells.5, 6, 7, 8 The only human HIV vaccine trial to demonstrate significant efficacy to date (the RV144 Thai trial: 60% efficacy at 1 year and 31.2% efficacy at 3.5 years after vaccination) did not induce broadly neutralizing Abs.9, 10, 11, 12 Instead, follow-up analysis identified non-neutralizing Abs with the capacity to mediate Fc effector functions, including ADCC, increased Ab avidity to HIV envelope protein (env) and tier-1-neutralizing antibodies as correlates of reduced infection risk10. These results and others from passive Ab-transfer, macaque studies underscore the importance of Fc effector functions in vaccine-mediated protection against HIV and other antigenically variable pathogens.13,14 Since RV144, a number of follow-up HIV vaccine trials have been designed to improve immunogenicity by including additional vaccine boosts, by varied DNA priming, or by changing the vaccine adjuvant, with limited success.15, 16, 17, 18, 19, 20 The inability to replicate RV144 results and achieve widespread protection in subsequent trials highlights the need to better understand the quantitative mechanisms that underpin Fc receptor (FcR) activation after vaccination and how those mechanisms may vary across populations of individuals.
The formation of immune complexes that activate Fc effector functions is highly variable in individuals and is determined by personalized Ab and FcR features that are modulated by host genetics and post-translational alterations (Figure S1).21 The relative concentration of pathogen-specific immunoglobulin G (IgG) Ab subclasses can vary widely among individuals (although generally by rank order IgG1 > IgG2 > IgG3 > IgG4). IgG subclasses also bind with varying affinities to FcγRs (in general, IgG1 and IgG3 engage all FcγRs with comparatively greater affinity than do IgG2 or IgG4 [Figure 1C; Table S1]), and additional affinity variation occurs in individuals as a result of genetic and post-translational modifications, such as FcR polymorphisms, IgG allotypes, and IgG glycosylation.22 Previous studies have confirmed that differences in IgG subclass concentrations influence Fc activation and decline with time after vaccination.23,24 Analysis of RV144 samples indicated that elevated levels of IgG1 and IgG3 were associated with an improved Fc-effector profile, and depletion of IgG3 resulted in decreased Fc effector functions.23 Follow-up analysis of RV144 also revealed that a decrease in vaccine efficacy over time (60% at 1 year to 31.5% at 3.5 years after vaccination)10 paralleled a rapid decrease in HIV-specific IgG3 levels after vaccination (from >80% at 2 weeks after infection23 to 3% by week 52). To combat that decline in pathogen-specific IgGs over time and to improve Fc effector functions, vaccine “boosting” regimens (repeated vaccination) have been developed. Paradoxically, however, repeated vaccination may have negative effects by skewing subclass profiles toward IgG2 and IgG4, which bind FcRs with weaker affinity and induce weaker Fc effector functions. VAX003 (a predecessor to RV144) vaccine trials demonstrated that repeated vaccine boosting (seven repeated vaccines over 3.5 years) elevated total IgG antibody levels but skewed subclass profiles (elevated IgG2 and IgG4) to less-functional Fc responses.23,25, 26, 27 Overall, these studies suggest that IgG subclass concentration profiles are critical for dictating Fc effector complex formation,23 but personalized variability makes it challenging to identify which humoral response components elicit optimal Fc activation, especially in the context of other factors (such as FcR polymorphisms and IgG glycosylation) that have the capacity to influence parallel changes in IgG-FcR binding.
Figure 1.

Model schematic
(A) An example set of reversible reactions describing the sequential binding of IgG1 to antigen (ant) and dimeric FcγR with the respective forward (kon) and reverse (koff) reaction rates.
(B) Ordinary differential equations were used to predict total HIV ant-IgG-FcγR complexes formed as a function of concentration and binding affinity of ant, IgG subclasses, and FcγR. The model assumes a single FcγR type. Reversible reactions are represented by double-ended arrows. Model output was the sum of all dimeric FcγR complexes formed (boxed in black) at steady state.
(C) The baseline parameters for FcγRIIIa-V158 complex formation with the following sources: αSPR measurement from pooled purified IgG from HIV infected individuals. All IgG subtypes share one affinity value (unpublished data). βKeq measured in Bruhns et al..28γThe average estimated IgG concentrations from individuals 1–30 in the RV144 data in this manuscript (see STAR Methods for notes on conversion from MFI to mM unit). δConcentrations used in the multiplex experimental protocol.
(D) Equations describing the example reactions in (A). Reactions follow mass-action kinetics and consist of a forward reaction (on rate, kon, multiplied by the concentrations of the substrates) and a reverse reaction (off rate, koff, multiplied by the concentration of the product of the forward reaction). Differential equations for change in each complex over time were generated for each complex. See also Table S1 and Figure S1.
Antigen-specific antibody FcγR immune complex formation can be detected in vaccine samples using recently developed recombinant FcγR dimers, which have been described as a high-throughput and sensitive method that mimics FcγR engagement at the immunological synapse.29 Formation of these FcγR immune complexes correlates with a range of in vitro cellular Fc effector assays, including ADCC and ADCP, and these complexes are now widely used as surrogate high-throughput assays to assess Fc effector functions against a range of diseases, including HIV, influenza, and malaria.30, 31, 32, 33, 34 In parallel, newly developed methodologies in systems serology research have employed “data-driven” (also called “machine learning”) computational approaches to identify unique humoral signatures of IgG and FcR features that characterize vaccine responses.21,23,35, 36, 37 This approach has been valuable for identifying systems of antibody and FcR features that are associated with a vaccine response or cellular function, although one remaining challenge is that they do not provide mechanistic insight into the relationship between personalized differences in IgG and FcR features and vaccine response heterogeneity in populations of individuals. Here, we use an ordinary differential equation (ODE) approach to elucidate IgG and FcγR features that account for personalized differences in IgG-FcγR complex formation and validate a model for HIV target epitopes in human vaccine samples. With this model, we are able to identify mechanisms by which individuals may be differentially sensitive to the RV144 vaccine, and we validate results experimentally with the addition of HIV-specific monoclonal Abs (mAbs) to individual vaccinee samples. Using a personalized sensitivity analysis, we also identify parameters that would best influence complex formation broadly across a population of individuals. Overall, this approach provides a quantitative framework for understanding how personalized differences in IgG and FcR features contribute to variability in IgG-FcR complex formation after vaccination.
Results
Model predictions of IgG-FcR complex formation validated in an Fc multiplex assay
To gain insight into how IgG and FcR variability in individuals may influence IgG-FcR complex formation, we constructed an ODE model to predict total bound, dimeric antigen-IgG-FcγR complexes formed at steady state (ant:IgG:IgG:FcγR-FcγR) as a function of concentration and binding of IgG1, IgG2, IgG3, and IgG4 to antigen and FcγR (Figure 1). The model assumed two IgG binding sites per antigen protein to represent the simplest complex that reflects activation through FcγR cross-linking. Total ant:IgG:IgG:FcγR-FcγR complex formation was chosen as the output because antigen-specific IgG crosslinking of FcγR (engagement and clustering of multiple FcγRs) induces the activation of innate immune effector cells to mediate Fc functions and can be compared with steady-state experimental values measured using high-throughput multiplex assays. Importantly, we constructed the model such that it could be applied to any target antigen and FcR, although we chose to focus primarily on the HIV env glycoprotein 120 (gp120) strain A244 (env), one of the proteins used in the RV144 vaccine regimen, and FcγRIIIa, the FcγR upstream of ADCC (a correlate of protection in RV144 trial).10 To obtain parameters, we measured median fluorescent intensity (MFI) of antigen-specific IgG1, IgG2, IgG3, and IgG4 in 105 RV144 vaccinee plasma samples and estimated personal concentrations based on a reference IgG1 concentration (Figure 1C).38 Although not useful for absolute concentration predictions, these estimated concentrations allowed for predictions of relative complex formation. We approximated baseline affinity parameters for pooled IgG to antigen from surface plasmon resonance (SPR) measurements of HIV-infected patient plasma (Figure 1C). Affinity for each antigen-specific IgG subclass to each FcγR was estimated from previously published literature (Figure 1C; Table S1; the low concentration of antigen-specific IgG subclasses in plasma makes it technically difficult perform SPR on each subclass for each individual).28 We used this information to predict relative ant:IgG:IgG:FcγR-FcγR complex formation (nM) in each individual and validated it with matched experimental measurements (MFI) of dimeric, recombinant, soluble (rsFcγR) complex formation measured in multiplex assays (as described above) in a subset of the same individuals (n = 30).33 We validated the model for two FcγRIIIa polymorphisms, including higher-affinity FcγRIIIa-V158 (Figures 2A and S2A) and lower-affinity FcγRIIIa-F158 (Figure S2B), along with FcγRIIa-H131 (Figure S2C), finding good agreement between rank-order model-concentration predictions and experimental MFI measurements in a log10-log10 space, in which MFI and concentration are expected to have a linear relationship within the dynamic range (Spearman ρ = 0.92, root-mean-square error [RMSE] = 246.0; Spearman ρ = 0.90; Spearman ρ = 0.89, respectively; all p < 0.0001). We also performed validation for one other target antigen: HIV clade B gp120 from the BaL strain with FcγRIIa-H131, FcγRIIIa-F158, and FcγRIIIa-V158, again, finding good agreement between rank-order model predictions and experimental measurements, despite the lower concentrations leaving the linear dynamic range (Spearman ρ = 0.96, ρ = 0.95 and ρ = 0.98, respectively, for HIV clade B gp120 BaL; all p < 0.0001; Figures S2D–S2F). Although model predictions closely mirrored experimental measurements in most individuals, they were moderately less accurate for individuals with higher FcR complex formation. Careful inspection, most visibly for FcγRIIIa-F158, revealed that these individuals (especially vaccinees 4, 12, 18, and 23; Figures 2A and S2) were unique in that all had IgG1 concentrations greater than 1 SD above the group average. We speculate that minor deviations in this group may be due to the fact that our baseline model used average binding affinity parameters (for env and for FcγRIIIa) that do not accurately reflect personalized differences that may arise from glycosylation or Ab Fab epitope recognition, which we predict would have a greater influence on individuals with high IgG1 (discussed in greater detail below).These differences may also arise from differences in units of model output and experimental measurements (concentration versus median fluorescent intensity [MFI], respectively).
Figure 2.

Model validation and global sensitivity analysis for HIV env and RV144 samples
(A) Model predictions for dimeric FcγRIIIa-V158 complex formation were compared with rsFcγRIIIa-V158 multiplex experimental measurements for 30 RV144 vaccinee samples (labeled 1–30) (Spearman correlation coefficient of 0.92, p < 0.0001).
(B and C) A global uncertainty and sensitivity analysis39 of initial concentration (B) and binding parameters (C), in which partial rank-correlation coefficient (PRCC) indicates output sensitivity to parameters. kon indicates forward reaction rates, and koff indicates reverse reaction rates. ∗p < 0.05, ∗∗p < 0.01, ∗∗∗p < 0.001, >∗∗∗p < 0.0001.
See also Figures S2, S3, and S4.
Sensitivity analysis highlights the importance of IgG1 and IgG3 for HIV env activation of FcγRIIIa
Focusing on HIV env gp120 strain A244 (env), the main protein antigen used in RV144, and FcγRIIIa, the main FcR involved in natural killer (NK) cell-mediated ADCC, we next performed a global uncertainty and sensitivity analysis39 to identify parameters that are key drivers in activating the formation of the env-IgG-FcγRIIIa complex. In this analysis, complex formation (output) was calculated for 2,000 unique sets of parameter values (i.e., IgG1–4 concentrations and binding affinities to env and FcγRIIIa, respectively), sampled from uniform-probability density functions tailored to each parameter (Figure 1C). Notably, partial rank-correlation coefficients (PRCCs) calculated for each parameter (initial concentrations and affinities) suggested that IgG1 and IgG3 were the only globally significant subclasses. For these parameters, higher PRCC values indicated greater influence on complex formation. IgG1 and IgG3 parameters were important in terms of both concentration (PRCC = 0.79 and 0.12, respectively) and affinities to FcR (kon PRCC = 0.45 and 0.06, respectively) and HIV (IgG1 kon PRCC = 0.08), with IgG1 considerably more sensitive than IgG3 parameters (Figures 2B and 2C). This was unsurprising given that both have a high affinity to FcγRIIIa and greater relative average plasma concentration compared with other subclasses (Figure 1C). The importance of IgG1 and IgG3 parameters was also observed for the lower-affinity FcγRIIIa polymorphism (FcγRIIIa-F158) (Figure S3). The sensitivity analysis also illustrated that IgG1 and IgG3 affinity to FcRs was more influential than IgG1 and IgG3 affinity to the HIV env, emphasizing the possible greater importance of genetic and post-translation modifications that influence Ab Fc region affinity (such as glycosylation and FcR polymorphisms) over modifications that influence Fab affinity to the target. Although this analysis was focused on monomeric gp120 because of its relevance to RV144, the fact that IgG1 affinity to env was not a critical parameter in the model suggests that strain-related differences in affinity would not influence results. Interestingly, FcR complex formation was also significantly sensitive to env and FcR concentrations, which has implications for variability in FcR complex formation in tissue compartments with different levels of FcR expression and virus dissemination. To start with the simplest possible model, IgG binding cooperativity was not initially included in the model. To determine whether that could influence results, a second model framework was created in which a cooperativity constant (kc) was included for every binding interaction of a second IgG.40 A global sensitivity analysis for each FcR (kc was varied from 0.01 to 100) indicated that the cooperativity constant was not a significant parameter in any of the models and, so, was not included in the remaining analysis (Figure S4).
Model reveals personalized differences in the benefit of increasing IgG1
Because IgG1 and IgG3 concentration were both identified as sensitive parameters in the global sensitivity analysis and correlated with enhanced Fc functions in the RV144 trial, we used the model to further explore the landscape of complex formation as IgG1 and IgG3 concentration were altered together over 2,500 physiologically relevant combinations to predict complex formation (Figure 3A). This analysis predicted a sensitive range of IgG1 concentration between 18 and 252 nM, in which small changes in HIV-specific IgG1 would increase complex formation, but insensitivity above that range. The model additionally suggested that increases in IgG3 concentration could lead to even greater complex formation starting at 4.6 nM, with a steeper slope to indicate more sensitivity to smaller increases in IgG3 and a much higher limit. The IgG3 occurred at IgG3 levels of 589 nM, 192× the median IgG3 concentration of the vaccinees (Figure S5A). Unexpectedly, this analysis illustrated how high IgG1 (greater than 252 nM) may negatively affect complex formation if IgG3 is also high (greater than 21.6 nM). Inspection revealed that this occurred because of a lower IgG1 binding affinity for FcγRIIIa compared with IgG3; therefore, at high concentrations, IgG1 can outcompete IgG3 for the env and reduce the overall affinity of immune complexes to FcγRIIIa. This effect is also seen in the lower affinity polymorphism FcγRIIIa-F158 (Figure S5B). Results from the global sensitivity analyses for FcγRIIa-H131 and FcγRIIa-R131 suggested that IgG1 parameters were even more dominant because of an even lower binding affinity of IgG3 for FcγRIIa compared with FcγRIIIa (Figure S3). Using experimentally measured values for env A244-specific IgG1 and IgG3 concentration in 105 RV144 participants, we plotted each individual on the generated predictive surface (Figure 3A) and found that unique combinations of IgG1 and/or IgG3 concentrations would be required to boost complex formation for each individual. A comparison of the gradient (slope) calculated from the surface for each vaccinee in their immediate IgG1 and IgG3 directions indicated that significantly more vaccinees fell in the IgG1-sensitive region (i.e., increasing IgG1 would result in increased complex formation) than in the IgG3-sensitive region (Wilcoxon matched-pairs signed-rank test; p < 0.0001; Figure 3B). Visual inspection of the surface also suggested that some individuals were predicted to be sensitive to both IgG1 and IgG3 (Figure 3A) and that a few were predicted to have reduced complex formation with increases in IgG1 levels also seen with a single negative IgG1 gradient (Figure 3B).
Figure 3.

Combined changes in IgG subclass concentrations identifies an optimal range of antigen-specific IgG1 and IgG3
(A) Model predictions for env:IgG:IgG:FcγRIIIa:FcγRIIIa complex formation at steady state (z axis) for 2,500 simulations over a range (0.004×–20×) of the IgG1 and IgG3 baseline initial concentration combinations (x and y axis). Grid colors represent complex formation levels, which were determined based on the IgG1 plateau: below the IgG1 plateau (<0.77 nM, white), on the IgG1 plateau (0.77–0.98 nM; pink), and above the IgG1 plateau (>0.98 nM, green). RV144 vaccinee samples (n = 105) were plotted (black circles) at their corresponding individual env-specific IgG1 and IgG3 concentrations.
(B) Gradients in the direction of IgG1 and IgG3 were calculated for each individual as a measure of the immediate sensitivity of each vaccinee to changes in IgG1 or IgG3 concentration. A two-tailed Wilcoxon matched-pairs signed-rank test indicated the IgG1 gradient was significantly greater than that of IgG3; p < 0.0001.
(C–F) Complex formation level achieved (below IgG1 plateau, white; on IgG1 plateau, pink; above IgG1 plateau, green) at baseline and under the following conditions: fold change of either IgG1, IgG3, or both at either 2× (C), 5× (D), 10× (E), or 20× (F) the individual baseline concentrations. The data labels on the stacked bar graph indicate the total number of vaccinees that achieved that respective activation level and all those below it.
See also Figure S5.
To illustrate this concept more concretely, we used the model to simulate a theoretical vaccine boosting regimen that increased HIV-specific IgG1 or IgG3 individually or simultaneously by 2×, 5×, 10×, and 20× in each individual. We categorized the complex formation achieved in relation to the complex formation on the IgG1 plateau by tallying the number of individuals that achieved a complex formation “below IgG1 plateau” (<0.77 nM), “on IgG1 plateau” (0.77–0.98 nM; on IgG1 plateau +10%), or “above IgG1 plateau” (>0.98 nM) in each case (Figures 3C–3F). Results illustrated how complex formation on the IgG1 plateau (pink bars; 0.77–0.98 nM) could be achieved in approximately one-quarter of individuals (27/105) with 2× IgG1 (Figure 3C) and in most (98/105) with 10× IgG1 (Figure 3E). Notably, however, complex formation above the IgG1 plateau (green bars; 0.98 nM) would require high IgG3 without an increase in IgG1. To reach complex formation above the IgG1 plateau, most individuals (72/105) would require at least 20× IgG3 (Figure 3F). Importantly, these IgG3 additions must occur without the addition of IgG1, which significantly decreased the proportion of complex formation above the IgG1 plateau in comparison with IgG3 alone in the 20× cases (binomial test; p = 0.0001; Figure 3F). The simulations also illustrated how large additions (20×) of IgG1 and IgG3 together could prevent complex formation above the IgG1 plateau because of competition between IgG1 and IgG3 to form complexes as described above. Intriguingly, two individuals in our population already had the capacity to induce complex formation above the IgG1 plateau at baseline; however, simulated boosting with IgG1 alone reduced complex formation on the IgG1 plateau in those individuals (Figures 3E and 3F). Although there were a limited number of IgG3-high individuals in the RV144 cohort evaluated in this study (n = 105), it is possible that more exist across the entire RV144 study (more than 16,000 participants), as well as in other related trials that employed boosting, including RV305 and RV306.16 Overall, these results suggest that vaccine interventions aimed at increasing HIV-specific IgG1 are expected to increase complex formation in most individuals, but reach a limit, and that different individuals are predicted to be sensitive to IgG1 based on proximity to that limit. Furthermore, they suggest that high concentrations of IgG1 may reduce complex formation in individuals with high levels of IgG3.
Experimental validation of IgG1 sensitivity predictions
To validate the concept of differential IgG1 sensitivity experimentally, we used the model to select a subset of individuals predicted to be insensitive or sensitive to IgG1 concentration and added a monoclonal IgG1 Ab to serum samples from those individuals. Because the multiplex assay requires high-affinity antibodies to ensure binding to the pathogen, we selected an HIV-specific IgG1 monoclonal antibody, PGT121, reported to bind with high avidity to clade B HIV-env proteins;13,41,42 however, PGT121 binds comparatively weakly to A244.43 We, therefore, measured clade B HIV BaL gp120-specific IgG subclass concentrations in each individual and plotted them on the generated IgG1 and IgG3 surface as described above (Figure 4A). We chose a group of individuals that the model predicted to be sensitive to increases in BaL IgG1 (we termed them “IgG1 responders”; blue; vaccinees 9, 15, 18, 19, 24, 26, 27, and 30) and a group that was predicted to not be sensitive to IgG1 (we termed them “IgG1 non-responders”; orange; vaccinees 1, 3, 4, 12, 13, 16, 22, and 29; Figure 4A) and added an HIV-specific IgG1 monoclonal Ab to each (34 and 140 nM) before measuring changes in IgG-FcγRIIIa complex formation with multiplex assays described above. Overall, model predictions were not significantly different than experimental measurements for both responders and non-responders at both concentrations (one-way ANOVA with multiple comparisons; non-responders: 34 nM, p > 0.9922; 140 nM, p > 0.9996; responders: 34 nM, p = 0.3581; 140 nM, p = 0.9258), and IgG1 responders demonstrated a significantly higher fold change in complex formation experimentally (5-fold and 7-fold) than non-responders did (1.3-fold and 1.3-fold) after addition of 34 and 140 nM IgG1 (one-way ANOVA with multiple comparisons; p = 0.0004 and p = 0.0150, respectively; Figure 4B). Model predictions were also significantly correlated with experimental measurements for responders and non-responders (Spearman; 34 nM addition: ρ = 0.80, p = 0.0003; 140 nM addition: ρ = 0.84, p = 0.0001; Figures S5C and S5D).
Figure 4.

Experimental validation of IgG1 sensitivity
(A) Measured gp120 BaL-specific initial IgG1 and IgG3 concentrations were used to predict FcγRIIIa-V158 complex formation at steady state (z axis) for RV144 vaccinee samples (n = 105; black circles). Individuals were selected based on predicted IgG1 sensitivity: “responders” (blue circles; vaccinees 9, 15, 18, 19, 24, 26, 27, and 30) and “non-responders” (orange circles; vaccinee 1, 3, 4, 12, 13, 16, 22, and 29).
(B and C) Model predictions (circle) and experimental measurements (triangle) of fold change in complex formation for IgG1 responders (blue) and non-responders (orange) with the addition of either 34 (B) or 140 (C) nM monoclonal PGT121 IgG1. ∗p < 0.05, ∗∗p < 0.01, ∗∗∗p < 0.001, >∗∗∗p < 0.0001, ns indicates p value ≥ 0.05 by ordinary one-way ANOVA.
See also Figure S5.
IgG1 allotype may significantly influence IgG-FcR complex formation
We next used the model to assess whether IgG concentration differences arising from genetic background could have significantly reduced FcγR-IgG complex formation in HVTN702 vaccinees compared with that of RV144. Recent work indicates IgG1 allotype can influence vaccine-specific IgG subclass distribution in individuals, with G1m1,3 generally having greater IgG1 and IgG3 but less IgG4 than G1m-1,3 and G1m1.44 These allotypes have been linked to ethnicity,45 with G1m1,3 allotype likely more prevalent in individuals of Asian ethnicity,46 and G1m-1,3 and G1m1 allotypes likely more prevalent in white individuals and in those of Black African ethnicity.45 One key question is whether IgG1 allotype-linked changes in IgG subclass concentrations could be sufficient to significantly reduce IgG-FcR complex formation in HVTN 702 vaccinees compared with RV144. We used IgG subclass distributions previously measured in HIV phase I vaccinees with known different allotypes44 to alter IgG1–4 concentrations in each RV144 vaccinee according to the other allotypes by calculating a conversion factor (Figure 5A). Thus, we were able to “project” RV144 data used in this study (likely high prevalence of G1m1,346) onto the G1m-1,3 and G1m1 allotypes expected to be prevalent in the HVTN 702 trial performed in South Africa45 (Figure 5B). Overall, the model predicted that there would be a significant reduction in IgG-FcR complex formation in G1m1 and G1m-1,3 allotypes, likely because of reductions in IgG1 for G1m1 and G1m-1,3 in comparison with G1m1,3 (rather than changes in IgG3 and IgG4). For this reason, the model suggests higher boosts of IgG1 concentration may be more important in the South African population of the HVTN 702 trial than it would be in the Thai population of the RV144 trial. Overall, results illustrate how this approach can be used as a hypothesis-testing tool to isolate and evaluate factors that may contribute to failed vaccine trials.
Figure 5.

IgG1 concentration differences resulting from Gm allotype are predicted to significantly alter FcR complex formation
(A) Conversion factors for each initial IgG concentration from G1m1,3 to indicated allotypes. Projections were simulated by multiplying each vaccinee’s initial IgG concentrations by the respective conversion factors and performing the simulations according to the baseline protocol.
(B) Model predicted complex formation for FcγRIIIa-V158 in G1m-1,3 (n = 105; black circles) and G1m1 (n = 105; white circles) compared with the original data, assumed to be G1m1,3 (n = 105; red circles) ∗p < 0.05, ∗∗p < 0.01, ∗∗∗p < 0.001, >∗∗∗p < 0.0001, using the Friedman test with Dunn’s multiple comparisons test.
IgG1 binding affinity for FcR is important for increasing FcγRIIIa complex formation broadly across a population
After observing the importance of varying individual sensitivities to two parameters (IgG1 and IgG3 concentration), we performed a personalized single-parameter sensitivity analysis for each individual in our study, predicting complex formation after altering each parameter over 0.004× to 20× baseline values for that person. A sensitivity metric (change in complex formation/change in the input parameter) was calculated for each parameter and used to illustrate the resulting personalized, single-parameter sensitivities (Figure 6A). We then evaluated complex formation “below IgG1 plateau” (<0.77 nM), “on IgG1 plateau” (0.77–0.98 nM; on IgG1 plateau +10%), or “above IgG1 plateau” (>0.98 nM), as described above. We observed the same variability in individual sensitivity to IgG1 and IgG3 concentration parameters, consistent with the variability in baseline IgG1 and IgG3 concentrations seen in our previous analysis (Figure 3A). Specifically, most individuals were sensitive to IgG1 concentration, but sensitivity plateaued in accordance with the IgG1 plateau observed in Figure 3A because 103/105 patients were limited to complex formation on or below the IgG plateau at any level of IgG1 concentration 0.004×–20× (Figure 6B). Likewise, we saw variability in IgG3-related parameters that reflects the small number of individuals within the IgG3-sensitive region on Figure 3A, with 72 reaching complex formation above the IgG1 plateau, 11 on the IgG1 plateau, and 22 below the IgG1 plateau for some IgG3 concentrations of 0.004×–20× (Figure 6B). All but two individuals (vaccinees 82 and 94, who both had very high IgG4 levels) were not sensitive to changes in IgG2 and IgG4 parameters, with only 4–8 vaccinees reaching complex formation on or above the IgG1 plateau with alterations in these parameters, reinforcing the deleterious effect of high IgG4 concentrations seen in the VAX003 trial. Perhaps the most interesting outcome of the personalized, single-parameter sensitivity analyses was that most all individuals were extremely sensitive to (1) IgG1 Fc affinity to FcR (105/105 reached complex formation above the IgG1 plateau with a 0.004× change in the koff; Figure 6B); and (2) FcR concentration (103/105; Figure 6B). Of note, IgG1 Fc affinity and FcR concentration remain the most broadly sensitive parameters in personalized, single-parameter sensitivity analyses of FcγRIIIa-F158, FcγRIIa-H131, and FcγRIIa-R131, with less IgG3 sensitivity seen in FcγRIIa, as expected (Figure S6). Overall, there was a significantly higher proportion of complex formation above the IgG1 plateau with changes in kon and koff IgG1-FcR than with changes in IgG1 concentration (binomial test; p < 0.0001). These results place a high priority on physiological or therapeutic alterations that could influence IgG1 affinity for FcR, such as glycosylation, and has important implications for individuals with different FcγRIIIa polymorphisms (which alters affinity of the FcR for all IgGs). In terms of glycosylation, model results predict significant differences are expected to arise from IgG1 Fc glycosylation in the RV144 vaccinees we evaluated, but not from Fab glycosylation or from Fc glycosylation of other IgG (2–4) subclasses (Figure S7A). Model predictions also suggest that significant differences would be expected to arise from IgG1 binding-affinity alterations because of FcγRIIIa polymorphisms in this population of RV144 vaccinees (Figures S7B and S7C).
Figure 6.

Personalized, single-parameter sensitivity analysis illustrates universal sensitivity of IgG1 affinity for FcγR
(A) For each vaccinee (x axis, labeled 1–105), parameters (y axis) were altered individually 0.004×–20× the baseline, and a sensitivity metric was calculated by dividing the change in complex formation by the change in the parameter multiplier (color bar).
(B) The number of vaccinees at each activation level (below IgG1 plateau, white: < 0.77 nM below the IgG1 plateau; on IgG1 plateau, pink: 0.77 – 0.98 nM, on IgG1 plateau +10%; or above IgG1 plateau, green: >0.98 nM, >10% above plateau) for each parameter perturbation, based on the maximum complex formation level achieved over the seven simulations from 0.004× to 20× for each parameter. The data labels on the stacked bar graph indicate the total number of vaccinees that have achieved that respective complex formation level and all those below it.
See also Figure S6.
The model reveals synergistic effects of combined changes in IgG1 concentration and IgG1 FcγRIIIa binding affinity
Given the variability in individual sensitivity to IgG1 concentration, we next hypothesized that IgG and FcR modifications that influence IgG1 affinity for FcγRIIIa (including FcR polymorphism and glycosylation) have the potential to have synergistic effects when changed in combination with IgG1 concentration. This would mean that IgG1 Fc glycosylation and FcR polymorphism would have differential effects on FcγR activation across individuals, depending on an individual’s levels of HIV-specific IgG1. To test that idea across a range of perturbations, we increased IgG1 concentration and FcγRIIIa binding affinity separately and in combination by 2×, 5×, and 10× to reflect therapeutically relevant alterations that could be achieved by glycoengineering (Figure 7A). We selected these perturbations based on potential concentration changes and previously reported affinity changes related to glycosylation of the IgG1 Fc region47, 48, 49, 50 (Table S2). Interestingly, this analysis illustrated how alterations in affinity of IgG1 to FcγRIIIa may be most effective for increasing FcγRIIIa complex formation broadly across vaccinated individuals. For example, although a 2× increase in IgG1 concentration results in complex formation at the IgG1 plateau in 26% (27/105) of individuals, a 2× increase in FcγRIIIa binding affinity would be predicted to result in a complex formation above the IgG1 plateau in 40% of individuals (42/105) (Figure 7B). Compellingly, although a 5× increase in concentration results in complex formation on the IgG1 plateau in most (75%; 79/105) individuals, a 5× increase in binding affinity would result in complex formation above the IgG1 plateau in most (82%; 86/105) individuals (affinity change results in significantly more complex formation above the IgG1 plateau by a binomial test; p < 0.0001; Figure 7B).
Figure 7.

Combined changes in IgG1 concentration and IgG1 Fc binding result in synergistic changes in complex formation
(A) Predicted complex formation for each vaccinee at baseline and when IgG1 concentration and IgG1 binding affinity (kon) are increased separately or together. Color bar indicates complex formation.
(B) The number of vaccinees at each complex formation level (below IgG1 plateau, white; on IgG1 plateau, pink; above IgG1 plateau, green) for each condition in (A).
(C–E) Complex formation resulting from (1) simple addition of complex formation predicted from separate initial IgG1 concentration and IgG1-FcγR affinity parameter perturbations (“Additive”) at 2× (C), 5× (D), or 10× (E); or (2) simultaneous perturbations of IgG1 concentration and IgG1-FcγR affinity within the model (“Combined”). Comparison made with a two-tailed Wilcoxon matched-pairs signed rank test with α = 0.05. >∗∗∗p < 0.0001.
We also show that model predictions of FcγRIIIa complex formation after combined IgG1 concentration and affinity alterations in the model were significantly different than expected from simply adding changes expected from each perturbation made separately in the model. For example, when IgG1 concentration and IgG1 affinity are increased by 5× individually in the model, the respective median increases are predicted to be 0.33 nM and 1.4 nM, for a sum total change of 1.7 nM. However, tuning them simultaneously in the model by 5× results in a 2.7-nM increase in complex formation, a 57% increase over what would be expected from simple summation. The model predicted that combined changes were significant compared to additive individual changes across all conditions evaluated (Wilcoxon matched-pairs signed rank test; all p < 0.0001; Figures 7C–7E). This result suggests that synergistic effects may arise from combinatorial increases in both IgG1 concentration and IgG1 FcR affinity that would not be apparent from studying each feature in isolation.
Discussion
Here, we present a quantitative approach for understanding how personalized variation in IgG and FcγR features may contribute to variability in cellular FcR activation after vaccination. Our results have important implications in the context of failed HIV vaccine trials that were modeled upon RV144. It is possible that larger numbers of boosts and alternative adjuvants used in other trials may have had a limited effect on IgG-FcγRIIIa complex formation because of a plateau in the benefit of increasing IgG1. Furthermore, the model suggests that elevated IgG1 induced with boosting may even inhibit Fc responses in some individuals that have high IgG3. It is also possible that IgG subclass-distribution differences linked to genetic background (IgG1 allotype) have the potential to significantly reduce immune complex formation in follow-up RV144 trials in which G1m1,3 allotypes are less prevalent than G1m-1,3 and G1m1 (such as HVTN702). Given measurements of IgG1, IgG2, IgG3, and IgG4 in plasma samples from other vaccine trials, the analysis presented here could be usefully extended to directly address these questions.
In contrast to highly variable individual responses to IgG subclass concentrations, model results highlighted the global importance of IgG1 affinity for FcγRIIIa and suggest that this may be the most effective way to increase FcγRIIIa activation broadly across a population. This is especially interesting in the context of a number of reported physiologically and therapeutically relevant perturbations to the IgG1 Fc region that could influence binding affinity, including FcR polymorphisms and glycosylation.51,52 Results here suggest that vaccine adjuvants able to modulate IgG1 Fc glycosylation may be the most effective way to improve FcγRIIIa complex formation in many vaccinees. For example, a 2× increase in IgG1-FcR kon would boost 65% of vaccinee samples into at least complex formation on the plateau, whereas a 2× increase in IgG1 concentration alone would promote complex formation on the plateau in only 28% of vaccinees. Furthermore, the model predicted that a 5× increase in IgG1-FcR kon would result in complex formation above the IgG1 plateau in 82% of the individuals we evaluated, which was not achievable with similar changes in IgG1 and IgG3 concentrations. Importantly, model predictions prioritize the importance of IgG1 Fc glycosylation across a multitude of other potential glycosylation modifications, including those to IgG2, IgG3, and IgG4 Fc regions as well as those that mediate Fab binding in all IgG subclasses. Previous studies have demonstrated that different vaccine strategies induce varied antigen-specific antibody glycosylation;53 however, specific adjuvant-mediated modulation of Fc-glycosylation is not yet possible. Model results may help guide the focus for future experimental measurements of glycosylation in vaccine samples.
The approach presented here adds a complementary dimension to previous systems serology research, which has been based on data-driven computational approaches.21,23,35,36,54, 55, 56, 57 Although data-driven algorithms have been valuable for identifying signatures of antibodies and FcR features associated with vaccines and/or cellular functions, it has been challenging to gain insight into mechanisms that underpin heterogeneity across populations of individuals.21 Our previous systems-serology analysis of the data from HIV vaccine trials (including RV144 and VAX003) identified important statistical associations between IgG1, IgG3, and Fc-effector functions in the RV144 trial but was not able to define mechanisms responsible for heterogeneity in Fc effector functions across individuals.23,36 The mechanistic model presented here builds on that by illustrating how individuals may be differentially sensitive to vaccine regimens that increase IgG1 concentration and identifies a mechanism by which some individuals may be negatively affected by an increase in IgG1. It also highlights the importance of IgG1 affinity for FcγRIIIa as a critical parameter for increasing FcγRIIIa activation and ADCC broadly across populations of individuals. Altogether, these results complement information obtained from previous data-driven analyses.
This model is a simple reconstruction of key events understood to be involved in FcγRIIIa activation upstream of ADCC and represents a first step toward quantitative understanding of intercellular IgG-FcR signaling. Our current model only considers FcγRIIIa, a single FcγR type believed to be upstream of ADCC, and a single HIV epitope (env) that was central to RV144 vaccination. Although it provides insight into concepts of personalized mechanisms that may limit FcγRIIIa complex formation after RV144 vaccination, predicting vaccine efficacy and the full quantitative mechanisms underlying responses to treatment in humans will be more complex. Future iterations of this work could include multiple epitopes to assess competition or a range of other infectious diseases, including SARS-CoV-2,56 Mycobacterium tuberculosis, and Ebola, or even to enhance monoclonal-antibody therapeutics.7
Overall, the results of this study resonate with existing literature from HIV vaccine trials and also provide insights for maximizing FcγRIIIa complex formation after vaccination across patient populations. Especially surprising were quantitative insights that predicted limitations in vaccine platforms that induce large increases in HIV-specific IgG1, contrasted with a seemingly unlimited benefit of increasing IgG1 FcγRIIIa binding affinity. Computational methods may be valuable for accelerating and guiding future vaccine development because these methods can predict which component(s) of an Ab (Fab or Fc) have the greatest contribution to Fc effector functions and may save time and cost in experimental assays. Importantly, this approach could be useful for projecting vaccine trial results from one genetic background to another, providing information on the role of genetic parameters, independent of other variation in IgG and FcR features that occur across populations. Overall, we believe that this approach could help guide development of future vaccine strategies against antigenically variable pathogens and understand personalized mechanisms that underpin FcR activation.
Limitations of the study
In this study, model predictions were validated with cell-free multiplex assays, which were necessary to overcome challenges associated with low sample volume and to provide a direct comparison between model predictions and experimental measurements. Future work involving cellular assays represent a critical next step. This will require consideration of FcγR cell-surface concentrations and activation thresholds associated with cellular function, which have not yet been accessible with the rsFcγR dimer-binding assays (complex formation is measured in MFI units). Additionally, linking vaccine efficacy to levels of FcγR complex formation would require use of case-control vaccine-failure samples, which were not available for use in this study but could be evaluated in the future.
STAR★Methods
Key resources table
| REAGENT or RESOURCE | SOURCE | IDENTIFIER |
|---|---|---|
| Antibodies | ||
| Human HIV-specific IgG1 mAb PGT121 | Center for Antibody Development and Production, Scripts Research Institute | RRID: AB_2491041 |
| Polyclonal Anti-Human Immunodeficiency Virus Immune Globulin, Pooled Inactivated Human Sera (HIVIG) | NIH AIDS Reagents program | #3957 |
| Biological samples | ||
| RV144 phase III clinical trial plasma samples | U.S Military HIV Research Program (MHRP)17,32 | N/A |
| Chemicals, peptides, and recombinant proteins | ||
| HIV-1 Clade AE A244 gp120 | NIH AIDS reagents | #12569 |
| HIV-1 Clade B BAL gp120 | NIH AIDS reagents | #4961 |
| Influenza Hemagglutinin (HA) protein H3/Switzerland/2013 | Sinobiological | 11085-V08H |
| Dimeric rsFcγR | Hogarth lab, Burnet Institute28,32 | N/A |
| SULFO-NHS-LC-BIOTIN NO-WEIGH 10 × 1mg | Thermo Fisher Scientific | A39257 |
| Bio-plex Pro Magnetic COOH Beads XX (XX refers to bead region) | Bio-rad | MC100XX-01 |
| Streptavidin, R-Phycoerythrin Conjugate (SAPE) | Life technologies | S866 |
| Deposited data | ||
| De-identified personal RV144 IgG subtype concentration data (estimated from MFI measurements) | This paper; Figshare | https://doi.org/10.6084/m9.figshare.14810397 |
| Data within Figures 2, 3, 4, 5, 6, 7, and S3–S11 | This paper; Figshare | https://doi.org/10.6084/m9.figshare.13229162 |
| Software and algorithms | ||
| Source code for simulations and analysis | This paper; Figshare and Github | https://doi.org/10.6084/m9.figshare.13229177 |
| Other | ||
| Collection of deposited data and code from this paper | This paper; Figshare | https://doi.org/10.6084/m9.figshare.c.5474580 |
Resource availability
Lead contact
Further information and requests for resources and reagents should be directed to and will be fulfilled by the lead contact, Kelly Arnold (kbarnold@umich.edu).
Materials availability
This study did not generate new unique reagents.
Experimental model and subject details
RV144 samples
RV144 phase III clinical trial plasma samples17 were provided by the U.S Military HIV Research Program (MHRP). Samples from week 26 (2 weeks post vaccination) RV144 vaccine recipients (n = 30; n = 75 from two separate shipments) were evaluated using data from a previously published study.33 All relevant human research ethics committees approved all experimental studies. All plasma samples were provided de-identified of demographics including gender and age.
Method details
Experimental methods
HIV-specific multiplex IgG subclass, rsFcγR dimer-binding assay
HIV-specific IgG subclass and recombinant soluble FcγR (rsFcγR) dimer binding multiplex data was used from a previously published RV144 study.33 Extracted multiplex data included previously published IgG1, IgG2, IgG3, IgG4, rsFcγRIIa-H131, rsFcγRIIIa-V158, rsFcγRIIIa-F158 dimer data from the customized multiplex or ELISA binding assays using HIV-1 Clade AE A244 gp120 (NIH AIDS reagents catalog#12569), HIV-1 Clade B BAL gp120 (NIH AIDS reagents catalog #4961) recombinant protein antigens and Influenza Hemagglutinin (HA) protein (H3/Switzerland/2013, Sinobiological) as a positive control antigen, as nearly all individuals have previously been exposed to Influenza A virus.
These dimeric rsFcγR assays have been applied to several HIV and other infectious disease studies, which have demonstrated that they correlate with and hence are predictive of in vitro cell based ADCC and ADCP assays.29, 30, 31,33,34 All multiplex data was reported as an arbitrary Median Fluorescence Intensity (MFI).
For responder and non-responder IgG1 validation assays, multiplex assays were repeated as previously described33 with and without the addition of 5μg or 20μg (ie 34 and 140 nM) of human HIV-specific IgG1 mAb PGT121 (purchased from the Center for Antibody Development and Production, Scripts Research Institute).
Surface plasmon resonance
SPR was conducted as previously described.58 Briefly biotinylated gp120 BAL (NIH AIDS Reagents) was immobilized onto a SA sensor chip at approximately 300, 500 and 800 response units. A blank flow cell with no immobilized ligand was used as a reference flow cell. Injections of 60 μl of purified HIV-IgG (NIH AIDS Reagents program) at 1:3 dilutions ranging from 0.5 to 0.006 mg/ml were passed across flow cells at a flow rate of 20μg/ml, with subsequent 360 s dissociation time to determine IgG disassociation. Regeneration after each injection used two pulses of 10mM glycine HCl, pH 2.5. SPR measurements were conducted in HBS-EP buffer (0.01M HEPES (pH 7.4), 0.15M NaCL, 3mM EDTA, 0.005% [vol/vol]). Kinetic data was calculated using BIA evaluation program, with data being fitted to the simplest 1:1 langmuir binding model.
Computational methods
MFI conversion to mM
MFI measurements were converted to concentration measurements using a conversion factor based on a reference IgG1 concentration of 10,000 ng/mL.38 For multiplex readings, when a standard is available there is a log-linear relationship between MFI and concentration when measurements are within the machine’s dynamic range.59 Conversion formulas were based on this typical relationship. We assumed that MFI measurements were in the dynamic range, and that the average IgG1 concentration was 10,000 ng/mL. The conversion factor found for IgG1 was then applied to the remaining species within that given assay. This method was only used for IgG subclass concentrations and not complex formation first because the reference concentration is from a similar vaccine trial and is not measured directly from RV144 vaccinees. Furthermore, MFI of IgG subclasses and MFI of FcR complex formation were measured in different experimental assays, using different fluorescent detector reagents (ie each reagent has different relative fluorescence per molecule) such that absolute quantitative comparisons across assays is extremely difficult. Given these uncertainties, we are not comfortable converting our experimental FcR complex measurements to nM, implying a direct prediction of concentration.
ODE model
A system of ODE equations was created to describe the env-IgG-FcγR system in Figure 1B. We assumed no degradation or production of species over the short time span of the model. Initial concentrations of lgG1, lgG2, lgG3, lgG4 were set for each individual using measurements made in sera samples from each vaccinee (see below). The average of these personal values for vaccinees 1-30 were used as the baseline measurements for initial IgG concentrations in the global sensitivity analysis. The initial concentrations of env (∼25 nM) and rsFcγR dimer (∼20 nM) were set based on multiplex experimental conditions described previously and annotated below (Figure 1C). 33 The initial concentration of each complex was set to zero. Binding parameters for lgG1, lgG2, lgG3, lgG4, and FcγR dimers were set based on literature values28 while env binding parameters were determined via SPR measurements as described below (see Figure 1C and Table S1). We obtained KAs for each IgG subclass binding to FcγRIIIA-V158 from the literature.28 We converted these KAs to kons by estimating a universal koff from pooled RV144 serum samples (0.01 s-1). We used MATLAB’s ode113 solver function to predict the concentration of each complex over 100000 s, with an absolute error tolerance of 1e-50, relative tolerance of 1e-10. We assumed sequential IgG antibody binding to env prior to engagement of any env-IgG-IgG complex with any FcγR dimer. We assumed no cooperativity in IgG binding env (affinity values are independent of the presence of another IgG on the same envelope protein). For antigen-IgG complexes containing two of the same IgG subclass we used literature values for the reported value of that subclass.28 For complexes containing two different IgG subclasses we averaged the two individual IgG subclass affinities. All parameters used (and sources) are reported in Figure 1C and Table S1.
Sensitivity analysis
We performed a global uncertainty and sensitivity analysis39 using population averages for baseline concentration parameters (Figures 2B, 2C, S3, and S4), as well as a personalized single-parameter sensitivity analysis, using personalized concentration parameters as baseline (Figures 6A and S6)· In the global sensitivity analysis algorithm provided by the Kirschner lab at the University of Michigan (Figures 2B, 2C, S3, and S4), we assigned uniform probability density functions (pdfs) to each parameter (initial concentrations and affinities) with a minimum 0.004X of baseline and a max 20X of baseline for all parameters except kc (0.01X-100X and baseline = 1).39 These pdfs were sampled using Latin hypercube sampling (LHS) to create random combinations of parameter values. The model was evaluated under each of the 2,000 sets of random parameter combinations, allowing for a multidimensional exploration of the system. Partial rank correlation coefficient (PRCC) calculated within the algorithm determined the correlation between each input variable’s variance throughout multidimensional analysis and the output variable, giving a sensitivity measure for each parameter and a statistical significance of its effect on complex formation.
Combinatorial IgG1 and IgG3 concentration parameter alterations (Figures 3 and S5)
2,500 simulations were run with differing combinations of initial IgG1 and IgG3 concentrations. All combinations of 50 values were uniformly spaced on a logarithmic scale between 0.004X-20X baseline concentration for Figures 3A and S5B and 0.004X-500X for Figure S5A for both IgG1 and IgG3 and were simulated with FcγRIIIa-V158 affinity parameters for Figures 3A and S5A, and for both polymorphisms in FcγRIIa and FcγRIIIa in Figure S5B. Results were plotted as a grid surface. We predicted individual complex formation (n = 105) based on IgG subclass 1-4 concentrations. Individuals were plotted as circles at their specific IgG1 and IgG3 initial concentrations with their individually predicted complex formation concentration. Complex formation below the IgG1 plateau (< 0.77 nM, white), on the IgG1 plateau (0.77– 0.98 nM, pink), and above the IgG1 plateau (> 0.98 nM, green) categories were defined based on the IgG1 plateau on the grid surface, with complex formation on the IgG1 plateau going from the plateau minimum to 10% higher than the plateau’s maximum value. The grid was colored based on the minimum threshold value achieved within each square. Simulations of IgG1, IgG3, or simultaneous fold changes were performed at 2X, 5X, 10X and 20X of personal baselines. Vaccinees were binned into complex formation below, on, or above the IgG1 plateau under each of these conditions based on the previously mentioned thresholds. IgG1 and IgG3 gradients were calculated for each surface grid intersection (n = 2,500) using MATLAB’s built in gradient function, which calculated the numerical gradient based on the complex formation data (z axis) and the uniform logarithmically spaced increments of IgG1 and IgG3 concentration (x and y axis). Each vaccinee’s gradient (n = 105) was approximated by using the gradient value at the nearest grid intersection corresponding to their personalized IgG1 and IgG3 concentrations.
IgG1 sensitivity validation (Figure 4)
We simulated the addition of either 34 or 140 nM IgG1 to each of the 30 vaccinees we had baseline complex formation measurements from to predict 8 IgG1 responders (highest fold change in complex formation from baseline) and 8 non-responders (lowest fold change in complex formation from baseline after IgG1 addition). In order to experimentally validate our model and predictions, HIV-specific monoclonal PGT121 IgG1 was added in the specified amounts to each plasma sample prior to being assessed for FcγRIIIa dimer binding via multiplex assay. Due to the large quantities of monoclonal Ab required for this assay and the need to use a monoclonal Ab with described ability to bind FcγRIIIa, we used PGT121 IgG1, which binds with high avidity to Clade B HIV envelope proteins, but binds comparatively weakly to A244 strains.13,41, 42, 43 Thus we performed these simulations using HIV Clade B gp120 BAL-specific IgG1-4 concentrations. Complex formation for each responder and non-responder with each addition were captured by the model and measured in the multiplex assay and then converted into concentration using the same methods as IgG conversion.
Allotype simulations (Figure 5)
We projected complex formation into differently allotyped populations by first calculating a conversion factor under the assumption that our original dataset is entirely G1m1,3. We used time-matched (26 weeks; n = 6) human IgG subtype concentration data from a Phase I study on a candidate vaccine containing HIV-1 clade C CN54 gp140 envelope protein.38 In collaboration with the authors, we grouped vaccinees by allotype (G1m-1,3 n = 3; G1m1,3 n = 1; G1m1 n = 2) and took the mean of each IgG subtype for each allotype. We calculated conversion factors for each IgG by dividing the given allotype’s mean concentration by G1m1,3′s mean concentration as follows:
To run the simulations to project the RV144 data available to us into G1m-1,3 and G1m1 populations, we converted each IgG initial concentration for each vaccinee based on the respective conversion factor as follows:
With the converted IgG initial concentrations, the simulations were performed as described in the ODE model section above.
Personalized single-parameter sensitivity analysis (Figures 6 and S6)
We altered each parameter (kon and koff for each reaction and initial species concentrations) one at a time at three values above and below baseline (0.004X, 0.02X, 0.1X, 1X, 2.5X, 5X, and 20X) and calculated the predicted complex formation as total env-IgG-FcγR complexes at steady state. The sensitivity metric for each parameter was defined based on the following equation:
We summarized the personal sensitivity simulation by binning vaccinees into low medium or high activation based on the maximum complex formation they achieve for each parameter when altered 0.004X-20X from baseline.
Individual and combinatorial IgG1 concentration and Fc affinity simulations (Figure 7)
We simulated alterations (2X, 5X, 10X, or 20X from baseline) in either IgG1 concentration, IgG1 kon to FcγRIIIa-V158, or both simultaneously. Each vaccinee’s complex formation was captured for under each condition and plotted on a heatmap. These results were summarized by binning vaccinees into complex formation below, on, or above the IgG1 plateau based on the previously mentioned thresholds for each condition. The combinatorial simulation results were compared to the additive result, based on the following formula for each alteration to each individual: additive complex formation = baseline + ΔIgG1 concentration alone + ΔIgG1-FcγR kon alone.
Glycosylation simulations
We obtained data on fold change in IgG1-FcγR affinity with each glycosylation type from the published literature.48 We applied the maximum fold change in affinity (31X) seen in Dekkers et al. for FcγRIIIa-V158 to each IgG subtype’s Fc (kon IgGx-FcR) and Fab (kon IgGx-env) region individually to compare change in complex formation with the same change in affinity (Figure S7A).
FcγR polymorphism simulations
We obtained FcγR polymorphism and class specific affinity parameters from the literature, calculated values listed in Table S1.28 The affinity values were reported in KA, and we converted each KA to a kon using a constant estimated koff of 0.01 s-1. We ran a simulation for each vaccinee at each set of FcγR parameters, and then compared each polymorphism with a two-tailed Wilcoxon matched-pairs signed rank test performed in GraphPad Prism with α = 0.05.
Software
ODE modeling, sensitivity analyses, and 3-D plots were completed using MATLAB 2019a (MathWorks, Natick, MA). Visualization of the remaining plots, and statistics were completed using GraphPad Prism version 8.0.0. Custom MATLAB code is available, as stated in the Key resources table, to run the simulations necessary to generate the data (steady state complex formation concentrations) used in this analysis. Additionally this code will replicate Figures 2A–2C, 3A, 3B, 4A, and 6A. All other figures can be replicated using the data generated by these simulations or by making small alterations to code as indicated in comments.
Quantification and statistical analysis
Figures 2, S3, and S4: To evaluate model validation (Figure 2A), a two-tailed Spearman correlation was performed in GraphPad Prism on the measured MFI and predicted nM complex formation values with α = 0.05. The global sensitivity analysis (Figures 2B, 2C, S3, and S4) and partial rank correlation coefficient (PRCC) calculation method, which has been previously published,39 uses Latin hypercube sampling (LHS) to randomize input parameters and calculates PRCC for each parameter by calculating the linear correlation between the parameter input and complex formation output while discounting the linear effects of all other parameter inputs. The significance of each PRCC value is tested by comparing its T value, which accounts for the number of other parameters and number of samples, to a critical t-value giving a p value used to determine if the PRCC is significantly different from zero. Statistical details are included in the figure legends.
Figure 3: The gradients were compared using a two-tailed Wilcoxon matched-pairs signed rank test performed in GraphPad Prism with α = 0.05. To compare 10X and 20X IgG3 additions, we used a binomial test performed in Graphpad prism on the proportion of high versus the combination of medium and low activating individuals with α = 0.05. We used the 10X IgG3 addition proportions as the expected values (45 above the IgG1 plateau, 60 on or below the IgG1 plateau) and the 20X proportions as the observed values. To compare IgG1 & IgG3 additions to IgG3 alone additions, we used a binomial test performed in Graphpad prism on the proportion of individuals with complex formation above the IgG1 plateau versus the combination of individuals with complex formation on or below the IgG1 plateau with α = 0.05. We used the IgG3 alone addition proportions as the expected values for each respective addition level and the IgG1 & IgG3 proportions as the observed values for each respective addition level. Statistical details are included in the figure legends.
Figure 4: IgG1 addition model and experimental measurements within each addition level (34nM or 140nM) were compared using an ordinary one-way ANOVA performed in GraphPad Prism with multiple comparisons and the Tukey test with a single pooled variance and no matching or pairing (α = 0.05). Only the results between model and experimental results within the same condition, or responders and non-responders within the same condition are reported in the figure. Statistical details are included in the figure legends.
Figure 5: Complex formation for each Gm allotype were compared using a Friedman’s test with Dunn’s multiple comparison test in GraphPad Prism (α = 0.05). Statistical details are included in the figure legends.
Figure 6: To compare proportions of complex formation above the IgG1 plateau, we used a binomial test performed in Graphpad prism on the proportion of complex formation above the IgG1 plateau versus the combination of individuals with complex formation on or below the IgG1 plateau with α = 0.05. To compare proportions of individuals with complex formation on the IgG1 plateau, we used a binomial test performed in Graphpad prism on the proportion of complex formation on the IgG1 plateau versus the combination of individuals with complex formation above and below the IgG1 plateau with α = 0.05. We used the IgG1 concentration proportions as the expected values when comparing to koff IgG1-FcR, and IgG3 concentration proportions as the expected values when comparing to IgG1 concentration proportions. Statistical details are included in the figure legends.
Figure 7: The additive and combination complex formations for each fold change (2X, 5X, 10X) were compared using a two-tailed Wilcoxon matched-pairs signed rank test performed in GraphPad Prism with α = 0.05. To compare proportions of complex formation above the IgG1 plateau, we used a binomial test performed in Graphpad prism on the proportion of complex formation above the IgG1 plateau versus the combination of individuals with complex formation on or below the IgG1 plateau with α = 0.05. To compare proportions of complex formation on the IgG1 plateau, we used a binomial test performed in Graphpad prism on the proportion of complex formation on the IgG1 plateau versus the combination of individuals with complex formation above and below the IgG1 plateau with α = 0.05. We used the affinity alone alteration proportions as the expected values and the concentration alone alteration proportions as the observed values. Statistical details are included in the figure legends.
Figure S2: To further evaluate model validation (Figure S2A), we calculated a log-log least-squares fit of Measured MFIs versus Predicted concentration in GraphPad Prism and captured the RMSE. To evaluate model validation (Figures S2B–S2F), a two-tailed Spearman correlation was performed in GraphPad Prism on the measured MFI and predicted nM complex formation values from each dataset with α = 0.05. Statistical details are included in the figure legends.
Figure S5: To evaluate model validation after IgG1 additions (Figure S5), a two-tailed Spearman correlation was performed in GraphPad Prism on predicted versus measured fold change in complex formation with α = 0.05. Statistical details are included in the figure legends.
Figure S7: Change in complex formation with glycosylation of Fc or Fab regions of IgG1-4 were compared using an ordinary one-way ANOVA performed in GraphPad Prism with multiple comparisons and the Tukey test with a single pooled variance and no matching or pairing (α = 0.05). The complex formation in different FcR polymorphisms was compared using a two-tailed Wilcoxon matched-pairs signed rank test performed in GraphPad Prism with α = 0.05. Statistical details are included in the figure legends.
Acknowledgments
This work was supported by the Australia National Health & Medical Research Center (NHMRC) (APP1125164 to A.W.C.) and the American Foundation for AIDS Research (amfAR) Mathilde Krim Fellowship (109499-61-RKVA to A.W.C), and by start-up funds from the University of Michigan to K.B.A.. S.J.K., and A.W.C. were supported by NHMRC fellowships. The data necessary to calculate allotype conversion was generously shared by Robin J. Shattock and Paul F. McKay (Imperial College, London). The authors would like to thank the participants in the RV144 trial, as well as Paul Wolberg and Denise Kirschner (University of Michigan) for assistance in implementing the global-sensitivity analysis, and Katy Norman and Katarina DiLillo (University of Michigan) for manuscript review.
Author contributions
M.M.L. designed the study, performed computational analyses, created figures, and wrote the manuscript. M.R.M. and E.L. performed experimental measurements and edited the manuscript. C.Y.L. and E.R.B. performed computational analyses and edited the manuscript. S.K. provided data used to calculate conversion factors for IgG1 allotypes. S.R.-N., P.P., and S.N. conducted the RV144 vaccine trial. B.D.W. and P.M.H. provided rsFcγR dimers and edited the manuscript. S.J.K arranged institutional ethics and edited the manuscript. A.W.C. designed the study, wrote the manuscript, and oversaw the experimental analyses. K.B.A. designed the study, wrote the manuscript, and oversaw computational analysis.
Declaration of interests
The authors declare no competing interests.
Published: August 31, 2021
Footnotes
Supplemental information can be found online at https://doi.org/10.1016/j.xcrm.2021.100386.
Contributor Information
Amy W. Chung, Email: awchung@unimelb.edu.au.
Kelly B. Arnold, Email: kbarnold@umich.edu.
Supplemental information
Data and code availability
De-identified individual RV144 IgG subtype concentration data (estimated from MFI measurements) and all data within figures have been deposited at Figshare and are publicly available as of the date of publication. DOIs are listed in the Key resources table.
All original MATLAB code for running personal simulations, surface simulations, and sensitivity analyses has been deposited at GitHub and linked through Figshare and is publicly available as of the date of publication. DOIs are listed in the Key resources table.
Any additional information required to re-analyze the data reported in this paper is available from the lead contact upon request.
References
- 1.Plotkin S.A. Correlates of protection induced by vaccination. Clin. Vaccine Immunol. 2010;17:1055–1065. doi: 10.1128/CVI.00131-10. [DOI] [PMC free article] [PubMed] [Google Scholar]
- 2.Pulendran B., Ahmed R. Immunological mechanisms of vaccination. Nat. Immunol. 2011;12:509–517. doi: 10.1038/ni.2039. [DOI] [PMC free article] [PubMed] [Google Scholar]
- 3.Jegaskanda S., Vanderven H.A., Wheatley A.K., Kent S.J. Fc or not Fc; that is the question: Antibody Fc-receptor interactions are key to universal influenza vaccine design. Hum. Vaccin. Immunother. 2017;13:1–9. doi: 10.1080/21645515.2017.1290018. [DOI] [PMC free article] [PubMed] [Google Scholar]
- 4.van Schooten J., van Gils M.J. HIV-1 immunogens and strategies to drive antibody responses towards neutralization breadth. Retrovirology. 2018;15:74. doi: 10.1186/s12977-018-0457-7. [DOI] [PMC free article] [PubMed] [Google Scholar]
- 5.Chung A.W., Navis M., Isitman G., Centre R., Finlayson R., Bloch M., Gelgor L., Kelleher A., Kent S.J., Stratov I. Activation of NK cells by ADCC responses during early HIV infection. Viral Immunol. 2011;24:171–175. doi: 10.1089/vim.2010.0108. [DOI] [PMC free article] [PubMed] [Google Scholar]
- 6.Gunn B.M., Yu W.H., Karim M.M., Brannan J.M., Herbert A.S., Wec A.Z., Halfmann P.J., Fusco M.L., Schendel S.L., Gangavarapu K. A role for Fc function in therapeutic monoclonal antibody-mediated protection against Ebola virus. Cell Host Microbe. 2018;24:221–233.e5. doi: 10.1016/j.chom.2018.07.009. [DOI] [PMC free article] [PubMed] [Google Scholar]
- 7.Lu L.L., Chung A.W., Rosebrock T.R., Ghebremichael M., Yu W.H., Grace P.S., Schoen M.K., Tafesse F., Martin C., Leung V. A functional role for antibodies in tuberculosis. Cell. 2016;167:433–443.e14. doi: 10.1016/j.cell.2016.08.072. [DOI] [PMC free article] [PubMed] [Google Scholar]
- 8.DiLillo D.J., Tan G.S., Palese P., Ravetch J.V. Broadly neutralizing hemagglutinin stalk-specific antibodies require FcγR interactions for protection against influenza virus in vivo. Nat. Med. 2014;20:143–151. doi: 10.1038/nm.3443. [DOI] [PMC free article] [PubMed] [Google Scholar]
- 9.Robb M.L. Failure of the Merck HIV vaccine: an uncertain step forward. Lancet. 2008;372:1857–1858. doi: 10.1016/S0140-6736(08)61593-7. [DOI] [PubMed] [Google Scholar]
- 10.Haynes B.F., Gilbert P.B., McElrath M.J., Zolla-Pazner S., Tomaras G.D., Alam S.M., Evans D.T., Montefiori D.C., Karnasuta C., Sutthent R. Immune-correlates analysis of an HIV-1 vaccine efficacy trial. N. Engl. J. Med. 2012;366:1275–1286. doi: 10.1056/NEJMoa1113425. [DOI] [PMC free article] [PubMed] [Google Scholar]
- 11.Rerks-Ngarm S., Pitisuttithum P., Nitayaphan S., Kaewkungwal J., Chiu J., Paris R., Premsri N., Namwat C., de Souza M., Adams E., MOPH-TAVEG Investigators Vaccination with ALVAC and AIDSVAX to prevent HIV-1 infection in Thailand. N. Engl. J. Med. 2009;361:2209–2220. doi: 10.1056/NEJMoa0908492. [DOI] [PubMed] [Google Scholar]
- 12.Robb M.L., Rerks-Ngarm S., Nitayaphan S., Pitisuttithum P., Kaewkungwal J., Kunasol P., Khamboonruang C., Thongcharoen P., Morgan P., Benenson M. Risk behaviour and time as covariates for efficacy of the HIV vaccine regimen ALVAC-HIV (vCP1521) and AIDSVAX B/E: a post-hoc analysis of the Thai phase 3 efficacy trial RV 144. Lancet Infect. Dis. 2012;12:531–537. doi: 10.1016/S1473-3099(12)70088-9. [DOI] [PMC free article] [PubMed] [Google Scholar]
- 13.Parsons M.S., Chung A.W., Kent S.J. Importance of Fc-mediated functions of anti-HIV-1 broadly neutralizing antibodies. Retrovirology. 2018;15:58. doi: 10.1186/s12977-018-0438-x. [DOI] [PMC free article] [PubMed] [Google Scholar]
- 14.Hessell A.J., Hangartner L., Hunter M., Havenith C.E., Beurskens F.J., Bakker J.M., Lanigan C.M., Landucci G., Forthal D.N., Parren P.W. Fc receptor but not complement binding is important in antibody protection against HIV. Nature. 2007;449:101–104. doi: 10.1038/nature06106. [DOI] [PubMed] [Google Scholar]
- 15.Easterhoff D., Pollara J., Luo K., Tolbert W.D., Young B., Mielke D., Jha S., O’Connell R.J., Vasan S., Kim J. Boosting with AIDSVAX B/E enhances env constant region 1 and 2 antibody-dependent cellular cytotoxicity breadth and potency. J. Virol. 2020;94:e01120-19. doi: 10.1128/JVI.01120-19. [DOI] [PMC free article] [PubMed] [Google Scholar]
- 16.Pitisuttithum P., Nitayaphan S., Chariyalertsak S., Kaewkungwal J., Dawson P., Dhitavat J., Phonrat B., Akapirat S., Karasavvas N., Wieczorek L., RV306 study group Late boosting of the RV144 regimen with AIDSVAX B/E and ALVAC-HIV in HIV-uninfected Thai volunteers: a double-blind, randomised controlled trial. Lancet HIV. 2020;7:e238–e248. doi: 10.1016/S2352-3018(19)30406-0. [DOI] [PMC free article] [PubMed] [Google Scholar]
- 17.Rerks-Ngarm S., Pitisuttithum P., Excler J.L., Nitayaphan S., Kaewkungwal J., Premsri N., Kunasol P., Karasavvas N., Schuetz A., Ngauy V., RV305 Study Team Randomized, double-blind evaluation of late boost strategies for HIV-uninfected vaccine recipients in the RV144 HIV vaccine efficacy trial. J. Infect. Dis. 2017;215:1255–1263. doi: 10.1093/infdis/jix099. [DOI] [PMC free article] [PubMed] [Google Scholar]
- 18.Bekker L.G., Moodie Z., Grunenberg N., Laher F., Tomaras G.D., Cohen K.W., Allen M., Malahleha M., Mngadi K., Daniels B., HVTN 100 Protocol Team Subtype C ALVAC-HIV and bivalent subtype C gp120/MF59 HIV-1 vaccine in low-risk, HIV-uninfected, South African adults: a phase 1/2 trial. Lancet HIV. 2018;5:e366–e378. doi: 10.1016/S2352-3018(18)30071-7. [DOI] [PMC free article] [PubMed] [Google Scholar]
- 19.Rouphael N.G., Morgan C., Li S.S., Jensen R., Sanchez B., Karuna S., Swann E., Sobieszczyk M.E., Frank I., Wilson G.J., HVTN 105 Protocol Team and the NIAID HIV Vaccine Trials Network DNA priming and gp120 boosting induces HIV-specific antibodies in a randomized clinical trial. J. Clin. Invest. 2019;129:4769–4785. doi: 10.1172/JCI128699. [DOI] [PMC free article] [PubMed] [Google Scholar]
- 20.Cohen J. Another HIV vaccine strategy fails in large-scale study. Science Mag. 2020 Published online February 3, 2020. [Google Scholar]
- 21.Arnold K.B., Chung A.W. Prospects from systems serology research. Immunology. 2018;153:279–289. doi: 10.1111/imm.12861. [DOI] [PMC free article] [PubMed] [Google Scholar]
- 22.de Taeye S.W., Bentlage A.E.H., Mebius M.M., Meesters J.I., Lissenberg-Thunnissen S., Falck D., Sénard T., Salehi N., Wuhrer M., Schuurman J. FcγR binding and ADCC activity of human IgG allotypes. Front. Immunol. 2020;11:740. doi: 10.3389/fimmu.2020.00740. [DOI] [PMC free article] [PubMed] [Google Scholar]
- 23.Chung A.W., Ghebremichael M., Robinson H., Brown E., Choi I., Lane S., Dugast A.S., Schoen M.K., Rolland M., Suscovich T.J. Polyfunctional Fc-effector profiles mediated by IgG subclass selection distinguish RV144 and VAX003 vaccines. Sci. Transl. Med. 2014;6:228ra38. doi: 10.1126/scitranslmed.3007736. [DOI] [PubMed] [Google Scholar]
- 24.Yates N.L., Liao H.X., Fong Y., deCamp A., Vandergrift N.A., Williams W.T., Alam S.M., Ferrari G., Yang Z.Y., Seaton K.E. Vaccine-induced Env V1-V2 IgG3 correlates with lower HIV-1 infection risk and declines soon after vaccination. Sci. Transl. Med. 2014;6:228ra39. doi: 10.1126/scitranslmed.3007730. [DOI] [PMC free article] [PubMed] [Google Scholar]
- 25.Forthal D.N., Landucci G., Ding H., Kappes J.C., Wang A., Thung I., Phan T. IgG2 inhibits HIV-1 internalization by monocytes, and IgG subclass binding is affected by gp120 glycosylation. AIDS. 2011;25:2099–2104. doi: 10.1097/QAD.0b013e32834b64bd. [DOI] [PubMed] [Google Scholar]
- 26.Smith D.J., Forrest S., Ackley D.H., Perelson A.S. Variable efficacy of repeated annual influenza vaccination. Proc. Natl. Acad. Sci. USA. 1999;96:14001–14006. doi: 10.1073/pnas.96.24.14001. [DOI] [PMC free article] [PubMed] [Google Scholar]
- 27.Skowronski D.M., Chambers C., De Serres G., Sabaiduc S., Winter A.L., Dickinson J.A., Gubbay J.B., Fonseca K., Drews S.J., Charest H. Serial vaccination and the antigenic distance hypothesis: effects on influenza vaccine effectiveness during A(H3N2) epidemics in Canada, 2010–2011 to 2014–2015. J. Infect. Dis. 2017;215:1059–1099. doi: 10.1093/infdis/jix074. [DOI] [PMC free article] [PubMed] [Google Scholar]
- 28.Bruhns P., Iannascoli B., England P., Mancardi D.A., Fernandez N., Jorieux S., Daëron M. Specificity and affinity of human Fcgamma receptors and their polymorphic variants for human IgG subclasses. Blood. 2009;113:3716–3725. doi: 10.1182/blood-2008-09-179754. [DOI] [PubMed] [Google Scholar]
- 29.Wines B.D., Vanderven H.A., Esparon S.E., Kristensen A.B., Kent S.J., Hogarth P.M. Dimeric FcγR ectodomains as probes of the Fc receptor function of anti-influenza virus IgG. J. Immunol. 2016;197:1507–1516. doi: 10.4049/jimmunol.1502551. [DOI] [PubMed] [Google Scholar]
- 30.Parsons M.S., Lloyd S.B., Lee W.S., Kristensen A.B., Amarasena T., Center R.J., Keele B.F., Lifson J.D., LaBranche C.C., Montefiori D. Partial efficacy of a broadly neutralizing antibody against cell-associated SHIV infection. Sci. Transl. Med. 2017;9:eaaf1483. doi: 10.1126/scitranslmed.aaf1483. [DOI] [PubMed] [Google Scholar]
- 31.Anand S.P., Prévost J., Baril S., Richard J., Medjahed H., Chapleau J.P., Tolbert W.D., Kirk S., Smith A.B., III, Wines B.D. Two families of env antibodies efficiently engage Fc-γ receptors and eliminate HIV-1-infected cells. J. Virol. 2019;93:e01823-18. doi: 10.1128/JVI.01823-18. [DOI] [PMC free article] [PubMed] [Google Scholar]
- 32.Kurtovic L., Atre T., Feng G., Wines B.D., Chan J.A., Boyle M.J., Drew D.R., Hogarth P.M., Fowkes F.J.I., Bergmann-Leitner E.S., Beeson J.G. Multi-functional antibodies are induced by the RTS,S malaria vaccine and associated with protection in a phase I/IIa trial. J. Infect. Dis. 2020:jiaa144. doi: 10.1093/infdis/jiaa144. [DOI] [PMC free article] [PubMed] [Google Scholar]
- 33.McLean M.R., Madhavi V., Wines B.D., Hogarth P.M., Chung A.W., Kent S.J. Dimeric Fcγ receptor enzyme-linked immunosorbent assay to study HIV-specific antibodies: a new look into breadth of Fcγ receptor antibodies induced by the RV144 vaccine trial. J. Immunol. 2017;199:816–826. doi: 10.4049/jimmunol.1602161. [DOI] [PubMed] [Google Scholar]
- 34.Vanderven H.A., Jegaskanda S., Wines B.D., Hogarth P.M., Carmuglia S., Rockman S., Chung A.W., Kent S.J. Antibody-dependent cellular cytotoxicity responses to seasonal influenza vaccination in older adults. J. Infect. Dis. 2017;217:12–23. doi: 10.1093/infdis/jix554. [DOI] [PubMed] [Google Scholar]
- 35.Choi I., Chung A.W., Suscovich T.J., Rerks-Ngarm S., Pitisuttithum P., Nitayaphan S., Kaewkungwal J., O’Connell R.J., Francis D., Robb M.L. Machine learning methods enable predictive modeling of antibody feature:function relationships in RV144 vaccinees. PLoS Comput. Biol. 2015;11:e1004185. doi: 10.1371/journal.pcbi.1004185. [DOI] [PMC free article] [PubMed] [Google Scholar]
- 36.Chung A.W., Kumar M.P., Arnold K.B., Yu W.H., Schoen M.K., Dunphy L.J., Suscovich T.J., Frahm N., Linde C., Mahan A.E. Dissecting polyclonal vaccine-induced humoral immunity against HIV using systems serology. Cell. 2015;163:988–998. doi: 10.1016/j.cell.2015.10.027. [DOI] [PMC free article] [PubMed] [Google Scholar]
- 37.Vaccari M., Gordon S.N., Fourati S., Schifanella L., Liyanage N.P., Cameron M., Keele B.F., Shen X., Tomaras G.D., Billings E. Adjuvant-dependent innate and adaptive immune signatures of risk of SIVmac251 acquisition. Nat. Med. 2016;22:762–770. doi: 10.1038/nm.4105. [DOI] [PMC free article] [PubMed] [Google Scholar]
- 38.Kratochvil S., McKay P.F., Kopycinski J.T., Bishop C., Hayes P.J., Muir L., Pinder C.L., Cizmeci D., King D., Aldon Y. A phase 1 human immunodeficiency virus vaccine trial for cross-profiling the kinetics of serum and mucosal antibody responses to CN54gp140 modulated by two homologous prime-boost vaccine regimens. Front. Immunol. 2017;8:595. doi: 10.3389/fimmu.2017.00595. [DOI] [PMC free article] [PubMed] [Google Scholar]
- 39.Marino S., Hogue I.B., Ray C.J., Kirschner D.E. A methodology for performing global uncertainty and sensitivity analysis in systems biology. J. Theor. Biol. 2008;254:178–196. doi: 10.1016/j.jtbi.2008.04.011. [DOI] [PMC free article] [PubMed] [Google Scholar]
- 40.Santillán M. On the use of the hill functions in mathematical models of gene regulatory networks. Math. Model. Nat. Phenom. 2008;3:85–97. [Google Scholar]
- 41.Lloyd S.B., Niven K.P., Kiefel B.R., Montefiori D.C., Reynaldi A., Davenport M.P., Kent S.J., Winnall W.R. Exploration of broadly neutralizing antibody fragments produced in bacteria for the control of HIV. Hum. Vaccin. Immunother. 2017;13:2726–2737. doi: 10.1080/21645515.2017.1368935. [DOI] [PMC free article] [PubMed] [Google Scholar]
- 42.Parsons M.S., Lee W.S., Kristensen A.B., Amarasena T., Khoury G., Wheatley A.K., Reynaldi A., Wines B.D., Hogarth P.M., Davenport M.P. Fc-dependent functions are redundant to efficacy of anti-HIV antibody PGT121 in macaques. J. Clin. Invest. 2019;129:182–191. doi: 10.1172/JCI122466. [DOI] [PMC free article] [PubMed] [Google Scholar]
- 43.Cai H., Zhang R.S., Orwenyo J., Giddens J., Yang Q., LaBranche C.C., Montefiori D.C., Wang L.X. Synthetic HIV V3 glycopeptide immunogen carrying a N334 N-glycan induces glycan-dependent antibodies with promiscuous site recognition. J. Med. Chem. 2018;61:10116–10125. doi: 10.1021/acs.jmedchem.8b01290. [DOI] [PMC free article] [PubMed] [Google Scholar]
- 44.Kratochvil S., McKay P.F., Chung A.W., Kent S.J., Gilmour J., Shattock R.J. Immunoglobulin G1 allotype influences antibody subclass distribution in response to HIV gp140 vaccination. Front. Immunol. 2017;8:1883. doi: 10.3389/fimmu.2017.01883. [DOI] [PMC free article] [PubMed] [Google Scholar]
- 45.Jefferis R., Lefranc M.P. Human immunoglobulin allotypes: possible implications for immunogenicity. MAbs. 2009;1:332–338. doi: 10.4161/mabs.1.4.9122. [DOI] [PMC free article] [PubMed] [Google Scholar]
- 46.Johnson W.E., Kohn P.H., Steinberg A.G. Population genetics of the human allotypes Gm, Inv, and A2m. Clin. Immunol. Immunopathol. 1977;7:97–113. doi: 10.1016/0090-1229(77)90034-4. [DOI] [PubMed] [Google Scholar]
- 47.Bruggeman C.W., Dekkers G., Bentlage A.E.H., Treffers L.W., Nagelkerke S.Q., Lissenberg-Thunnissen S., Koeleman C.A.M., Wuhrer M., van den Berg T.K., Rispens T. Enhanced effector functions due to antibody defucosylation depend on the effector cell Fcγ receptor profile. J. Immunol. 2017;199:204–211. doi: 10.4049/jimmunol.1700116. [DOI] [PubMed] [Google Scholar]
- 48.Dekkers G., Plomp R., Koeleman C.A., Visser R., von Horsten H.H., Sandig V., Rispens T., Wuhrer M., Vidarsson G. Multi-level glyco-engineering techniques to generate IgG with defined Fc-glycans. Sci. Rep. 2016;6:36964. doi: 10.1038/srep36964. [DOI] [PMC free article] [PubMed] [Google Scholar]
- 49.Li T., DiLillo D.J., Bournazos S., Giddens J.P., Ravetch J.V., Wang L.X. Modulating IgG effector function by Fc glycan engineering. Proc. Natl. Acad. Sci. USA. 2017;114:3485–3490. doi: 10.1073/pnas.1702173114. [DOI] [PMC free article] [PubMed] [Google Scholar]
- 50.Subedi G.P., Barb A.W. The immunoglobulin G1 N-glycan composition affects binding to each low affinity Fc γ receptor. MAbs. 2016;8:1512–1524. doi: 10.1080/19420862.2016.1218586. [DOI] [PMC free article] [PubMed] [Google Scholar]
- 51.Chung A.W., Crispin M., Pritchard L., Robinson H., Gorny M.K., Yu X., Bailey-Kellogg C., Ackerman M.E., Scanlan C., Zolla-Pazner S., Alter G. Identification of antibody glycosylation structures that predict monoclonal antibody Fc-effector function. AIDS. 2014;28:2523–2530. doi: 10.1097/QAD.0000000000000444. [DOI] [PMC free article] [PubMed] [Google Scholar]
- 52.Forthal D.N., Gabriel E.E., Wang A., Landucci G., Phan T.B. Association of Fcγ receptor IIIa genotype with the rate of HIV infection after gp120 vaccination. Blood. 2012;120:2836–2842. doi: 10.1182/blood-2012-05-431361. [DOI] [PMC free article] [PubMed] [Google Scholar]
- 53.Mahan A.E., Jennewein M.F., Suscovich T., Dionne K., Tedesco J., Chung A.W., Streeck H., Pau M., Schuitemaker H., Francis D. Antigen-specific antibody glycosylation is regulated via vaccination. PLoS Pathog. 2016;12:e1005456. doi: 10.1371/journal.ppat.1005456. [DOI] [PMC free article] [PubMed] [Google Scholar]
- 54.Chung A.W., Alter G. Systems serology: profiling vaccine induced humoral immunity against HIV. Retrovirology. 2017;14:57. doi: 10.1186/s12977-017-0380-3. [DOI] [PMC free article] [PubMed] [Google Scholar]
- 55.Dugast A.S., Arnold K., Lofano G., Moore S., Hoffner M., Simek M., Poignard P., Seaman M., Suscovich T.J., Pereyra F. Virus-driven inflammation is associated with the development of bNAbs in spontaneous controllers of HIV. Clin. Infect. Dis. 2017;64:1098–1104. doi: 10.1093/cid/cix057. [DOI] [PMC free article] [PubMed] [Google Scholar]
- 56.Selva K.J., van de Sandt C.E., Lemke M.M., Lee C.Y., Shoffner S.K., Chua B.Y., Davis S.K., Nguyen T.H.O., Rowntree L.C., Hensen L. Systems serology detects functionally distinct coronavirus antibody features in children and elderly. Nat. Commun. 2021;12:2037. doi: 10.1038/s41467-021-22236-7. [DOI] [PMC free article] [PubMed] [Google Scholar]
- 57.Tosif S., Neeland M.R., Sutton P., Licciardi P.V., Sarkar S., Selva K.J., Do L.A.H., Donato C., Quan Toh Z., Higgins R. Immune responses to SARS-CoV-2 in three children of parents with symptomatic COVID-19. Nat. Commun. 2020;11:5703. doi: 10.1038/s41467-020-19545-8. [DOI] [PMC free article] [PubMed] [Google Scholar]
- 58.Madhavi V., Wines B.D., Amin J., Emery S., Lopez E., Kelleher A., Center R.J., Hogarth P.M., Chung A.W., Kent S.J., Stratov I., ENCORE1 Study Group. Sydney LTNP Study Group HIV-1 env- and Vpu-specific antibody-dependent cellular cytotoxicity responses associated with elite control of HIV. J. Virol. 2017;91:e00700-17. doi: 10.1128/JVI.00700-17. [DOI] [PMC free article] [PubMed] [Google Scholar]
- 59.Raedler M.D., Heyne S., Wagner E., Shalkowski S.K., Secore S., Anderson A.S., Cook J., Cope L., McNeely T., Retzlaff M. Serologic assay to quantify human immunoglobulin G antibodies to the Staphylococcus aureus iron surface determinant B antigen. Clin. Vaccine Immunol. 2009;16:739–748. doi: 10.1128/CVI.00478-08. [DOI] [PMC free article] [PubMed] [Google Scholar]
Associated Data
This section collects any data citations, data availability statements, or supplementary materials included in this article.
Supplementary Materials
Data Availability Statement
De-identified individual RV144 IgG subtype concentration data (estimated from MFI measurements) and all data within figures have been deposited at Figshare and are publicly available as of the date of publication. DOIs are listed in the Key resources table.
All original MATLAB code for running personal simulations, surface simulations, and sensitivity analyses has been deposited at GitHub and linked through Figshare and is publicly available as of the date of publication. DOIs are listed in the Key resources table.
Any additional information required to re-analyze the data reported in this paper is available from the lead contact upon request.