

Abstract
During cytokinesis, animal cells rapidly remodel the equatorial cortex to build an aligned array of actin filaments called the contractile ring. Local reorientation of filaments by active equatorial compression is thought to underlie the emergence of filament alignment during ring assembly. Here, combining single molecule analysis and modeling in one-cell C. elegans embryos, we show that filaments turnover is far too fast for reorientation of individual filaments by equatorial compression to explain the observed alignment, even if favorably oriented filaments are selectively stabilized. By tracking single formin/CYK-1::GFP particles to monitor local filament assembly, we identify a mechanism that we call filament-guided filament assembly (FGFA), in which existing filaments serve as templates to orient the growth of new filaments. FGFA sharply increases the effective lifetime of filament orientation, providing structural memory that allows cells to build highly aligned filament arrays in response to equatorial compression, despite rapid turnover of individual filaments.
Graphical Abstract

eTOC Blurb
Li and Munro identify an important role in cytokinesis for filament-guided filament assembly (FGFA), in which formin-assembled actin filaments use existing filaments to orient their growth. FGFA provides the equatorial cortex with structural memory of filament alignment, allowing cells to build and maintain a highly aligned contractile ring.
Introduction
Non-muscle cells assemble contractile actomyosin arrays to do a variety of jobs, such as cell polarization, cell division, cell migration, wound healing and multicellular tissue morphogenesis (reviewed in (Agarwal and Zaidel-Bar, 2019; Levayer and Lecuit, 2012; Munjal and Lecuit, 2014)). Contractile arrays are assembled from actin filaments, crosslinking proteins, and bipolar myosin II minifilaments, together with various accessory factors that regulate filament assembly, disassembly and motor activity. How assembly/disassembly and activity of contractile arrays are tuned in different ways to build and maintain specific functional architectures remains a fundamental question in cell biology.
One quintessential example of a contractile actomyosin array is the contractile ring, a dynamic network of cross-linked actin filaments and myosin motors that assembles at the cell equator and constricts to divide a single cell into two daughters (Fededa and Gerlich, 2012; Glotzer, 2017; Green et al., 2012; Pollard and O’Shaughnessy, 2019). In animal cells, spatial and temporal control of contractile ring assembly is mediated by equatorial activation of the small GTPase RhoA (Bement et al., 2005; Nishimura and Yonemura, 2006; Yüce et al., 2005). At anaphase onset, local positive and negative signals from the mitotic apparatus specify an equatorial zone of RhoA activity (Glotzer, 2017). RhoA in turn acts through multiple effectors to promote contractile ring assembly. In particular, RhoA binds and activates diaphanous-related formins to promote the local assembly of unbranched actin filaments (Castrillon and Wasserman, 1994; Davies et al., 2014; Großhans et al., 2005; Watanabe et al., 1997, 2010), and it binds and activates Rho Kinase (ROCK) to promote the local recruitment/activation of myosin II (Matsumura, 2005). An initially disorganized network of filaments and motors is then reorganized over time into a more circumferentially aligned array. Although oriented filaments are not required for network contractility, increased filament alignment is associated with increased circumferential tension (Bidone et al., 2014; Spira et al., 2017; Stachowiak et al., 2014) and thus may be important for timely progression and completion of cytokinesis. But how cells build and maintain filament alignment during contractile ring assembly and constriction remains poorly understood.
One model for contractile ring assembly has emerged from intensive studies in fission yeast (Pollard and Wu, 2010). In fission yeast, the contractile ring forms through the coalescence of a broad equatorial band of membrane-attached nodes containing the anillin-related protein Mid-1 (Wu et al., 2003, 2006). During contractile ring assembly, Mid1p nodes recruit and scaffold the formin Cdc-12 and the myosin II Myp2; Cdc-12 promotes the nucleation and elongation of actin filaments, and chance capture of these filaments by Myp2 motors on neighboring nodes produces forces that pull nodes together. Cofilin-mediated filament disassembly allows for rapid cycles of search, capture, pull and release (SCPR) (Chen and Pollard, 2011). Empirically constrained computer simulations have shown that SCPR is sufficient to explain the rapid coalescence of nodes from a broad equatorial band into a tight equatorial ring (Vavylonis et al., 2008). The same interactions could also contribute to maintaining filament alignment within the ring, if filament turnover is sufficiently slow (Stachowiak et al., 2014).
In animal cells, the contractile ring forms within a dense array of filaments and motors, in which discrete nodes that anchor sites of filament assembly and/or myosin activity are harder to detect (although see (Henson et al., 2017)). White and Borisy proposed an alternative to the SCPR model to explain how a dense aligned array of filaments could form at the equator during cytokinesis (White and Borisy, 1983). This model views the cortex as a contractile material, in which local activation of contractility at the equator, and inhibition (relaxation) at the poles, creates a gradient of cortical tension, resulting in a flow of cortical filaments away from the poles and towards the equator, leading to local axial compression of the equatorial cortex. White and Borisy postulated that local reorientation of filaments, driven by axial compression, could promote the formation of a circumferentially aligned array of equatorial filaments. Compressive flows of cortical material have been documented during cytokinesis in a variety of different cell types (Fishkind et al., 1996; Khaliullin et al., 2018; Murthy and Wadsworth, 2005; Reymann et al., 2016; Zhou and Wang, 2008). Mathematical models suggest that reorientation of actin filaments by axial compression could be sufficient to explain the degree of filament alignment observed during contractile ring assembly in some cells (Reymann et al., 2016; Salbreux et al., 2009; White and Borisy, 1983), if compression rates are sufficiently fast and/or individual filaments are sufficiently stable. However, these assumptions have not been tested by direct measurements of compression rates and filament turnover in the same cell.
Here we combine TIRF microscopy with single molecule imaging/particle tracking to measure rates of axial compression and filament disassembly during cytokinesis in one-cell C. elegans embryos. We find that filament disassembly is far too fast for the reorientation of individual filaments by axial compression to explain the rapid emergence and stable maintenance of filament alignment within the contractile ring. We identify an additional mechanism, in which actin filaments assembled by the formin CYK-1 use existing filaments as templates to orient their elongation. Combining quantitative image analysis with mathematical modeling, we show that filament-guided filament assembly endows the contractile ring with a structural memory of filament alignment that allows the C. elegans embryo to build and maintain a high degree of filament alignment within the contractile ring despite very rapid filament turnover. We propose that similar mechanisms may underlie the assembly and maintenance of aligned filament arrays in many other contexts.
Results
Myosin-dependent axial compression drives the rapid emergence of equatorial filament alignment during contractile ring assembly.
To optimize imaging conditions for quantitative analysis of cortical dynamics, we mounted embryos under coverslips using 16 µm diameter beads as spacers to achieve a uniform degree of compression. Because mild compression can affect overall cortical dynamics (Singh et al., 2019), we began by characterizing the dynamics of contractile ring assembly and furrow ingression in mildly compressed embryos, using near-TIRF microscopy to image probes for cortical F-actin (GFP::UTR (Tse et al., 2012)) and myosin II (NMY-2::mKate2 (Dickinson et al., 2017), Figure 1A, Movie S1, STAR methods). We aligned and averaged these data using the rapid initial rise of equatorial myosin, and took the time at which the averaged equatorial myosin intensity first begins to increase as an estimate of anaphase onset ((Werner et al., 2007), Figure 1B, STAR methods). We quantified furrow initiation and progression by measuring the width of the region that is in focus at the site of furrow ingression (Figure 1B). Using measurements of equatorial width and equatorial densities of F-actin and myosin II, we divided early cytokinesis into three phases (Figure 1A, B). Phase I (cortical assembly) begins with anaphase onset and is characterized by rapid accumulation of F-actin and myosin II with minimal equatorial deformation. Phase II (ring formation/furrow initiation) is characterized by the emergence of filament alignment at roughly constant F-actin and myosin II density, accompanied by the initiation and slow ingression of an equatorial furrow. Phase III is characterized by the transition to rapid furrow ingression.
Figure 1. Accumulation and alignment of equatorial actin filaments during cytokinesis.

(A) Surface views of cortical myosin II (NMY-2::mKate2, top panels) and F-actin (UTR::GFP, bottom panels) obtained by near-TIRF imaging at the indicated time points, measured relative to an estimate of anaphase onset (see text for details). Anterior is to the left in this and all subsequent figures. Scale bars = 5 µm. See also Move S1;
(B) Measurements of equatorial width (black), mean intensities of F-actin (light grey) and myosin II (dark grey) over time during cytokinesis. Color overlays indicate the three phases of cytokinesis: Phase I (green), Phase II (red), and Phase III (blue). Error bars indicate SEM (n = 5 embryos). Top schematic indicates the regions used for measurements of probe densities (box), and equatorial width (double headed black arrow).
(C) Kymographs showing axial (left) and equatorial (rotational) (right) cortical flows for the embryo in (A). Top schematic: regions used to make axial and equatorial kymographs. Color overlays mark the three phases of cytokinesis. Yellow arrows are provided as a guide to indicate the general direction and speed of flow. Scale bars = 2 µm.
(D) Magnified views of UTR::GFP on the equatorial cortex, from the embryo in (A), showing the emergence of filament alignment over time. Yellow dashed lines indicate the cell boundary. Color overlays mark the three phases of cytokinesis. Scale bar = 2 µm.
(E) Radial histograms showing the distribution of local filament orientations at the equator at onset of anaphase (left) and rapid furrow ingression (right) (n = 5 embryos).
(F) Plot of the mean filament orientation bias vs. time measured on the equatorial cortex during early cytokinesis. The orientation bias is defined for one embryo to be ratio of the number of filaments with orientations within 10° of equatorial (90°) to the number of filaments with orientations within 10° of axial (0°). Solid line indicates the mean and error bars indicate SEM measured for n = 5 embryos.
We used kymography to characterize the pattern and timing of cortical flows during contractile ring assembly in mildly compressed embryos. A transient posterior to anterior flow during Phase I was followed by compressive flow, centered on the equator, that persists through Phases II and III (Figure 1C; left kymograph). We also observed a transient cortical rotation, perpendicular to the AP axis (Schonegg et al., 2014; Singh et al., 2019), during Phase I, that attenuates during Phases II and III (Figure 1C; right kymograph).
To quantify the emergence of equatorial filament alignment during Phases I and II (Figure 1D), we measured the amplitudes and directions of local gradients in the intensity of GFP::UTR, which reflect the orientations of linear elements within the actin network, which are probably small filament bundles (Figure S1A,B, STAR methods). We computed a normalized distribution of intensity gradient directions, weighted by gradient amplitude (Figure 1E, Figure S1A,B, STAR methods). Then we defined the filament orientation bias to be the ratio of histogram densities within 10° of equatorial (90°) and axial (0°) directions (Figure 1F). Consistent with direct observations, the orientation bias was close to 1.2 at anaphase onset (Figure 1E,F); it increased slowly and steadily during Phase I and early Phase II, and then increased more sharply during late Phase II, reaching a mean value of ~2.5 at the onset of rapid furrow ingression (Figure 1E,F). In contrast, the distribution of polar filament orientations remained largely isotropic from anaphase onset through the end of Phase II (Fig S1E). Measurements in fixed, phalloidin-stained embryos suggest that equatorial filaments become even more aligned in uncompressed embryos (Figure S1C), but here we used the lower values for direct comparison with the single molecule measurements reported below.
In NMY-2:: mKate2; GFP::UTR embryos strongly depleted of NMY-2 by RNAi, a rapid increase in the density of equatorial filaments occurred with similar timing after anaphase onset (Figure S2A,B). However, both axial and equatorial cortical flows were abolished (Figure S2C), and the distribution of equatorial filament orientations remained isotropic after ~90 seconds, corresponding to the end of Phase II in control embryos (Figure S2D). Thus, in agreement with previous work (Reymann et al., 2016), myosin-driven contraction is required for the rapid emergence of filament alignment prior to ring constriction.
A simple model predicts the dependence of equatorial filament alignment on rates of filament turnover and axial compression.
We developed a simple model to make quantitative predictions about how the emergence of filament alignment is shaped by the interplay of filament assembly, reorientation of existing filaments by axial compression and filament disassembly (Figure 2A). We modeled a population of filaments within a patch of equatorial cortex of width w(t) that undergoes axial compression with a constant strain rate (Figure 2B). We assumed that filaments assemble within the patch at a rate kass(θ) and disassemble at a rate kdiss(θ)ρ(θ), where ρ(θ) is the density of filaments with orientation θ, and the assembly and disassembly rates, kass and kdiss, can depend on filament orientation. We assume that the patch boundaries move with local flow, such that there is no net movement of filaments into/out of the patch (Figure 2B). Thus the rate of change in density of filaments with orientation θ is given by
Figure 2. A simple model for filament realignment in compressive flow.
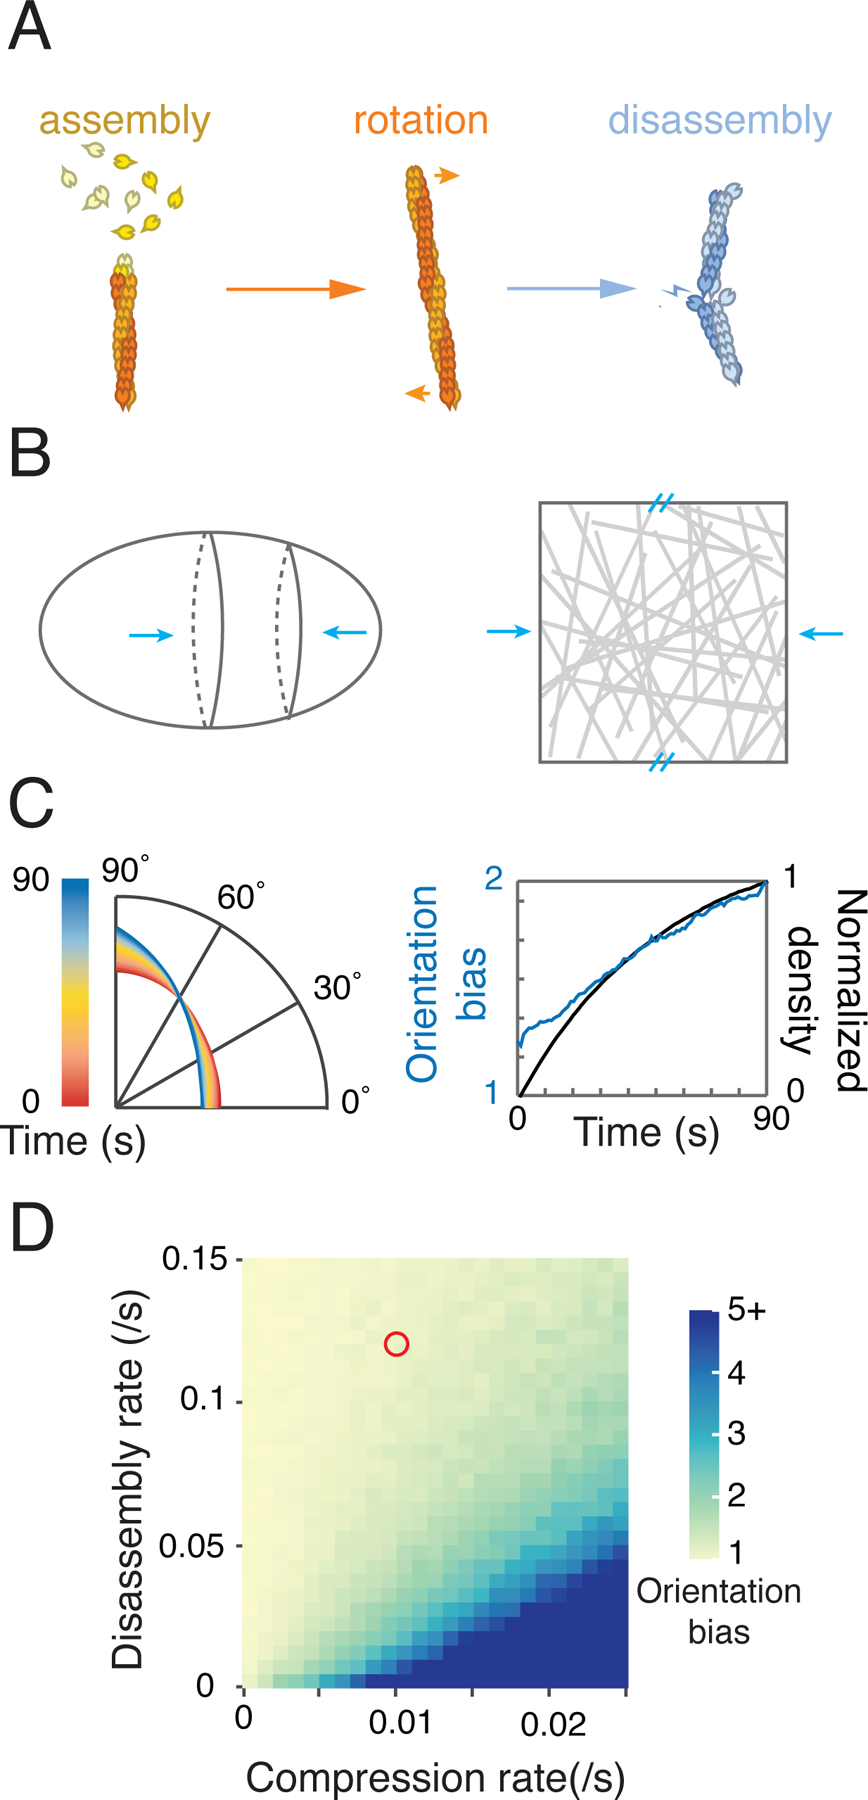
(A) Schematic overview of the three processes that determine filament number and orientation: local assembly, rotation by contractile flow, and local disassembly.
(B) Model representation of a patch of equatorial cortex undergoing uniform axial compression. Top and bottom boundaries of the patch are fixed, while left and right boundaries move at the rate of cortical flow, such that there is no flux of filaments across those boundaries.
(C) Model output for one choice of model parameters. Left: Time evolution of the filament orientation distribution. Color map indicates simulation time. Right: Plot of the filament orientation bias (blue) and normalized filament density (black) vs. time. Parameters: contraction rate ξ = 0.01/s, disassembly rate constant kdiss = 0.03/s.
(D) Simulation outcomes for different values of equatorial compression rate ξ and disassembly rate constant kdiss, color coded for the filament orientation bias achieved after 90 sec. Red circle indicates the predicted orientation bias for the axial compression and actin disassembly rates measured in vivo.
Note that local axial compression (ξ < 0) concentrates filaments, offsetting the effect of disassembly.
Finally, we assumed that the cortical filament network undergoes locally affine deformation, i.e. the change in a filament’s orientation is determined only by the movements of its endpoints, such that the rate of change of a filament’s orientation is given by:
Combining these assumptions (see STAR methods) yields an equation that describes the time evolution of a distribution of filament orientations within the equatorial patch:
| (1) |
We first considered a simple scenario in which axial compression rate ξ is constant and both assembly and disassembly rates do not depend on orientation (kass(θ) = kass; kdiss(θ) = kdiss). For this scenario (see STAR methods), the total density of filaments approaches a steady state given by . Scaling ρ(θ) by ρtotal, we obtain:
| (2) |
Equation 2 captures the dynamic balance of two processes: reorientation of filaments by axial compression builds alignment perpendicular to the axis of flow; orientation-independent disassembly (offset by compression) drives filament orientations back towards a flat (isotropic) distribution. For this simple scenario, the time evolution of filament orientations depends only on the disassembly and compression rates kdiss and ξ.
To quantify this dependence, we implemented our model as a simple stochastic simulation (see STAR methods). We initialized simulations with the distribution of filament orientations observed during Phase I, ran them for 90 seconds (the total duration of Phases I and II), and monitored filament density and orientation bias (Figure 2C). Plotting orientation bias as a function of kdiss and ξ (Figure 2D) reveals the range of values for which orientation-independent assembly and disassembly can produce the observed orientation bias.
Filament turnover is too fast for reorientation of actin filaments by cortical flow to explain the emergence of equatorial filament alignment.
To test whether reorientation of single filaments by axial compression is sufficient to explain the emergence of filament alignment, we used single molecule imaging and particle tracking analysis (Watanabe and Mitchison, 2002; Robin et al., 2014; Yamashiro et al., 2014, 2018) to measure rates of axial compression and F-actin disassembly during cytokinesis in vivo. Briefly, we used near-TIRF microscopy to image embryos expressing actin-GFP at densities where polymerized actin::GFP appears as bright diffraction-limited spots, with a mean separation > 1.5 µm, more than 95% of which are single molecules, as established by our previous work ((Robin et al., 2014), Figure 3A). Under these conditions, the appearance of actin:GFP molecules reports on local polymerization, their disappearance (corrected for photobleaching; see below) reports on local depolymerization, and their local movements report on local displacements of polymerized actin.
Figure 3. Single molecule measurements of equatorial compression and disassembly rates in vivo.

(A) Near-TIRF image of an embryo expressing actin::GFP at single molecule levels, taken under standard conditions for single particle tracking. See also Movie S2. Scale bar = 5 μm.
(B) Kymograph showing axial positions vs time for a randomly selected subset of the trajectories of single actin::GFP molecules that are obtained from the image sequence shown in Movie S2. Compare with the axial flow shown in the left panel of Figure 1C. Colors indicate the three phases: Green indicates cortex assembly phase (Phase I); Red indicates ring formation phase (Phase II); Blue indicates rapid furrow ingression phase (Phase III). Gray box indicates the equatorial region (6 μm wide) in which disassembly rates are measured.
(C) Mean axial speed of single molecules measured at different positions along the anterior-posterior axis at different time points during cytokinesis for one embryo. A negative value indicates anterior movement. Gray box indicates the equatorial region (6 μm wide), and the color map indicates the time at which each curve was measured relative to anaphase onset. Solid lines and error bars indicate the mean +/− SEM for the local polynomial regressions (see STAR methods). More than 1347 measured displacements were used to fit each curve (see also Figure S3A&B).
(D) Mean axial compression rate measured for the embryo in (C). Gray box indicates the equatorial region (6 μm wide), and the color map indicates the time at which each curve was measured relative to anaphase onset.
(E) Mean equatorial compression rate vs. time measured for five different embryos. Plots are aligned relative to the onset of Phase III (rapid furrow ingression). Gray lines show data for individual embryos. Black line and error bars indicate the mean +/− SEM (n = 5 embryos).
(F) Rate constants for F-actin disassembly measured in the equatorial region during a 30 second window prior to the onset of rapid furrow ingression) for wild type (n = 5) and arx-2 (RNAi) (n = 6) embryos. See also Figure S3C–F.
We performed particle-tracking analysis to sample single molecule displacements throughout the cortex over time, from before anaphase onset through the initial phase of rapid furrow ingression. (Figure 3A&B, Movie S2). Plotting the axial positions of actin::GFP single molecules vs time reveals a coherent pattern of cortical flow similar to that observed with GFP::UTR (compare Figure 3B with left panel of Figure 1C). We observed only small deviations of single molecule movements from the bulk flow of surrounding molecules, consistent with our assumption that the cortical network undergoes a locally affine deformation (Figure 3B).
To quantify the rate of axial compression during contractile ring assembly, we measured the axial displacements of single molecules over 2.25 second intervals. We binned these data over 13.5 second intervals (Figure S3A), and then used local polynomial regression to obtain smooth estimates of mean axial velocity as a function of position and time during Phases I and II (Figure 3C, Figure S3A, STAR methods). We observed a linear decrease in axial velocity within the equatorial region (grey rectangle in Figure 3C), indicating a region of ~uniform axial compression. We computed local compression rate from the spatial derivative of axial velocity (Figure 3D), and then used the onset of Phase III/rapid furrow ingression to align and average data from multiple embryos. This analysis revealed a steady increase in axial compression rate from anaphase onset through the onset of rapid furrow ingression, approaching a maximum value of 0.011 +/− 0.001 /sec (n = 5 embryos; Figure 3E), in agreement with previous estimates made by other methods (Khaliullin et al., 2018; Reymann et al., 2016).
To estimate F-actin disassembly rates, for actin::GFP molecules observed within a given time window and region of interest, we constructed decay curves by plotting the percentage of molecules with lifetime > L sec for different values of L (Figure S3C). These decay curves were well-fit by single exponentials (Figure S3C), indicating a single dominant decay rate constant, kdecay, which is the sum of an intrinsic F-actin disassembly rate constant kdiss and a photobleaching rate constant kpb. As in previous work (Robin et al., 2014), holding the exposure time constant and varying the “duty ratio” of exposure (the fraction of time that the embryo is exposed to laser light) allowed us to obtain separate estimates of the photobleaching and F-actin disassembly rate constants (kpb= 0.13/s; kdiss= 0.12/s; Figure 3F; Figure S3C,D,E; STAR methods).
Because GFP-tagged actin monomers tend to incorporate less efficiently into formin-assembled filaments (Chen et al., 2012), our measurements could reflect a biased contribution from disassembly of branched actin filaments. To address this concern, we measured filament disassembly rates in embryos strongly depleted of the C. elegans orthologue of the Arp2/3 complex subunit ARPC22 (ARX-2), in which the majority of filaments are assembled by the formin CYK-1 (Chan et al., 2019). We again observed mono-exponential decay kinetics (Figure S3F), with a slight increase in the estimated disassembly rate constant to kdiss= 0.167/s (Figure 3F). Thus, CYK-1 can utilize actin::GFP to assemble filaments, and our approach reports on the disassembly of formin-assembled filaments within the contractile ring, although it may slightly underestimate disassembly rate.
Using the maximum compression rate (0.01/s) and the mean disassembly rate constant (kdiss= 0.12/s) measured above, our simple model predicts that filament orientation bias will reach only 1.19 after 90 seconds, (red spot in Figure 2D). Thus, if filaments assemble and disassemble with no orientation bias, then filament turnover is far too fast for compressive flows to build the degree of filament alignment observed during cytokinesis in C. elegans zygotes. In essence, small increments in filament alignment produce by reorientation of single filaments are rapidly forgotten as these partially aligned filaments are replaced by new randomly oriented ones.
Preferential stabilization of correctly oriented filaments cannot explain robust alignment.
In principle, the selective stabilization of co-aligned filaments, through recruitment of factors like anillin (Tian et al., 2015), could help to explain the rapid emergence of filament alignment in C. elegans zygotes. To test this possibility, we introduced into our model a simple tunable form of orientation dependent disassembly (Figure S4A), defined by:
where kdiss(θ) is the disassembly rate of a single actin filament as a function of its orientation θ, which varies between 0° and 90°; kmin is the maximum disassembly rate (for θ = 0°); kmin is the minimum disassembly rate (for θ = 90°); and K and n define the threshold and steepness of the dependence on θ. We systematically sampled K, n, kmin and kmax, seeking parameter values for which simulations reproduced both the mean disassembly rates and the time-dependent changes in filament density and orientation bias measured in vivo, given our measured values for equatorial compression rate vs time (Figure 3E). We readily identified parametervalues for which simulations reproduced mean disassembly rates and filament orientation bias measured at 90 sec after anaphase onset (Figure S4B). However, for none of these did simulations also reproduce the time-dependent changes in filament density and orientation bias observed in vivo (Figure S4C,D). In simulations, a rapid rise in filament orientation bias was always accompanied by a rapid increase in filament stability, and thus by a rapid increase in filament density (Figure S4E). By contrast, in vivo, filament density increases rapidly during Phase I and plateaus during Phase II, while filament orientation bias increases slowly until mid-Phase II and sharply thereafter (Figure S4C). Therefore, selective stabilization of aligned filaments cannot explain the rapid emergence of filament alignment during contractile ring assembly in C. elegans.
CYK-1-dependent filament elongation is directionally biased at the equator during cytokinesis.
A third possibility is that the orientation of actin filament assembly is biased to favor circumferential alignment. To test this, we developed an approach to measure the orientation of filament elongation during cytokinesis in embryos expressing an endogenously-tagged form of the formin CYK-1 (CYK-1::GFP) (Padmanabhan et al., 2017). CYK-1 is required for contractile ring assembly and cytokinesis in early C. elegans embryos (Davies et al., 2014; Severson et al., 2002; Swan et al., 1998). Like other diaphanous-related formins, CYK-1 dimers associate with the barbed ends of rapidly elongating actin filaments (Figure 4A). Therefore, directional movements of CYK-1 molecules should provide a direct readout of the orientation of filament growth.
Figure 4. Orientation of formin-dependent filament growth is biased with respect to the equatorial axis during cytokinesis.

(A) Schematic view of formin-mediated actin filament assembly. Formin dimers remain associated with the barbed ends of elongating filaments.
(B) Surface view of a one-cell embryo at anaphase onset expressing CYK-1::GFP, and processed to highlight moving CYK-1::GFP particles (see STAR methods and Movie S3), Scale bar = 5 μm.
(C) Focus on a single CYK-1::GFP trajectory during cytokinesis in a wild-type embryo. (i) Maximum intensity projection of a small region of interest over time reveals moving CYK-1 particles. (ii) Trajectory of a single moving CYK-1::GFP particle is highlighted in orange. (iii) Kymograph made by straightening the orange trajectory reveals ~constant speed. Scale bar = 2 μm.
(D) Sequence of images from the polar region of an embryo expressing CYK-1::GFP/LifeAct::mCherry and partially depleted of NMY-2. Yellow circles highlight a CYK-1::GFP particle (red) moving into a region of low F-actin density, leaving a newly assembled actin filament (green) behind it. See also Movie S5. Scale bar = 2 μm.
(E) Distribution of elongation rates measured for 41 rapidly directionally moving CYK-1::GFP particle trajectories broken into 170 0.6 sec segments (see STAR methods for details).
(F) Light grey: Distribution of mean speeds for the fast directionally moving CYK-1::GFP particles shown in (G: fast directional motion). Dark grey: distribution of mean speeds measured for actin::GFP molecules that were imaged and tracked as for CYK-1::GFP.
(G) CYK-1 trajectories identified by automated particle tracking analysis. Top panel: Stationary trajectories shown in Movie S3 (minimum intensity projection) with a lifetime > 0.3 sec. Bottom panel: The subset of trajectories selected for fast directional movement (see STAR methods for details, and Movie S4). Rectangles indicate polar (blue) and equatorial (orange) regions used for measurements shown in (H) and (I).
(H) Distribution of movement orientations for the fast directionally moving cortical CYK-1 particles at the equator (orange) and anterior pole (blue) just before anaphase onset (left; n = 1214 equatorial and 2759 polar trajectory segments pooled from 5 embryos) and just before the onset of rapid furrow ingression (right; n = 1263 equatorial and 3258 polar trajectory segments pooled from 5 embryos).
(I) Distribution of movement orientations for the fast directionally moving cortical CYK-1 particles in nmy-2 (RNAi) embryos at the equator and anterior pole 65–90 seconds after anaphase onset. n = 2099 trajectory segments pooled from 4 embryos.
Using near-TIRF microscopy, we could detect CYK-1::GFP at the cortex as diffraction-limited particles (Figure 4B). Many of these particles appear to be stationary, while others undergo rapid directional movement with approximately constant speed (Figure 4C, Movie S3). Fast dual-color imaging of CYK-1::GFP and LifeAct::mCherry revealed the rapid appearance of newly assembled filaments behind a subset of CYK-1::GFP particles moving rapidly through regions of low F-actin density (Figure 4D, Movie S5), confirming that these particles mark the barbed ends of actively elongating actin filaments.
In principle, both stationary and rapidly moving CYK-1::GFP particles could contribute to oriented filament growth. To distinguish their contributions, we first performed a moving minimum intensity projection (~800 msec window) on the raw data to highlight the stationary particles (Movie S3; Minimum intensity projection); then we subtracted this projection from the raw data to enhance the signal associated with non-stationary CYK-1 particles (Movie S3; Raw – minimum intensity projection). We performed particle detection and tracking on both image series to obtain stationary and non-stationary particle trajectories. From these, we estimate that ~ 45% of CYK-1::GFP particles are stationary; this fraction is slightly higher at the equator than at the poles and varies little over time (Figure S5A,B).
Next, we applied a pair of simple filters to identify segments of non-stationary trajectories representing fast, directionally moving CYK-1 particles (Movie S4, STAR methods). We first hand-picked and verified 41 fast moving CYK-1 trajectories, subdivided them into shorter (10 frame = 0.6 second) segments, and calculated their average instantaneous speed to be 1.56 +/-0.29 um/s (Figure 4E), which is similar to the elongation speeds previously measured for formins in other living cells (Funk et al., 2019; Higashida, 2004). Then we subdivided all non-stationary trajectories into ten-frame segments, and adapted a statistical filter developed by Jaqaman et. al. (2008) to select the subset representing directional motion, whose mean velocities were within the range measured for the hand-picked trajectories in Figure 4E (Figure 4F).
If stationary CYK-1::GFP particles contribute to rapid growth of cortical filaments, then the actin::GFP molecules that incorporate into these filaments should undergo rapid directional movements. However, while rapidly moving CYK-1::GFP particles appear as bright streaks in maximum intensity projections (Figure 4C, Figure S5C), we detected no such streaks for actin::GFP (Figure S5C). Moreover, except for a few false positives (Figure S5D, STAR methods), the filters used to detect rapid directionally moving CYK-1 particles detected no rapidly moving actin::GFP molecules (Figure 4F, Figure S5E,F). Therefore, stationary CYK-1::GFP particles do not make a significant contribution to cortical filament growth.
We then quantified filament growth orientations for rapid moving CYK-1::GFP particles in equatorial and polar regions just before anaphase onset, and just before the onset of rapid furrow ingression (Figure 4H). Just before anaphase onset, filament elongation was approximately isotropic in both equatorial and polar regions (Figure 4H; orientation bias = 1 at the equator and 0.97 at the poles (n = 1214 equatorial trajectory segments and 2759 polar trajectory segments in 5 embryos)). Just before the onset of rapid furrow ingression, elongation of polar filaments remained isotropic. However, elongation of equatorial filaments was strongly biased perpendicular to the AP axis (Figure 4H; orientation bias = 2.19 at the equator and 0.94 at the poles (n = 1263 equatorial trajectory segments, and 3258 polar trajectory segments in 6 embryos)). Thus, biased orientation of actin filament assembly underlies the emergence of filament alignment during contractile ring assembly.
Newly assembled filaments use existing filaments to orient their elongation.
These results reveal a correlation between the orientations of existing filaments and the elongation of new filaments. Actin filament orientation and growth are both isotropic on the polar cortex throughout cytokinesis, and at the equator before anaphase onset (Figure 1E &S1E, Figure 4H). However, filament orientation and growth become anisotropic and co-aligned at the equatorial cortex before rapid ring constriction (Figure 1E and Figure 4H). Importantly, in embryos strongly depleted of NMY-2 by RNAi, both equatorial filaments (Figure S2A,E) and equatorial filament growth (Figure 4I; orientation bias = 0.99; n = 2099 trajectory segments in 4 embryos) remained isotropic 65–90 seconds after anaphase onset, These results rule out the possibility that some other equatorial signal biases filament growth orientations independent of existing filament’s orientations. Instead, they suggest that aligned equatorial filaments provide a local directional cue to orient new filament growth.
To examine this further, we analyzed the behavior of CYK-1::GFP particles in embryos expressing both CYK-1::GFP and LifeAct::mCherry. In polar regions, where the density of filaments is lower, we could observe that a significant fraction of fast-moving CYK-1 particles moved along existing actin filaments or small filament bundles. Moreover, in many cases, moving CYK-1 particles altered direction upon encountering an existing filament/bundle, and then subsequently moved along that filament/bundle (Figure 5A, Movie S6). These observations strongly suggest that existing filaments provide cues that act locally and continuously to bias the direction of new filament elongation.
Figure 5. Elongating filaments use existing filaments to orient their growth:

(A) Image montages highlighting three different filament growth trajectories in a one-cell embryo expressing transgenic CYK-1::GFP/LifeAct::mCherry and partially depleted of NMY-2. Yellow arrow heads indicate the position and direction of a rapidly moving CYK-1::GFP particle; dashed yellow lines and arrows at the left indicate actin filament/bundles that the CYK-1 particle moves along. See also Movie S6. Scale bars = 2 μm.
(B) Left panel: Four representative CYK-1 trajectories that enter the equatorial region and then turn to move along the equatorial axis. Each image is a maximum intensity projection of many frames. Dashed lines and white arrows indicate the individual CYK-1 trajectories; white asterisks indicate the point of entry into the equatorial region; light blue boxes indicate the boundary of the equatorial region (6 um in width, see also Movie S7). Right panel: For quantitative analysis in (C) and (D), trajectories are aligned with respect to their equatorial entry point (grey asterisk), and flipped vertically and/or horizontally so that all enter from the left and turn upwards. Scale bars = 2 μm.
(C) Superposition of many CYK-1 trajectories entering the equatorial region (6 μm in width) in different time windows, measured relative to anaphase onset. Individual trajectory segments are color-coded based on the time after entry into the equatorial region (see legend at right).
(D) Distributions of CYK-1 movement orientations at different times after entry into the equatorial region, measured within different time windows during cytokinesis (indicated above each plot). Individual distributions are color-coded as in (C).
(E) Average orientation bias of CYK-1 movement at different times after entry into the equatorial region during the 60–90 second time window, corresponding to late Phase II.
To quantify the strength of this effect at the equator, we analyzed the behavior of 202 CYK-1::GFP particles from 13 embryos that began outside, and moved into, the equatorial region (Figure 5B, Movie S7). We aligned all 202 trajectories with respect to their point of entry into the equatorial region and reflected trajectories about the AP and/or equatorial axis to place them all into the same quadrant (Figure 5B). We grouped whole trajectories based on time after anaphase onset (0–30sec, 30–60sec, 60–90sec), and then analyzed changes in individual trajectory orientations based on time after entry into the equatorial region (Figure 5C–D). We observed a shift in trajectory orientations within all three windows of time (Figure 5D). However, the most dramatic shift occurred just before the onset of rapid furrow ingression (60–90 sec), when equatorial filaments are highly aligned (Figure 5D). In this window, the mean orientation bias of filament growth increased from a value of ~ 0 at the time of entry into the equatorial region to ~ 6 five seconds later (Figure 5E). We conclude that aligned equatorial filaments provide a strong local directional cue to orient the elongation of newly assembling filaments. Hereafter we refer to this biased elongation as filament-guided filament assembly (FGFA).
Filament-guided filament assembly (FGFA) increases the “effective lifetime” of filament orientation, and can explain the rapid emergence of filament alignment, given measured rates of axial compression and F-actin disassembly.
To further characterize how FGFA shapes the emergence of filament alignment, we modified our original model to incorporate a simple representation of this orientation cue. We assumed that a fraction λ of growing filaments elongate in the direction of existing filaments (i.e. with an orientation chosen at random from the distribution of existing filament orientations), while the remainder (1-λ) elongate with random orientations (Figure 6A). With these assumptions, and scaling filament density so that the total filament density approaches a value of 1 (see STAR methods), we obtain a modified version of equation (2):
| (3) |
Figure 6. Filament-guided filament growth (FGFA) increases the effective lifetime of filament orientation, and is sufficiently strong to explain the rapid emergence of filament alignment, given measured compression and disassembly rates.

(A) A simple model for filament-guided filament assembly: a fraction (λ) of growing filaments use existing filaments as guides to orient their growth.
(B) The predicted distributions of filament orientations after 90 seconds, for different values of λ, given measured equatorial compression and F-actin disassembly rates (Figure 3E and F respectively).
(C) Predicted filament orientation bias for the distributions in (B). Dashed line indicates the value of λ required to produce the measured orientation bias in Figure 1E (λ = 0.9).
(D) A comparison of model predictions for three different scenarios. For all scenarios, we used the measured compression rates (Figure 3E). For “compression plus constant disassembly” (left), we assumed orientation independent assembly and used the measured disassembly rate constant (Figure 3F). For “compression plus biased disassembly” (middle), we assumed orientation independent assembly and orientation-dependent disassembly. We selected parameter values (kmin = 0.03, kmax = 0.15, K = 80, Figure S4A) for which the mean turnover and final filament orientation bias matched the measured values, and for which the predicted slopes of normalized F-actin density and orientation bias vs time during phase II best-matched the measured values (see Figure S4C, STAR methods for details). For “compression plus FGFA” (right), we used the measured disassembly rate constant and chose λ = 0.9 to match the final filament orientation bias measured in vivo. In each case, model predictions (blue curves) are compared to the measured values (grey curves).
(E) Values of orientation bias slope vs. actin density slope predicted for different values of λ in the filament-guided filament assembly model, given measured compression and disassembly rates. Orientation bias and actin density slopes were measured in the 60–90 sec and 40–90 sec simulated time windows, respectively, as shown in Figure S4C. Red circle indicates the value measured in vivo.
(F) Predicted distributions of filament growth orientation for different values of λ, given the distribution of filament orientations measured in late Phase II (Figure 1E). Dashed line indicates the value of λ (0.91) required to produce the measured orientation bias in Figure 4H.
(G) Schematic view of two possible mechanisms for filament-guided filament assembly (FGFA). Left panel: Formin is tethered to an existing filament during formin-mediated filament elongation. Right panel: newly assembled filaments are rapidly crosslinked to the existing filaments by crosslinkers.
Comparing Equations (2) and (3), we see that the effect of filament-guided filament assembly is to scale the time for relaxation of filament orientations by a factor 1 − λ, yielding an effective relaxation time .
We then returned to simulations to ask how high must λ be to achieve the measured equatorial filament orientation bias after 90 seconds, given measured rates of axial compression and F-actin disassembly. We found that simulations reproduced the measured asymmetry for λ = 0.9 (Figure 6B–C). Moreover, compared to simulations based on equatorial compression with constant disassembly, or axial compression with orientation-dependent disassembly (using best-fit parameters), simulations that combined FGFA (for λ = 0.9) with measured rates of axial compression and filament disassembly correctly captured the time-dependent changes in filament density and orientation bias observed in vivo, with a fast initial rise in density to a stable plateau, and an accelerating rise in orientation bias (Figure 6D). The initially sigmoidal rise in density observed in experiments (but not in simulations) likely reflects sigmoidal kinetics of equatorial RhoA activation, which we did not include in our model assumptions. In essence, FGFA allows separate control over the lifetimes of individual filaments, which determine the fast approach to a stable plateau in filament density, and the effective lifetime of filament orientation, which controls the later increase in filament orientation bias driven by compressive flow (Figure 6E).
To estimate the value of λ in vivo, we used simulations to ask how large would λ have to be, given the measured equatorial filament orientation bias (Figure 1F), to produce the distribution of equatorial CYK-1 movement directions observed in vivo (Figure 4H). This analysis yielded an estimated minimum value for λ of 0.91 (Figure 6F), which is comparable to the value required in simulations (Figure 6C). We conclude that FGFA could be sufficient to explain the emergence of equatorial filament alignment despite the rapid turnover of individual filaments.
Discussion
A classical model for cytokinesis in animal cells proposes how compressive cortical flows, driven by equatorial activation and/or polar inhibition of cortical contractility, could concentrate and align actin filaments at the equator during contractile ring assembly (Reymann et al., 2016; Salbreux et al., 2009; Spira et al., 2017; White and Borisy, 1983). Here, we show that in C. elegans embryos, individual filaments are too short-lived for their reorientation by compressive flows to explain the emergence of filament alignment during ring assembly. Our direct observations of filament assembly in vivo reveal a mechanism by which the zygote encodes a long-term structural memory of filament alignment, in which existing filaments/bundles act as templates to orient new filament growth. Support for filament-guided filament assembly (FGFA) comes from three observations: Filament growth orientations correlate strongly and locally with existing filament orientations in both wild type and myosin-depleted embryos. Two-color imaging shows that newly assembling filaments have a strong tendency to elongate along paths defined by existing filaments, and to turn when they encounter existing filaments/bundles. Finally, filaments that grow into the equatorial region have a strong tendency to reorient growth along the equatorial axis, a tendency that increases with increasing alignment of equatorial filaments.
It is worth noting that earlier studies already implied a role for FGFA. Filaments are organized into small bundles in the cleavage furrows of many dividing cells (Ding et al., 2017; Laporte et al., 2012; Leite et al., 2020; Mabuchi et al., 1988). In vitro studies of cross-linked actin networks suggest that, unless individual filaments are short relative to the distance between crosslinks, bundles cannot form through rotation of existing filaments into local alignment with one another (Falzone et al., 2012; Maciver et al., 1991). Thus bundles of longer filaments must form through growth of new filaments along existing ones, which may itself be mediated by dynamic crosslinkers (see below).
What is the molecular basis for FGFA? One possible scenario is that one or more factors tether a growing filament’s barbed end to the side of an existing filament. In principle, this tethering could be mediated by the simultaneous association of CYK-1 dimers with a growing filament’s barbed-end and adjacent filaments (Figure 6G, left), as recently reported for another elongation factor Ena/VASP (Harker et al., 2019). However, Ena/VASP forms tetramers that can associate with multiple filaments while promoting processive filament elongation (Harker et al., 2019). In contrast, formin dimers use both FH2 domains to associate with the barbed-end of the elongating actin filament to maintain rapid processive elongation. Thus, additional modes of formin binding to F-actin would be required to tether a growing filament to an existing one.
A second, and perhaps more plausible scenario, is that one or more crosslinking proteins act to “zipper” growing filaments with existing filaments (Figure 6G, right), allowing the former to inherit the orientation of the latter. Three possible candidates are the crosslinkers ATN-1 (alpha-actinin), PLST-1/Plastin (Fimbrin) (Ding et al., 2017) and ANI-1/Anillin (Descovich et al., 2018; Maddox et al., 2005, 2007). A null mutation in atn-1 fails to produce defects in cortical contractility or cytokinesis (Ding et al., 2017). Both PLST-1 and ANI-1 accumulate in the contractile ring during cytokinesis (Ding et al., 2017; Maddox et al., 2007), and can bundle F-actin in vitro (Ding et al., 2017; Tian et al., 2015). plst-1 null mutant zygotes display variably penetrant cytokinesis defects, ranging from delayed constriction to a complete failure of cytokinesis (Ding et al., 2017), while strong depletion of ANI-1 abolishes asymmetric furrow ingression (Maddox et al., 2007). In both cases, these defects are associated with reduced and/or delayed alignment of filaments within the contractile ring (Ding et al., 2017; Reymann et al., 2016). However, in both cases, reduced alignment could also be caused by reduced recruitment of equatorial myosin II and/or reduced cortical connectivity (Ding et al., 2017; Reymann et al., 2016; Tse et al., 2011), leading to reduced cortical flows, rather than being caused by changes in the orientation of filament growth. Thus, further experiments are required to test specific roles for these proteins in FGFA.
Regardless of molecular details, FGFA provides a powerful mechanism for growing filaments to inherit a memory of previous filaments’ orientations. The strength of this effect will depend on the frequency with which growing filaments encounter existing filaments/bundles and the probability per encounter that a filament reorients its growth. This strength can be characterized by the average fraction of time λ that new filaments grow with orientations given by existing filaments. Our simple theoretical analysis shows that FGFA increases the effective local lifetime of filament orientation by a factor 1/(1- λ) over the lifetime of individual filaments. Thus in principle, by increasing the efficiency of FGFA (i.e. by driving λ-> 1), it is possible to create an arbitrarily long-lived memory of local filament alignment. Our stochastic simulations predict that λ must be greater than 0.9 to explain the degree of filament alignment observed during contractile ring assembly. A conservative estimate, based on comparing the orientations of equatorial filaments with the orientations of equatorial filament growth (Figure 6F), suggests that λ ≥ 0.9. Thus, subject to limitations imposed by our measurements and model assumptions (see below), structural memory of filament alignment conferred by FGFA appears to make a dominant contribution to building filament alignment during contractile ring assembly.
That said, additional forms of structural memory may also contribute to contractile ring assembly. For example, myosin minifilaments turn over more slowly than single actin filaments (Carvalho et al., 2009) and may also be aligned by flow (Singh et al., 2019). ANI-1/Anillin may locally crosslink and/or stabilize F-actin and myosin II to promote their asymmetric accumulation within the contractile ring and asymmetric furrow ingression (Maddox et al., 2007; Tian et al., 2015). Local curvature induced by ring constriction may also feedback to enhance local filament alignment (Dorn et al., 2016). In principle, any of these mechanisms could synergize with FGFA to enhance filament alignment during cytokinesis.
Why might cells rely on FGFA to build a structural memory of filament alignment, rather than increasing the lifetimes of single filaments? Rapid filament turnover may be important for local network homeostasis – i.e. to maintain uniform filament density and prevent local tearing and/or clumping of contractile ring components (Chew et al., 2017). At the same time, filament turnover provides an effective way to dissipate local resistance to the rapid remodeling of actin networks that underlies flow and filament realignment (McFadden et al., 2017). Indeed, in a network of cross-linked filaments undergoing axial compression, filaments cannot realign without some degree of local filament buckling or inter-filament sliding (Bidone et al., 2017; Murrell et al., 2015). Thus, FGFA provides a way to maintain a selective memory of network deformation, while maintaining filament homeostasis and allowing rapid dissipation of local resistance to network deformation.
Although we have focused here on the initial phase of contractile ring assembly, FGFA will also contribute to maintaining filament alignment during rapid ring constriction and furrow ingression. During later cytokinesis, the equatorial cortex compresses both axially and circumferentially as it enters the furrow (Khaliullin et al., 2018). Rapid ~isotropic compression may help to concentrate myosin II to maintain a constant rate of ring constriction through cytokinesis (Carvalho et al., 2009; Khaliullin et al., 2018), but it will no longer contribute to building filament alignment. Therefore, mechanisms that maintain local filament alignment are likely to be even more important during later stages of furrow ingression. Importantly, since the strength of FGFA will increase with filament density and degree of alignment, it will be strongest during later stages of ring assembly and during ring constriction.
Compressive flows underlie the formation of transient dynamically aligned filament arrays in many other functional contexts, including cell motility, immune cell synapse formation, wound healing and tissue morphogenesis (Burnette et al., 2011; Hotulainen and Lappalainen, 2006; Mandato and Bement, 2001; Murugesan et al., 2016; Sehring et al., 2014). In all of these contexts, biology must solve a similar problem – how to build and maintain filament alignment in the face of continuous turnover of individual filaments. Even more stable structures such as stress fibers or junctional actin belts undergo steady filament turnover and cells must therefore implement strategies to ensure that newly added filaments are correctly aligned. It will be interesting to see to what extent filament-guided filament assembly provides a common solution to this widespread challenge.
Limitations of the Study
The conclusion that FGFA is sufficiently strong by itself to explain the emergence of filament alignment relies on computational estimates of: (a) the value of λ that is required to produce the observed orientation bias of equatorial filaments, given measured rates of compressive flow and average filament lifetime and (b) the value of λ that is required to explain the orientation bias of filament growth, given the orientation bias of existing filaments. Although we are confident in our measurements of flow rates, average filament lifetimes, and the distribution of growth orientations, our measurements of equatorial filament orientations using local intensity gradients may underestimate the orientation bias in regions of high filament density. In addition, the equatorial orientation bias is likely higher in uncompressed embryos. This could have lead us to overestimate (somewhat) the strength of FGFA relative to that required to explain equatorial filament alignment. As already discussed above, many additional mechanisms may contribute to building and reinforcing equatorial filament alignment, including feedback coupling to membrane curvature, dynamic crosslinking, or selective stabilization of co-aligned filaments, and these will be interesting to consider in future work.
STAR methods
Resources Availability:
Lead Contact:
Further information and requests for resources and reagents should be directed to and will be fulfilled by the Lead Contact, Edwin Munro (emunro@uchicago.edu).
Materials availability:
This study did not generate new unique reagents.
Data and code availability:
The raw datasets supporting the conclusions of the current study are available from the Lead Contact upon reasonable request. The code is available online at DOI:10.17632/nngxmhc4z5.1
Experimental model and subject details:
We cultured C. elegans strains as described (Brenner, 1974) on 60 mm petri plates containing E coli bacteria (OP50) raised on normal growth medium (NGM). All strains were cultured at room temperature (20–22 °C) unless otherwise specified. See Method Details for a list of mutations and transgenes used in this study. Unless otherwise specified, strains were provided by the Caenorhabditis Genetics Center, which is funded by the National Center for Research Resources.
Method details:
RNA interference.
We performed RNAi using the feeding method (Timmons et al., 2001). Briefly, we obtained bacteria targeting arx-2 and nmy-2 from the Kamath RNAi library (Kamath et al., 2003). We grew bacteria to log phase in LB with 50µg/ml ampicillin, seeded ~300µl of culture onto NGM plates supplemented with 50µg/ml ampicillin and 1mM IPTG, incubated plates at room temperature for two days, and then stored them at 4°C for up to one week before use. We transferred L4 larvae to feeding plates and then cultured them at the following temperatures and for the following durations before imaging: 24–30 hours at 20 °C for nmy-2(RNAi) for strong NMY-2 depletion (Figure 4H&S2), 12–16 hours at 20 °C for nmy-2(RNAi) for mild NMY-2 depletion (Figure 4D&5A), 16–24 hours at 24 °C for arx-2(RNAi) (Figure 3I&S3B). For experiments involving nmy-2 (RNAi), we verified strong loss of function by complete failure of first cleavage, and mild loss of function by lack of cortical rotation. For experiments involving arx-2(RNAi), we verified strong loss of function by extreme anterior displacement of the pseudocleavage furrow (Shivas and Skop, 2012).
Live imaging.
For two-color imaging of F-actin (GFP::UTR) and myosin (NMY-2::mKate2) or CYK-1 (CYK-1::GFP and F-actin (Lifeact::mCherry), we used a Nikon Ti-E inverted microscope equipped with solid state 50mW 481 and 561 Sapphire lasers (Coherent), a TIRF illuminator, and a Ti-ND6-PFS Perfect Focus unit. A laser merge module (Spectral Applied Research; LMM5) equipped with an acousto-optical tunable filter (AOTF) allowed rapid (1–2 msec) switching between excitation wavelengths. We collected near TIRF images using a CFI Apo 1.45 NA oil immersion TIRF objective, with 1.5X magnification, onto an Andor iXon3 897 EMCCD camera, yielding a pixel size of ~107nm. Image acquisition was controlled by Metamorph software.
For single molecule/single particle tracking analysis of actin::GFP or CYK-1::GFP, we used an Olympus IX50 inverted microscope equipped with an Olympus OMAC two-color TIRF illumination system, a CRISP autofocus module (Applied Scientific Instrumentation), and a 1.45 NA oil immersion TIRF objective. Laser illumination at 488 nm from a 50-mW solid-state Sapphire laser (Coherent) was delivered by fiber optics to the TIRF illuminator. Images were magnified by 1.6x and collected on an Andor iXon3 897 EMCCD camera, yielding a pixel size of 100 nm. Image acquisition was controlled by Andor IQ software.
For all experiments, we set the laser illumination angle to a standard value that was chosen empirically to approximately maximize signal-to-noise ratio while maintaining approximately even illumination across the field of view. Further details of the imaging conditions used for specific quantitative analyses are provided below.
Quantification and statistical analysis
Single-particle detection and tracking.
We performed single-particle detection and localization using a MATLAB implementation (http://people.umass.edu/kilfoil/downloads.html) of the Crocker and Grier method (Crocker and Grier, 1996; Pelletier et al., 2009). Briefly, in each image, the method uses a band pass filter to highlight roughly circular regions below a characteristic size (the feature size), in which the pixel intensity exceeds the background. The regions in which the maximum intensity exceeds a user-defined threshold are identified, and their centroids are determined to sub-pixel resolution as the center of mass of pixel intensity within a pixelated circular mask centered on the original maximum. We used a feature size of 3 and chose thresholds subjectively to optimize detection for different types of particles (actin::GFP and CYK-1::GFP).
We performed particle-tracking analysis using freely available µTrack software (Jaqaman et al., 2008, https://github.com/DanuserLab/u-track). µTrack first links particles frame to frame and then links these short segments into longer sequences. Both linking steps use statistical models for particle motion to compute costs for different possible linkage assignments (particle appearance, disappearance, displacement, fusion, and fission) and then identify the assignments that globally minimize these costs. For all analyses reported here, we used a motion model provided with µTrack that represents a mixture of Brownian and directed motion. We allowed the possibility of “gaps” in trajectories due to transient failure to detect particles in individual frames. For each embryo, we overlaid the raw movie with tracked particles to verify tracking accuracy, and we chose parameters for particle detection and tracking (thresholds and length of gaps) that minimize tracking errors. We previously verified the accuracy of these methods for measuring actin filament turnover (Robin et al., 2014). For our analyses of CYK-1 or actin particle movements, all of our experiments were performed at particle densities for which the major tracking errors are failures to link together real particle trajectories, and these errors will have negligible effects on measurements of particle speed and direction.
Measuring filament density and orientation.
For analysis of filament density and orientation (Figure 1), we imaged embryos expressing UTR::GFP and NMY-2::mKate2, using stream acquisition mode with 30% laser power, and 100 msec exposure times, for both GFP and RFP channels. At each time point, and for each channel, we collected a stack of 3 focal planes, in 0.1 um increments, starting from the cortical surface and going inward. Then we used an average intensity projection to obtain a mean intensity for each pixel.
To monitor changes in the densities of equatorial F-actin and myosin II, we measured the total intensity of UTR::GFP and NMY-2::mKate2 signals over time within a region of interest (ROI) 5 pixels wide and 122 pixels high, centered on the equator. To normalize these data for individual embryos, we determined the minimum and maximum intensities, Imin and Imax, within the observation time window (pre-anaphase to the onset of rapid furrow ingression). Then we computed . We aligned normalized data across multiple embryos with respect to the timepoint at which the normalized myosin density exceeded 30% of its maximum value to produce the mean intensity curves displayed in Figure 1B. Finally, exploiting the previous observation that equatorial myosin II begins to accumulate within ~10 sec after anaphase onset, we estimated anaphase onset to be the time point at which the mean myosin intensity begins to increase (Werner et al., 2007).
For all subsequent measurements of filament growth orientations and disassembly rates, we defined two regions of interest: an equatorial ROI and a polar ROI. We defined the equatorial ROI to be a rectangle 6 μm in width, centered on the AP position where the furrow initiates, whose height spans the region of the embryo surface that intersects the imaging plane. We defined the polar ROI to be the largest rectangle that lies anterior to the equatorial ROI and spans the region of the embryo surface that intersects the imaging plane.
To estimate the distribution of filament orientations within equatorial and polar ROIs, we used the Sobel operator to identify local gradients of fluorescence intensity, which are sharp in directions orthogonal to individual filaments/bundles. We convolved raw images with the Sobel operator defined by 3x3 kernels to compute the x and y components Gx and Gy of the local fluorescence intensity gradient (Figure S1A). For each pixel, is the gradient’s direction, and its magnitude. Therefore, we took the positive angle orthogonal to , to be a local estimate of filament orientation, with magnitude G. To estimate the distribution of filament orientations within a given ROI, we assigned each pixel within that ROI to the appropriate orientation bin (0 <= θ <= 90°), weighted by the G, to emphasize the sharp local gradients associated with individual filaments/bundles.
Measuring filament orientation bias.
To estimate a single scalar filament orientation bias from distributions of filament orientations, we measured the density of filament orientations between 80° – 90° (ρ80−90) and 0° – 10° (ρ0−10). Then we defined the orientation bias to be the ratio of ρ80−90 :: ρ0−10.
Measuring filament disassembly rate and axial compression rates.
To image single molecules of actin::GFP for measurements of cortical flow, we collected data in stream acquisition mode using 30% laser power for both wild type embryos and arx-2(RNAi) embryos. For measurements of axial compression rates, we collected data using 450 msec exposure times. For measurements of filament disassembly rates, we collected data using 100 msec exposure times. We performed particle detection and tracking as described above, and then performed all subsequent analyses using custom scripts written in Matlab and R (available upon request).
To measure axial compression rate, in Matlab we selected the subset of trajectories with lifetimes greater than 5 frames to exclude false positives. We confirmed the reliability of tracking by overlaying the resulting trajectories onto the original image data. We applied a linear transformation to map positional coordinates onto X and Y axes such that the X axis is aligned with the embryo’s AP axis. Finally, we broke each trajectory into 5-frame segments. For each segment, we computed the axial displacement over 5 frames (2.25 seconds), and then exported these data into R.
In R we binned the 5-frame axial displacements with respect to time (bin size = 6, corresponding to time intervals of 13.5 seconds), and then we performed local polynomial regression using the Loess function in R (https://www.rdocumentation.org/packages/stats/versions/3.6.2/topics/loess), setting the spatial grid size (span) = 0.5 – 2 µm, the polynomial degree = 2, and using the least-squares fitting algorithm to estimate the mean axial velocity as a function of axial position. The quality and shapes of the fitted curves varied little for spans between 0.5 and 2 µm (Figure S3B), and therefore we used a span = 1 µm for all results reported here. We then calculated the local finite difference in mean axial speed to approximate the local axial compression (strain) rate for each axial position.
To measure rate constants for cortical filament disassembly, we first selected all trajectories beginning within a proscribed region (equatorial or polar) and window of time (30 seconds before the onset of phase III: rapid ring constriction). We then aligned the beginnings of all single molecule trajectories to construct a standard decay curve plotting the fraction of trajectories with lengths greater than L vs. L. These decay curves were well-fit by single exponentials, yielding an effective rate constant for single molecule decay kdecay, which is the sum of rate constants for F-actin disassembly (kdiss) and single molecule photobleaching (kpb).
To correct for the effects of photobleaching, we measured decay curves for many individual embryos, holding laser power (30%) and exposure time (100 msec) constant, and varied the duty ratio of laser exposure (fraction of time the laser is on) by varying the time interval between exposures. Then we fit the resulting data to kdecay = kdiss + dr ∗ kpb to estimate kdiss and kpb.
Measuring actin filament assembly using CYK-1::GFP.
To monitor formin-dependent filament assembly during cytokinesis, we imaged embryos expressing GFP-tagged CYK-1 (CYK-1::GFP) from the endogenous locus (Padmanabhan et al., 2017) or as an integrated transgene (Mi-Mi et al., 2012). For both strains, and for both wild type and nmy-2(RNAi) embryos, we collected data in streaming acquisition mode using 100% laser power and 61 msec exposure times. In raw movies, the majority of CYK-1::GFP signal appeared as diffraction-limited particles, and we could detect two general classes of particles- stationary and moving. To distinguish these classes, we first computed a moving minimum intensity projection of the raw data, with a 13-frame window, to highlight the stationary CYK-1::GFP particles. We performed particle detection and tracking on these data as described above. We then subtracted this moving minimum intensity projection from the original image data to construct a sequence of images in which the moving particles could be more readily detected and tracked (Movie S3).
We performed particle detection and tracking on these processed data, as described above (see Movie S4, all tracked). We then performed several additional filtering steps to select for trajectories representing fast directional movement characteristic of formin-mediated filament elongation. First, we manually selected a subset of longer trajectories, which corresponded by eye to rapidly moving CYK-1 particles. For this subset, we divided each trajectory into smaller fragments (10 frames = 0.6 seconds per fragment), and then we computed a distribution of average mean speeds to serve as a reference for selecting shorter trajectories.
Next, we considered the subset of all trajectories with lengths greater than or equal to 10 frames (see Movie S4, Length >= 10). We decomposed each of these selected trajectories into shorter 10-frame segments. Then we used a method previously developed by Jaqaman and colleagues to select for directional movement (Jaqaman et al., 2008). We assigned an asymmetry parameter (S) to each trajectory based on the eigenvalues λ1 and λ2 of its variance-covariance matrix.
Jaqaman et al. defined the threshold for significant asymmetry to be the 90th percentile of a distribution of S-values computed for a population of trajectories of length n frames representing simulated Brownian motion. This threshold approaches a plateau value S ~1.5 for trajectories longer than 10 frames (Jaqaman et al., 2008). Therefore, we selected the subset of 10-frame trajectory segments with asymmetry parameter S greater than 1.5 for analysis of directional motion (see Movie S4, length >= 10, directional). Finally, we selected the subset of these segments with an average mean speed within the range of the means measured for the subset of manually chosen long trajectories (see Movie S4, length >= 10, directional, 0.7 < mean speed < 2.4). We plotted the selected trajectory segments over the original data to confirm accuracy of particle tracking and trajectory segment selection. Finally, we estimated the movement direction for each selected trajectory segment from the positional difference between the first and last frames of that segment.
Estimating the fraction of CYK-1 particles that are stationary.
To estimate the fraction of CYK-1 particles that are stationary, we compared the set of stationary trajectories obtained from a moving minimum intensity projection of the raw data, and the full set of non-stationary trajectories obtained after subtracting the moving minimum intensity projection from the raw data. For both sets, we discarded all trajectories with lifetimes shorter than 5 frames (around 0.3 second) to minimize the contributions of detection and tracking errors. Then we counted the numbers of stationary and non-stationary particles in each frame, and computed the fraction of stationary CYK-1 particles to be:
Evaluating the contribution of stationary CYK-1:GFP to cortical filament growth.
If stationary CYK-1 dimers are rapidly elongating cortical actin filaments, then a subset of cortical actin::GFP particles should undergo rapid directional movements. To test this, we imaged single actin::GFP molecules under the conditions used for CYK-1::GFP (streaming acquisition mode with 100% laser power and 61 msec exposure). Without any further processing, we performed particle detection and tracking on these data, and then applied the same filters for fast directional motion used for CYK-1::GFP particles. For the 9/1743 actin trajectory segments that passed these filters, we confirmed by mapping these trajectory segments onto the original image sequence that the apparent rapid directional movement results from tracking errors that produced single large jumps in position with instantaneous speeds greater than 3 times the mean filament elongation rate measured from CYK-1::GFP (Figure S5D). We therefore considered these trajectory segments to be false positives and excluded them from further analysis.
Visualizing CYK-1 movements along actin filament bundles.
To visualize movements of CYK-1 particles along individual filament bindles, we imaged embryos expressing transgenic CYK-1::GFP and Lifeact::mCherry, mildly depleted of myosin II to abolish rapid equatorial cortical rotation during cytokinesis. We used alternating 50 msec exposures for each channel. To enhance visualization of actin filaments, we applied a moving average of 5 frames to the Lifeact::mCherry data. To enhance visualization of moving CYK-1 particles, we first applied a gaussian blur of 1.3 to the CYK-1::GFP data, then a bandpass filter to suppress pixel noise and spatial variations at wavelengths greater than the characteristic particle size. Then we subtracted a moving minimum average of 3 frames to suppress signals associated with stationary CYK-1 particles and bleed through from Lifeact::mCherry signal. Finally, we applied a gamma filter of 1.5 to highlight the bright CYK-1::GFP particles.
Analyzing reorientation of CYK-1 trajectories within the equatorial region.
To capture CYK-1 trajectories moving into the equatorial region, we imaged embryos expressing transgenic CYK-1::GFP (Mi-Mi et al., 2012), which is expressed at lower levels than the endogenous protein. We manually selected 202 CYK-1::GFP particles from 13 embryos that crossed a boundary into the equatorial region, and manually tracked each particle. We aligned all trajectories with respect to their point of entry into the equatorial region and by reflecting trajectories about the AP and/or equatorial axis to place them all into the same quadrant. To calculate the distribution of the movement orientations for these trajectories, we divided each trajectory into 5 frame segments, and for each segment, we estimated the movement orientation from the positional difference between the first and last frames.
Modeling Procedures.
We constructed a simple model that predicts how the distribution of filament orientations at the equatorial cortex evolves through a combination of local assembly, reorientation by contractile flow, and disassembly. We consider a patch of equatorial cortex, with width W and fixed height H, which contracts at a constant (negative) strain rate ξ. We denote the density of filaments with orientation θ by ρ(θ, t). We assume that filaments assemble at a rate kass(θ) and disassemble at a rate kdiss(θ). We assume further that the cortical filament network undergoes a locally affine deformation, such that filaments within this network rotate at a rate . Finally, we impose a moving boundary condition - the left and right boundaries move as the patch deforms to satisfy , such that there is no flux of filaments across the left or right boundaries. Therefore, the number of filaments in the domain changes only through assembly and disassembly, while the density change is governed by the net imbalance of local assembly and disassembly plus the tendency for local contraction to concentrate filaments. Given these assumptions, we write an equation that describes how the distribution of filament orientations within the patch evolves over time:
| (1) |
To derive an expression for , we focus attention on a single filament within the network, with orientation θ, and with axial and circumferential length components Lx and Ly respectively. Affine deformation of the network changes Lx, but leaves Ly unchanged. Orientation θ is related to the axial and circumferential lengths Lx and Ly by
Taking a time derivative, applying the chain rule, and using we obtain:
| (2) |
Orientation-independent filament assembly and disassembly
We initially consider the simplest scenario, in which kass and kdiss are independent of filament orientation. Thus:
| (3) |
Where the factor has been chosen so that the total filament assembly rate is kass.
Scaling ρ in Equation (3) by yields:
| (4) |
From this it can be seen that the time evolution of the distribution of filament orientations depends only on the value of kdiss and ξ. The second term in Equation (4) represents the buildup of alignment due to flow, while the first term represents the relaxation of the filament orientations towards an isotropic distribution with relaxation time .
Orientation-dependent filament assembly and disassembly
To study how filament guided filament assembly affects the evolution of filament orientation under compressive flow, we considered a scenario in which a fraction of filaments (λ) elongate using an existing filament as a guide, while the rest (1-λ) assemble with random orientation.
Accordingly, we rewrite Equation (3) as follows:
| (5) |
Where is the rate of randomly oriented assembly and is the rate of filament-guided filament assembly. Note that we scale these rates by and so that the total rates of randomly oriented and filament-guided assembly are (1 − λ)kass and λ ∙ kass respectively. The dynamics of ρtotal(t) are given by:
| (6) |
As above, we scale ρ by to obtain:
| (7a) |
and
| (7b) |
Equation (7b) implies that ρtotal→ 1, for times , thus at long times, Equation (7a) can be approximated by:
| (8) |
Comparing Equations (4) and (8), we see that the effect of filament guided filament assembly is to scale the time for relaxation of filament orientations by a factor 1 − λ, yielding an effective relaxation time
| (9) |
In particular, when all filament assembly is guided by existing filaments (λ = 1), τeff → ∞, and the time to build filament alignment is set only by the contraction rate.
Statistical analysis
All quantitative analyses are provided above. All summary statistics, including means, standard errors and sample sizes, are described in the figure legends.
Supplementary Material
Near-TIRF movie of a one-cell C. elegans embryo during cytokinesis expressing UTR::GFP to label F-actin, and endogenously tagged NMY-2::mKate2. Top panel: UTR::GFP; Middle panel: NMY-2 :mKate2; Bottom panel: merged UTR::GFP (green) and NMY-2::mKate2 (red). Scale bar = 5 μm. Time compression is 30:1.
Near-TIRF movie of a one-cell C. elegans embryo during cytokinesis expressing actin::GFP at single molecule levels. Top panel: raw movie. Bottom panel: the raw movie overlaid with all single molecule trajectories (labeled in red circles) of length >= 2 frames. Scale bar = 5 μm. Time compression is 18:1.
Near-TIRF movie of a one-cell C. elegans embryo near anaphase onset expressing endogenously-tagged CYK-1::GFP. Top panel: raw movie. Middle panel: 13-frame moving minimum intensity projection highlighting the stationary fraction of CYK-1 particles. Bottom panel: Difference between raw and minimum intensity projection highlighting the mobile fraction of CYK-1 particles (see Experimental Procedures for details). Scale bar = 5 μm. Time compression is 5:1.
Near-TIRF movie of a one-cell C. elegans embryo near anaphase onset expressing endogenously-tagged CYK-1::GFP, with subsets of tracked particles overlaid as red circles (see Experimental Procedures for details). Top panel: all tracked particles with duration >= 2 frames. Second panel: Subset of tracked particles with duration >= 10 frames. Third panel: Subset of tracked particles with duration >= 10 frames, and directional movement. Bottom panel: Subset of tracked particles with duration >= 10 frames, directional movement, and 0.7 <= mean speed <= 2.4 μm/sec. Scale bar = 5 μm. Time compression is 5:1.
Zoomed view of the anterior cortex of a one-cell C. elegans embryo near anaphase onset expressing endogenously-tagged CYK-1::GFP (red) and lifeAct::mCherry (green). The embryo was partially depleted of myosin II to suppress cortical rotation (see STAR methods for details). Scale bar = 2 μm. Time compression is 9:1.
Zoomed view of the cortex of a one-cell C. elegans embryo near anaphase onset expressing endogenously-tagged CYK-1::GFP (magenta) and lifeAct::mCherry (cyan). The embryo was partially depleted of myosin II to suppress cortical rotation (see STAR methods for details). Top, middle and bottom panels highlight three different examples of a fast-moving CYK-1::GFP particle, marking a growing filament, which turns as it encounters an existing filament or bundle. Left and right panels show images processed to enhance the F-actin and CYK-1 signals (see STAR methods for details). Yellow circle in right panels indicates the CYK-1 particle of interest. Scale bar = 2 µm. Time compression is 9:1.
Near-TIRF movie of examples of CYK-1 particles traveling into the equatorial region. The white lines mark equatorial region, and the red circles highlight the CYK-1 particle of interest. Scale bar = 3 µm. Time compression is 5:1.
KEY RESOURCES TABLE
| REAGENT or RESOURCE | SOURCE | IDENTIFIER |
|---|---|---|
| Bacterial and virus strains | ||
| Bacterial RNAi feeding strain targeting nmy-2 | Kamath feeding library (Kamath et al., 2003) | nmy-2(RNAi) |
| Bacterial RNAi feeding strain targeting arx-2 | Kamath feeding library (Kamath et al., 2003) | arx-2(RNAi) |
| Deposited Data | ||
| Original code used in this study | This study | DOI:10.17632/nngxmhc4z5.1 |
| Experimental models: Organisms/strains | ||
| Transgenic C. elegans strain expressing GFP::ACT-5 Genotype: pJH7.03 [unc-119; pie-1:GFP:act-5∷pie-1 3′ UTR] |
Seydoux lab Johns Hopkins School of Medicine (Robin et al., 2014) |
JH1541 |
|
C. elegans strain with endogenously tagged NMY-2::mKate2 Genotype: cp52[NMY-2::mkate2 + LoxP unc-119(+) LoxP] I; unc-119(ed3) III; |
Goldstein Lab University of North Carolina, Chapel Hill (Dickenson et al 2017) |
LP256 |
| Transgenic C. elegans strain expressing GFP fused to the actin binding domain from Utrophin. Genotype: mgSi3[cb-unc-119(+) GFP::UtrophinABD]II |
Glotzer Lab University of Chicago (Tse et al 2012) |
MG589 |
|
C. elegans strain with endogenously tagged NMY-2::mKate2 and transgenically expressed GFP::UtrophinABD. Genotype: cp52[NMY-2::mkate2 + LoxP unc-119(+) LoxP] I; unc-119(ed3) III; mgSi3[cb-unc-119(+) GFP::UtrophinABD]II |
Made by crossing LP256 and MG589 | EM319 |
|
C. elegans strain with endogenously tagged CYK-1::GFP. Genotype: knu83 [cyk-1::GFP unc-119(+)] III; |
Zaidel-Bar lab Tel Aviv University, (Padmanabhan et al., 2017) |
COP937 |
|
C. elegans strain with endogenously tagged CYK-1::GFP and transgenically expressed LifeAct::mCherry. Genotype: zbIs2[pie-1::Life::mCherry unc-119(+)];knu83 [cyk-1::GFP unc-119(+)] III; |
Zaidel-Bar lab Tel Aviv University (Padmanabhan et al., 2017) |
RZB249 |
| Transgenic C. elegans strain expressing CYK-1::GFP. Genotype: upsIs3[unc-119(+) cyk-1::GFP]; unc-119(ed4) III; |
Pruyne lab SUNY Upstate Medical University, (Mi-Mi et al 2012) |
DWP13 |
| Software and algorithms | ||
| Fiji | (Schindelin et al., 2009) | https://fiji.sc/ |
| Directionality plugin | Fiji plugin | https://imagej.net/Directionality |
| MatLab | The MathWorks, Inc. | https://www.mathworks.com |
| Kilfoil particle tracking | MatLab implementation (Gao and Kilfoil, 2009) |
http://people.umass.edu/kilfoil/downloads.html |
| µTrack | MatLab implementation (Jaqaman et al., 2008) |
https://github.com/DanuserLab/u-track |
| R 4.0.0 | The R Foundation | https://www.r-project.org |
Highlights.
Actin filament lifetimes are very short (< 10 sec) during cytokinesis in C. elegans.
Formin-assembled filaments use exiting filaments to orient their growth.
Filament guided filament assembly encodes structural memory of filament orientation
Structural memory allows compressive flows to build highly aligned filament arrays
Acknowledgements
We thank David Pruyne, Ronen Zaidel Bar, Christian Pohl and Geraldine Seydoux for worm strains, Amy Maddox, David Kovar, Michael Glotzer and Sally Horne-Badovinac and members of the Munro Lab for discussions. We thank Will McFadden for help in formulating the model equations. This work was supported by NIGMS grant GM09844.
Footnotes
Publisher's Disclaimer: This is a PDF file of an unedited manuscript that has been accepted for publication. As a service to our customers we are providing this early version of the manuscript. The manuscript will undergo copyediting, typesetting, and review of the resulting proof before it is published in its final form. Please note that during the production process errors may be discovered which could affect the content, and all legal disclaimers that apply to the journal pertain.
Declaration of Interests
Edwin Munro is a member of the editorial advisory board for Developmental Cell.
References
- Agarwal P, and Zaidel-Bar R (2019). Principles of Actomyosin Regulation In Vivo. Trends Cell Biol 29, 150–163. [DOI] [PubMed] [Google Scholar]
- Bement WM, Benink HA, and Von Dassow G (2005). A microtubule-dependent zone of active RhoA during cleavage plane specification. J. Cell Biol 170, 91–101. [DOI] [PMC free article] [PubMed] [Google Scholar]
- Bidone TC, Tang H, and Vavylonis D (2014). Dynamic network morphology and tension buildup in a 3D model of cytokinetic ring assembly. Biophys. J 107, 2618–2628. [DOI] [PMC free article] [PubMed] [Google Scholar]
- Bidone TC, Jung W, Maruri D, Borau C, Kamm RD, and Kim T (2017). Morphological Transformation and Force Generation of Active Cytoskeletal Networks. PLoS Comput. Biol 13, 1–22. [DOI] [PMC free article] [PubMed] [Google Scholar]
- Brenner S (1974). The genetics of Caenorhabditis elegans. Genetics 77, 71–94. [DOI] [PMC free article] [PubMed] [Google Scholar]
- Burnette DT, Manley S, Sengupta P, Sougrat R, Davidson MW, Kachar B, and Lippincott-Schwartz J (2011). A role for actin arcs in the leading-edge advance of migrating cells. Nat. Cell Biol 13, 371–382. [DOI] [PMC free article] [PubMed] [Google Scholar]
- Carvalho A, Desai A, and Oegema K (2009). Structural Memory in the Contractile Ring Makes the Duration of Cytokinesis Independent of Cell Size. Cell 137, 926–937. [DOI] [PubMed] [Google Scholar]
- Castrillon DH, and Wasserman SA (1994). diaphanous is required for cytokinesis in Drosophila and shares domains of similarity with the products of the limb deformity gene. Development 120, 3367–3377. [DOI] [PubMed] [Google Scholar]
- Chan FY, Silva AM, Saramago J, Pereira-Sousa J, Brighton HE, Pereira M, Oegema K, Gassmann R, and Carvalho AX (2019). The ARP2/3 complex prevents excessive formin activity during cytokinesis. Mol. Biol. Cell 30, 96–107. [DOI] [PMC free article] [PubMed] [Google Scholar]
- Chen Q, and Pollard TD (2011). Actin filament severing by cofilin is more important for assembly than constriction of the cytokinetic contractile ring. J. Cell Biol 195, 485–498. [DOI] [PMC free article] [PubMed] [Google Scholar]
- Chen Q, Nag S, and Pollard TD (2012). Formins filter modified actin subunits during processive elongation. J. Struct. Biol 177, 32–39. [DOI] [PMC free article] [PubMed] [Google Scholar]
- Chew TG, Huang J, Palani S, Sommese R, Kamnev A, Hatano T, Gu Y, Oliferenko S, Sivaramakrishnan S, and Balasubramanian MK (2017). Actin turnover maintains actin filament homeostasis during cytokinetic ring contraction. J. Cell Biol 216, 2657–2667. [DOI] [PMC free article] [PubMed] [Google Scholar]
- Crocker JC, and Grier DG (1996). Methods of digital video microscopy for colloidal studies. J. Colloid Interface Sci 179, 298–310. [Google Scholar]
- Davies T, Jordan SN, Chand V, Sees JA, Laband K, Carvalho AX, Shirasu-Hiza M, Kovar DR, Dumont J, and Canman JC (2014). High-Resolution Temporal Analysis Reveals a Functional Timeline for the Molecular Regulation of Cytokinesis. Dev. Cell 30, 209–223. [DOI] [PMC free article] [PubMed] [Google Scholar]
- Descovich CP, Cortes DB, Ryan S, Nash J, Zhang L, Maddox PS, Nedelec F, and Maddoxa AS (2018). Cross-linkers both drive and brake cytoskeletal remodeling and furrowing in cytokinesis. Mol. Biol. Cell 29, 622–631. [DOI] [PMC free article] [PubMed] [Google Scholar]
- Dickinson DJ, Schwager F, Pintard L, Gotta M, and Goldstein B (2017). A Single-Cell Biochemistry Approach Reveals PAR Complex Dynamics during Cell Polarization. Dev. Cell 42, 416–434.e11. [DOI] [PMC free article] [PubMed] [Google Scholar]
- Ding WY, Ong HT, Hara Y, Wongsantichon J, Toyama Y, Robinson RC, Nédélec F, and Zaidel-Bar R (2017). Plastin increases cortical connectivity to facilitate robust polarization and timely cytokinesis. J. Cell Biol 216, 1371–1386. [DOI] [PMC free article] [PubMed] [Google Scholar]
- Dorn JF, Zhang L, Phi TT, Lacroix B, Maddox PS, Liu J, and Maddox AS (2016). A theoretical model of cytokinesis implicates feedback between membrane curvature and cytoskeletal organization in asymmetric cytokinetic furrowing. Mol. Biol. Cell 27, 1286–1299. [DOI] [PMC free article] [PubMed] [Google Scholar]
- Falzone TT, Lenz M, Kovar DR, and Gardel ML (2012). Assembly kinetics determine the architecture of α-actinin crosslinked F-actin networks. Nat. Commun 3. [DOI] [PMC free article] [PubMed] [Google Scholar]
- Fededa JP, and Gerlich DW (2012). Molecular control of animal cell cytokinesis. Nat. Cell Biol 14, 440–447. [DOI] [PubMed] [Google Scholar]
- Fishkind DJ, Silverman JD, and Wang YL (1996). Function of spindle microtubules in directing cortical movement and actin filament organization in dividing cultured cells. J. Cell Sci 109, 2041–2051. [DOI] [PubMed] [Google Scholar]
- Funk J, Merino F, Venkova L, Heydenreich L, Kierfeld J, Vargas P, Raunser S, Piel M, and Bieling P (2019). Profilin and formin constitute a pacemaker system for robust actin filament growth. Elife 8, 1–34. [DOI] [PMC free article] [PubMed] [Google Scholar]
- Gao Y, and Kilfoil M (2009). Accurate detection and complete tracking of large populations of features in three dimensions. Optics Express 17, 4685–4704. [DOI] [PubMed] [Google Scholar]
- Glotzer M (2017). Cytokinesis in metazoa and fungi. Cold Spring Harb. Perspect. Biol 9, 1–18. [DOI] [PMC free article] [PubMed] [Google Scholar]
- Gonzalez RC, Woods RE, and Eddins SL (2004). Digital Image Processing Using MatLab (Pearson Education)
- Green RA, Paluch E, and Oegema K (2012). Cytokinesis in Animal Cells. Annu. Rev. Cell Dev. Biol 28, 29–58. [DOI] [PubMed] [Google Scholar]
- Großhans J, Wenzl C, Herz HM, Bartoszewski S, Schnorrer F, Vogt N, Schwarz H, and Müller HA (2005). RhoGEF2 and the formin Dia control the formation of the furrow canal by directed actin assembly during Drosophila cellularisation. Development 132, 1009–1020. [DOI] [PubMed] [Google Scholar]
- Harker AJ, Katkar HH, Bidone TC, Aydin F, Voth GA, Applewhite DA, and Kovar DR (2019). Ena/VASP processive elongation is modulated by avidity on actin filaments bundled by the filopodia cross-linker fascin. Mol. Biol. Cell 30, 851–862. [DOI] [PMC free article] [PubMed] [Google Scholar]
- Henson JH, Ditzler CE, Germain A, Irwin PM, Vogt ET, Yang S, Wu X, and Shuster CB (2017). The ultrastructural organization of actin and myosin II filaments in the contractile ring: New support for an old model of cytokinesis. Mol. Biol. Cell 28, 613–623. [DOI] [PMC free article] [PubMed] [Google Scholar]
- Higashida C (2004). Actin Polymerization-Driven Molecular Movement of mDia1 in Living Cells. Science (80-. ) 303, 2007–2010. [DOI] [PubMed] [Google Scholar]
- Hotulainen P, and Lappalainen P (2006). Stress fibers are generated by two distinct actin assembly mechanisms in motile cells. J. Cell Biol 173, 383–394. [DOI] [PMC free article] [PubMed] [Google Scholar]
- Jaqaman K, Loerke D, Mettlen M, Kuwata H, Grinstein S, Schmid SL, and Danuser G (2008). Robust single-particle tracking in live-cell time-lapse sequences. Nat. Methods 5, 695–702. [DOI] [PMC free article] [PubMed] [Google Scholar]
- Kamath RS, Fraser AG, Dong Y, Poulin G, Durbin R, Gotta M, Kanapin A, Le Bot N, Moreno S, Sohrmann M, et al. (2003). Systematic functional analysis of the Caenorhabditis elegans genome using RNAi. Nature 421, 231–237. [DOI] [PubMed] [Google Scholar]
- Khaliullin RN, Green RA, Shi LZ, Gomez-Cavazos JS, Berns MW, Desai A, and Oegema K (2018). A positive-feedback-based mechanism for constriction rate acceleration during cytokinesis in Caenorhabditis elegans. Elife 7, 1–32. [DOI] [PMC free article] [PubMed] [Google Scholar]
- Laporte D, Ojkic N, Vavylonis D, and Wu JQ (2012). α-actinin and fimbrin cooperate with myosin II to organize actomyosin bundles during contractile-ring assembly. Mol. Biol. Cell 23, 3094–3110. [DOI] [PMC free article] [PubMed] [Google Scholar]
- Leite J, Chan FY, Osório DS, Saramago J, Sobral AF, Silva AM, Gassmann R, and Carvalho AX (2020). Equatorial Non-muscle Myosin II and Plastin Cooperate to Align and Compact F-actin Bundles in the Cytokinetic Ring. Front. Cell Dev. Biol 8, 1–16. [DOI] [PMC free article] [PubMed] [Google Scholar]
- Levayer R, and Lecuit T (2012). Biomechanical regulation of contractility: Spatial control and dynamics. Trends Cell Biol 22, 61–81. [DOI] [PubMed] [Google Scholar]
- Mabuchi I, Tsukita S, Tsukita S, and Sawai T (1988). Cleavage furrow isolated from newt eggs: Contraction, organization of the actin filaments, and protein components of the furrow. Proc. Natl. Acad. Sci. U. S. A 85, 5966–5970. [DOI] [PMC free article] [PubMed] [Google Scholar]
- Maciver SK, Wachsstock DH, Schwarz WH, and Pollard TD (1991). The actin filament severing protein actophorin promotes the formation of rigid bundles of actin filaments crosslinked with α-actinin. J. Cell Biol 115, 1621–1628. [DOI] [PMC free article] [PubMed] [Google Scholar]
- Maddox AS, Habermann B, Desai A, and Oegema K (2005). Distinct roles for two C. elegans anillins in the gonad and early embryo. Development 132, 2837–2848. [DOI] [PubMed] [Google Scholar]
- Maddox AS, Lewellyn L, Desai A, and Oegema K (2007). Anillin and the Septins Promote Asymmetric Ingression of the Cytokinetic Furrow. Dev. Cell 12, 827–835. [DOI] [PubMed] [Google Scholar]
- Mandato CA, and Bement WM (2001). Contraction and polymerization cooperate to assemble and close actomyosin rings around Xenopus oocyte wounds. J. Cell Biol 154, 785–797. [DOI] [PMC free article] [PubMed] [Google Scholar]
- Matsumura F (2005). Regulation of myosin II during cytokinesis in higher eukaryotes. Trends Cell Biol 15, 371–377. [DOI] [PubMed] [Google Scholar]
- McFadden WM, McCall PM, Gardel ML, and Munro EM (2017). Filament turnover tunes both force generation and dissipation to control long-range flows in a model actomyosin cortex. PLoS Comput. Biol 13, 1–27. [DOI] [PMC free article] [PubMed] [Google Scholar]
- Mi-Mi L, Votra SB, Kemphues K, Bretscher A, and Pruyne D (2012). Z-line formins promote contractile lattice growth and maintenance in striated muscles of C. elegans. J. Cell Biol 198, 87–102. [DOI] [PMC free article] [PubMed] [Google Scholar]
- Munjal A, and Lecuit T (2014). Actomyosin networks and tissue morphogenesis. Dev 141, 1789–1793. [DOI] [PubMed] [Google Scholar]
- Murrell M, Oakes PW, Lenz M, and Gardel ML (2015). Forcing cells into shape: The mechanics of actomyosin contractility. Nat. Rev. Mol. Cell Biol 16, 486–498. [DOI] [PMC free article] [PubMed] [Google Scholar]
- Murthy K, and Wadsworth P (2005). Myosin-II-dependent localization and dynamics of F-actin during cytokinesis. Curr. Biol 15, 724–731. [DOI] [PubMed] [Google Scholar]
- Murugesan S, Hong J, Yi J, Li D, Beach JR, Shao L, Meinhardt J, Madison G, Wu X, Betzig E, et al. (2016). Formin-generated actomyosin arcs propel t cell receptor microcluster movement at the immune synapse. J. Cell Biol 215, 383–399. [DOI] [PMC free article] [PubMed] [Google Scholar]
- Nishimura Y, and Yonemura S (2006). Centralspindlin regulates ECT2 and RhoA accumulation at the equatorial cortex during cytokinesis. J. Cell Sci 119, 104–114. [DOI] [PubMed] [Google Scholar]
- Padmanabhan A, Ong HT, and Zaidel-Bar R (2017). Non-junctional E-Cadherin Clusters Regulate the Actomyosin Cortex in the C. elegans Zygote. Curr. Biol 27, 103–112. [DOI] [PubMed] [Google Scholar]
- Pelletier V, Gal N, Fournier P, and Kilfoil ML (2009). Microrheology of microtubule solutions and actin-microtubule composite networks. Phys. Rev. Lett 102, 100–103. [DOI] [PubMed] [Google Scholar]
- Pollard TD, and O’Shaughnessy B (2019). Molecular Mechanism of Cytokinesis. Annu. Rev. Biochem 88, 661–689. [DOI] [PMC free article] [PubMed] [Google Scholar]
- Pollard TD, and Wu JQ (2010). Understanding cytokinesis: Lessons from fission yeast. Nat. Rev. Mol. Cell Biol 11, 149–155. [DOI] [PMC free article] [PubMed] [Google Scholar]
- Reymann AC, Staniscia F, Erzberger A, Salbreux G, and Grill SW (2016). Cortical flow aligns actin filaments to form a furrow. Elife 5, 1–25. [DOI] [PMC free article] [PubMed] [Google Scholar]
- Robin FB, McFadden WM, Yao B, and Munro EM (2014). Single-molecule analysis of cell surface dynamics in Caenorhabditis elegans embryos. Nat. Methods 11, 677–682. [DOI] [PMC free article] [PubMed] [Google Scholar]
- Salbreux G, Prost J, and Joanny JF (2009). Hydrodynamics of cellular cortical flows and the formation of contractile rings. Phys. Rev. Lett 103, 1–4. [DOI] [PubMed] [Google Scholar]
- Schindelin J, Arganda-Carrera I, Frise E, Kaynig V, Longair M, Pietzsch T, Preibisch S, Rueden C, Saalfeld S, Schmid B, Tinevez J, White Daniel., Hartenstein V, Eliceiri K, Tomancak P, and Cardona A (2009). Fiji - an Open Source platform for biological image analysis. Nat. Methods 9, 676–682. [DOI] [PMC free article] [PubMed] [Google Scholar]
- Schonegg S, Hyman AA, and Wood WB (2014). Timing and mechanism of the initial cue establishing handed left-right asymmetry in Caenorhabditis elegans embryos. Genesis 52, 572–580. [DOI] [PubMed] [Google Scholar]
- Sehring IM, Dong B, Denker E, Bhattachan P, Deng W, Mathiesen BT, and Jiang D (2014). An Equatorial Contractile Mechanism Drives Cell Elongation but not Cell Division. PLoS Biol 12. [DOI] [PMC free article] [PubMed] [Google Scholar]
- Severson AF, Baillie DL, and Bowerman B (2002). A Formin Homology protein and a profilin are required for cytokinesis and Arp2/3-independent assembly of cortical microfilaments in C. elegans. Curr. Biol 12, 2066–2075. [DOI] [PubMed] [Google Scholar]
- Shivas JM, and Skop AR (2012). Arp2/3 mediates early endosome dynamics necessary for the maintenance of PAR asymmetry in Caenorhabditis elegans. Mol. Biol. Cell 23, 1917–1927. [DOI] [PMC free article] [PubMed] [Google Scholar]
- Singh D, Odedra D, Dutta P, and Pohl C (2019). Mechanical stress induces a scalable switch in cortical flow polarization during cytokinesis. J. Cell Sci 132. [DOI] [PMC free article] [PubMed] [Google Scholar]
- Spira F, Cuylen-Haering S, Mehta S, Samwer M, Reversat A, Verma A, Oldenbourg R, Sixt M, and Gerlich DW (2017). Cytokinesis in vertebrate cells initiates by contraction of an equatorial actomyosin network composed of randomly oriented filaments. Elife 6, 1–24. [DOI] [PMC free article] [PubMed] [Google Scholar]
- Stachowiak MR, Laplante C, Chin HF, Guirao B, Karatekin E, Pollard TD, and O’Shaughnessy B (2014). Mechanism of cytokinetic contractile ring constriction in fission yeast. Dev. Cell 29, 547–561. [DOI] [PMC free article] [PubMed] [Google Scholar]
- Swan KA, Severson AF, Clayton Carter J, Martin PR, Schnabel H, Schnabel R, and Bowerman B (1998). cyk-1: A C. elegans FH gene required for a late step in embryonic cytokinesis. J. Cell Sci 111, 2017–2027. [DOI] [PubMed] [Google Scholar]
- Tian D, Diao M, Jiang Y, Sun L, Zhang Y, Chen Z, Huang S, and Ou G (2015). Anillin regulates neuronal migration and neurite growth by linking RhoG to the actin cytoskeleton. Curr. Biol 25, 1135–1145. [DOI] [PubMed] [Google Scholar]
- Timmons L, Court DL, and Fire A (2001). Ingestion of bacterially expressed dsRNAs can produce specific and potent genetic interference in Caenorhabditis elegans. Gene 263, 103–112. [DOI] [PubMed] [Google Scholar]
- Tse YC, Piekny A, and Glotzer M (2011). Anillin promotes astral microtubule-directed cortical myosin polarization. Mol. Biol. Cell 22, 3165–3175. [DOI] [PMC free article] [PubMed] [Google Scholar]
- Tse YC, Werner M, Longhini KM, Labbe JC, Goldstein B, and Glotzer M (2012). RhoA activation during polarization and cytokinesis of the early Caenorhabditis elegans embryo is differentially dependent on NOP-1 and CYK-4. Mol. Biol. Cell 23, 4020–4031. [DOI] [PMC free article] [PubMed] [Google Scholar]
- Vavylonis D, Wu JQ, Hao S, O’Shaughnessy B, and Pollard TD (2008). Assembly mechanism of the contractile ring for cytokinesis by fission yeast. Science (80-. ) 319, 97–100. [DOI] [PubMed] [Google Scholar]
- Watanabe N, Madaule P, Reid T, Ishizaki T, Watanabe G, Kakizuka A, Saito Y, Nakao K, Jockusch BM, and Narumiya S (1997). p140mDia, a mammalian homolog of Drosophila diaphanous, is a target protein for Rho small GTPase and is a ligand for profilin. EMBO J 16, 3044–3056. [DOI] [PMC free article] [PubMed] [Google Scholar]
- Watanabe N, and Mitchison T (2002). Single-molecule speckle analysis of actin filament turnover in lamellipodia. Science 295, 1083–1086. [DOI] [PubMed] [Google Scholar]
- Watanabe S, Okawa K, Miki T, Sakamoto S, Morinaga T, Segawa K, Arakawa T, Kinoshita M, Ishizaki T, and Narumiya S (2010). Rho and Anillin-dependent Control of mDia2 Localization and Function in Cytokinesis. Mol. Biol. Cell 21, 3193–3204. [DOI] [PMC free article] [PubMed] [Google Scholar]
- Werner M, Munro E, and Glotzer M (2007). Astral Signals Spatially Bias Cortical Myosin Recruitment to Break Symmetry and Promote Cytokinesis. Curr. Biol 17, 1286–1297. [DOI] [PMC free article] [PubMed] [Google Scholar]
- White JG, and Borisy GG (1983). On the mechanisms of cytokinesis in animal cells. J. Theor. Biol 101, 289–316. [DOI] [PubMed] [Google Scholar]
- Wu JQ, Kuhn JR, Kovar DR, and Pollard TD (2003). Spatial and temporal pathway for assembly and constriction of the contractile ring in fission yeast cytokinesis. Dev. Cell 5, 723–734. [DOI] [PubMed] [Google Scholar]
- Wu JQ, Sirotkin V, Kovar DR, Lord M, Beltzner CC, Kuhn JR, and Pollard TD (2006). Assembly of the cytokinetic contractile ring from a broad band of nodes in fission yeast. J. Cell Biol 174, 391–402. [DOI] [PMC free article] [PubMed] [Google Scholar]
- Yamashiro S, Mizuno H, Smith M, Ryan G, Kiuchi T, Vavylonis D, and Watanabe N (2014). New single-molecule speckle microscopy reveals modification of the retrograde actin flow by focal adhesions at nanometer scales. Mol. Biol. Cell 25, 1010–1024. [DOI] [PMC free article] [PubMed] [Google Scholar]
- Yamashiro S, Tanaka S, McMillen L, Taniguchi D, Vavylonis D, and Watanabe N (2018). Myosin-dependent actin stabilization as revealed by single-molecule imaging of actin turnonver. Mol. Biol. Cell 29, 1941–1947. [DOI] [PMC free article] [PubMed] [Google Scholar]
- Yüce Ö, Piekny A, and Glotzer M (2005). An ECT2-centralspindlin complex regulates the localization and function of RhoA. J. Cell Biol 170, 571–582. [DOI] [PMC free article] [PubMed] [Google Scholar]
- Zhou M, and Wang Y-L (2008). Distinct pathways for the early recruitment of myosin II and actin to the cytokinetic furrow. Mol. Biol. Cell 19, 318–326. [DOI] [PMC free article] [PubMed] [Google Scholar]
Associated Data
This section collects any data citations, data availability statements, or supplementary materials included in this article.
Supplementary Materials
Near-TIRF movie of a one-cell C. elegans embryo during cytokinesis expressing UTR::GFP to label F-actin, and endogenously tagged NMY-2::mKate2. Top panel: UTR::GFP; Middle panel: NMY-2 :mKate2; Bottom panel: merged UTR::GFP (green) and NMY-2::mKate2 (red). Scale bar = 5 μm. Time compression is 30:1.
Near-TIRF movie of a one-cell C. elegans embryo during cytokinesis expressing actin::GFP at single molecule levels. Top panel: raw movie. Bottom panel: the raw movie overlaid with all single molecule trajectories (labeled in red circles) of length >= 2 frames. Scale bar = 5 μm. Time compression is 18:1.
Near-TIRF movie of a one-cell C. elegans embryo near anaphase onset expressing endogenously-tagged CYK-1::GFP. Top panel: raw movie. Middle panel: 13-frame moving minimum intensity projection highlighting the stationary fraction of CYK-1 particles. Bottom panel: Difference between raw and minimum intensity projection highlighting the mobile fraction of CYK-1 particles (see Experimental Procedures for details). Scale bar = 5 μm. Time compression is 5:1.
Near-TIRF movie of a one-cell C. elegans embryo near anaphase onset expressing endogenously-tagged CYK-1::GFP, with subsets of tracked particles overlaid as red circles (see Experimental Procedures for details). Top panel: all tracked particles with duration >= 2 frames. Second panel: Subset of tracked particles with duration >= 10 frames. Third panel: Subset of tracked particles with duration >= 10 frames, and directional movement. Bottom panel: Subset of tracked particles with duration >= 10 frames, directional movement, and 0.7 <= mean speed <= 2.4 μm/sec. Scale bar = 5 μm. Time compression is 5:1.
Zoomed view of the anterior cortex of a one-cell C. elegans embryo near anaphase onset expressing endogenously-tagged CYK-1::GFP (red) and lifeAct::mCherry (green). The embryo was partially depleted of myosin II to suppress cortical rotation (see STAR methods for details). Scale bar = 2 μm. Time compression is 9:1.
Zoomed view of the cortex of a one-cell C. elegans embryo near anaphase onset expressing endogenously-tagged CYK-1::GFP (magenta) and lifeAct::mCherry (cyan). The embryo was partially depleted of myosin II to suppress cortical rotation (see STAR methods for details). Top, middle and bottom panels highlight three different examples of a fast-moving CYK-1::GFP particle, marking a growing filament, which turns as it encounters an existing filament or bundle. Left and right panels show images processed to enhance the F-actin and CYK-1 signals (see STAR methods for details). Yellow circle in right panels indicates the CYK-1 particle of interest. Scale bar = 2 µm. Time compression is 9:1.
Near-TIRF movie of examples of CYK-1 particles traveling into the equatorial region. The white lines mark equatorial region, and the red circles highlight the CYK-1 particle of interest. Scale bar = 3 µm. Time compression is 5:1.
Data Availability Statement
The raw datasets supporting the conclusions of the current study are available from the Lead Contact upon reasonable request. The code is available online at DOI:10.17632/nngxmhc4z5.1