

Abstract
Genotype-phenotype association studies often combine phenotype data from multiple studies to increase statistical power. Harmonization of the data usually requires substantial effort due to heterogeneity in phenotype definitions, study design, data collection procedures, and data-set organization. Here we describe a centralized system for phenotype harmonization that includes input from phenotype domain and study experts, quality control, documentation, reproducible results, and data-sharing mechanisms. This system was developed for the National Heart, Lung, and Blood Institute’s Trans-Omics for Precision Medicine (TOPMed) program, which is generating genomic and other -omics data for more than 80 studies with extensive phenotype data. To date, 63 phenotypes have been harmonized across thousands of participants (recruited in 1948–2012) from up to 17 studies per phenotype. Here we discuss challenges in this undertaking and how they were addressed. The harmonized phenotype data and associated documentation have been submitted to National Institutes of Health data repositories for controlled access by the scientific community. We also provide materials to facilitate future harmonization efforts by the community, which include 1) the software code used to generate the 63 harmonized phenotypes, enabling others to reproduce, modify, or extend these harmonizations to additional studies, and 2) the results of labeling thousands of phenotype variables with controlled vocabulary terms.
Keywords: cardiovascular disease, common data elements, hematologic disease, information dissemination, lung diseases, phenotypes, sleep-wake disorders
Abbreviations
- dbGaP
database of Genotypes and Phenotypes
- DCC
Data Coordinating Center
- QC
quality control
- TOPMed
Trans-Omics for Precision Medicine
- UMLS
Unified Medical Language System
- WG
Working Group
To increase statistical power in epidemiologic analyses, multiple studies are often combined for pooled or meta-analysis. Heterogeneity among studies is generally addressed by means of careful selection and harmonization of study data to include in the analyses. In this report, we describe a system for phenotype harmonization which was developed for the National Heart, Lung, and Blood Institute’s Trans-Omics for Precision Medicine (TOPMed) program (https://www.nhlbiwgs.org/). We define phenotype harmonization as the process by which data variables, each representing a specified phenotype concept, are selected from multiple studies and transformed as needed so that they can be combined and analyzed together. In principle, phenotype harmonization can be achieved prospectively when all contributing studies use the same standardized protocols (1, 2). However, retrospective harmonization is often needed in order to use valuable data previously collected in multiple studies using different phenotype definitions, study designs, data collection procedures, and data structures.
A key goal of the TOPMed program is to identify genetic risk factors for heart, lung, blood, and sleep disorders. To date, the program has generated whole-genome sequence data for over 140,000 participants from more than 80 different studies (3). Investigators in the participating studies have previously gathered extensive phenotype data, including physical measurements, clinical chemistry, questionnaires, clinical registries, and medical imaging. Information on many of the same phenotypes has been collected in multiple studies, which provides the potential for combined analyses to increase power for detecting the effects of low-frequency and rare-sequence variants. However, because of substantial heterogeneity in phenotype data among studies and over time, harmonization is required for combined analyses.
Our system for retrospective harmonization of phenotype data in TOPMed includes a collaborative framework, domain expertise, high-quality data inputs, validation of data outputs, rigorous documentation, and respect for stakeholders (i.e., features of the Maelstrom Research guidelines (Research Institute of the McGill University Health Centre, Montreal General Hospital, Montreal, Quebec, Canada) (2)), as well as reproducibility, updating, and sharing of harmonized results derived from controlled-access human data. We describe these features in detail, along with examples of applications to TOPMed study data. We also describe a system for tagging study variables with phenotype concepts for use in future harmonization efforts.
METHODS
Overview
The TOPMed Data Coordinating Center (DCC) developed a collaborative process for phenotype harmonization that was integrated with the activities of TOPMed Working Group (WG) members, who include phenotype experts, genetic epidemiologists, and data analysts. Initially, WG members established a specific objective, which was usually to identify DNA sequence variants associated with variation in a defined phenotype concept. The DCC identified relevant data from up to 17 TOPMed studies (see Web Appendix 1 and Web Table 1, available at https://doi.org/10.1093/aje/kwab115) per phenotype and performed harmonization to fit the WG’s phenotype concept, using the steps described below. This concept was often refined to provide greater homogeneity across studies as data from each study were explored, often in collaboration with WG investigators and data managers who had detailed knowledge of their study’s data. We also consulted periodically with the TOPMed Steering Committee and the TOPMed Phenotype Harmonization Committee on the overall process. Table 1 provides definitions of terms used in this paper.
Table 1.
Specific Terminology Used in This Article, in Web Appendices 1–11, and in Documentation Distributed With Harmonized PhenoType Data
| Term | Definition |
|---|---|
| Participant or subject | Studies generally refer to an individual participating in their study as a “participant,” while dbGaP uses “subject” as the equivalent term. |
| Cohort and subcohort | A sample of study participants enrolled in the study together at a given time (or clinic visit). The term “subcohort” refers to a distinct group of participants within a study, as defined by that study (e.g., a different recruitment wave or targeted demographic group). |
| Phenotype or trait | Observable characteristics of an organism. “Phenotype” and “trait” are used synonymously. |
| Phenotype concept | Broad definition of a phenotype, such as “quantitative measure of high-density lipoprotein concentration in blood” or “qualitative indicator of diabetes mellitus status.” |
| Phenotype variable | A vector of data values representing a measurement or other aspect of a phenotype concept, where each item in the vector corresponds to the value for a specific participant and/or repeated measure for a participant. |
| dbGaP study variable | An unharmonized phenotype variable from a given study’s dbGaP accession. |
| Candidate variable | A phenotype variable from a given study to be evaluated for use as a component phenotype variable. Such evaluation includes consideration of factors such as how well it represents the target phenotype concept, how well it can be harmonized with candidate variables from other studies, and the quality of the data. |
| Component variable | A phenotype variable selected for inclusion in a single harmonization, either because it directly represents the target phenotype (e.g., biomarker concentration) or because it is useful in constructing the harmonized variable (e.g., biomarker assay quality). |
| Harmonized variable | A phenotype variable constructed from a set of component variables from different studies, after performing whatever harmonization steps are considered to be important for a valid pooled analysis or meta-analysis. |
| Harmonization algorithm and function | The algorithm is a series of steps to be applied to the group of component variables to produce harmonized phenotype values for a single harmonization unit. Algorithms are implemented in Ra functions. |
| Harmonization unit | A group of subjects from a single study (e.g., subcohort) with the same component variables, to which a single harmonization algorithm is applied to produce harmonized phenotype values. A harmonized variable is typically constructed by combining multiple harmonization units from one or more studies. |
| Harmonized data set | A data set consisting of a set of harmonized variables representing various aspects of phenotype concepts. It may also contain harmonized variables for multiple related phenotype concepts. For example, the “lipids” data set contains phenotype variables for concentrations of each of several lipid compounds assayed from the same blood draw, as well as age at blood draw, fasting status, and use of lipid-lowering medication. |
Abbreviation: dbGaP, database of Genotypes and Phenotypes.
a R Foundation for Statistical Computing, Vienna, Austria (5).
Figure 1.

Overview of the data harmonization process used by the Trans-Omics for Precision Medicine (TOPMed) Data Coordinating Center (DCC). A) Existing study data in diverse formats are curated by the database of Genotypes and Phenotypes (dbGaP), including accessioning and conversion to a consistent file format. B) Formatted data and associated metadata (e.g., variable descriptions) are stored in a TOPMed DCC relational database. C) The harmonized phenotype variable is defined, and metadata for multiple studies are searched to identify candidate phenotypic variables that potentially can be harmonized together to produce the desired harmonized variable (harmonization steps 1 and 2). D) Analytical tools that interact with the DCC database are used for quality control (QC) of study variables, implementation of harmonization algorithms, and documentation; harmonized results are added to the same DCC database as that shown in step B (harmonization steps 3–5). E) Files containing a multistudy, harmonized data set and associated documentation are produced. F) Data, metadata, and documentation are submitted to a National Institutes of Health (NIH) repository for controlled access by the scientific community, while documentation files in JavaScript Object Notation format containing software code and provenance tracking are submitted to a publicly available GitHub repository.
The DCC’s system for implementing harmonization is outlined in Figure 1. Although we describe the harmonization process as a linear sequence of steps, the results of later steps often required going back and modifying earlier steps.
The system tracked the harmonization of each phenotype separately, along with participant age at measurement or biosample collection. Each harmonized phenotype variable was assigned a controlled-vocabulary term from the Unified Medical Language System (UMLS) (4). Analysts worked on a group of related phenotype variables at the same time (e.g., high-density lipoprotein cholesterol, low-density lipoprotein cholesterol, total cholesterol, triglycerides, fasting status, and use of lipid-lowering medication), which were generally released together in a single data set (e.g., “Lipids”; Table 2). When harmonizing a group of related phenotypes, it is important to use phenotype variables that were measured or collected from a participant at the same time point.
Table 2.
Harmonized Variables Produced by the TOPMed Data Coordinating Center for 17 Studies with Recruitment Dates Spanning 1948–2012a
| Data Set and Phenotype Concept |
Harmonized
Variable Name b |
No. of
Participants |
No. of
Studies |
|---|---|---|---|
| Atherosclerosis | |||
| CAC volume | cac_volume_1 | 11,098 | 2 |
| CAC score | cac_score_1 | 15,042 | 6 |
| Common carotid IMT | cimt_1 | 35,420 | 6 |
| Common carotid IMT | cimt_2 | 30,473 | 5 |
| Carotid stenosis | carotid_stenosis_1 | 15,098 | 3 |
| Presence of carotid plaque | carotid_plaque_1 | 27,344 | 5 |
| Baseline common covariates | |||
| Standing body height | height_baseline_1 | 230,287 | 16 |
| Body weight | weight_baseline_1 | 230,657 | 16 |
| Ever smoker status | ever_smoker_baseline_1 | 225,271 | 14 |
| Current smoker status | current_smoker_baseline_1 | 228,688 | 16 |
| Body mass index | bmi_baseline_1 | 230,918 | 17 |
| Blood cell count | |||
| Basophil concentration in blood | basophil_ncnc_bld_1 | 36,586 | 7 |
| Eosinophil concentration in blood | eosinophil_ncnc_bld_1 | 37,426 | 7 |
| Lymphocyte concentration in blood | lymphocyte_ncnc_bld_1 | 39,702 | 7 |
| Hematocrit level in blood | hematocrit_vfr_bld_1 | 193,469 | 9 |
| Hemoglobin concentration in blood | hemoglobin_mcnc_bld_1 | 193,367 | 9 |
| Monocyte concentration in blood | monocyte_ncnc_bld_1 | 39,647 | 7 |
| Neutrophil concentration in blood | neutrophil_ncnc_bld_1 | 38,285 | 7 |
| Mean corpuscular volume in blood | mcv_entvol_rbc_1 | 44,593 | 7 |
| Mean corpuscular hemoglobin concentration in blood | mchc_mcnc_rbc_1 | 51,293 | 8 |
| Mean corpuscular hemoglobin in blood | mch_entmass_rbc_1 | 39,649 | 7 |
| Platelet concentration in blood | platelet_ncnc_bld_1 | 190,177 | 9 |
| Mean platelet volume in blood | pmv_entvol_bld_1 | 13,816 | 3 |
| Red blood cell concentration in blood | rbc_ncnc_bld_1 | 39,710 | 7 |
| Red cell distribution width | rdw_ratio_rbc_1 | 28,034 | 4 |
| White blood cell concentration in blood | wbc_ncnc_bld_1 | 192,346 | 9 |
| Blood pressure | |||
| Systolic blood pressure | bp_systolic_1 | 225,934 | 14 |
| Diastolic blood pressure | bp_diastolic_1 | 225,934 | 14 |
| Use of antihypertensive medication | antihypertensive_meds_1 | 207,130 | 12 |
| Demographic characteristics | |||
| Hispanic subgroup | hispanic_subgroup_1 | 18,612 | 4 |
| Subcohort identifier | subcohort_1 | 218,747 | 15 |
| Reported race | race_1 | 230,994 | 17 |
| Reported sex | annotated_sex_1 | 233,030 | 17 |
| Reported Hispanic/Latino indicator | ethnicity_1 | 188,905 | 11 |
| Geographic recruitment site | geographic_site_1 | 212,529 | 12 |
| Inflammation | |||
| CD40 protein concentration in blood | cd40_1 | 4,238 | 2 |
| CRP concentration in blood | crp_1 | 49,536 | 10 |
| E-selectin concentration in blood | eselectin_1 | 1,215 | 1 |
| ICAM-1 concentration in blood | icam1_1 | 15,876 | 5 |
| IL-1β concentration in blood | il1_beta_1 | 708 | 1 |
| IL-6 concentration in blood | il6_1 | 20,390 | 5 |
| IL-10 concentration in blood | il10_1 | 3,455 | 2 |
| IL-18 concentration in blood | il18_1 | 3,159 | 1 |
| Isoprostane 8-epi-PGF2α concentration in urine | isoprostane_8_epi_pgf2a_1 | 7,523 | 1 |
| Activity of LP-PLA2 in blood | lppla2_act_1 | 18,117 | 3 |
| Mass of LP-PLA2 in blood | lppla2_mass_1 | 18,049 | 3 |
| MCP-1 concentration in blood | mcp1_1 | 7,557 | 1 |
| MMP-9 concentration in blood | mmp9_1 | 964 | 1 |
| Myeloperoxidase concentration in blood | mpo_1 | 3,162 | 1 |
| Osteoprotegerin concentration in blood | opg_1 | 7,648 | 1 |
| P-selectin concentration in blood | pselectin_1 | 8,037 | 1 |
| TNF-α concentration in blood | tnfa_1 | 5,075 | 3 |
| TNF-α receptor 1 concentration in blood | tnfa_r1_1 | 2,802 | 1 |
| TNF receptor 2 concentration in blood | tnfr2_1 | 7,962 | 1 |
| Lipids | |||
| Fasting status | fasting_lipids_1 | 64,895 | 11 |
| High-density lipoprotein concentration in blood | hdl_1 | 65,676 | 11 |
| Total cholesterol concentration in blood | total_cholesterol_1 | 65,707 | 11 |
| Triglyceride concentration in blood | triglycerides_1 | 65,706 | 11 |
| Low-density lipoprotein concentration in blood | ldl_1 | 64,715 | 11 |
| Use of lipid-lowering medication | lipid_lowering_medication_1 | 58,962 | 9 |
| VTE | |||
| Age at beginning of follow-up | vte_followup_start_age_1 | 61,692 | 4 |
| Prior history of VTE | vte_prior_history_1 | 62,445 | 5 |
| VTE case status | vte_case_status_1 | 63,092 | 6 |
Abbreviations: CAC, coronary artery calcium; CAM-1, intercellular adhesion molecule 1; CD40, cluster of differentiation 40; CRP, C-reactive protein; 8-epi-PGF2-α, 8-epi-prostaglandin F2α; IL-1β, interleukin 1β; IL-6, interleukin 6; IL-10, interleukin 10; IL-18, interleukin 18; IMT, intima-media thickness; LP-PLA2, lipoprotein-associated phospholipase A2; MCP-1, monocyte chemoattractant protein 1; MMP-9, matrix metalloproteinase 9; TNF-α, tumor necrosis factor α; TOPMed, Trans-Omics for Precision Medicine; VTE, venous thromboembolism.
a See Web Table 1 for descriptions of the 17 studies. Additional documentation about each harmonized variable can be found in the GitHub repository (14).
b The “concept variant number” at the end of each harmonized variable name differentiates among different implementations of harmonization for the same basic phenotype concept (e.g., cimt_1 and cimt_2 are names for carotid IMT variables calculated with slightly different harmonization algorithms).
The information technology supporting phenotype harmonization consisted of a locally hosted relational database and associated applications. A custom R (R Foundation for Statistical Computing, Vienna, Austria) package (5) was used to interact with the database, and a series of Python (Python Software Foundation, Wilmington, Delaware) and R scripts were run by analysts to perform harmonization. The codebase also allowed addition of new study and harmonized data to the database, retrieval of existing study data in their original structure, and production of harmonized data sets and documentation for distribution to investigators. A custom Web application was used to search the publicly available metadata for relevant study variables.
This report describes the TOPMed DCC system. It does not document other harmonization efforts involving TOPMed studies that were performed independently of the DCC (e.g., by Oelsner et al. (6) or the independent efforts of various TOPMed WGs).
Obtaining and processing study data
All study phenotype data and associated metadata were obtained from the National Institutes of Health database of Genotypes and Phenotypes (dbGaP) (7), which provides controlled access for the scientific community. Use of dbGaP data provides a mechanism for tracking the provenance of a harmonized phenotype variable using dbGaP accession numbers assigned to multiple data entities, including studies, data sets, and individual variables within data sets. The harmonization system leverages work performed by dbGaP to curate data into a consistent file format, include metadata (e.g., variable descriptions and types), and perform some value-checking based on data type. Use of dbGaP data enables reproducibility of harmonized phenotypes, as scientific investigators can obtain the same data sets. For each study, the harmonization process included all participants with data available in dbGaP, rather than only those being sequenced in TOPMed.
After obtaining approval for access to a study’s dbGaP accession, all available phenotype data and associated metadata were imported into a relational database (Web Appendix 2).
Studies participating in TOPMed were approved by all relevant institutional review boards, and participants provided informed consent, including information regarding data-use limitations and guidelines for sharing data via dbGaP. Even though the DCC-harmonized data for all participants are available in dbGaP, the resulting harmonized phenotypes may only be analyzed for participants whose dbGaP consent group allows research in that area. Investigators must obtain approval (via dbGaP application) to obtain access to the studies and consent groups that match their intended use.
Harmonization steps
The following harmonization steps are focused on producing each individual harmonized phenotype variable (although several related phenotypes may be harmonized in parallel and provided to users within a single data set). Web Appendices 3–7 provide details about these steps using 4 harmonized phenotypes as examples.
Step 1: Define the harmonized phenotype variable.
The first step, usually performed by WG members intending to use the harmonized data, was to develop a precise definition of the target harmonized phenotype variable that includes key features needed to address their primary objectives. These features often included references to specific assay or measurement methods, time points in longitudinal studies, and other relevant factors. For example, for low-density lipoprotein cholesterol concentration in blood, the definition might specify calculation according to the Friedewald equation (8) using high-density lipoprotein cholesterol, total cholesterol, and triglyceride measurements, all from the same blood sample drawn at the baseline clinic visit after a period of fasting. The initial definition was sometimes modified to accommodate heterogeneity in the data available in different studies as it was discovered in subsequent steps. (Also see Web Appendix 3.)
Step 2: Identify “candidate” phenotype variables across contributing studies.
The next step was to identify candidate dbGaP study variables that could potentially be used for calculating the target harmonized phenotype variable, as well as corresponding variables containing age at measurement or biosample collection (Web Appendix 4 and Web Tables 2–6). Because controlled vocabulary usage is limited in dbGaP data sets, this process consisted of searching variable names, descriptions, and encoded values. WG members were closely involved in determining whether a study variable met the phenotype definition. The tagging project described below was implemented to facilitate this process for both DCC harmonization and similar efforts by the scientific community.
Once an initial set of candidate variables was identified, the selection was refined by assessing compatibility with the definition of the target harmonized phenotype and for methodological equivalence across studies. This process often involved selecting among different methods of measuring the phenotype and/or choosing the most appropriate variable from a set of repeated measurements. Analysts generally consulted publicly available study protocols, phenotype domain experts in the relevant WG, and study liaisons, who know the intricacies of their study’s data. Some studies were omitted because candidate variables that met the definition could not be identified. Candidate variable selection is critical because phenotype heterogeneity in a combined analysis can lead to loss of power and thereby defeat the purpose of combining data across studies.
In some cases, a new harmonized variable was constructed from previously harmonized component variables (e.g., a harmonized body mass index variable from previously harmonized height and weight variables).
Step 3: Perform quality control on candidate variables.
Quality control (QC) on selected candidate variables was performed to assess data reliability by checking whether the observed values were consistent with expected ranges, investigating any unexpected distributions, and checking that the data were internally consistent with other related study variables (Web Appendix 5). Batch effects and consistency of data collection methods were also evaluated when relevant information was available (e.g., Web Figure 1). Mistakes in data management and/or documentation (e.g., un- or misspecified missing-value codes, incorrect units of measurement, and errors in variable labeling or description) can be identified as a specific data set that differs notably from expectation.
If QC issues were identified for a candidate variable, analysts decided, in consultation with the WG and study liaisons, whether an alternative variable from the same study could be used or whether the study should be excluded from the harmonization for this phenotype. Individual data points with impossible values (such as a negative analyte concentration) were excluded from the harmonized phenotype variable. Extreme but theoretically possible values were noted in the documentation but were not excluded because 1) the definition of extremity is often difficult and subjective; 2) TOPMed whole-genome sequencing has discovered millions of rare variants, some of which may be causing extreme phenotypic values; and 3) users may prefer to handle extreme values differently (e.g., by excluding or winsorizing at different values). Therefore, the decision about how to handle extreme values in analyses was left to downstream users of the data.
QC results for candidate study variables were used to determine which ones would be used as “component” variables in subsequent harmonization steps. The final set of component variables was chosen only after QC of the multistudy harmonized variable (see step 5).
Step 4: Construct harmonization algorithms.
The next step was to specify the algorithms to be used in transforming component variables into the harmonized variable (Web Appendix 6). An algorithm was developed for each “harmonization unit,” which consists of a group of participants from a single study with component variables that can be harmonized in the same way. Each algorithm was implemented as an R function that accepts the component variables as input and returns the harmonized values and age at measurement. The algorithm might be as simple as giving each component variable a consistent name across studies or converting to a common unit of measurement, but it often included more complicated steps, such as averaging repeated measurements or creating a smoking status variable from multiple questionnaire responses. See Web Figures 2–7 for examples.
Step 5: Produce and perform QC on the multistudy harmonized phenotype.
After harmonization algorithms were implemented for each contributing study, the harmonized values were calculated and combined across harmonization units and studies using in-house R scripts (Web Appendix 7 and Web Figure 8).
This draft of the multistudy harmonized variable was then assessed for homogeneity of values among studies and harmonization units within studies. This process included a comparison of mean values and standard deviations for continuous variables or frequencies for categorical variables, by study, subcohort, and other relevant subgroups within each study. For continuous variables, we also inspected the distributions of residuals after fitting a linear model with age, sex, and harmonized race (e.g., see Web Figures 9 and 10). The goal of this step was to identify issues in the harmonization functions or in studies’ component variables or metadata. If any issues arose in this process, analysts evaluated whether the harmonization unit in question should be excluded or whether different component variables should be used for harmonization.
When QC checks were complete and the set of contributing studies was finalized, analysts summarized the results and any additional information relevant for analysis in a free text document named “Harmonization Comments.” This document may include 1) notes about the presence of a notable cluster of outliers; 2) differences among studies that were not considered important enough for removal of a study from harmonization; 3) errors encountered in the component variable metadata during the QC process; or 4) variation among studies or subcohorts in assay or other collection methodology. These notes allow users to flexibly choose how to account for potential effects or exclude specific studies in analysis. See Web Figures 11–14 for examples of harmonization comments.
The final multistudy harmonized variable was then added to the DCC’s phenotype database. The information added included metadata and data values for the harmonized variable, the set of component variables and harmonization functions used to generate the harmonized data values, and the harmonization comments.
Distributing harmonization results to the scientific community
The DCC provides a package of data sets and documentation using information stored in the database (Web Appendix 8). Each data set generally includes a group of related harmonized variables plus age at measurement for each variable. The documentation includes files in JavaScript Object Notation format containing code that allows a user to reproduce or modify harmonized variables once they obtain access to the specified study data from dbGaP (see Web Appendix 9). In addition, the harmonized variables described in Table 2 have been submitted to dbGaP and to the National Heart, Lung, and Blood Institute’s BioData Catalyst repository (https://biodatacatalyst.nhlbi.nih.gov/) for distribution to the scientific community via application to dbGaP.
Updating harmonized variables
A harmonized phenotype variable often needed to be updated to include additional studies and/or to incorporate dbGaP updates to the component study variables from previously included studies (Web Appendix 10). These updates were semiautomated because the relational database contained all of the information necessary to recreate the harmonized phenotype. Updates to all variables in a data set were typically made at the same time when requested by WGs, often because additional studies were sequenced by TOPMed.
Tagging phenotype variables to facilitate future harmonization
While the detailed harmonization process described above produces well-documented, reproducible, and updateable harmonized phenotype variables, other investigators may want to carry out harmonization differently (e.g., using different component variables, a different harmonization algorithm, a different harmonized phenotype definition, or different time points). They may also need to harmonize a phenotype the DCC has not worked on yet. To facilitate identification of candidate variables for harmonization, we worked with study and domain experts to label TOPMed dbGaP study variables with controlled vocabulary terms to indicate the phenotype concept they represent (i.e., “variable tagging”). Study variables were tagged with 65 important phenotype concepts from heart, lung, blood, sleep, and demographic domains (Web Table 7). Harmonized phenotype variables for 27 of the 65 concepts have been constructed already, but many more are possible, even for the same concept. The remaining DCC-harmonized variables represent phenotype concepts that were not directly included among the 65 originally identified concepts.
Study variable tagging was done via a database-backed Web application with built-in data validation. The DCC worked with representatives from 7 large cohort studies to identify all of their studies’ dbGaP study variables that fit 1 or more of the 65 phenotype concepts and to label them with the appropriate phenotype concept tag(s) and corresponding UMLS term(s). DCC phenotype team members also tagged variables for the remaining studies available at the time. We performed careful quality review of all tagged variables to ensure consistency and accuracy of the tagging across studies. Details on this process are provided in Web Appendix 11.
RESULTS
Phenotypes harmonized
A total of 63 harmonized variables were constructed across multiple TOPMed studies (up to 17 for some variables) belonging to 8 phenotype data sets (Table 2). Within each data set, the variables generally represent related phenotypes that are analyzed together (except for common covariates and demographic variables). Web Figure 15 shows histograms of the harmonized variables.
QC issues in harmonization
QC was generally the most time-consuming step in the process, as it directly tested the reliability of component variables and could not be meaningfully automated. Four types of issues arose frequently during QC of study and harmonized phenotype variables: 1) notable differences among studies/subcohorts in the distributions of quantitative measures or frequencies of categorical phenotypes; 2) variation among studies/subcohorts in methods for how the same phenotype was assessed or measured; 3) extreme (sometimes impossible) values of quantitative measures; and 4) inconsistencies in the values of related phenotypes. Distributional differences among studies/subcohorts were occasionally found to be due to errors in data management, such as a misspecified missing value code (see example on smoking below) or incorrect units in the data dictionary; such issues were resolved in consultation with study data managers. In general, the resolution of QC issues was highly phenotype-dependent and relied on expertise from the WG members and study liaisons. Here we give some examples of how these issues were detected and resolved, with more detail and examples in Web Appendices 5 and 7.
When producing a harmonized variable, we compared distributions across studies and subcohorts within studies to identify differences that might be due to errors or unusual features of a given study. We show an example of this type of comparison in Figure 2 for the “ever smoker” harmonized variable. It is clear that 2 studies/subcohorts, F and G1, had a much higher proportion of smokers than average, while a third study/subcohort, E, had a much lower proportion of smokers than average. In 2 cases, the proportions can be explained by the studies’ recruitment strategies; study/subcohort F targeted smokers for enrollment in the study (9), while study/subcohort E included children (10). Because these differences can be explained by recruitment strategy, no modification of the harmonization process was needed. Further exploration of subcohort G1 showed that this high proportion was due to an unlabeled missing-value code in one of the component variables. We corrected the harmonization algorithm to account for this missing code, and the differences between the proportions of smokers by subcohort were then much smaller.
Figure 2.

Proportion of ever smokers from the harmonized “ever_smoker_baseline_1” variable in the TOPMed DCC harmonized common covariates data set, by (anonymized) study subcohort. In both plots, different studies are labeled by a letter (e.g., B), and different subcohorts within each study (if applicable) are labeled by appending a number to the study letter (e.g., B1 and B2). A) Proportion of smokers by study/subcohort after initial harmonization. Three studies/subcohorts (E, F, and G1) have much smaller or larger proportions than the majority of other studies. B) Proportion of smokers by study/subcohort after correcting study/subcohort G1 (shown in black) for an unlabeled missing-value code. DCC, Data Coordinating Center; TOPMed, Trans-Omics for Precision Medicine.
A second example of harmonized phenotype QC is shown in Figure 3. The final QC for interleukin 6 concentration included inspection of the distribution of values by study and subcohort, as well as the residuals, after adjustment for age, sex, and race. The distribution for 1 study was much wider in range and generally had higher values than the other studies/subcohorts (study E in Figure 3). These differences remained even after adjustment for age, sex, and race. The DCC consulted with study liaisons and decided to remove that study from harmonization because the reason for the unusual distribution could not be determined.
Figure 3.
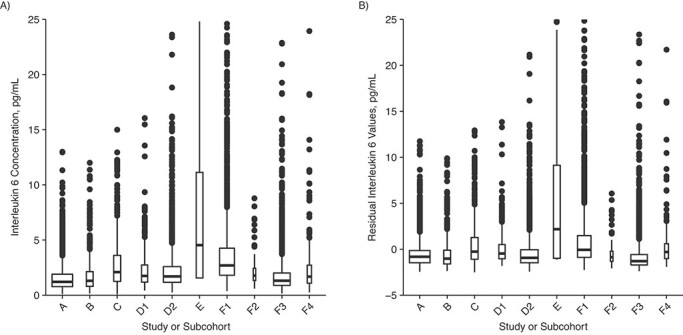
Distribution of harmonized interleukin 6 (IL-6) values in the TOPMed DCC harmonized inflammation data set, by (anonymized) study/subcohort. In both plots, different studies are labeled by a single letter (e.g., D), and different subcohorts within each study (if applicable) are labeled by appending a number to the study letter (e.g., D1 and D2). A) Harmonized IL-6 values. The interquartile range for study E is much larger than that for the other studies/subcohorts. B) Residuals from a linear model (IL-6 ~ age + sex + race). The large differences between study E and the other studies/subcohorts remain after adjusting the values for age, sex, and race. DCC, Data Coordinating Center; TOPMed, Trans-Omics for Precision Medicine.
There is often a trade-off between the homogeneity of a harmonized variable and achieving a large sample size by including many studies (11–13). This issue generally arose when studies measured different aspects of a harmonized variable (e.g., measurements of the thickness of different carotid artery walls for calculating common carotid intima-media thickness) or used different methods to collect a similar measurement (e.g., different assay methods for inflammation phenotypes). In these cases, WG and study members were involved in decisions about whether to exclude studies or modify the definition of the harmonized phenotype.
We sometimes found biologically invalid data points, such as diastolic blood pressure greater than systolic blood pressure for some participants, or unexpected relationships between variable values, such as white blood cell subtype counts not adding up to the total count. Other inconsistencies were found in participant responses to questionnaires (e.g., participants who report that they have never smoked but also report smoking a nonzero number of cigarettes per day). As noted in the Methods section, impossible data values are typically not included in the harmonized variable, while the potentially valid but extreme values are retained but noted in the harmonization comments.
Reproducibility of harmonized phenotype variables
We have successfully reproduced several of our harmonized variables exactly using only the JavaScript Object Notation documentation provided in our public GitHub repository (14), along with the specified study data files from dbGaP (via controlled access). The repository also includes a fully reproducible example using simulated dbGaP data that instructs users about how to reproduce the harmonized variables using the documentation.
DCC phenotype tagging results
We tagged dbGaP study variables with UMLS terms representing 65 phenotype concepts in 16 domains. Web Table 7 provides descriptions, detailed tagging instructions, and UMLS terms for each phenotype concept. A total of 16,671 dbGaP study variables from 17 studies were tagged with relevant UMLS phenotype terms. Table 3 shows the number of variables available in each study, the number tagged, and the proportion tagged. The latter varies according to variation among studies in the breadth and depth of phenotype domains for which the investigators have collected data. For example, the Framingham Heart Study has many variables in domains that are not part of the 65 phenotype concepts chosen for tagging, such as bone mineral density measurements. Further details are provided in Web Appendix 11, Web Table 8, and Web Figures 16 and 17.
Table 3.
Numbers and Proportions of Variables Tagged With Controlled Vocabulary Phenotype Concepts for Each of the 17 TOPMed Studies Included in This Articlea
| Study |
dbGaP
Accession No. |
No. of dbGaP
Variables |
No. of
Variable-Tag Pairs b |
Proportion
Tagged |
|---|---|---|---|---|
| Genetics of Cardiometabolic Health in the Amish | phs000956.v2.p1 | 53 | 40 | 0.75 |
| ARIC Studyc | phs000280.v3.p1 | 14,430 | 1,713 | 0.12 |
| CARDIA Studyc | phs000285.v3.p2 | 9,036 | 1,608 | 0.18 |
| Cleveland Family Study | phs000284.v1.p1 | 2,325 | 371 | 0.16 |
| Cardiovascular Health Studyc | phs000287.v6.p1 | 14,657 | 2,175 | 0.15 |
| COPDGene Study | phs000179.v5.p2 | 332 | 103 | 0.31 |
| CRA Study | phs000988.v2.p1 | 15 | 13 | 0.87 |
| Framingham Heart Studyc | phs000007.v29.p10 | 61,195 | 6,579 | 0.11 |
| GENOA Study | phs001238.v1.p1 | 1,072 | 441 | 0.41 |
| GOLDN Study | phs000741.v2.p1 | 107 | 9 | 0.08 |
| HCHS/SOL | phs000810.v1.p1 | 274 | 132 | 0.48 |
| Heart and Vascular Health Study | phs001013.v2.p2 | 23 | 20 | 0.87 |
| Jackson Heart Studyc | phs000286.v5.p1 | 4,084 | 745 | 0.18 |
| Mayo VTE | phs000289.v2.p1 | 41 | 17 | 0.41 |
| MESAc | phs000209.v13.p3 | 22,044 | 1,943 | 0.09 |
| Samoan Adiposity Study | phs000914.v1.p1 | 167 | 48 | 0.29 |
| Women’s Health Initiativec | phs000200.v11.p3 | 6,117 | 1,106 | 0.18 |
Abbreviations: ARIC, Atherosclerosis Risk in Communities; CARDIA, Coronary Artery Risk Development in Young Adults; COPD, chronic obstructive pulmonary disease; COPDGene, Genetic Epidemiology of COPD; CRA, Genetic Epidemiology of Asthma in Costa Rica; GENOA, Genetic Epidemiology Network of Arteriopathy; GOLDN, Genetics of Lipid Lowering Drugs and Diet Network; HCHS/SOL, Hispanic Community Health Study/Study of Latinos; MAYO VTE, Mayo Clinic Venous Thromboembolism Study; MESA, Multi-Ethnic Study of Atherosclerosis; TOPMed, Trans-Omics for Precision Medicine.
a Participants were recruited during the years 1948–2012. See Web Table 1 for additional study information, including each study’s recruitment period.
b Number of variable-tag pairs. In some cases, a variable can be tagged with multiple different tags. The sum of all pairs in this column is 17,063, while the number of variables paired with 1 or more tags is 16,671.
c Initial tagging was done by study data experts; other studies in this table were tagged by analysts at the TOPMed Data Coordinating Center.
Data availability
The study data used as input for harmonization are available to the scientific community from dbGaP via controlled access. In a single application, a user can apply for access to all dbGaP study accessions provided in the documentation. In addition, the harmonized data in Table 2 have been submitted to dbGaP and to the National Heart, Lung, and Blood Institute’s new data repository, BioData Catalyst (https://biodatacatalyst.nhlbi.nih.gov). In both cases, access will be through application to dbGaP.
We worked with dbGaP scientists to make the tagging results available in dbGaP searches and visible on the dbGaP variable pages. Detailed information on how to access and use this information is available on the TOPMed website (15).
DISCUSSION
The TOPMed program was designed to add cutting-edge genomics and other -omics data to over 80 studies with extensive characterization of heart, lung, blood, and sleep phenotypes (3). Because phenotype data in the contributing studies are quite heterogeneous, retrospective harmonization is critical to achieving the program’s goals. The harmonization system described in this article has been used to harmonize 63 phenotypes for several WGs, members of which are using them in many different analyses, primarily genotype-phenotype association studies. Some of these studies have been published (e.g., 16–19), and many others are in preparation.
An area of phenotype harmonization previously noted as needing further research is how to determine whether the harmonized data are adequate to address the intended research goals (20). In genome-wide association studies, one measure of success is replication of novel genotype-phenotype associations using independent data sets, which is a standard for publication in the field and a major component of TOPMed research. Assessing loss of power due to phenotype heterogeneity is more difficult but could potentially be addressed through sensitivity tests—for example, excluding studies with phenotypes that do not fit the idealized concept as well as others. In addition, failure to replicate strong, previously identified genotype-phenotype associations in a newly harmonized data set may suggest data heterogeneity (among other possible causes).
An important consideration in the design of our harmonization system was the ability to share harmonized phenotypes with the broader scientific community. This goal is challenging because the study data, and any individual-level derivations thereof, require controlled access due to human subject privacy and consent restrictions. We addressed this problem by obtaining the study data for harmonization from dbGaP, which can be accessed by the scientific community; by providing detailed documentation about the component variables and algorithms for each variable; and by returning the harmonized data to National Institutes of Health–designated repositories. These repositories track the type of consent given by each study participant for the use of their data. The harmonized data are given the consent type previously assigned to the dbGaP components used in the harmonization.
It is difficult to ensure reproducibility of results with confidential data (21). Harmonized data produced by our system are fully reproducible because of the availability of study data, provenance tracking, harmonization code, and other documentation. However, exact reproducibility can only be ensured if a user has access to the same version of the data that was used in harmonization, as study investigators can update or even remove variables from their dbGaP accessions.
A limitation of our process for phenotype harmonization is that it is very labor-intensive and does not scale readily to the thousands of phenotypes available in TOPMed and other similar programs. Selection of study variables and subsequent QC are largely manual and would be very difficult to automate. Furthermore, as others have noted previously (2, 20), the utility of results may be seriously compromised without careful attention to these steps. Because of these scalability issues, we provide the following materials to help other investigators perform their own harmonizations:
-
1.
Software code and documentation sufficient to allow others to reproduce, modify, or expand upon our harmonizations.
-
2.
Detailed examples of the types of QC performed, issues that arose, and how they were resolved (Web Appendices 5 and 7). We expect this information will prove useful to investigators working on a broad range of phenotypes and may also be helpful to funding agencies regarding the level of resources required for useful harmonization efforts.
-
3.
Thousands of dbGaP variables tagged with 65 phenotype concepts, which can be used directly by other investigators for the largely manual and time-consuming step of identifying the study variables needed for harmonization. The tagging data also provide a gold-standard, human-curated data set for developing automated approaches to identifying variables that fit a specific phenotype concept.
Figure 4 summarizes some of the challenges and lessons learned in developing the DCC’s harmonization system. These findings suggest a few key ways to reduce the effort required for future phenotype harmonizations. Studies sharing phenotype data with the community should structure their data tables so that each phenotype variable (i.e., table column) contains data corresponding to only 1 phenotype concept, and they should provide controlled vocabulary terms from standard ontologies for each phenotype variable. Researchers harmonizing phenotypes should provide full documentation, including code, procedures, and input data provenance, so that others can reproduce and extend their work. Sharing this documentation can benefit the scientific community without sharing the actual harmonized phenotype values (which often requires complicated data-sharing arrangements). Finally, investigators in studies currently collecting data should consider using standardized protocols, such as those developed by the PhenX consortium (1), to reduce the need for retrospective harmonization.
Figure 4.

Lessons learned from phenotype harmonization in the National Heart, Lung, and Blood Institute Trans-Omics for Precision Medicine (TOPMed) program.
Supplementary Material
ACKNOWLEDGMENTS
Author affiliations: Department of Biostatistics, School of Public Health, University of Washington, Seattle, Washington, United States (Adrienne M. Stilp, Leslie S. Emery, Jai G. Broome, Erin J. Buth, Alyna T. Khan, Cecelia A. Laurie, Fei Fei Wang, Quenna Wong, William Craig Johnson, Jan Graffelman, Wan-Ling Hsu, Cathy C. Laurie); Department of Medicine, School of Medicine, University of Alabama at Birmingham, Birmingham, Alabama, United States (Dongquan Chen); Department of Medicine, School of Medicine, Boston University, Boston, Massachusetts, United States (Ramachandran S. Vasan); Department of Neurology, School of Medicine, Boston University, Boston, Massachusetts, United States (Nancy L. Heard-Costa); Division of Public Health Sciences, Fred Hutchinson Cancer Research Center, Seattle, Washington, United States (Chancellor R. Hohensee, Jingmin Liu, Charles Kooperberg); Division of Preventive Medicine, School of Medicine, University of Alabama at Birmingham, Birmingham, Alabama, United States (Lucia D. Juarez); Department of Genetics, School of Medicine, University of North Carolina at Chapel Hill, Chapel Hill, North Carolina, United States (Laura M. Raffield); Cardiovascular Health Research Unit, Department of Medicine, School of Medicine, University of Washington, Seattle, Washington, United States (Kerri L. Wiggins, Joshua C. Bis, Bruce M. Psaty); Human Genetics Center, Department of Epidemiology, School of Public Health, University of Texas Health Science Center at Houston, Houston, Texas, United States (Paul S. de Vries, Myriam Fornage, Alanna C. Morrison); Department of Epidemiology, School of Public Health and Tropical Medicine, Tulane University, New Orleans, Louisiana, United States (Tanika N. Kelly); Cardiovascular Research Center, Massachusetts General Hospital, Boston, Massachusetts, United States (Pradeep Natarajan); Center for Genomic Medicine, Massachusetts General Hospital, Boston, Massachusetts, United States (Pradeep Natarajan); Department of Medicine, Harvard Medical School, Harvard University, Boston, Massachusetts, United States (Pradeep Natarajan); Program in Medical and Population Genetics, Broad Institute of MIT and Harvard, Cambridge, Massachusetts, United States (Pradeep Natarajan); Department of Biostatistics, School of Public Health, Boston University, Boston, Massachusetts, United States (Gina M. Peloso, L. Adrienne Cupples); Department of Epidemiology, School of Public Health, University of Michigan, Ann Arbor, Michigan, United States (Patricia A. Peyser, Lawrence F. Bielak, Sharon L. R. Kardia, Jennifer A. Smith); Department of Epidemiology, School of Public Health, University of Washington, Seattle, Washington, United States (Alex P. Reiner, Bruce M. Psaty, Susan R. Heckbert); Fred Hutchinson Cancer Research Center, Seattle, Washington, United States (Alex P. Reiner); Dean’s Office, University of Kentucky, Lexington, Kentucky, United States (Donna K. Arnett); Department of Epidemiology, School of Public Health, University of Alabama at Birmingham, Birmingham, Alabama, United States (Stella Aslibekyan); Colorado Center for Personalized Medicine, School of Medicine, University of Colorado, Aurora, Colorado, United States (Kathleen C. Barnes); Division of Sleep and Circadian Disorders, Department of Medicine, Brigham and Women’s Hospital, Boston, Massachusetts, United States (Brian E. Cade, Jiwon Lee); Division of Sleep Medicine, Harvard Medical School, Harvard University, Boston, Massachusetts, United States (Brian E. Cade); Epidemiology Branch, Division of Cardiovascular Sciences, National Heart, Lung, and Blood Institute, National Institutes of Health, Bethesda, Maryland, United States (Cashell E. Jaquish); Framingham Heart Study, Framingham, Massachusetts, United States (Catherine M. D’Augustine, Karen M. Mutalik, Nancy L. Heard-Costa, Ming-Huei Chen, L. Adrienne Cupples, Andrew D. Johnson, Ramachandran S. Vasan); Population Sciences Branch, Division of Intramural Research, National Heart, Lung, and Blood Institute, National Institutes of Health, Bethesda, Maryland, United States (Ming-Huei Chen, Andrew D. Johnson); Department of Medicine, University of Mississippi Medical Center, Jackson, Mississippi, United States (Adolfo Correa); Department of Pediatrics, University of Mississippi Medical Center, Jackson, Mississippi, United States (Adolfo Correa); Department of Population Health Science, John D. Bower School of Population Health, University of Mississippi Medical Center, Jackson, Mississippi, United States (Adolfo Correa); Division of Biomedical Statistics and Informatics, Mayo Clinic, Rochester, Minnesota, United States (Mariza de Andrade); Cardiovascular Disease Initiative, Broad Institute of MIT and Harvard, Cambridge, Massachusetts, United States (Patrick T. Ellinor); Brown Foundation Institute of Molecular Medicine, McGovern Medical School, University of Texas Health Science Center at Houston, Houston, Texas, United States (Myriam Fornage); Department of Epidemiology, Gillings School of Global Public Health, University of North Carolina at Chapel Hill, Chapel Hill, North Carolina, United States (Nora Franceschini, Kari E. North); Airway Biology and Disease Branch, Division of Lung Diseases, National Heart, Lung, and Blood Institute, National Institutes of Health, Bethesda, Maryland, United States (Weiniu Gan); Division of Cardiovascular Medicine, Department of Internal Medicine, Michigan Medicine, University of Michigan, Ann Arbor, Michigan, United States (Santhi K. Ganesh); Department of Human Genetics, Michigan Medicine, University of Michigan, Ann Arbor, Michigan, United States (Santhi K. Ganesh); Department of Statistics and Operations Research, Technical University of Catalonia, Barcelona, Spain (Jan Graffelman); Department of Epidemiology, Human Genetics and Environmental Sciences, School of Public Health, University of Texas Health Science Center at Houston, Houston, Texas, United States (Megan L. Grove); Department of Pediatrics, Los Angeles Biomedical Research Institute at Harbor-UCLA Medical Center, Torrance, California, United States (Xiuqing Guo, Jerome I. Rotter, Kent D. Taylor); Institute for Translational Genomics and Population Sciences, Department of Pediatrics, Lundquist Institute for Biomedical Innovation at Harbor-UCLA Medical Center, Torrance, California, United States (Xiuqing Guo, Jerome I. Rotter, Kent D. Taylor); Department of Chronic Disease Epidemiology, Yale School of Public Health, Yale University, New Haven, Connecticut, United States (Nicola L. Hawley); Division of Endocrinology, Diabetes and Metabolism, Department of Internal Medicine, The Ohio State University, Columbus, Ohio, United States (Rebecca D. Jackson); Department of Epidemiology, Vitalant Research Institute, San Francisco, California, United States (Shannon Kelly); UCSF Benioff Children’s Hospital Oakland, Oakland, California, United States (Shannon Kelly); GeneSTAR Research Center, Division of General Internal Medicine, School of Medicine, Johns Hopkins University, Baltimore, Maryland, United States (Rasika A. Mathias, Lisa R. Yanek); International Health Institute, School of Public Health, Brown University, Providence, Rhode Island, United States (Stephen T. McGarvey); Department of Epidemiology, School of Public Health, Brown University, Providence, Rhode Island, United States (Stephen T. McGarvey); Division of Endocrinology, Diabetes and Nutrition and Program for Personalized and Genomic Medicine, Department of Medicine, School of Medicine, University of Maryland, Baltimore, Maryland, United States (Braxton D. Mitchell, May E. Montasser); Geriatrics Research and Education Clinical Center, Baltimore VA Medical Center, Baltimore, Maryland, United States (Braxton D. Mitchell); Department of Medicine, School of Medicine, University of Pittsburgh, Pittsburgh, Pennsylvania, United States (Seyed Mehdi Nouraie); Department of Medicine, Vagelos College of Physicians and Surgeons, Columbia University, New York, New York, United States (Elizabeth C. Oelsner); Department of Laboratory Medicine and Pathology, Medical School, University of Minnesota, Minneapolis, Minnesota, United States (Nathan Pankratz); Center for Public Health Genomics, School of Medicine, University of Virginia, Charlottesville, Virginia, United States (Stephen S. Rich); Department of Public Health Sciences, School of Medicine, University of Virginia, Charlottesville, Virginia, United States (Stephen S. Rich); Survey Research Center, Institute for Social Research, University of Michigan, Ann Arbor, Michigan, United States (Jennifer A. Smith); Department of Epidemiology, School of Public Health, Boston University, Boston, Massachusetts, United States (Ramachandran S. Vasan); Department of Human Genetics, Graduate School of Public Health, University of Pittsburgh, Pittsburgh, Pennsylvania, United States (Daniel E. Weeks); Department of Biostatistics, Graduate School of Public Health, University of Pittsburgh, Pittsburgh, Pennsylvania, United States (Daniel E. Weeks); Channing Division of Network Medicine, Department of Medicine, Brigham and Women’s Hospital, Boston, Massachusetts, United States (Scott T. Weiss); Department of Medicine, Harvard Medical School, Harvard University, Boston, Massachusetts, United States (Scott T. Weiss); Research Informatics Services, National Jewish Health, Denver, Colorado, United States (Carla G. Wilson); Department of Health Services, School of Public Health, University of Washington, Seattle, Washington, United States (Bruce M. Psaty); and Kaiser Permanente Washington Health Research Institute, Seattle, Washington, United States (Bruce M. Psaty, Susan R. Heckbert).
A.M.S. and L.S.E. contributed equally to this work.
This work was funded by numerous grants and contracts from the National Institutes of Health (NIH), US Department of Health and Human Services. The Trans-Omics in Precision Medicine (TOPMed) program was supported by the National Heart, Lung, and Blood Institute (NHLBI), NIH, with core services provided by the TOPMed Informatics Research Center (award 3R01HL-117626-02S1; contract HHSN268201800002I) and the TOPMed Data Coordinating Center (awards R01HL-120393 and U01HL-120393; contract HHSN268201800001I). Whole-genome sequencing for TOPMed was supported by the NHLBI. Phenotype harmonization activities were funded in part by the NHLBI (contract HHSN26820180001I). Additional harmonization funding was provided by the NHLBI (grant 5 U01 HL 120393-04). Phenotype variable tagging was funded by the NHLBI (grant supplement 3 U01 HL 120393-04S2) and the NIH Office of the Director as part of the NIH Data Commons Pilot Phase Consortium.
Additional financial support was provided to some authors: N.F. was additionally supported by NIH grants R01-MD012765, R01-DK117445, and R21-HL140385. P.T.E. was additionally supported by NIH grants R01HL092577, R01HL128914, and K24HL105780. A.P.R. was additionally supported by NIH grant R01HL130733. P.S.d.V. was additionally supported by American Heart Association grant 18CDA34110116. E.C.O. was additionally supported by the NHLBI Pooled Cohorts Study and NIH grants R21-HL129924 and K23-HL130627. S.K.G. was additionally supported by NIH grants R01HL122684 and R01HL139672. B.E.C. was additionally supported by NIH grant K01-HL135405. P.N. and G.M.P. were additionally supported by NIH grant R01HL142711. R.S.V. was supported in part by the Evans Medical Foundation and the Jay and Louis Coffman Endowment from the Department of Medicine, Boston University School of Medicine.
Financial support for individual TOPMed studies was provided by the following—Genetics of Cardiometabolic Health in the Amish: The TOPMed component of the Amish Research Program was supported by NIH grants R01 HL121007, U01 HL072515, and R01 AG18728. Atherosclerosis Risk in Communities (ARIC) Study: The ARIC Study has been funded in whole or in part by the NHLBI (contracts HHSN268201700001I, HHSN268201700002I, HHSN268201700003I, HHSN268201700004I, and HHSN268201700005I). Coronary Artery Risk Development in Young Adults (CARDIA) Study: The CARDIA Study is conducted and supported by the NHLBI in collaboration with the University of Alabama at Birmingham (awards HHSN268201800005I and HHSN268201800007I), Northwestern University (award HHSN268201800003I), the University of Minnesota (award HHSN268201800006I), and the Kaiser Foundation Research Institute (award HHSN268201800004I). CARDIA is also partially supported by the Intramural Research Program of the National Institute on Aging and an Intra-Agency Agreement (agreement AG0005) between the National Institute on Aging and the NHLBI. Cleveland Family Study: The Cleveland Family Study has been supported in part by the NIH (grants R01-HL046380, KL2-RR024990, R35-HL135818, and R01-HL113338). Cardiovascular Health Study (CHS): The CHS was supported by contracts HHSN268201200036C, HHSN268200800007C, HHSN268201800001C, N01HC55222, N01HC85079, N01HC85080, N01HC85081, N01HC85082, N01HC85083, and N01HC85086 and grants U01HL080295 and U01HL130114 from the NHLBI, with additional contributions from the National Institute of Neurological Disorders and Stroke. Additional support was provided by the National Institute on Aging (award R01AG023629). Genetic Epidemiology of COPD Study (COPDGene): The COPDGene project was supported by awards U01 HL089897 and U01 HL089856 from the NHLBI. The COPDGene project is also supported by the COPD Foundation through contributions made to an industry advisory board comprised of AstraZeneca AB (Cambridge, United Kingdom), Boehringer Ingelheim (Ingelheim am Rhein, Germany), GlaxoSmithKline plc (London, United Kingdom), Novartis International AG (Basel, Switzerland), Pfizer, Inc. (New York, New York), Siemens Healthcare GmbH (Erlangen, Germany), and Sunovion Pharmaceuticals Inc. (Marlborough, Massachusetts). Genetic Epidemiology of Asthma in Costa Rica (CRA) Study: The CRA Study was funded by the NHLBI (grants R37 HL066289-14 and P01 HL132825). Framingham Heart Study: The Framingham Heart Study was supported by contracts NO1-HC-25195, HHSN268201500001I, and 75N92019D00031 from the NHLBI and by grant supplement R01 HL092577-06S1 for this research. Genetic Epidemiology Network of Arteriopathy (GENOA): Support for GENOA was provided by the NHLBI (awards HL054457, HL054464, HL054481, HL119443, HL087660, and HL085571). Genetics of Lipid Lowering Drugs and Diet Network (GOLDN): GOLDN biospecimens, baseline phenotype data, and intervention phenotype data were collected with funding from the NHLBI (grant U01 HL072524). Whole-genome sequencing in GOLDN was funded by the NHLBI (grant R01 HL104135 and grant supplement R01 HL104135-04S1). Hispanic Community Health Study/Study of Latinos (HCHS/SOL): The HCHS/SOL is a collaborative study supported by contracts between the NHLBI and the University of North Carolina (contract HHSN268201300001I/N01-HC-65233), the University of Miami (contract HHSN268201300004I/N01-HC-65234), the Albert Einstein College of Medicine (contract HHSN268201300002I/N01-HC-65235), and the University of Illinois at Chicago (contract HHSN268201300003I/N01-HC-65236 Northwestern University), and San Diego State University (contract HHSN268201300005I/N01-HC-65237). The following institutions have contributed to the HCHS/SOL through a transfer of funds to the NHLBI: the National Institute on Minority Health and Health Disparities, the National Institute on Deafness and Other Communication Disorders, the National Institute of Dental and Craniofacial Research, the National Institute of Diabetes and Digestive and Kidney Diseases, the National Institute of Neurological Disorders and Stroke, and the NIH Office of Dietary Supplements. Heart and Vascular Health Study: The Heart and Vascular Health Study was supported by the NHLBI (grants HL068986, HL085251, HL095080, and HL073410). Jackson Heart Study: The Jackson Heart Study is supported by and conducted in collaboration with Jackson State University (contract HHSN268201800013I), Tougaloo College (contract HHSN268201800014I), the Mississippi State Department of Health (contract HHSN268201800015I), and the University of Mississippi Medical Center (contracts HHSN268201800010I, HHSN268201800011I, and HHSN268201800012I) through contracts from the NHLBI and the National Institute on Minority Health and Health Disparities. Mayo Clinic Venous Thromboembolism Study: The Mayo Clinic Venous Thromboembolism Study was funded, in part, by the NHLBI (grants HL66216 and HL83141), the National Human Genome Research Institute (grants HG04735 and HG06379), and the Mayo Foundation. Multi-Ethnic Study of Atherosclerosis (MESA): Whole-genome sequencing for MESA (dbGaP accession number phs001416.v1.p1) was performed at the Broad Institute of MIT and Harvard (Cambridge, Massachusetts) (award 3U54HG003067-13S1). Centralized read mapping and genotype calling, along with variant quality metrics and filtering, were provided by the TOPMed Informatics Research Center (award 3R01HL-117626-02S1). Phenotype harmonization, data management, sample-identity quality control, and general study coordination were provided by the TOPMed Data Coordinating Center (award 3R01HL-120393-02S1). MESA and the MESA SHARe project are conducted and supported by the NHLBI in collaboration with the MESA investigators. Support for MESA is provided by NIH contracts 75N92020D00001 (NHLBI), HHSN268201500003I (NHLBI), N01-HC-95159 (NHLBI), 75N92020D00005 (NHLBI), N01-HC-95160 (NHLBI), 75N92020D00002 (NHLBI), N01-HC-95161 (NHLBI), 75N92020D00003 (NHLBI), N01-HC-95162 (NHLBI), 75N92020D00006 (NHLBI), N01-HC-95163 (NHLBI), 75N92020D00004 (NHLBI), N01-HC-95164 (NHLBI), 75N92020D00007 (NHLBI), N01-HC-95165 (NHLBI), N01-HC-95166 (NHLBI), N01-HC-95167 (NHLBI), N01-HC-95168 (NHLBI), N01-HC-95169 (NHLBI), UL1-TR-000040 (National Center for Advancing Translational Sciences (NCATS) (Clinical and Translational Science Institute (CTSI))), UL1-TR-001079 (NCATS (CTSI)), UL1-TR-001420 (NCATS (CTSI)), UL1-TR-001881 (NCATS (CTSI)), and DK063491 (National Institute of Diabetes and Digestive and Kidney Diseases). Funding for SHARe genotyping was provided by NHLBI contract N02-HL-64278. Genotyping was performed at Affymetrix, Inc. (Santa Clara, California) and the Broad Institute of MIT and Harvard using the Affymetrix Genome-Wide Human SNP Array 6.0. Samoan Adiposity Study: Data collection for the Samoan Adiposity Study was funded by NIH grant R01-HL093093. Women’s Health Initiative: The Women’s Health Initiative program is funded by the NHLBI (contracts HHSN268201600018C, HHSN268201600001C, HHSN268201600002C, HHSN268201600003C, and HHSN268201600004C).
The harmonized data presented in this paper have been submitted to the database of Genotypes and Phenotypes (dbGaP) and the NHLBI BioData Catalyst. The software code with which to reproduce the harmonized phenotypes presented in this paper from dbGaP files is available on GitHub (14). See the “Data Availability” section of the text for details.
We gratefully acknowledge the researchers and study participants who provided biological samples and data for TOPMed. We acknowledge Drs. Mike Feolo and Masato Kimura for making the harmonized phenotype data and the phenotype tagging data available in dbGaP. We also acknowledge contributors to the overall TOPMed project, who can be found on the TOPMed Data Coordinating Center website (https://www.nhlbiwgs.org/topmed-banner-authorship). The Genetics of Cardiometabolic Health in the Amish Study investigators gratefully thank the Amish community and research volunteers for their long-standing partnership, and they acknowledge the dedication of their Amish liaisons, fieldworkers, and the Amish Research Clinic staff, without whom these studies would not have been possible. The ARIC Study investigators thank the study staff and participants for their important contributions. The Framingham Heart Study investigators acknowledge the dedication of the study participants, without whom this research would not have been possible. The Jackson Heart Study investigators thank the study staff and participants. The Samoan Adiposity Study investigators thank the Samoan participants in the study and local village authorities. They acknowledge the Samoan Ministry of Health and the Samoa Bureau of Statistics for their support of this research.
A full list of principal CHS investigators and institutions can be found at CHS-NHLBI.org. A full listing of COPDGene investigators can be found at http://www.copdgene.org/directory.
The views expressed in this article are those of the authors and do not necessarily represent the views of the NHLBI, the NIH, or the US Department of Health and Human Services. The CHS content of this article is solely the responsibility of the CHS authors and does not necessarily represent the official views of the NIH. The COPDGene content of this article is solely the responsibility of the COPDGene authors and does not necessarily represent the official views of the NHLBI or the NIH.
A.M.S. receives funding from Seven Bridges Genomics Inc. (Charlestown, Massachusetts) to develop tools for the NHLBI BioData Catalyst consortium. B.M.P. reports serving on the Steering Committee of the Yale Open Data Access Project, which is funded by Johnson & Johnson (New Brunswick, New Jersey). S.A. reports being employed by and holding equity in 23andMe, Inc. (Sunnyvale, California). P.N. reports conflicts of interest unrelated to this work: grant support from AMGen, Inc. (Thousand Oaks, California), Apple Inc. (Cupertino, California), and Boston Scientific Corporation (Marlborough, Massachusetts) and consulting fees from Apple. M.E.M. receives funding from Regeneron Pharmaceuticals Inc. (Tarrytown, New York) unrelated to this work. The other authors have no potential conflicts of interest to declare.
REFERENCES
- 1.Hamilton CM, Strader LC, Pratt JG, et al. The PhenX Toolkit: get the most from your measures. Am J Epidemiol. 2011;174(3):253–260. [DOI] [PMC free article] [PubMed] [Google Scholar]
- 2.Fortier I, Raina P, van den Heuvel E, et al. Maelstrom Research guidelines for rigorous retrospective data harmonization. Int J Epidemiol. 2017;46(1):103–105. [DOI] [PMC free article] [PubMed] [Google Scholar]
- 3.Taliun D, Harris DN, Kessle MD, et al. Sequencing of 53,831 diverse genomes from the NHLBI TOPMed program. Nature. 2021;590(7845):290–299. [DOI] [PMC free article] [PubMed] [Google Scholar]
- 4.Bodenreider O. The Unified Medical Language System (UMLS): integrating biomedical terminology. Nucleic Acids Res. 2004;32(90001):267D–2270D. [DOI] [PMC free article] [PubMed] [Google Scholar]
- 5.R Core Team . R: A Language and Environment for Statistical Computing. Vienna, Austria: R Foundation for Statistical Computing; 2019. https://www.R-project.org/. Accessed June 23, 2021. [Google Scholar]
- 6.Oelsner EC, Balte PP, Cassano PA, et al. Harmonization of respiratory data from 9 US population-based cohorts: the NHLBI Pooled Cohorts Study. Am J Epidemiol. 2018;187(11):2265–2278. [DOI] [PMC free article] [PubMed] [Google Scholar]
- 7.Mailman MD, Feolo M, Jin Y, et al. The NCBI dbGaP database of genotypes and phenotypes. Nat Genet. 2007;39(10):1181–1186. [DOI] [PMC free article] [PubMed] [Google Scholar]
- 8.Friedewald WT, Levy RI, Fredrickson DS. Estimation of the concentration of low-density lipoprotein cholesterol in plasma, without use of the preparative ultracentrifuge. Clin Chem. 1972;18(6):499–502. [PubMed] [Google Scholar]
- 9.Regan EA, Hokanson JE, Murphy JR, et al. Genetic Epidemiology of COPD (COPDGene) study design. COPD. 2010;7(1):32–43. [DOI] [PMC free article] [PubMed] [Google Scholar]
- 10.Nishimura KK, Galanter JM, Roth LA, et al. Early-life air pollution and asthma risk in minority children. The GALA II and SAGE II studies. Am J Respir Crit Care Med. 2013;188(3):309–318. [DOI] [PMC free article] [PubMed] [Google Scholar]
- 11.Wong MY, Day NE, Luan JA, et al. The detection of gene-environment interaction for continuous traits: should we deal with measurement error by bigger studies or better measurement? Int J Epidemiol. 2003;32(1):51–57. [DOI] [PubMed] [Google Scholar]
- 12.Bennett SN, Caporaso N, Fitzpatrick AL, et al. Phenotype harmonization and cross-study collaboration in GWAS consortia: the GENEVA experience. Genet Epidemiol. 2011;35(3):159–173. [DOI] [PMC free article] [PubMed] [Google Scholar]
- 13.Gordon D, Finch SJ. Factors affecting statistical power in the detection of genetic association. J Clin Invest. 2005;115(6):1408–1418. [DOI] [PMC free article] [PubMed] [Google Scholar]
- 14.TOPMed Data Coordination Center . UW-GAC/topmed-dcc-harmonized-phenotypes. https://github.com/UW-GAC/topmed-dcc-harmonized-phenotypes. Published June 11, 2020. Accessed March 31, 2021.
- 15.TOPMed Data Coordinating Center . NHLBI Trans-Omics for Precision Medicine. DCC-harmonized phenotypes for the scientific community. https://www.nhlbiwgs.org/dcc-pheno. Published February 20, 2020. Updated February 21, 2020. Accessed March 31, 2021.
- 16.Hu Y, Raffield LM, Polfus LM, et al. A common TCN1 loss-of-function variant is associated with lower vitamin B12 concentration in African Americans. Blood. 2018;131(25):2859–2863. [DOI] [PMC free article] [PubMed] [Google Scholar]
- 17.Kowalski MH, Qian H, Hou Z, et al. Use of >100,000 NHLBI Trans-Omics for Precision Medicine (TOPMed) consortium whole genome sequences improves imputation quality and detection of rare variant associations in admixed African and Hispanic/Latino populations. PLoS Genet. 2019;15(12):e1008500. [DOI] [PMC free article] [PubMed] [Google Scholar]
- 18.Sarnowski C, Leong A, Raffield LM, et al. Impact of rare and common genetic variants on diabetes diagnosis by hemoglobin A1c in multi-ancestry cohorts: the Trans-Omics for Precision Medicine program. Am J Hum Genet. 2019;105(4):706–718. [DOI] [PMC free article] [PubMed] [Google Scholar]
- 19.Sofer T, Zheng X, Gogarten SM, et al. A fully adjusted two-stage procedure for rank-normalization in genetic association studies. Genet Epidemiol. 2019;43(3):263–275. [DOI] [PMC free article] [PubMed] [Google Scholar]
- 20.Rolland B, Reid S, Stelling D, et al. Toward rigorous data harmonization in cancer epidemiology research: one approach. Am J Epidemiol. 2015;182(12):1033–1038. [DOI] [PMC free article] [PubMed] [Google Scholar]
- 21.Pérignon C, Gadouche K, Hurlin C, et al. Certify reproducibility with confidential data. Science. 2019;365(6449):127–128. [DOI] [PubMed] [Google Scholar]
Associated Data
This section collects any data citations, data availability statements, or supplementary materials included in this article.
Supplementary Materials
Data Availability Statement
The study data used as input for harmonization are available to the scientific community from dbGaP via controlled access. In a single application, a user can apply for access to all dbGaP study accessions provided in the documentation. In addition, the harmonized data in Table 2 have been submitted to dbGaP and to the National Heart, Lung, and Blood Institute’s new data repository, BioData Catalyst (https://biodatacatalyst.nhlbi.nih.gov). In both cases, access will be through application to dbGaP.
We worked with dbGaP scientists to make the tagging results available in dbGaP searches and visible on the dbGaP variable pages. Detailed information on how to access and use this information is available on the TOPMed website (15).