

Abstract
Previously we showed that dimethyl fumarate (DMF) dose-dependently increased mitochondrial gene expression and function in cells and might be considered as a therapeutic for inherited mitochondrial disease, including Friedreich’s ataxia (FA). Here we tested DMF’s ability to dose-dependently increase mitochondrial function, mitochondrial gene expression (frataxin and cytochrome oxidase protein) and mitochondrial copy number in C57BL6 wild-type mice and the FXNKD mouse model of FA. We first dosed DMF at 0–320 mg/kg in C57BL6 mice and observed significant toxicity above 160 mg/kg orally, defining the maximum tolerated dose. Oral dosing of C57BL6 mice in the range 0–160 mg/kg identified a maximum increase in aconitase activity and mitochondrial gene expression in brain and quadriceps at 110 mg/kg DMF, thus defining the maximum effective dose (MED). The MED of DMF in mice overlaps the currently approved human-equivalent doses of DMF prescribed for multiple sclerosis (480 mg/day) and psoriasis (720 mg/day). In the FXNKD mouse model of FA, which has a doxycycline-induced deficit of frataxin protein, we observed significant decreases of multiple mitochondrial parameters, including deficits in brain mitochondrial Complex 2, Complex 4 and aconitase activity, supporting the idea that frataxin deficiency reduces mitochondrial gene expression, mitochondrial functions and biogenesis. About 110 mg/kg of oral DMF rescued these enzyme activities in brain and rescued frataxin and cytochrome oxidase expression in brain, cerebellum and quadriceps muscle of the FXNKD mouse model. Taken together, these results support the idea of using fumarate-based molecules to treat FA or other mitochondrial diseases.
Introduction
Friedreich’s ataxia (FA) is a lethal inherited neurodegenerative disorder which affect every 1 in 50 000 in the USA and currently has no approved therapy (1–3). FA is caused by inheritance GAA(n) nucleotide expansions in the intron of frataxin gene, causing a silencing and thus reduced expression of the mitochondrial frataxin protein (4). Thus, all comorbid consequences of Friedreich’s are the result of deficient frataxin expression. Common symptoms of FA include ataxia with areflexia (5–7), cardiomyopathy (8–10), impaired hearing and verbal communication (11–13), diabetes (14,15) and scoliosis (16). Frataxin is a 23 kDa mitochondrial protein localized at the inner mitochondrial membrane and functionally rescues the sulfur transfer process of iron–sulfur cluster biogenesis (17). Although the complete pathophysiological cascade downstream of frataxin deficiency is not completely elucidated, recent publications suggest that one consequence of frataxin deficiency is a defect in mitochondrial biogenesis (18,19), and this impairment of mitochondrial biogenesis could lead to the severe signs of Friedreich’s described above.
Because all consequences of FA are ultimately the result of deficient frataxin expression, increasing frataxin expression by small molecules or gene therapy or other methods is a major therapeutic strategy for treating the disease. In addition, we have previously shown that decreased frataxin expression impairs mitochondrial biogenesis in cells, mice and FA patient whole blood (18). Therefore, we hypothesize that the pathophysiology of FA patients is the outcome of impair mitochondrial biogenesis and activity due to frataxin deficiency. Thus, finding a drug-like molecule that can increase frataxin should result in increasing mitochondrial function and activity and could have a therapeutic impact.
We previously screened 1600 FDA-approved drug library in a search for potential mitochondrial protector and FA therapeutics, and have identified dimethyl fumarate (DMF), a fumaric acid derivative approved for treating multiple sclerosis and psoriasis, as the most promising drug since DMF dose-dependently protected mitochondria in a cell-based assay (20,21). In addition, DMF dose-dependently increase in mitochondrial biogenesis and frataxin expression in cells (22,23). MMF, DMF’s major metabolite, is thought to exert its mitochondria-activating effect through a ‘dual agonism’ of Nrf2 and Hca2 receptor (24). In this study, we dosed DMF orally in both C57BL6 wildtype mice and a doxycycline-induced FXNKD mouse to identify the optimal oral dosage of DMF and to verify the therapeutic potential of DMF at the optimal dosage in mice. We believe that this study serves as an important starting point for developing DMF into first potential FA therapeutic in human.
Results
I.P. dosage of DMF dose-dependently increases frataxin and mitochondrial protein expression in normal C57Bl6 mice
We first performed an intraperitoneal injection (I.P.) of DMF on normal C57Bl6 mice to investigate the pharmacodynamic effect of DMF and to identify the optimal oral dosage of DMF in mouse. Our first I.P. dosing was done 0–320 mg/kg DMF, and mortality was observed at 160 and 320 mg/kg (Fig. 1A). In addition, we observed an abnormality in the livers from all the mice dosed with 320 mg/kg DMF, e.g. the observable white spots on the liver (Fig. 1A), whereas neither occurred in mice dosed with 80 mg/kg of DMF (Fig. 1A and B). Since toxicity is observed at DMF dosage above 160 mg/kg, we repeated I.P. dosing of DMF on C57Bl6 mice with a lower dosage range up to 160 mg/kg. Mouse liver lysate was collected and assayed for the expression of both frataxin and cytochrome oxidase 4 (Cox4). The measurement demonstrated a significant and approximately 3-fold increase in frataxin and 2.5-fold increase of Cox4, respectively at 80 mg/kg (Fig. 1C and D). Frataxin expression continue to increase (~5-fold increase) with 160 mg/kg DMF dosage, however expression was variable among biological replicates as indicated by the standard error of mean as compared with those at 80 mg/kg (Fig. 1C). Also, the increased Cox4 expression was diminished at 160 mg/kg DMF dosage (Fig. 1C and D). Combined with the earlier observable liver toxicity and lethality, we concluded that DMF dosed at 160 mg/kg or high is toxic to mice and the optimum effective dose for increasing frataxin expression is between 80 and 160 mg/kg.
Figure 1 .

Identifying optimal IP dosage of DMF in mice. C57Bl6 mice were dosed with ascending dosage of DMF via I.P. for 2 weeks, and liver tissues were collected and analyzed as described above. Percentage of animal death (A) and percentage of mice with observable liver abnormality (B) were recorded on the day of scarification. For (A), bars are showing the percent deaths of animals observed throughout the course of dosing. For (B), bars are showing the percent of animals with observable liver abnormality on the day of scarification, N for each group: Vehicle = 6; 80 mg/kg = 7; 160 mg/kg = 8; 320 mg/kg = 8. I.P. dosing of DMF was repeated on C57Bl6 mice at a lower dosage to avoid toxicity as described. Liver were collected after dosing and tissue lysate were prepared as described in method. Lysate were used for western blot analysis and the fold change response of frataxin (C), cytochrome c oxidase 4 (D) and gel image (E) were showed. Bars are showing the average fold change normalized to vehicle, error bars are representing SEM; N for each group: Vehicle = 6; 10 mg/kg = 4; 20 mg/kg = 4; 40 mg/kg = 4; 80 mg/kg = 5; 160 mg/kg = 5; P-value were calculated using 2-tail t test, * = P < 0.05; ** = P < 0.01; *** = P < 0.001.
DMF raises mitochondrial function and protein expression in brain
Although I.P. injection of DMF on C57Bl6 mice created a promising result, oral administration is still the most relevant and common route of drug administration in humans (25). As a result, we repeated the dosing on C57Bl6 mice by feeding the mice peanut butter mixed with DMF at indicated dose. We first investigated the DMF effects in the mice’s brains after DMF dosing as brain is target tissue for this neurodegenerative disease like FA (26). Aconitase activity is of special interest downstream of frataxin expression for multiple reasons which will be discussed later. Brains from the C57BL6 mice dosed with DMF were used to perform a quantitative measurement on aconitase activity, and the results indicated a significant (P < 0.05, 1-tailed t-test) and mean 1.12-fold increase in aconitase activity within the brain from mice dosed with 80 mg/kg DMF comparing to vehicle (Fig. 2A). By contrast, there is no increase on mitochondrial copy number in C57Bl6 mice brain after DMF dosage, suggesting that the increase in aconitase activity was not due to the increase in mitochondrial biogenesis (Fig. 2B). To examine whether mitochondrial protein expression, including frataxin, increased after DMF dosing, western blot analysis was used to determine the expression of frataxin and cytochrome c oxidase-4 (Cox4) (Fig. 2C–E). Two weeks of oral DMF dose-dependently and significantly increased both frataxin and Cox4 expression in the brain of C57Bl6 mice, with frataxin increased by 1.8-fold (P < 0.001) and Cox4 increased by 4-fold (P < 0.001) at 80 mg/kg DMF (Fig. 2C and D). Overall, oral-dosed DMF raised protein expression of mitochondrial frataxin and Cox4, as well as mitochondrial aconitase activity in brain, a target tissue of Friedreich’s pathophysiology. As we did not observe an increased mitochondrial copy number in these samples, the increases in mitochondrial function and gene expression are better explained by a hypothesis of ‘mitochondrial activation’ rather than increased mitochondrial copy number.
Figure 2 .

Orally dosed DMF dose-dependently improved mitochondrial protein expression and mitochondrial activity in brains from C57Bl6 mice. C57Bl6 mice were dosed with ascending dosage of DMF orally by mixing DMF powder with peanut butter for 2 weeks as described in method. Whole brain was isolated from mice and tissue lysate were prepared for experiments as described above. Quantitative measurement on aconitase activity in mice brain was showed in (A). Bars are showing the average fold change of aconitase activity normalized to vehicle, error bars are representing SEM. qPCR analysis of mitochondrial DNA copy number over nuclear DNA copy number (mito8.9–9.1/actin) in mice brain was showed in (B). Bars are showing the average fold change of mitoDNA/nuclearDNA normalized to vehicle, error bars are representing SEM. For (A) and (B), N = 6 for each group. Western blot analysis was done on the tissue lysate, and fold-change response of frataxin expression (C), cytochrome c oxidase 4 (D) and western gel image (E) were showed. For (C) and (D), bars are showing the average fold change, error bars are representing SEM, N = 6 for each group, P-value were calculated using 2-tail t test, * = P < 0.05; ** = P < 0.01; *** = P < 0.001.
Oral DMF raises mitochondrial function and protein expression in quadricep muscles
Because muscle weakness is important in FA, we investigated DMF’s impact on quadricep muscles mitochondrial function and gene expression (27,28). Two weeks oral DMF orally raised quadriceps aconitase activity significantly with a mean 216% increase (P < 0.01) at 80 mg/kg (Fig. 3A). Similarly to the brain result we did not observe an increase in mitochondrial copy number (Fig. 3B). Two weeks of DMF dose-dependently appeared to increase mitochondrial frataxin and Cox4, by a mean ~1.65-fold increase in frataxin and ~1.15-fold increase in Cox4 at 80 mg/kg, but these were not statistically significant (Fig. 3C and D). Expression of both proteins appeared to increase at 160 mg/kg, but the P-values were trending (P < 0.06) and not strictly significant at the 1/20 cutoff (Fig. 3C and D). We also performed an additional oral dosing on C57Bl6 mice at 110 mg/kg, a dosage which we hypothesized to be the most effective and safe DMF dosage on mice, and lysate of quadricep muscles was used to determine the change of expression for frataxin and mitochondrial protein cytochrome C (CytoC) using quantitative Jess Western analysis. Jess Western showed a significant 2.8-fold increase in frataxin (P < 0.05) (Fig. 3F, black bar) and a 3.3-fold increase in CytoC expression (P < 0.01) (Fig. 3F, gray bar). Thus, DMF dose-dependently and significantly increased mitochondrial function and protein expression in mouse quadricep muscles. As in brain, these quadriceps increase appear to result from ‘mitochondrial activation’, i.e. increased mitochondrial gene expression and function with the same number of mitochondrial genomes.
Figure 3 .

Orally dosed DMF dose-dependently improved mitochondrial protein expression and mitochondrial activity in quadriceps muscle from C57Bl6 mice. C57Bl6 mice were dosed with ascending dosage of DMF orally by mixing DMF powder with peanut butter for 2 weeks as described in method. Left and right quadriceps muscle was isolated from mice and tissue lysate were prepared for experiments as described above. Quantitative measurement on aconitase activity in mice quadricep muscle was showed in (A). Bars are showing the average fold change of aconitase activity normalized to vehicle, error bars are representing SEM. qPCR analysis of mitochondrial DNA copy number over nuclear DNA copy number (mito8.9–9.1/actin) in mice quadricep muscle was showed in (B). Bars are showing the average fold change of mitoDNA/nuclearDNA normalized to vehicle, error bars are representing SEM. Western blot analysis was done on the tissue lysate, and fold-change response of frataxin expression (C), cytochrome c oxidase 4 (D) and Western gel image (E) were showed. For (A) to (D), bars are showing the average fold change normalized to vehicle, error bars are representing SEM, N = 6 for each group, P-value were calculated using 2-tail t test, * = P < 0.05; ** = P < 0.01; *** = P < 0.001. Additional DMF dosing at 110 mg/kg experiment orally mixed with peanut butter was done. Jess Western analysis was done on quadricep muscle lysate, and fold-change response of frataxin (white bar) and cytochrome c oxidase (gray bar) (F) and gel image (G) were showed, bars are showing the average fold change normalized to vehicle, error bars are representing SEM. N = 6 for each group, P-value were calculated using 2-tail t test, * = P < 0.05; ** = P < 0.01; *** = P < 0.001.
FXNKD mice have decreased mitochondrial protein expression and functions, rescued by oral DMF
DMF at its apparent optimal dose of 110 mg/kg was dosed 3 weeks in the FXNKD mice, a recently developed ‘more physiological’ model of Friedreich’s (29). After dosing with doxycycline to deplete them of frataxin, mice were sacrificed, and brains extracted to analyze mitochondrial function. Doxycycline-exposed FXNKD mice exhibited significant deficits in mitochondrial Complex II (P < 0.05) and Complex IV activity (P < 0.05) when compared either to FXNKD without doxycycline treatment (Fig. 4A and B). About 110 mg/kg of DMF dosing to these dox-treated FXNKD mice significantly raised mitochondrial Complex II activity by mean 460% (P < 0.0001) and raised Complex IV activity 60% (P < 0.00001) compared with DMF-untreated FXNKDs after doxycycline treatment (Fig. 4A and B).
Figure 4 .

Inducible FA mouse demonstrated a decrease in mitochondrial activity, which was rescued by orally dosage of DMF. Inducible FXNKD mice were provided by Dr Vijayendran Chandran and doxycycline +/− DMF mixed with peanut was provided to animals as described above. Quantitative measurement on brain’s mitochondrial Complex II (A) and Complex IV (B) activity in FXNKD vehicle (Black bar), FXNKD with doxycycline treatment (Light gray bar), and FXNKD with doxycycline and DMF treatment (Dark gray bar) were showed. Bars are showing the average fold change of Complex II or IV activity in FXNKD mice’s brain normalized to vehicle, error bars are representing SEM. Quantitative measurement on aconitase activity in FXNKD mice brain was showed in (C). Bars are showing the average fold change of aconitase activity normalized to vehicle, error bars are representing SEM. qPCR analysis of mitochondrial DNA copy number over nuclear DNA copy number (mt-ND1/actin) in FXNKD mice brain was showed in (D). Bars are showing the average fold change of mitoDNA/nuclearDNA of three individual qPCR experiment replicates normalized to vehicle, error bars are representing SEM. N = 6 for each group, P-value were calculated using 2-tail t test, * = P < 0.05; ** = P < 0.01; *** = P < 0.001.
FXNKD mice dosed with doxycycline to deplete frataxin an apparent mean ~15% decrease in mitochondrial aconitase activity, but not statistically significant. Additional administration of 110 mg/kg DMF significantly increased the brain mitochondrial aconitase by mean 15% (P < 0.001) (Fig. 4C). In contrast to results obtained from C57BL6 mice, mitochondrial copy number appeared to decline in the doxycycline-treated FXNKD brains, but not statistically significant (Fig. 4D). DMF administration significantly raised mitochondrial copy number by a mean 27% (P < 0.01) comparing with DMF-untreated FXNKDs after doxycycline treatment (Fig. 4D). Thus, while DMF activated mitochondrial function and gene expression but not copy number in the healthy C57BL6 mice, DMF did increase the activities of mitochondrial Complexes 2, 4 and aconitase as well as mitochondrial copy number in the FXNKD mice.
Jess Western analysis was performed to quantify mitochondrial protein expression in the brain, cerebellum and quadriceps muscles collected from FXNKD mice. In the doxycycline-dosed and frataxin depleted mice, frataxin and CytoC expression were significantly decreased in brain (P < 0.01, P < 0.0001), cerebellum (P < 0.00001, P < 0.00001) and quadricep muscle (N.S., P < 0.01) (Fig. 5A–C). These deficits in mitochondrial protein expression were significantly rescued by 110 mg/kg of DMF in brain and cerebellum (P < 0.05), and also in quadricep muscle (P = 0.16, P = 0.09) (Fig. 5A and B). Thus, frataxin depletion by doxycycline depleted mitochondrial protein expression in brain, cerebellum and quadriceps, and significantly decreased aconitase activity in brain, and 110 mg/kg DMF rescued these.
Figure 5 .
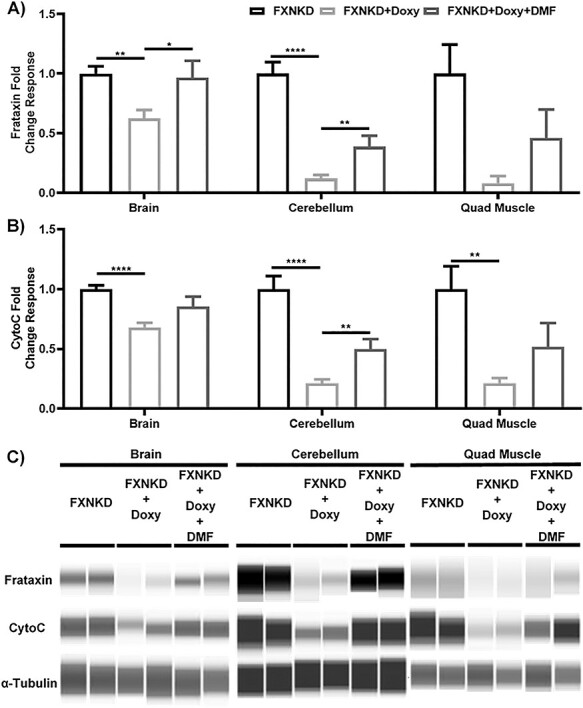
Inducible FA mouse demonstrated a decrease in mitochondrial protein expression, which was rescued by orally dosage of DMF. Jess Western analysis was done on FXNKD mice’s brain (left), cerebellum (middle) and quadricep muscle lysate (right), and fold change response of frataxin (A), cytochrome c oxidase (B) and gel image (C) were showed. For (A) and (B), bars are showing the average fold change of two individual Jess Western experiment with N = 4 normalized to vehicle, error bars are representing SEM, P-value were calculated using 2-tail t test, * = P < 0.05; ** = P < 0.01; *** = P < 0.001.
Discussion
Friedreich’s Ataxia and frataxin and the MTD and MED of dimethyl fumarate in C57BL6 mice
FA is a lethal inherited neurodegenerative disease with no approved therapy (31,32). The only cause of Friedreich’s is deficient frataxin expression usually 5–15% residual of normal wildtype (4,33). Frataxin supports iron–sulfur cluster assembly and mitochondrial biogenesis (17,18,34). Because frataxin deficiency is the only cause of FA, restoring frataxin is a major ‘upstream’ therapeutic strategy for FA treatment (Fig. 6). DMF is a fumaric acid derivative approved for the treatment multiple sclerosis. Previously we demonstrated that DMF requires both HCA2 and Nrf2 to elicit increased expression of TFAM, the single most important mitochondrial biogenesis factor (22). While we had previously shown that DMF increases mitochondrial function and gene expression in vitro (22,23), we did not know the dose-dependence of this induction in vivo, and this is of substantial importance for any mitochondrial therapeutic. So in this study the major questions to be addressed were: (1) how high can DMF be dosed before toxicity is observed, i.e. what is the maximum tolerated dose (MTD)? and (2) What is the maximal effective dose (MED) for maximal mitochondrial response in Friedreich’s-relevant tissues—e.g. brain and muscle? Both questions were asked and answered in this study.
Figure 6 .

A schematic of the potential mechanisms of frataxin expression-targeted FA treatment by DMF. Genetic mutation on frataxin gene with addition of GAA trinucleotides repeats on the intron was known to be a main reason of causing FA. In a normal individual, there is no mutation on the frataxin gene, resulting in a normal frataxin expression and thus leading to normal mitochondrial activity (A). In a FA patient, GAA trinucleotides repeats are added to the frataxin gene via genetic mutation, causing a reduction of frataxin expression. This lower iron–sulfur cluster accumulation within mitochondria and will result in an overall decrease in mitochondrial activity (B). Based on our results, DMF should rescue this situation. DMF was found to be activating transcription factors like Nrf2 and HCA2, which can be a mechanism in which resulting in the increase in frataxin expression as showed in our results. By increasing the frataxin expression, DMF can upregulate the level of frataxin in FA patient, resulting in an increase mitochondrial activity, and rescuing the FA phenotype (C).
Identification of the safety profile and maximum tolerated dose
As shown in Fig. 1, it was clear that 160 mg/kg I.P. was the MTD because a single lethal event occurred, i.e. 1/8. And at the higher dose 320 mg/kg I.P., 2/8 mortalities occurred, and 8/8 mice had obvious liver pathology. The pattern of results could be explained by hepatotoxicity resulting in lethality, as does occur in cirrhosis in which mitochondrial factors and frataxin are implicated (35,36). We also note that the variability in the liver mitochondrial gene expression data at DMF doses 160 mg/kg and above become quite variable, which could potentially be explained by mosaic liver damage affecting some hepatocytes and not others. Thus, we conclude the MTD of DMF I.P. in C57BL6 mice is 160 mg/kg, and we researched DMF’s efficacy only up to that dose and no higher.
DMF dose-dependently increases mitochondrial frataxin and mitochondrial cytochrome oxidase gene expression
We observed DMF dose-dependently increases mitochondrial proteins frataxin and cytochrome oxidase in both brain and quadricep muscle of C57Bl6 mice after 2 weeks orally dosed DMF, with maximal effectiveness at 80 and 110 mg/kg (Figs 2 and 3). Friedreich’s pathology preferentially affects brain and muscle as target tissues (26,28). Therefore, observing an increase in mitochondrial frataxin expression (the cause of FA), and mitochondrial cytochrome oxidase expression supports the idea that DMF is increasing mitochondrial gene expression in target tissues relevant to FA, and that the MED for this is in the range of 80–110 mg/kg.
DMF dose-dependently increases functional aconitase activity
The simple increase in mitochondrial gene expression does not necessarily mean that mitochondria are more functional, that requires independent measurements of mitochondrial function. We functionally assayed aconitase activity for two reasons. First, aconitase is a Kreb’s cycle enzyme and thus a surrogate for mitochondrial activity (37). Second, aconitase contains a four-iron four-sulfur iron–sulfur cluster with a labile iron, and thus aconitase is often used as a surrogate activity for frataxin’s only physiologically proven role, i.e. iron–sulfur cluster biogenesis (38). Thus the inference is, when frataxin is low, aconitase activity will be low, and conversely, a rise in frataxin expression will cause increased aconitase activity (38). Since we observe DMF causes a dose-dependent increase in brain and muscle aconitase activity, this could be the result of increased frataxin expression or overall mitochondrial gene expression, or both. In addition, frataxin and Cytochrome C gene expression rose significantly in C57BL6 quadriceps muscle dosed at 110 mg/kg DMF orally, supporting the idea that the MED for DMF in this tissue is between 80 and 110 mg/kg. Taken together, our efficacy studies support that the MED for DMF in brain and muscle of C57BL6 mice is ~110 mg/kg, and this is below the 160 mg/kg MTD. Since DMF is a drug dosed in humans for multiple sclerosis (Biogen’s Tecfidera) and for psoriasis (Almirall’s Skilarence), we calculated what the MED human-equivalent dose of DMF would be. Because mice metabolize drugs 12-fold faster than humans, one converts Human Equivalent Dose = Mouse Equivalent Dose/12. Thus, the MED of DMF in humans to raise frataxin and mitochondrial function is 110 mg/kg/12 = 9 mg/kg. For a 50-kilo teenager with Friedreich’s, this would be 9 x 50 = 450 mg/day DMF. The maximal dosage of DMF, under the name of Tecfidera which is approved in USA for multiple sclerosis, is 480 mg/day, so this is within the approved dosage of DMF in human. And in Europe, DMF under the name of Skilarence is approved for psoriasis up to 720 mg/day. So, the human-equivalent doses, inferred from the mouse MED, overlap those dosages of DMF that are already given to humans, with acceptable toxicity.
Doxycycline-inducible FA mouse had reduced mitochondrial protein expression, mitochondrial activity and mitochondrial copy number, which were rescued by oral dosing of DMF
We dosed DMF orally in the FA mouse model FXNKD mouse which was characterized previously (29). Mitochondrial protein expression and enzyme activities went down in FXNKD as a consequence of doxycycline administration, consistent with the reduced mitochondrial gene expression we and others observe in FA cells, mice and humans (18,19). All these mitochondrial deficits were abolished and reversed in FXNKD dosed with 110 mg/kg DMF as shown (Figs 4 and 5). These results support the idea that DMF is therapeutic in the context of a mitochondrial deficit, as have been demonstrated in FA (18,19).
Interestingly, mitochondrial copy number decreased in brains from FXNKD after doxycycline treatment and was significantly rescued by 110 mg/kg DMF dosage. (Fig. 4D). This was different from what we observed in C57BL6 mice, as we did not obtain any increase in mitochondrial copy number in neither brain nor quadricep muscle from C57BL6 mice after DMF dosage (Figs 2 and 3). We have a hypothesis to explain the difference synthesized from the three following facts. First, the main difference between C57Bl6 mice and the FXNKD mice made on the C57Bl6 genetic background is deficiency of a single gene, frataxin, Second, the knockdown of a single frataxin gene by siRNA causes a mitochondrial biogenesis defect after 3 days (18). Third, DMF increases frataxin, as shown multiple times in this study. We put these three facts together into a hypothesis, FXNKD → decrease frataxin → decrease in mitochondrial biogenesis. And then conversely, in FXNKD, with a decreased mitochondrial biogenesis, DMF → increase frataxin → increase mitochondrial protein expression → increase mitochondrial activity → increase mitochondrial biogenesis. Said another way, while DMF can increase mitochondrial gene expression and activity in C57BL6 mice, there is no defect in mitochondrial biogenesis to rescue. However, once frataxin is deficient in the FXNKD mouse there is an obvious defect in mitochondrial biogenesis, and that can be rescued by the frataxin-promoting and mitochondrial function-promoting DMF. Because DMF is rescuing frataxin expression, other mitochondrial gene expression, and mitochondrial function in important target tissues of the FXNKD mouse, we believe this demonstrates therapeutic potential of DMF for human FA.
Previously, in one, single experiment the C57Bl6 mouse model dosed with 20 mg/kg/day I.P. carried out in 2016, we observed a significant increase in mtDNA/nDNA ratio, signifying an increased mitochondrial copy number per cell in brain and muscle (22). By contrast, in the current series of five independent dose-dependence experiments with a minimum of 4 mice per dose group over 2 years utilizing 120 mice, dosing DMF in the C57Bl6 mice orally from 10 to 160 mg/kg/day, we did not observe a significant increase in mtDNA/nDNA at any dose. A trivial explanation of the apparent conflict in the two sets of observations is that the single experiment done in 2016 was I.P., thus the DMF drug avoided first-pass metabolism and degradation by the liver and was thus more active than the orally administered DMF shown here. Another explanation is that the mitocopy experiments done in 2016 on 10 mice reached the incorrect conclusion, which we believe is superceded by the five sets of experiments shown here in 120 C57Bl/6 mice. In C57Bl/6 mice, we find that DMF dose-dependently induces the expression of multiple mitochondrial genes, and also dose dependently induces mitochondrial enzyme aconitase activity in brain and heart, but in C57Bl/6 mice dosed orally with DMF from 10 to 160mpk we do not find an increase in mtDNA/nDNA. However, in the FXNKD mice in which there is a depletion of frataxin and a significantly decreased mitochondrial copy number, we see that orally 110mpk DMF significantly rescues this, as well as frataxin expression, and mitochondrial function as assayed by mitochondrial aconitase, Complex 2 and Complex 4 assays. Thus, while orally dosed DMF is not able to increase mitochondrial copy number at any non-toxic concentration in C57BL6 mice, in the FXNKD mice with depleted frataxin, there is a significant decrease in mtDNA/nDNA ratios in brain, and a significant rescue by 110 mg/kg orally dosed DMF. One ad hoc hypothesis to explain the available data is that fumarate is able to rescue sub-physiological mtDNA/nDNA levels (as in the case of FXNKD mice), but not physiological levels of mtDNA/nDNA as in the case of the C57BL/6 mice.
The data presented here show that DMF induces mitochondrial frataxin gene expression in the context of the FXN KD mouse, in which frataxin is reduced through a doxycyline-driven frataxin siRNA. Thus, it is a formal possibility that DMF could work through inhibition of doxycycline’s suppression of frataxin, but we find this possibility unlikely for the following reasons. First, DMF induces frataxin expression dose dependently in FA patient lymphoblasts, and there is no doxycycline or siRNA in that system (30). Second, DMF induces multiple mitochondrial gene expression and mitochondrial function by Seahorse in normal human fibroblasts, with no complicating doxycycline or siRNA in that system (22). Thirdly, DMF induces frataxin and mitochondrial gene expression and copy number in Friedreich’s patient fibroblasts, in brain of the YG8 mouse model of Friedreich’s, and in the circulating white blood cells of MS patients dosed with DMF, with no complicating doxycycline or siRNA in any of those systems (23). Lastly, the chemical structures of DMF and doxycycline are quite different, as are the structures of their receptors. Thus, while it is a formal possibility that the stimulation of frataxin expression could occur by an artifactual interaction of DMF with gut permeability of doxycycline or through ‘blocking’ doxycycline’s activity, we consider this is very unlikely in light of the data stated above.
As the FXNKD is a unique model in which doxycycline induces a frataxin-specific inhibitory RNA, it is a reasonable question to ask, how is this siRNA-mediated inhibition of frataxin overcome by DMF in FXNKD mice? While we do not have explicit data on this mechanism, one can interpret our previous published findings to explain the DMF effect on frataxin in the following way. First, DMF causes more transcriptional starts at frataxin’s transcriptional start site (TSS) as shown previously (23). The shRNA construct reduces the amount of frataxin protein produced by binding to frataxin transcripts with some efficiency to block translation. By increasing frataxin transcriptional starts, there are more frataxin transcripts, and if shRNA knockdown is less than 100% effective in the FXNKD mouse as shown previously (29), then this ‘bulk effect’ should increase frataxin expression. This will result in the beneficial effects on mitochondrial gene expression and mitochondrial activities we observed in this study.
To summarize, we (1) show the MTD of DMF I.P. in C57Bl6 mice is less than 160 mg/kg, and significant liver toxicity is observed above that dose; (2) show the MED of oral DMF is 80 < x < 160 mg/kg, and we observe that 110 mg/kg appears to be a ‘sweet spot’ of dosing for maximal effectiveness and limited toxicity; (3) at the MED, DMF increased frataxin and cytochrome oxidase gene expression and aconitase functional activity in target tissues brain and muscle of C57Bl6 mice; (4) at the MED, DMF increased frataxin and cytochrome oxidase gene expression and aconitase functional activity, as well as mitochondrial biogenesis, in important target tissues of brain and muscle of the FXNKD mouse model of FA and (5) the human dose equivalent of the MED mouse dose of 110 mg/kg calculates to 9 mg/kg, which up to a 60 kg human completely overlaps the maximal daily dose 720 mg/day that DMF is currently allowed in humans. These data tend to support the use of DMF in FA and other pediatric mitochondrial diseases.
Materials and Methods
Animals
Animals were housed and bred in animal facility in the Department of Nutrition at the University of California, Davis, and were maintained on a 12-h light–dark cycle. All experimental protocols were approved and supervised by the University of California Davis Institutional Animal Care and Use Committee.
About 3–6 months old C57Bl6 mice were equally separated and assigned to different group as indicated and were treated with either vehicle or DMF via different route of administration. For I.P., DMF powder (Sigma Aldrich, St Louis, MO) was dissolved in sterile PBS containing 400 mg/ml captisol (Ligand Technologies, San Diego, CA) to indicated concentration. Mice were received an injection of 200 μl vehicle solution or solution with DMF at indicated concentration once per day for a total of 14 days. IP protocol was approved and supervised by University of California Davis Institutional Animal Care and Use Committee. Mice were sacrificed at day 15, tissues were collected and freeze in liquid nitrogen for future experiments. For oral dosing, DMF powder was added to peanut butter to reach the indicated drug concentration and the product was mixed until homogenize. Mice were fed with 200 μl of plain peanut butter or peanut butter mixed with DMF once per day for total of 14 days. Mice were sacrificed at day 15, tissues were collected and freeze in liquid nitrogen for future experiments. For testing the therapeutic effects of DMF on FA animal models, inducible FA mouse model ‘FXNKD’ mouse were created and bred by Dr Vijayendran Chandran and mating pairs were received as gift, FXNKD mouse was characterized and described previously (29). About 3–5 months old FXNKD mice were equally separated and assigned to indicated groups. To induce FA phenotype, FXNKD mice were receiving 625 ppm of doxycycline mixed in chow diet for total of 18 weeks. At week 16 after the doxycycline chow diet started, mice were receiving additional 200 μl of plain peanut butter or peanut butter mixed with 110 mg/kg of DMF once per day for the reminding of the experiment. Mice were sacrificed at week 18, tissues were collected and freeze in liquid nitrogen for future experiments.
Western blotting analysis
Frozen tissues were cut on a frozen surface and 5 mg of chopped tissues were collected. Total protein was isolated with ice-cold CellLytic MT Cell Lysis Reagent (Sigma Aldrich. St Louis, MO) containing 1 tablet of PhosSTOP phosphatase inhibitor and Complete EDTA-free mini protease inhibitor cocktail (Roche Diagnostics, Indianapolis, IN). Briefly, 200 μl of CellLytic MT Cell Lysis Reagent with phosphatase inhibitor and protease inhibitor was added to 5 mg of chopped tissues, and tissues were grinded until homogenized using a manual grinder. Tissue homogenates were then spin at 4°C for 10 min; at the speed of 5000 rpm for liver, heart and quadricep muscle; 10 000 rpm for brain and cerebellum. Top fat layer and pellet were avoided, and the middle tissue lysate was collected. Protein concentration was determined by Bradford assay (BioRad Laboratories, Hercules, CA) and 20 mg of protein per line were loaded and resolved by SDS-PAGE using NuPAGE Bis-Tris Gels and the NuPAGE LDS Sample Buffer (Invitrogen Inc.) following the manufacturer instructions. Results were then transferred to nitrocellulose membrane and blocked with Odyssey Blocking Buffer (Li-Cor Biosciences), followed by hybridization with indicated primary antibodies at the dilution of 1:1000: rabbit monoclonal anti-frataxin (gift from Dr Franco Taroni), mouse monoclonal anti-Cytochrome C (Santa Cruz Biotechnology, Dallas, TX), mouse monoclonal anti-Cytochrome C oxidase IV (COXIV) (Cell Signaling Technology, Danvers, MA); mouse monoclonal anti-α-tubulin (Sigma Aldrich, St Louis, MO) at 1:2000 dilution was used as internal control. Membrane were developed with infrared IR-dye 700CW and 800CW labeled secondary antibodies at a dilution of 1:15 000 (Li-Cor). Blots were scanned on Li-Cor Odyssey infrared imaging instrument and results were quantified and analyzed using Odyssey 2.1 software.
Protein Simple Jess Western analysis
Protein expressions were also determined using Protein Simple Jess Western instrument (San Jose, CA). Tissue lysates were prepared as described above. About 6 μl of 2 mg/ml protein simple were mixed with 5x fluorescent master mix (Protein Simple) to achieve a finial concentration of 1x master mix buffer according to manufacturer’s instructions. Samples were then denatured at 95°C for 5 min. All materials and solutions were added onto the assay plate purchased from protein simple except primary antibodies. About 10 μl of antibody diluent, protein normalizing reagent, primary antibodies, secondary antibodies, chemiluminescent substrates, 3 μl of sample and 500 μl of wash buffer were prepared and dispensed into the assay plate. Assay plate was loaded into the instrument and protein was separated within individual capillaries. Protein detection and digital images were collected and analyzed with Compass software (Protein Simple) and data were reported as area under the peak, which representing the intensity of the signal. For primary antibody, rabbit monoclonal anti-frataxin (gift from Dr Franco Taroni), mouse monoclonal anti-Cytochrome C (Santa Cruz Biotechnology, Dallas, TX), mouse monoclonal anti-Cytochrome C oxidase IV (COXIV) (Cell Signaling Technology, Danvers, MA) were used at 1:100 dilution, and is mixed with mouse monoclonal anti-α-tubulin (Sigma Aldrich, St Louis, MO) at 1:250 dilution. For secondary antibody, anti-mouse NIR and anti-rabbit HRP secondary antibodies from Protein Simple were used.
DNA and RNA extraction
Total DNA was extracted from chopped mouse tissues using DNeasy blood and tissue kit (Qiagen, Valencia, CA). Extraction was done via following manufacturer’s protocols. Concentration of DNA extracted was quantified using NanoDrop 2000c Spectrophotometer (Thermo Scientific, Waltham, MA). Total RNA was extracted from chopped mouse tissues using RNeasy plus mini kit (Qiagen, Valencia, CA). For brain and cerebellum, RNA was extracted using ENeasy Lipid Tissue mini kit to maximize yield from fatty tissues (Qiagen, Valencia, CA). Extraction was done via following manufacturers’ protocols. Concentration and quality of RNA were quantified using NanoDrop 2000c Spectrophotometer (Thermo Scientific, Waltham, MA).
Quantitative RT-PCR
cDNA was synthesized from mRNA in C1000 Touch Thermal Cycler (Bio-Rad Laboratories, Hercules, CA) using iScript cDNA Synthesis Kit (Bio-Rad Laboratories, Hercules, CA), as instructed by manufacturer. qPCR was performed on the DNA and synthesized cDNA using a SensiFAST SYBR No-ROX kit (Bioline, Taunton, MA) in a Roche Lightcycler 480 (Roche Diagnostics, Indianapolis, IN). Cycle threshold was determined using a second derivative of the amplification curve, and the data were analyzed by converting the CT values to relative DNA/cDNA concentration using a standard curve measurement. Primers sets used in the qPCR are listed below (5′ —> 3″): mouse mito8.9: CATGATCTAGGAGGCTGCTGACCTC; mouse mito 9.1: CGTTTACCTTCTATAAGGCTATGA; mouse mt-ND1 F: TCCGAGCATCTTATCCACGC; mouse mt-ND1 R: GTATGGTGGTACTCCCGCTG; mouse β-actin F: TGGAACGGTGAAGGCGACAGCAGTTG; mouse β-actin R: GTGGCTTTTGGGAGGGTGAGGGACTT.
Quantification of oxygen consumption in DMF-treated animals by seahorse XF analyzer
C57Bl6 mice were dosed with DMF in peanut butter at indicated concentration for 2 weeks, dosing protocol were described above. Mice were sacrificed after dosing and indicated tissues were retained and homogenized in sterile mitochondrial isolation medium, receipt provided by Agilent (Santa Clara, CA), using a manual glass Teflon Homogenizer (Thomas Scientific, Swedesboro, NJ). Mitochondria was isolated out from the homogenized tissues following the mitochondrial isolation protocol specifically for seahorse analysis provided by Agilent (Santa Clara, CA). Protein concentration of the mitochondrial extracts were measured using Bradford assay (BioRad Laboratories, Hercules, CA), and 100 μg of the mitochondrial extracts were loaded onto a 24-well seahorse tissue culture plate (Agilent, Santa Clara, CA). Extracts were incubated with 450 μl of seahorse assay medium (Agilent, Santa Clara, CA) mixed with 5.5 mM of succinate and 2.2 μM of rotenone at 37°C for 10 min to stimulate basal mitochondrial respiration. Seahorse tissue culture plates were then assayed using a Seahorse XF-24 (Agilent, Santa Clara, CA). In brief, tissues’ mitochondrial extracts after incubation were pre-equilibrated for 20 min, oxygen consumption rate and proton production rate were recorded with the Seahorse XF-24after sequential addition of ADP (2 μM), oligomycin (2 μM), FCCP (4 μM) and antimycin A (4 μM) (Sigma-Aldrich. St. Louis, MO, USA). Total protein in each well was measured and protein concentration was used to normalize the readings.
Statistical analysis
All statistical analysis was performed with Excel Statistical Data Analysis Tool package 2007. Unless indicated otherwise, P-values were determined with 2-tails t-test.
Supplementary Material
Acknowledgements
We thank the Dr Daniel Geschwind laboratory and Dr Vijay Chandran at UCLA for making the FXNKD mice available to us prior to their publication (29).
Conflict of Interest statement. Authors do not have any conflict of interest associated with publishing this work.
Contributor Information
Chun Kiu Hui, Department of Molecular Biosciences, School of Veterinary Medicine, University of California, Davis, CA 95616, USA.
Elena N Dedkova, Department of Molecular Biosciences, School of Veterinary Medicine, University of California, Davis, CA 95616, USA.
Claire Montgomery, Department of Molecular Biosciences, School of Veterinary Medicine, University of California, Davis, CA 95616, USA.
Gino Cortopassi, Department of Molecular Biosciences, School of Veterinary Medicine, University of California, Davis, CA 95616, USA.
Funding
National Institute of Health (1R21NS107918-01A1).
References
- 1.Cossee, M., Schmitt, M., Campuzano, V., Reutenauer, L., Moutou, C., Mandel, J.L. and Koenig, M. (1997) Evolution of the Friedreich's ataxia trinucleotide repeat expansion: founder effect and permutations. Proc. Natl. Acad. Sci. U. S. A., 94, 7452–7457. [DOI] [PMC free article] [PubMed] [Google Scholar]
- 2.Voncken, M., Ioannou, P. and Delatycki, M.B. (2004) Friedreich ataxia-update on pathogenesis and possible therapies. Neurogenetics, 5, 1–8. [DOI] [PubMed] [Google Scholar]
- 3.Vankan, P. (2013) Prevalence gradients of Friedreich's ataxia and R1b haplotype in Europe co-localize, suggesting a common Palaeolithic origin in the Franco-Cantabrian ice age refuge. J. Neurochem., 126, 11–20. [DOI] [PubMed] [Google Scholar]
- 4.Campuzano, V., Montermini, L., Molto, M.D., Pianese, L., Cossee, M., Cavalcanti, F., Monros, E., Rodius, F., Duclos, F., Monticelli, A. et al. (1996) Friedreich's ataxia: autosomal recessive disease caused by an intronic GAA triplet repeat expansion. Science, 271, 1423–1427. [DOI] [PubMed] [Google Scholar]
- 5.Beauchamp, M., Labelle, H., Duhaime, M. and Joncas, J. (1995) Natural history of muscle weakness in Friedreich's ataxia and its relation to loss of ambulation. Clin. Orthop. Relat. Res., 311, 270–275. [PubMed] [Google Scholar]
- 6.Delatycki, M.B., Paris, D.B., Gardner, R.J., Nicholson, G.A., Nassif, N., Storey, E., MacMillan, J.C., Collins, V., Williamson, R. and Forrest, S.M. (1999) Clinical and genetic study of Friedreich ataxia in an Australian population. Am. J. Med. Genet., 87, 168–174. [DOI] [PubMed] [Google Scholar]
- 7.McCabe, D.J., Ryan, F., Moore, D.P., McQuaid, S., King, M.D., Kelly, A., Daly, K., Barton, D.E. and Murphy, R.P. (2000) Typical Friedreich's ataxia without GAA expansions and GAA expansion without typical Friedreich's ataxia. J. Neurol., 247, 346–355. [DOI] [PubMed] [Google Scholar]
- 8.Lamarche, J.B., Cote, M. and Lemieux, B. (1980) The cardiomyopathy of Friedreich's ataxia morphological observations in 3 cases. Can. J. Neurol. Sci., 7, 389–396. [DOI] [PubMed] [Google Scholar]
- 9.Puccio, H., Simon, D., Cossee, M., Criqui-Filipe, P., Tiziano, F., Melki, J., Hindelang, C., Matyas, R., Rustin, P. and Koenig, M. (2001) Mouse models for Friedreich ataxia exhibit cardiomyopathy, sensory nerve defect and Fe-S enzyme deficiency followed by intramitochondrial iron deposits. Nat. Genet., 27, 181–186. [DOI] [PubMed] [Google Scholar]
- 10.Weidemann, F., Stork, S., Liu, D., Hu, K., Herrmann, S., Ertl, G. and Niemann, M. (2013) Cardiomyopathy of Friedreich ataxia. J. Neurochem., 126, 88–93. [DOI] [PubMed] [Google Scholar]
- 11.Rance, G., Corben, L. and Delatycki, M. (2012) Auditory processing deficits in children with Friedreich ataxia. J. Child Neurol., 27, 1197–1203. [DOI] [PMC free article] [PubMed] [Google Scholar]
- 12.Satya-Murti, S., Cacace, A. and Hanson, P. (1980) Auditory dysfunction in Friedreich ataxia: result of spiral ganglion degeneration. Neurology, 30, 1047–1053. [DOI] [PubMed] [Google Scholar]
- 13.Brendel, B., Ackermann, H., Berg, D., Lindig, T., Scholderle, T., Schols, L., Synofzik, M. and Ziegler, W. (2013) Friedreich ataxia: dysarthria profile and clinical data. Cerebellum, 12, 475–484. [DOI] [PubMed] [Google Scholar]
- 14.Cnop, M., Igoillo-Esteve, M., Rai, M., Begu, A., Serroukh, Y., Depondt, C., Musuaya, A.E., Marhfour, I., Ladriere, L., Moles Lopez, X. et al. (2012) Central role and mechanisms of beta-cell dysfunction and death in Friedreich ataxia-associated diabetes. Ann. Neurol., 72, 971–982. [DOI] [PMC free article] [PubMed] [Google Scholar]
- 15.Cnop, M., Mulder, H. and Igoillo-Esteve, M. (2013) Diabetes in Friedreich ataxia. J. Neurochem., 126, 94–102. [DOI] [PubMed] [Google Scholar]
- 16.Milbrandt, T.A., Kunes, J.R. and Karol, L.A. (2008) Friedreich's ataxia and scoliosis: the experience at two institutions. J. Pediatr. Orthop., 28, 234–238. [DOI] [PubMed] [Google Scholar]
- 17.Pastore, A. and Puccio, H. (2013) Frataxin: a protein in search for a function. J. Neurochem., 126, 43–52. [DOI] [PubMed] [Google Scholar]
- 18.Jasoliya, M.J., McMackin, M.Z., Henderson, C.K., Perlman, S.L. and Cortopassi, G.A. (2017) Frataxin deficiency impairs mitochondrial biogenesis in cells, mice and humans. Hum. Mol. Genet., 26, 2627–2633. [DOI] [PMC free article] [PubMed] [Google Scholar]
- 19.Lin, H., Magrane, J., Rattelle, A., Stepanova, A., Galkin, A., Clark, E.M., Dong, Y.N., Halawani, S.M. and Lynch, D.R. (2017) Early cerebellar deficits in mitochondrial biogenesis and respiratory chain complexes in the KIKO mouse model of Friedreich ataxia. Dis. Model. Mech., 10, 1343–1352. [DOI] [PMC free article] [PubMed] [Google Scholar]
- 20.Sahdeo, S., Scott, B.D., McMackin, M.Z., Jasoliya, M., Brown, B., Wulff, H., Perlman, S.L., Pook, M.A. and Cortopassi, G.A. (2014) Dyclonine rescues Frataxin deficiency in animal models and buccal cells of patients with Friedreich's ataxia. Hum. Mol. Genet., 23, 6848–6862. [DOI] [PMC free article] [PubMed] [Google Scholar]
- 21.Deeks, E.D. (2016) Dimethyl fumarate: a review in relapsing-remitting MS. Drugs, 76, 243–254. [DOI] [PubMed] [Google Scholar]
- 22.Hayashi, G., Jasoliya, M., Sahdeo, S., Sacca, F., Pane, C., Filla, A., Marsili, A., Puorro, G., Lanzillo, R., Brescia Morra, V. et al. (2017) Dimethyl fumarate mediates Nrf2-dependent mitochondrial biogenesis in mice and humans. Hum. Mol. Genet., 26, 2864–2873. [DOI] [PMC free article] [PubMed] [Google Scholar]
- 23.Jasoliya, M., Sacca, F., Sahdeo, S., Chedin, F., Pane, C., Brescia Morra, V., Filla, A., Pook, M. and Cortopassi, G. (2019) Dimethyl fumarate dosing in humans increases Frataxin expression: a potential therapy for Friedreich's ataxia. PLoS One, 14, e0217776. [DOI] [PMC free article] [PubMed] [Google Scholar]
- 24.Linker, R.A., Lee, D.H., Ryan, S., van Dam, A.M., Conrad, R., Bista, P., Zeng, W., Hronowsky, X., Buko, A., Chollate, S. et al. (2011) Fumaric acid esters exert neuroprotective effects in neuroinflammation via activation of the Nrf2 antioxidant pathway. Brain, 134, 678–692. [DOI] [PubMed] [Google Scholar]
- 25.Sastry, S.V., Nyshadham, J.R. and Fix, J.A. (2000) Recent technological advances in oral drug delivery - a review. Pharm. Sci. Technol. Today, 3, 138–145. [DOI] [PubMed] [Google Scholar]
- 26.Della Nave, R., Ginestroni, A., Tessa, C., Salvatore, E., Bartolomei, I., Salvi, F., Dotti, M.T., De Michele, G., Piacentini, S. and Mascalchi, M. (2008) Brain white matter tracts degeneration in Friedreich ataxia. An in vivo MRI study using tract-based spatial statistics and voxel-based morphometry. Neuroimage, 40, 19–25. [DOI] [PubMed] [Google Scholar]
- 27.Nachbauer, W., Boesch, S., Reindl, M., Eigentler, A., Hufler, K., Poewe, W., Loscher, W. and Wanschitz, J. (2012) Skeletal muscle involvement in Friedreich ataxia and potential effects of recombinant human erythropoietin administration on muscle regeneration and neovascularization. J. Neuropathol. Exp. Neurol., 71, 708–715. [DOI] [PubMed] [Google Scholar]
- 28.Sival, D.A., Pouwels, M.E., Van Brederode, A., Maurits, N.M., Verschuuren-Bemelmans, C.C., Brunt, E.R., Du Marchie Sarvaas, G.J., Verbeek, R.J., Brouwer, O.F. and Van Der Hoeven, J.H. (2011) In children with Friedreich ataxia, muscle and ataxia parameters are associated. Dev. Med. Child Neurol., 53, 529–534. [DOI] [PubMed] [Google Scholar]
- 29.Chandran, V., Gao, K., Swarup, V., Versano, R., Dong, H., Jordan, M.C. and Geschwind, D.H. (2017) Inducible and reversible phenotypes in a novel mouse model of Friedreich's ataxia. Elife, 6, 1–41-e30054. [DOI] [PMC free article] [PubMed] [Google Scholar]
- 30.Hayashi, G. and Cortopassi, G. (2016) Lymphoblast oxidative stress genes as potential biomarkers of disease severity and drug effect in Friedreich's ataxia. PLoS One, 11, e0153574. [DOI] [PMC free article] [PubMed] [Google Scholar]
- 31.Burk, K. (2017) Friedreich ataxia: current status and future prospects. Cerebellum Ataxias, 4, 4. [DOI] [PMC free article] [PubMed] [Google Scholar]
- 32.Harding, A.E. (1981) Friedreich's ataxia: a clinical and genetic study of 90 families with an analysis of early diagnostic criteria and intrafamilial clustering of clinical features. Brain, 104, 589–620. [DOI] [PubMed] [Google Scholar]
- 33.Campuzano, V., Montermini, L., Lutz, Y., Cova, L., Hindelang, C., Jiralerspong, S., Trottier, Y., Kish, S.J., Faucheux, B., Trouillas, P. et al. (1997) Frataxin is reduced in Friedreich ataxia patients and is associated with mitochondrial membranes. Hum. Mol. Genet., 6, 1771–1780. [DOI] [PubMed] [Google Scholar]
- 34.Gomes, C.M. and Santos, R. (2013) Neurodegeneration in Friedreich's ataxia: from defective Frataxin to oxidative stress. Oxid. Med. Cell. Longev., 2013, 487534. [DOI] [PMC free article] [PubMed] [Google Scholar]
- 35.Mani, S., Mondal, D., Sarma, K. and Singh, K. (2014) Experimentally induced liver cirrhosis with ascites by carbon tetrachloride and phenobarbital sodium in Wistar rats. Adv. Anim. Vet. Sci., 2, 159–163. [Google Scholar]
- 36.Milic, S., Mikolasevic, I., Orlic, L., Devcic, E., Starcevic-Cizmarevic, N., Stimac, D., Kapovic, M. and Ristic, S. (2016) The role of iron and iron overload in chronic liver disease. Med. Sci. Monit., 22, 2144–2151. [DOI] [PMC free article] [PubMed] [Google Scholar]
- 37.Lushchak, O.V., Piroddi, M., Galli, F. and Lushchak, V.I. (2014) Aconitase post-translational modification as a key in linkage between Krebs cycle, iron homeostasis, redox signaling, and metabolism of reactive oxygen species. Redox Rep., 19, 8–15. [DOI] [PMC free article] [PubMed] [Google Scholar]
- 38.Ast, T., Meisel, J.D., Patra, S., Wang, H., Grange, R.M.H., Kim, S.H., Calvo, S.E., Orefice, L.L., Nagashima, F., Ichinose, F. et al. (2019) Hypoxia rescues Frataxin loss by restoring iron sulfur cluster biogenesis. Cell, 177, 1507–1521-e1516. [DOI] [PMC free article] [PubMed] [Google Scholar]
Associated Data
This section collects any data citations, data availability statements, or supplementary materials included in this article.