

Abstract
Magnetic resonance spectroscopy (MRS) can noninvasively detect metabolites in vivo, including glutamate (Glu). However, quantification is known to be affected by the overlap among metabolite resonance lines and background macromolecule signals. We found that adding a moderate amount of noise or line broadening (2 Hz) caused large variations in concentration of Glu and other metabolites, when determined by LCModel analysis of in vivo short-echo time (TE) spectra. Theses variations were largely attributed to strong spectral baselines in short TE spectra, especially near 2.35 ppm, as well as overlapping metabolite resonance lines. To address this issue, we acquired in vivo data at 3 Tesla using both short-TE and the multiple echo time J-resolved point-resolved spectroscopy (JPRESS) MRS techniques. We found that one-dimensional (1D) JPRESS, by simultaneously fitting the two cross-sections of JPRESS at J = 0 and J = 7.5 Hz, was highly resistant to variations in noise levels and spectral linewidths. Our results demonstrate that LCModel analysis of short-TE data is highly sensitive to variations in noise levels and spectral linewidths and this sensitivity is greatly reduced by 1D JPRESS given its substantially reduced baselines and enhanced spectral resolution.
Keywords: magnetic resonance spectroscopy, JPRESS, short-echo time, glutamate, baseline of macromolecule background
Introduction
Data acquisition with single short-echo time (TE) permits metabolite signals to be acquired with minimal T2 signal loss and is therefore widely used for non-invasive detection of in vivo metabolites using magnetic resonance spectroscopy (MRS). In a short TE spectrum, the spectral overlap between individual metabolites results in large covariances and uncertainties for determining metabolite concentrations; these are more pronounced for J-coupled spin systems because multiplets spread out and create more severe overlaps. Macromolecule and/or lipid signals are another problematic issue associated with short TE spectra, as they have relatively short T2 times and therefore their signals are pronounced at short TE, and those background signals interact with metabolite resonance peaks and hence affect quantification results [1–4].
Long TE approaches, which allow metabolite signals to be acquired with attenuated macromolecule baselines, provide an opportunity for improved differentiation of specific J-coupled spin resonances. For example, an optimal TE of 135 ms was suggested to detect lactate (Lac); with this TE, the target Lac peak at 1.33 ppm is inverted and distinct from the surrounding resonance signals [5]. Nevertheless, while an optimal TE may exist for a specific metabolite, it may not be optimal for other metabolites. In addition, a long TE makes the concentration estimate sensitive to the metabolite T2s. As a result, information about the T2s is needed, either to correct estimated concentrations during post-processing or to serve as fitting variables to be determined along with the metabolite concentrations. The latter approach is not applicable to single TE techniques, which are unable to derive T2 values.
J-resolved spectroscopy, also known as JPRESS [6], acquires a series of different TE spectral data which can be transformed into a 2D spectrum; one dimension gives the spectrum of chemical shifts, and the second dimension shows J-coupling information. Metabolite resonance lines can then be identified concurrently by their chemical shifts and J-coupling information, with significantly improved spectral resolution. However, quantifying 2D in vivo spectra of metabolites is challenging because of the complexity in modeling the 2D objective function for in vivo cases.
TE-averaged spectroscopy is a highly effective method for quantifying glutamate (Glu) at 3 Tesla [7–9]. The resonance lines of glutamine (Gln) have been shown to be effectively suppressed around 2.35 ppm so that the Glu signal can be clearly detected. A recent study from our laboratory found that the 1D cross-section at J = 7.5 Hz can be used to resolve the resonance signals of Glu and Gln near 2.35 ppm and allows for simultaneous measurement of Glu and Gln at 3 Tesla [9]. In that study, the Glu peak intensity (2.35 ppm) in the J = 7.5 Hz cross-section was found to be as strong as in the J = 0 cross-section.
In this paper, we evaluate the effects of noise level and linewidth on spectral fitting of short-TE and 1D JPRESS data. We found that LCModel analysis of short-TE data was highly sensitive to variations of signal to noise ratio (SNR) and spectral linewidth, especially for Glu. This sensitivity was largely attributed to the strong baseline in short-TE data. In comparison, 1D JPRESS, with its substantially reduced baselines and enhanced spectral resolution, was found to be highly immune to variations in noise levels and linewidths.
Methods
1D JPRESS
J evolution is encoded by sequentially shifting the last refocusing pulse in the PRESS sequence. Total TE is continuously increased by the amount of ΔTE2 before the last TE is reached. The spectral peaks of in vivo 2D JPRESS are concentrated around J = 0 within a range of about 10 Hz along the J-dimension, because J-coupling constants are generally smaller than 10 Hz [10]. As such, the J-dimension features narrowed bandwidth and hence can be characterized by a few points in the frequency domain. In the current study, the two cross-sections of J = 0 and J =7.5 Hz was concatenated into a 1D spectrum, referred to as 1D JPRESS, to fit experimental data simultaneously for quantification of metabolite concentrations [9].
The fitting program was developed in-house using Java. It was executed fully automatically like the LCModel analysis [11], with the basis set comprising 19 metabolites: N-acetylaspartate (NAA), N-acetylaspartylglutamate (NAAG), creatine (Cr), phosphoryl choline (PCho), Glycerol-phosphocholine (GPCho), Glu, Gln, glutathione (GSH), taurine (Tau), aspartate (Asp), myo-inositol (mI), scyllo-inositol (sIn), gamma-aminobutyric acid (GABA), glycine (Gly), phosphoryl ethanolamine (PE), α-glucose (α-Glc), β-glucose (β-Glc), Lac, and alanine (Ala). Due to the influence of water suppression, the resonance peak of Cr at 3.9 ppm was decoupled from the peak at 3.0 ppm, and only the Cr signal at 3.0 ppm was used to represent total Cr (tCr). The fitting process started with a preprocess in which the spectral data were phase- and amplitude-corrected using unsuppressed water reference, and the residual water in each scan was then used as reference for frequency and phase corrections.
Computer-generated JPRESS basis set
Computer simulation provides an alternative to phantom experiments to generate model spectra. It not only circumvents all the inconveniences associated with phantom experiments but also offers flexibility; for instance, prior knowledge, such as T2, can be incorporated into the model spectra. In a growing trend, computer-generated basis sets have been applied to fitting experimental spectra for quantification and pulse sequence optimization [12–15].
One major concern associated with computer-generated basis sets is the accuracy with which numerical simulation reproduces the effects of the underlying MR pulse sequence. Because simulations of 3D localized MRS spectra pixel-by-pixel can be very time-consuming for multi-spin systems, ideal radiofrequency (RF) pulses without localizations are often used to simplify the simulation so that only one spatial point is needed to simulate non-localized MRS. This approximation ignores the so-called chemical shift effect that arises from the limited RF bandwidths of real RF pulses and its limitations have been well-described in the literature [16–18].
Numerical simulation of localized MRS using real RF pulses requires computing spin density operations point-by-point in 3D space, which can be extremely time consuming for a multi-spin molecule with a large number of digitized points in 3D space and the required digitization of shaped RF pulses. This problem is multiplied for multiecho experiments such as JPRESS because each TE requires its own spectral basis set. Our laboratory recently developed a highly accelerated simulation technique that reduces the time-consuming 3D computation problems into a rapidly solvable 1D problem [19]. The total computation time of this 1D projection method is proportional to nx + ny + nz, rather than nx × ny × nz (where nx, ny, and nz denote the spatial points in x, y, and z directions, respectively). As a result, compared to 3D computation 1D computation time can be reduced by orders of magnitude without compromising accuracy.
In the present study, the basis set was created by simulating PRESS sequence with the following parameters: starting number of echoes = 32, TE = 35 ms (TE1 = 18 ms, TE2 = 17 ms); excitation pulse duration = 3.6 ms, flip angle = 90 degrees; and refocusing pulse duration = 6.2 ms, flip angle = 180 degrees. The refocusing gradient for excitation was applied right after the excitation pulse. The excitation and refocusing RF pulses were created using the Shinnar-Le Roux algorithm [20], with a bandwidth of 2500 Hz and 1300 Hz, respectively. The excitation and refocusing RF pulses in the time domain were digitized by 150 and 240 temporal points, respectively. Starting from 17 ms (TE = 35 ms), the TE of the second refocusing pulse was progressively increased with a TE spacing of 4.0 ms. Data was sampled using a bandwidth of 5 kHz and 4096 data points.
Baseline Modeling
As described by a previous report [22] in vivo proton MRS baseline was modeled using B-splines. Its contribution to the Cramer-Rao lower bounds was derived from the Fisher matrix. The smoothness of the baseline was treated as a function of spectral parameters to be determined by spectral fitting. The baseline root-mean-square error was used to quantify the estimation errors of the baseline. An optimal smoothness was obtained by minimizing baseline root-mean-square error with simulated spectra. By this approach, the best fit can be realized with minimal baseline interference with metabolite quantification.
Data Acquisition
Ten healthy human participants (mean age = 40±7 years) were examined in compliance with procedures approved by the NIMH Institutional Review Board (IRB). Written informed consent was obtained from all participants.
Experimental data were acquired using a 3 T GE whole body scanner (General Electric Medical Systems, Milwaukee, Wisconsin, USA). The source code of the sequence (J-resolved PRESS) was provided by GE. The water reference scan uses 16 echoes and two averages to shorten the scan time. Outer volume suppression was implemented to automatically fit the boundaries of prescribed voxels.
The voxels were placed in the anterior cingulate cortex (ACC) as shown in Figure 1. For short-TE MRS voxel size was 2×2×2 cm3. JPRESS data, including the water reference, were collected using a scan time of 5.3 minutes (number of echoes = 32, number of averages = 4, repetition time = 2s) or 9.2 minutes (only the number of water-suppressed scans were doubled; number of averages = 8, repetition time = 2s) from the same anatomical location with a voxel size of 2.5×2.5×2.5 cm3 or specified otherwise. The short TE spectra were acquired using the same sequence, with echo number set to 1.
Fig. 1.

Typical placement of MRS voxel (2×2×2 cm3) and image segmentation (blue: gray matter, red: white matter, yellow: cerebrospinal fluid). The 2×2×2 cm3 voxel was prescribed for short-TE MRS.
Quantification of Metabolite Concentrations
The short TE spectra were quantified using LCModel analysis with the default basis set and settings. JPRESS data included multi-echo water references, which were used to derive the water T2, and contribution from cerebrospinal fluid (CSF) [21]. The CSF contribution was then removed from the water references. Segmentation of gray matter (GM) and white matter (WM) was obtained using T1-weighted anatomical images and FreeSurfer software (https://surfer.nmr.mgh.harvard.edu) (Fig. 1). Metabolite concentration Cm was then obtained by:
| [1] |
where sm is the fitted metabolite signal intensity, Sref is the signal amplitude of the water reference with the cerebral spinal fluid (CSF) removed, fg and fw are the volume fractions of grey matter and white matter within the voxels, and Wg and Ww are water concentration of pure grey matter and white matter (43300 mM and 35880 mM, respectively) [21].
The 1D JPRESS data were quantified as previously described [9, 22, 23] with 2 Hz line-broadening in the J dimension. The software was developed in-house using “eclipse”, an open source Java integrate development environment (https://www.eclipse.org). Both LCModel analysis and 1D JPRESS were automatically executed without user intervention. The default setting for LCModel baseline stiffness DKNTMN was 0.15. 1D JPRESS used basis set created by density matrix simulation with real RF pulses, as described above.
Numerical Validation
To test the reliability of quantification of 1D JPRESS and LCModel analysis of short TE spectral data, two additional data sets were created by injecting noise and/or performing line broadening, respectively, to the original in vivo data. For noise injection, independent white noise sequences were randomly generated by computer and separately added into the original real and imaginary data in the time domain. The SNR was defined by the ratio of the NAA peak at 2 ppm to the measured noise variance. For line-broadening the original in vivo time domain data were multiplied by an exponential decay window function. For the linewidth broadened data, noise was also added to match the original SNR in the frequency domain.
Results
An example of 1D JPRESS fitting of J = 0 (a) and J = 7.5 Hz (b) cross-sections is shown in Figure 2. A constant phase of −220 degree (−starting TE × 7.5 Hz) was applied to the cross-section at J = 7.5 Hz to phase the Glu peak at 2.35 ppm upward and, coincidentally, the major peaks of NAA, Cr, and Cho downward. The two cross-sections at J = 0 and J = 7.5 HZ had similar peak heights for Glu resonances at 2.35 ppm. For viewing purpose, the sub-spectra of J= 7.5Hz were scaled up by 2.5 folds and shifted up to the middle of the figures. The estimated metabolite concentrations (mM) were: [Glu] = 9.8, [Gln] = 2.4, [NAA] (the sum of NAA and NAAG) = 9.9, [Cr]= 6.7, [mI] = 5.9, and [tCho] = 1.4.
Fig. 2.
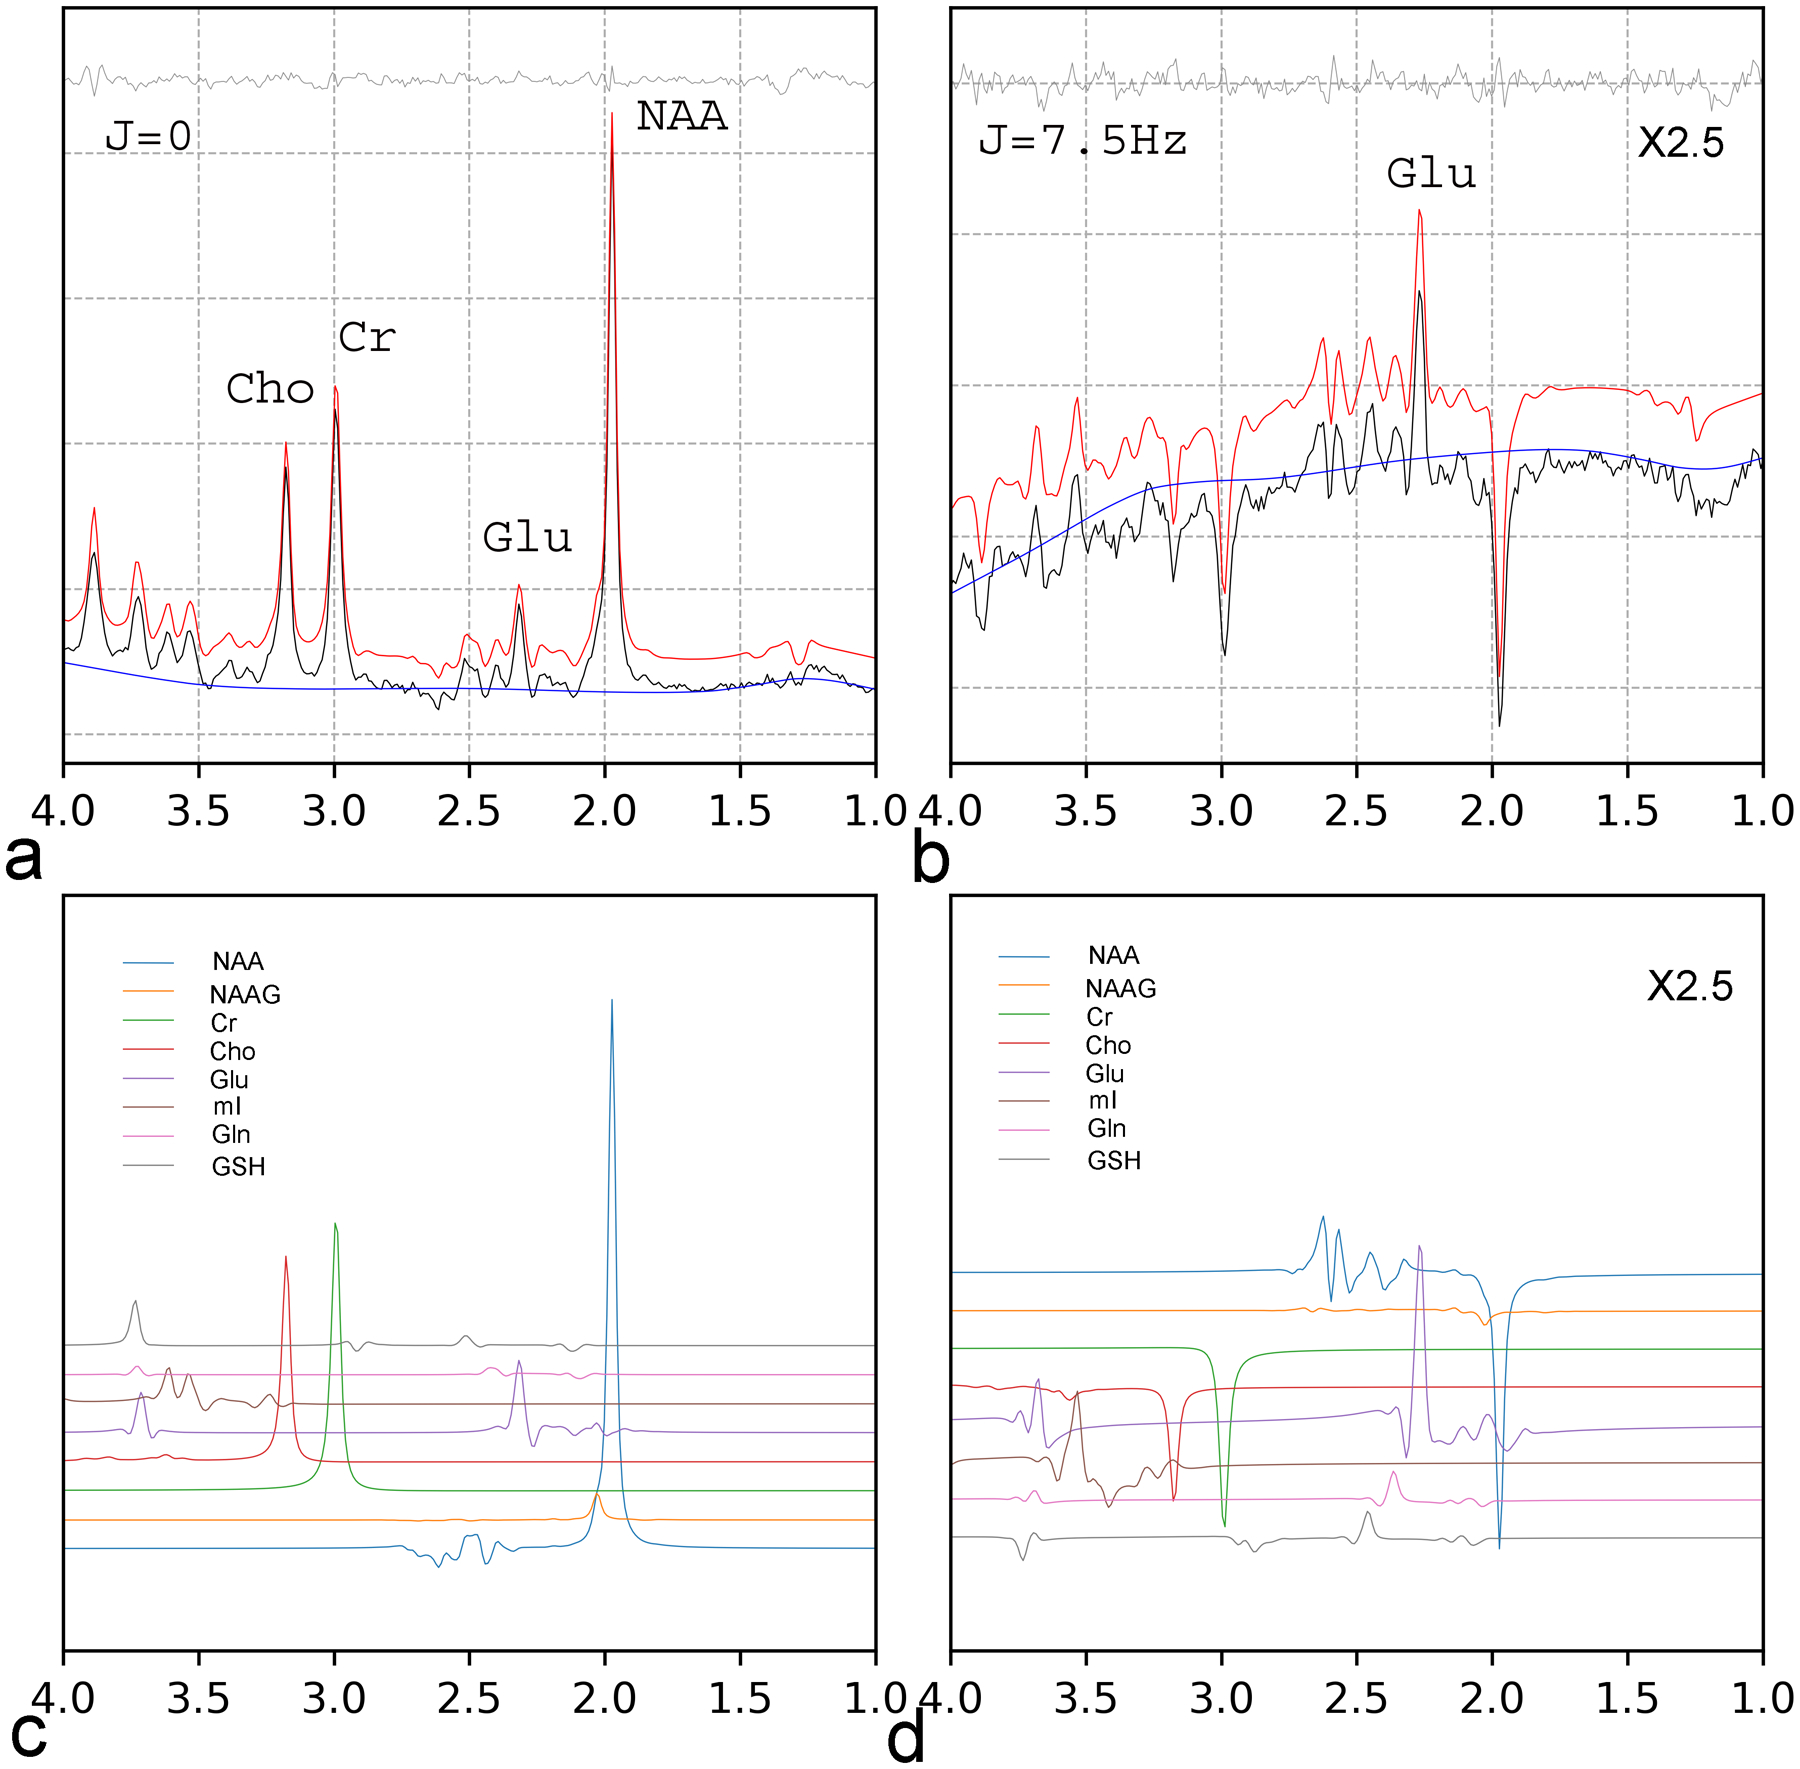
Fitting of 1D JPRESS of a female participant (age = 21 years old; voxel size = 8 mL; scan time = 5.3 mins). (a): J = 0. (b): J = 7.5 Hz. The fitted spectra (red) were vertically shifted from the in vivo spectra (black) for better visualization. The fit residuals (grey) and the baseline (blue) are placed at the top and bottom, respectively. Individual components of fitted metabolite spectra of N-acetylaspartate (NAA), N-acetylaspartylglutamate (NAAG), creatine (Cr), choline (tCho), glutamate (Glu), myo-inositol (mI), glutamine (Gln), and glutathione (GSH) are displayed in (c) and (d) for both cross-sections at J = 0 and J = 7.5 Hz. The cross-sections at J = 7.5 Hz, (b) and (d), were scaled up by 2.5 folds.
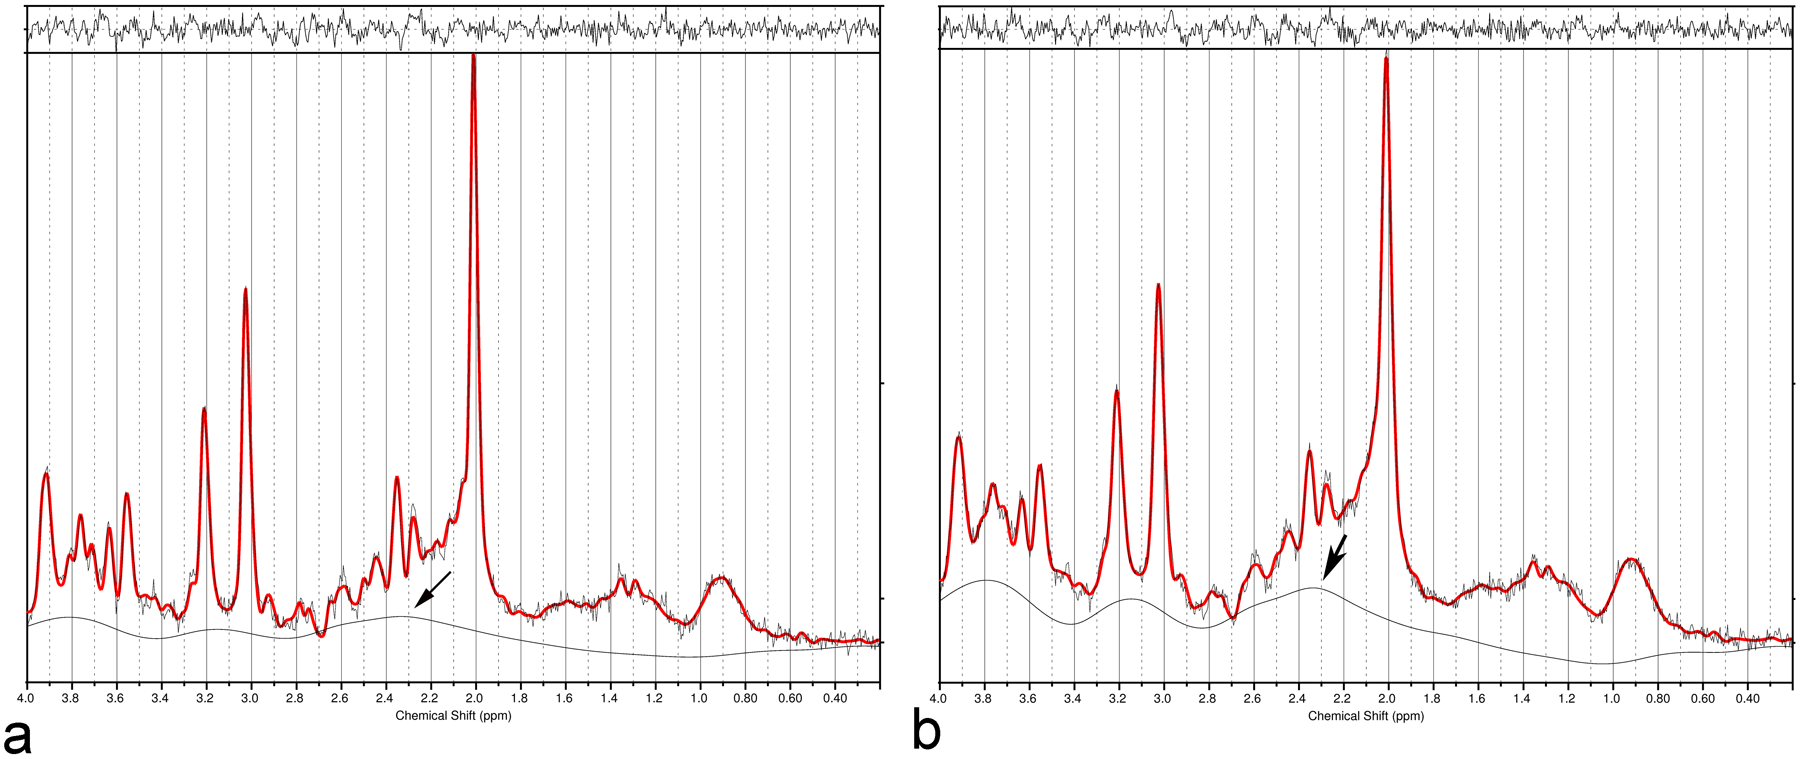
The fit differences between the original data and the noise-added data for short TE spectra are shown in Figure 3. The noise level was increased by 55% by noise injection into the original data. Although LCModel analysis included a mechanism to account for the macromolecule/lipid background, they are still visible as shown by the fit residuals. The estimated metabolite concentrations (mM) before/after the noise injection were: [Glu]=9.1/10.0, [Gln] = 3.3/3.1, [NAA] =12.4/13.0, [Cr]= 7.4/7.5, [mI] = 4.8/5.2, and [tCho] = 1.7/1.8. Overall, noise injection (Fig. 3b) led to significantly higher estimated Glu levels, concurrent with reduced baselines (arrow in Fig. 3b). Average results for the ten participants are listed in Table 1.
Fig. 3.

LCModel fitting of a short TE spectrum, with TE = 35 ms, voxel size = 8 mL, average number = 128. (a): original data; (b): in vivo data with the noise level increased by 55%. An increase in estimated glutamate (Glu) concentration from the noise-increased data is accompanied by a decrease in the estimated baseline intensity near 2.35 ppm. The arrows show the change in baseline intensity near 2.35 ppm.
Table 1.
Comparisons of estimated metabolite concentrations (mM) between the original data and the noise-added and line-broadened data for 1D JPRESS and short-TE (35 ms) MRS (n =10, mean age = 40 ± 7 years). Concentrations were averaged over the ten participants. Error ranges were indicated by standard deviation. For noise-added and line-broadened data, the noise variance and linewidth were increased by 55% and 2 Hz, respectively.
| 1D JPRESS | Short TE LCModel | |||||
|---|---|---|---|---|---|---|
| Original | Noise-added | Broadened | Original | Noise-added | Broadened | |
| Glu | 10.0±0.66 | 10.1±0.72 | 9.82±0.68 | 9.54±0.94 | 10.9±1.06 | 8.43±0.87 |
| NAA | 10.7±0.47 | 10.6±0.50 | 10.4±0.55 | 11.7±0.49 | 12.0±0.59 | 10.4±0.55 |
| tCr | 7.40±0.35 | 7.48±0.37 | 7.30±0.39 | 7.36±0.41 | 7.44±0.45 | 6.53±0.45 |
| tCho | 1.53±0.13 | 1.56±0.13 | 1.59±0.12 | 1.78±0.21 | 1.93±0.23 | 1.69±0.25 |
| Gln | 2.07±0.35 | 2.32±0.36 | 2.15±0.35 | 4.48±0.70 | 4.24±0.62 | 4.05±0.67 |
| mI | 6.16±0.48 | 5.93±0.46 | 6.05±0.52 | 4.95±0.51 | 5.30±0.45 | 4.53±0.44 |
Abbreviations: Glu: glutamate; NAA: N-acetylaspartate (NAA); tCr: total creatine; tCho: total choline; Gln: glutamine; mI: myo-Inositol.
The same level of noise was also added to the original 1D JPRESS data (see Fig. 4). The estimated metabolite concentrations before/after noise injection were: [Glu]=9.3/9.1, [Gln] = 2.1/2.2, [NAA] = 10.5/10.7, [Cr]= 7.1/7.1, [mI] = 5.9/5.6, and [tCho] = 1.4/1.5. No significant differences in estimated baselines were observed between the original data and noise-added data for both cross-sections at J = 0 and J = 7.5 Hz. The averaged results for the ten participants are given in Table 1.
Fig. 4.

Fit comparison between the original (Fig. 3a and 3b) and the noise-increased data (3c and 3d) for 1D JPRESS. Cross-sections at J =0 and J =7.5 Hz were placed on the left and right, respectively. The JPRESS data were collected from the same voxel and participant as for short TE data (Fig. 3). The noise level in 3c) and 3d) was 55% higher than that of the original data (3a and 3b). The estimated metabolite concentrations for the noised-increased data agreed well with the results of the original data, and the estimated baselines (blue lines) showed no significant differences between the original data and the noise-increased data.
The effect of different SNR levels on metabolite quantification for short TE (a) and 1D JPRESS (b) is shown in Figure 5. A series of data sets with progressively decreasing SNR were created by injecting noise into the original in vivo short-TE and JPRESS data. As shown in Figure 5a, the Glu levels estimated from the LCModel analysis of short-TE data were negatively correlated with SNR. A similar correlation was also observed for NAA although to a lesser extent. Similar correlations were not observed for 1D JPRESS (Fig. 5b). With Spearman’s rank correlation, the p values are 1.5e-6 and 2.0e-1 for short TE and 1D JPRESS, respectively.
Fig. 5.

Estimated concentrations of N-acetylaspartate (NAA), glutamine (Glu), and creatine (Cr) as a function of SNR. (a): a short-TE dataset (35 ms) with LCModel quantification. (b): 1D JPRESS data acquired from the same voxel, measuring 2.5×2.5×2.5 cm3. The SNR of the original data was decreased progressively by noise injection in the time domain. With the short TE data, Glu concentrations were negatively correlated with SNR. This trend was not observed for 1D JPRESS.
The influence of linewidth on the estimated Glu concentrations for short TE with LCModel analysis is shown in Figure 6 for the original data and the data created by 2 Hz line-broadening. The estimated concentrations before/after line-broadening were [Glu]=10.7/7.8, [Gln] = 4.6/3.7, [NAA] = 11.0/9.5, [Cr]= 6.8/5.9, [mI] = 4.9/4.4, and [tCho] = 1.6/1.3. Both Glu and NAA concentrations were significantly lower than the values obtained using the original data, and the baseline was significantly higher (near 2.35 ppm) after line-broadening. This trend became stronger when the linewidth was broadened further. Average results for the ten participants are shown in Table 1.
Fig. 6.
Fit of a short echo time (TE) (35 ms) spectrum with LCModel before (a) and after (b) 2 Hz linewidth broadening. The estimated concentrations of glutamate (Glu) and N-acetylaspartate (NAA) were significantly reduced for the line-broadened data, and the reduction was strongly correlated with the elevation of baseline around 2.35 ppm, as shown by the arrow in (b).
The same comparison for 1D JPRESS with the data created by applying a 2 Hz line-broadening window function to the original 1D JPRESS data is depicted in Figure 7. No significant differences were found between the fits of the original and the line-broadened spectra. The estimated concentrations before/after line-broadening were: [Glu] =10.2/10.2, [Gln] = 2.4/2.7, [NAA] = 10.6/10.2, [Cr] = 7.6/7.2, [mI] = 6.0/6.3, and [tCho] = 1.5/1.3. For J = 0, the baseline tilted up at the downfield end, due to the residual water peak that was also broadened by 2 Hz (Fig. 7c). Averaged results for the ten participants are listed in Table 1.
Fig. 7.
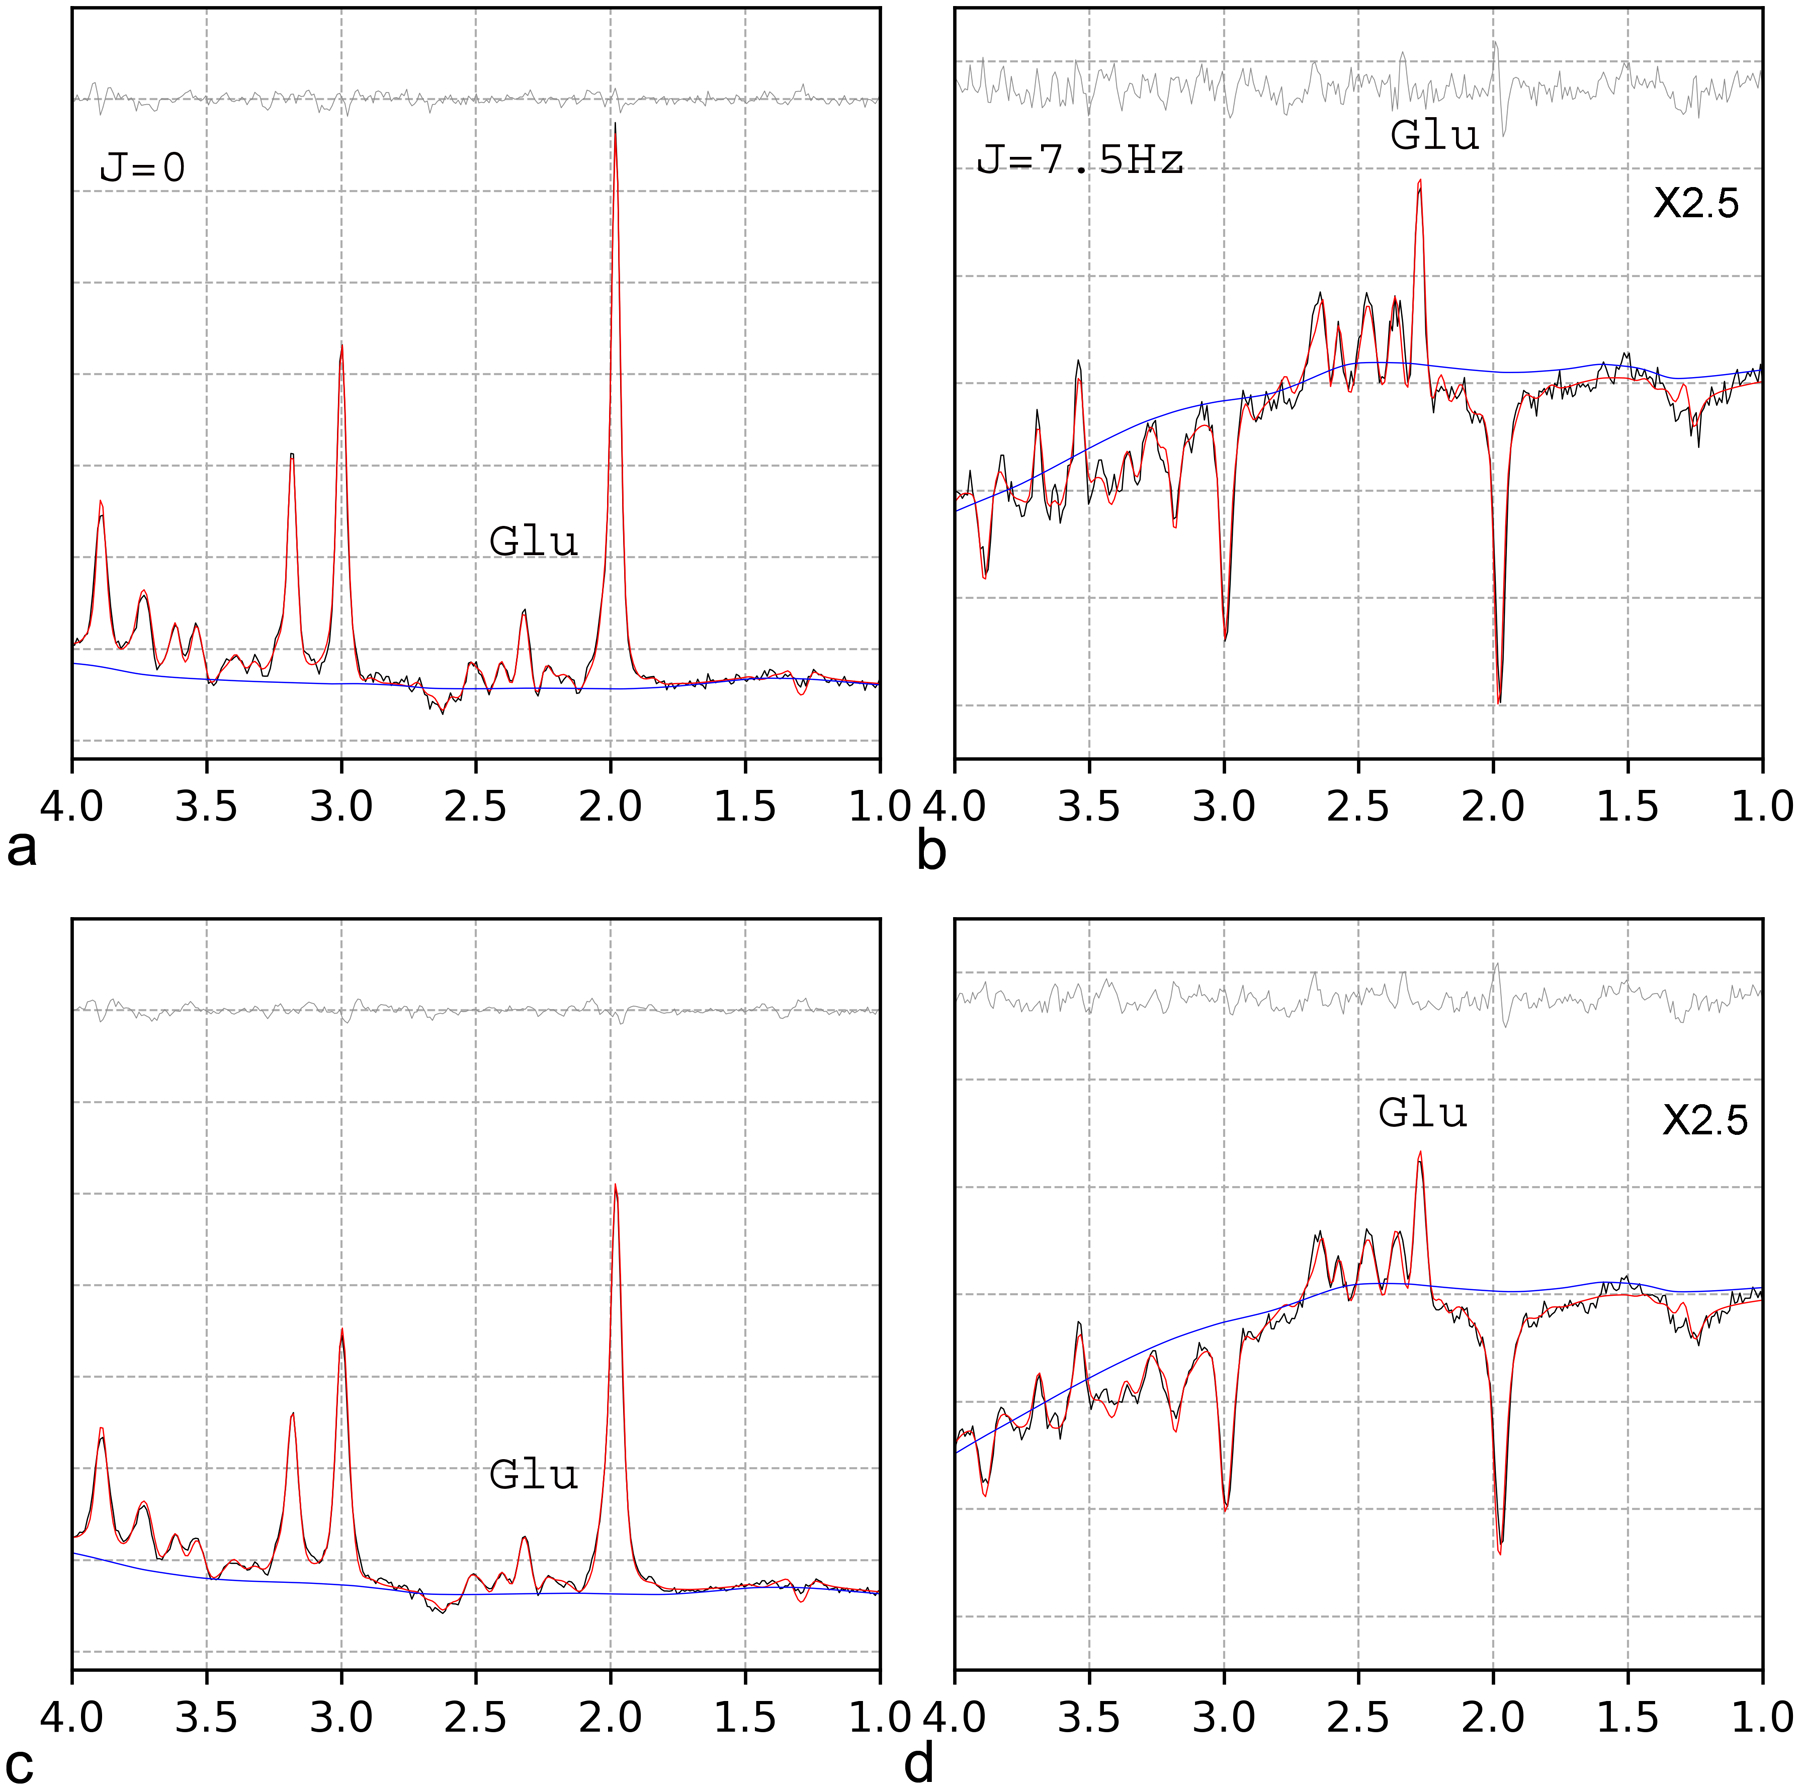
Comparison of 1D JPRESS fit of the original data (a, b) and the data created by 2 Hz line-broadening (c, d). The cross-sections at J = 0 and J = 7.5 Hz are displayed on the left (a, c) and right (b, d), respectively. No significant differences in quantification results (Table 1) were observed between the original and line-broadened spectra.
Student t-tests were performed to evaluate the Glu concentration differences between the original data and the linewidth broadened data. For comparison, the p values were 0.013 and 0.55 for short TE and 1D JPRESS, respectively.
Discussion
This study described the in vivo quantification of Glu and other metabolites using 1D JPRESS method which combined the two cross-sections at J=0 and J=7.5 Hz into a single 1D spectrum. Compared to short-TE spectroscopy analyzed using LCModel, quantification by 1D JPRESS with its enhanced spectral resolution and reduced macromolecule baselines was robust to variations in spectral SNR and linewidth.
Glu is the principal excitatory neurotransmitter and a major intermediate metabolite in the central nervous system (CNS). It is involved in glutamatergic neurotransmission via the Glu-Gln cycle between neurons and surrounding astrocytes [24]. Thus, reliable assessment of changes in Glu and other related metabolite concentrations in the human brain could provide considerable insight into brain function as well as many psychiatric and neurological diseases.
Because of its long average TE, JPRESS typically has poor SNR compared with short-TE spectroscopy. However, the significantly increased spectral resolution afforded by JPRESS allows application of a window function to boost SNR with little trade-off of spectral resolution. In this context, the SNR of all 1D JPRESS spectra was enhanced by a 2 Hz window function in the J-dimension (see Fig. 2). With this window function, the Glu peak at 2.35 ppm was still well resolved from the other metabolite resonance lines in both J cross-sections. More detailed fine spectral structures were visible in the J = 7.5 Hz cross-section (Fig. 2b). The peak at 3.75 ppm in the J =0 spectrum was attributed to Glu, Gln, and GSH, all of which show distinct spectral patterns in the J = 7.5 Hz cross-section (see the individual resonance lines of Glu, Gln, and GSH around 3.75 ppm in Fig. 2d).
The short-TE spectra analyzed by LCModel resulted in large disparities in Glu concentration following noise injection or line-broadening; these variations were significantly larger than the actual inter-subject variations. With addition of noise to the original data LCModel reports reduced baseline intensity near 2.35 ppm accompanied by elevated glutamate concentration (see Fig. 3). With line-broadening of the original data LCModel reports significant baseline elevations in regions near 3.2 ppm and 3.8 ppm (Fig. 6), and as a result, the estimated concentrations of Cr and mI were significantly lower than those estimated from the original data (Table 1). This observation echoes results from our previous study, which found that more than half of the quantification errors (variances plus biases) were due to the influence of the baseline [22].
Many methods have been proposed to mitigate spectral interference from the macromolecule baseline especially in short-TE spectra. These have included specific spectral editing of macromolecules [25], experimentally measuring the macromolecule baseline [26], and various spectral fitting approaches. The danger of overfitting the short-TE spectra has been recognized. A recent study showed that a highly flexible spline baseline led to overestimation or underestimation of metabolite concentrations and that differences of above 15% in the quantification of metabolite levels were observed for several metabolites using LCModel default settings for spline baselines in comparison to stiffer spline baselines [27]. It has also been demonstrated that there exists an optimal smoothness (i.e., the stiffness in LCModel) that minimizes baseline root-mean-square error [22].
For 1D JPRESS, the substantially reduced macromolecule baseline allowed the use of a high degree of smoothness to avoid overfitting the baseline. As the current study demonstrates, 1D JPRESS effectively reduced the interaction between the baseline and metabolite peaks and alleviated the need to introduce a macromolecule basis into the fitting model. As a result, the differences in estimated concentrations between the original data and the noise-increased and/or line-broadened data were comparable to the small inter-subject variations among healthy participants (see Table 1). Traditionally, a reproducibility test is conducted by using a single participant or a group of participants with repeated measurements. The short TE results in Table 1 showed that inter-participant deviations were much smaller than the disparities between the original data and the noise-increased and/or line-broadened data. As such, the traditional reproducibility test may not be able to identify artificial correlations between SNR/linewidth and metabolite concentrations associated with the strong background signal in short-TE MRS data as revealed in this study. In Table 1, the Gln concentrations estimated by 1 D JPRESS are significantly smaller than those obtained from LCModel. This difference is most likely due to the shorter T2 of the electrically neutral Gln [28] and the longer echo times used in 1D JPRESS.
The lack of ground truth is one of the major challenges in validating MRS quantification. The approach proposed in the current study is an attempt to circumvent this problem in the sense that data after noise injection or line-broadening still have the same in vivo concentrations. Because the data have the same metabolite concentrations as the original data, they can be paired with the original data to assess quantification reliability. A similar approach, termed as data augmentation, has been widely used for training artificial neural networks to cope with limited samples and to filter out undesired correlations. For spectral quantification, the variations of SNR and linewidth should not correlate with estimated metabolite concentrations in any forms.
Conclusion
LCModel analysis of short-TE MRS data causes artificial correlations of estimated metabolite concentration with SNR and static field inhomogeneity, the variations of both are commonly encountered in typical in vivo studies. Due to substantially reduced background signals in 1D JPRESS, the undesirable correlations with noise level and spectral linewidth were largely eliminated. 1D JPRESS is therefore a more reliable method for detecting Glu concentrations in clinical studies involving Glu abnormalities at 3 Tesla.
Acknowledgements
The authors thank Ms. Ioline Henter (NIMH) for her excellent editorial assistance.
Funding
This study was supported by the Intramural Research Program of the National Institute of Mental Health, National Institutes of Health (IRP-NIMH-NIH).
Footnotes
Declaration of Interest
The authors have no conflicts of interest to disclose, financial or otherwise.
References
- [1].Bartha R, Drost DJ, Williamson PC. Factors affecting the quantification of short echo in-vivo 1H MR spectra: prior knowledge, peak elimination, and filtering. NMR Biomed 1999; 12:205–216. [DOI] [PubMed] [Google Scholar]
- [2].Hofmann L, Slotboom J, Boesch C, Kreis R. Characterization of the macromolecule baseline in localized 1H-MR spectra of human brain. Magn Reson Med 2001; 46:855–863. [DOI] [PubMed] [Google Scholar]
- [3].Hofmann L, Slotboom J, Jung B, Maloca P, Boesch C, Kreis R. Quantitative 1H-magnetic resonance spectroscopy of human brain: Influence of composition and parameterization of the basis set in linear combination model-fitting. Magn Reson Med 2002; 48:440–453. [DOI] [PubMed] [Google Scholar]
- [4].Seeger U, Klose U, Mader I, Grodd W, Nagele T. Parameterized Evaluation of Macromolecules and Lipids in Proton MR Spectroscopy of Brain Diseases, Magn Reson Med 2003;49:19–28. [DOI] [PubMed] [Google Scholar]
- [5].Schick F, Nagele T, Klose U, et al. Lactate quantification by means of PRESS spectroscopy: influence of refocusing pulses and timing scheme. Magn Reson Imaging 1995; 13:309–19 [DOI] [PubMed] [Google Scholar]
- [6].Ryner LN, Sorenson JA, Thomas MA. Localized 2D J-resolved H-1 MR spectroscopy—strong coupling effects in vitro and in vivo, Magn. Reson. Imaging 1995; 13:853–869. [DOI] [PubMed] [Google Scholar]
- [7].Hurd R, Sailasuta N, Srinivasan R, Vigneron DB, Pelletier D, Nelson SJ. Measurement of brain glutamate using TE-averaged PRESS at 3T, Magn. Reson. Med 2004; 51:435–440. [DOI] [PubMed] [Google Scholar]
- [8].Srinivasan R, Sailasuta N, Hurd R, Nelson S, Pelletier D. Evidence of elevated glutamate in multiple sclerosis using magnetic resonance spectroscopy at 3 T. Brain 2005:128:1016–1025. [DOI] [PubMed] [Google Scholar]
- [9].Zhang Y, Shen J. Simultaneous quantification of glutamate and glutamine by J-modulated spectroscopy at 3 Tesla, Magn. Reson. Med 2016; 76:725–732. [DOI] [PMC free article] [PubMed] [Google Scholar]
- [10].de Graaf R In vivo NMR spectroscopy. New York: John Wiley & Sons; 1998. [Google Scholar]
- [11].Provencher SW. Estimation of metabolite concentrations from localized in vivo proton NMR spectra. Magn Reson Med 1993; 30:672–679. [DOI] [PubMed] [Google Scholar]
- [12].Choi C, Dimitrov IE, Douglas D, Patel A, Kaiser LG, Amezcua CA, Maher EA. Improvement of resolution for brain coupled metabolites by optimized 1H MRS at 7 T. NMR Biomed 2010;23:1044–1052. [DOI] [PubMed] [Google Scholar]
- [13].Maudsley A, Govindaraju V, Young K, Aygula Z, Pattany PM, Soher BJ, Matson GB. Numerical simulation of PRESS localized MR spectroscopy. J Magn Reson 2005; 173:54–63. [DOI] [PubMed] [Google Scholar]
- [14].Kaiser LG, Young K, Matson GB. Numerical simulations of localized high field 1H MR spectroscopy. J Magn Reson 2008; 195:67–75. [DOI] [PMC free article] [PubMed] [Google Scholar]
- [15].Soher BJ, Young K, Bernstein A, Aygula Z, Maudsley AA. GAVA: Spectral simulation for in vivo MRS applications. J Magn Reson 2007; 185:291–299. [DOI] [PMC free article] [PubMed] [Google Scholar]
- [16].Yablonskiy DA, Neil JJ, Raichle ME, Ackerman JJ, Homonuclear J coupling effects in volume localized NMR spectroscopy: pitfalls and solutions. Magn Reson Med 1998; 39:169–178. [DOI] [PubMed] [Google Scholar]
- [17].Kelley DAC, Lawrence LW, Star-Lack JM. Lactate detection at 3T: compensating J coupling effects with BASING. J Magn Reson Imaging 1999; 9:732–37. [DOI] [PubMed] [Google Scholar]
- [18].Slotboom J, Mehlkopf AF, Bovee WM. The effects of frequency-selective RF pulses on J-coupled spin-1/2 systems. J Magn Reson A 1994; 108:38–50. [Google Scholar]
- [19].Zhang Y, An L, Shen J. Fast computation of full density matrix of multispin systems for spatially localized magnetic resonance spectroscopy. Med Phys 2017; 44:4169–4178. [DOI] [PMC free article] [PubMed] [Google Scholar]
- [20].Lee KJ. General parameter relations for the Shinnar-Le Roux pulse design algorithm. J Magn Reson 2007; 186:252–258. [DOI] [PubMed] [Google Scholar]
- [21].Ernst T, Kreis R, Ross BD. Absolute quantitation of water and metabolites in human brain. I. Compartments and water. J Magn Reson B 1993; 102:1–8. [Google Scholar]
- [22].Zhang Y, Shen J. Smoothness of in vivo spectral baseline determined by mean-square error. Magn Reson Med 2014; 72:913–22. [DOI] [PMC free article] [PubMed] [Google Scholar]
- [23].Zhang Y, Shen J. Soft constraints in nonlinear spectral fitting with regularized lineshape deconvolution. Magn Reson Med 2013; 69:912–919. [DOI] [PMC free article] [PubMed] [Google Scholar]
- [24].Hertz L Intercellular metabolic compartmentation in the brain: past, present and future. Neurochem Int 2004; 45:285–296. [DOI] [PubMed] [Google Scholar]
- [25].Rothman DL, Petroff OA, Behar KL, Mattson RH. Localized 1H NMR measurements of gamma-aminobutyric acid in human brain in vivo. Proc Natl Acad Sci U S A. 1993June15;90(12):5662–6.), [DOI] [PMC free article] [PubMed] [Google Scholar]
- [26].Behar KL, Rothman DL, Spencer DD, Petroff OA. Analysis of macromolecule resonances in 1H NMR spectra of human brain. Magn Reson Med 1994;32:294–302. [DOI] [PubMed] [Google Scholar]
- [27].Giapitzakis IA, Borbath T, Murali-Manohar S, Avdievich N, Henning A. Investigation of the influence of macromolecules and spline baseline in the fitting model of human brain spectra at 9.4T. Magn Reson Med 2019;81:746–758. [DOI] [PubMed] [Google Scholar]
- [28].An L, Li S, Shen J. Simultaneous determination of metabolite concentrations, T1 and T2 relaxation times. Magn Reson Med. 2017;78:2072–2081. [DOI] [PMC free article] [PubMed] [Google Scholar]