

Abstract
Introduction:
Excess sitting is a risk factor for early mortality. This may be due, at least in part, to the displacement of physical activity (PA) with sedentary behaviors. The purpose of this observational study was to examine the mortality risk reductions associated with replacing 30 min·day−1 sitting for an equivalent duration of light (LPA) or moderate-vigorous intensity PA (MVPA).
Methods:
Participants included 37,924 men and 54,617 women in the Cancer Prevention Study-II Nutrition Cohort, among whom 14,415 men and 13,358 women died during follow-up (1999-2014). An isotemporal substitution approach to the Cox proportional hazards regression model was used to estimate adjusted hazard ratios and 95% confidence intervals (HR, 95% CI) for mortality associated with the substitution of 30 min·day−1 self-reported sitting for LPA or MVPA. Analyses were conducted in 2018.
Results:
Among the least active participants (MVPA ≤17 min/day), the replacement of 30 min·day−1 sitting with LPA was associated with a 14% mortality risk reduction (HR=0.86, 0.81-0.89) and replacement with MVPA was associated with a 45% mortality risk reduction (HR=0.55, 0.47-0.62). Similar associations were seen among moderately active participants (HR=0.94, 0.91-0.97 LPA replacement, HR=0.83, 0.76-0.88 MVPA replacement). However, for the most active (MVPA >38 min/day), substitution of sitting time with LPA or MVPA was not associated with a reduction in mortality risk (HR=1.00, 0.97-1.03, HR=0.99, 0.95-1.02, respectively).
Conclusions:
These findings suggest that the replacement of modest amounts of sitting time with even LPA may have the potential to reduce the risk of premature death among less active adults.
Introduction
Regular moderate-vigorous intensity physical activity (MVPA) is associated with a lower risk of cardiovascular disease (CVD), certain cancers, and premature death.1–3 Distinct from physical inactivity, the amount of time spent sedentary is also associated with a higher risk of morbidity and mortality.4–9 This may be due, at least in part, to the displacement of physical activities (PA) with sedentary behaviors.
There is a finite amount of time in a day, so it is necessary to consider how time spent on one behavior displaces time spent on another.10 Most previous studies explored associations with sedentary time without considering the PA it displaces, leaving a gap in our understanding of healthful time use. Using isotemporal substitution models (ISM), it is possible to estimate the mortality risk reductions associated with replacing sedentary time with an equivalent amount of PA.11,12
The primary aim of this study was to estimate the mortality risks associated with replacing 30 min·day−1 of sitting time with 30 min·day−1 of either light (LPA) or MVPA in a large prospective cohort of U.S adults over 14 years of follow-up. Secondary aims included estimating these mortality risks: 1) among low, moderate, and high active participants separately, 2) for cancer, CVD, and other causes of death, and 3) stratified by sex, age, and body mass index (BMI).
Methods
Study Population
The Cancer Prevention Study-II Nutrition Cohort (CPS-IINC) is a prospective study initiated by the American Cancer Society (ACS) in 1992, and is described elsewhere.13 CPS-II was approved by the Emory University Institutional Review Board.
Among the 151,343 men and women who completed the 1999 CPS-II NC survey, participants were excluded for: history of cancer (n=27,515), CVD (n=15,258), or lung disease (n=3,179), missing information on PA (n=3,370) or sitting time (n=2,210), reporting zero minutes of sitting time (n=147), missing/extreme (top and bottom 0.1%) BMI (n=4,445), or missing smoking status (n=113). To reduce the possibility of reverse causality due to undiagnosed illness at baseline, participants dying within the first year of follow-up (n=673) or reporting no MVPA or activities of daily living (ADLs) were also excluded (n=1,892). The remaining 92,541 participants were included in this analysis.
Measures
Average daily sitting time, LPA, and MVPA were assessed using the 1999 CPS-II NC self-administered questionnaire, which can be found on the ACS website: https://www.cancer.org/research/we-conduct-cancer-research/epidemiology/cancer-prevention-questionnaires.html.
The primary outcome was all-cause mortality ascertained through biennial linkage of the cohort with the National Death Index.14 Causes of death were classified using the International Classification of Diseases (ICD), Tenth Revision as cancer, CVD, and all other causes combined.15
Statistical Analysis
Cox proportional hazards regression modeling with an ISM framework was used to compute hazard ratios (HR) and 95% confidence intervals (CI) for the replacement of 30 min·day−1 sitting with LPA or MVPA in two models: 1) adjusted for age, sex, and total time (sitting, LPA, MVPA), and 2) adjusted for age, sex, total time, and other potential confounders. Potential confounders included: race, alcohol use, smoking, aspirin use, education, occupational status, ACS dietary guidelines adherence score,16 comorbidity score, and BMI.
Secondary analyses tested for effect modification by MVPA tertiles, sex, age, and BMI. All statistical tests were two-sided. Analyses were conducted in 2018 using SAS v.9.4 (SAS Institute, Cary, NC).
Results
During 14 years of follow-up, 14,415 men and 13,358 women died. Participants reporting more MVPA were leaner, had a higher educational attainment, and were less likely to be current smokers (Table 1). Sitting time largely included watching TV (39%) and reading (20%).
Table 1.
Baseline Characteristics of CPS-II, 1999 Survey (n = 92,541)
| Total Sitting Time Levela | Physical Activity Levelb | |||||
|---|---|---|---|---|---|---|
|
| ||||||
| High (n=31248) | Moderate (n=29566) | Low (n=31727) | Low (n=24169) | Moderate (n=36785) | High (n=31587) | |
|
|
||||||
| Total sit min·day−1 | 342 ± 113 | 159 ± 33 | 60 ± 24 | 163 ± 140 | 185 ± 131 | 206 ± 137 |
| TV sit min·day−1 | 132 ± 87 | 64 ± 37 | 22 ± 15 | 67 ± 75 | 72 ± 70 | 78 ± 71 |
| Work sit min·day−1 | 68 ± 97 | 16 ± 30 | 6 ± 11 | 29 ± 67 | 32 ± 68 | 30 ± 63 |
| Transportation sit min·day−1 | 47 ± 52 | 27 ± 20 | 13 ± 10 | 24 ± 34 | 28 ± 33 | 34 ± 39 |
| Home sit min·day−1 | 62 ± 56 | 36 ± 26 | 14 ± 11 | 30 ± 40 | 37 ± 40 | 44 ± 43 |
| Other sit min·day−1 | 43 ± 55 | 21 ± 22 | 9 ± 10 | 21 ± 38 | 24 ± 36 | 28 ± 39 |
| LPA min·day−1 | 21 ± 26 | 21 ± 24 | 16 ± 21 | 14 ± 20 | 18 ± 21 | 25 ± 28 |
| MVPA min·day−1 | 41 ± 35 | 40 ± 33 | 30 ± 29 | 7 ± 4 | 26 ± 8 | 73 ± 30 |
| Avg min·day−1 reported | 404 ± 124 | 219 ± 56 | 107 ± 49 | 185 ± 143 | 228 ± 134 | 304 ± 149 |
| Sex | ||||||
| Male | 46.9% | 39.7% | 36.4% | 37.3% | 38.0% | 47.3% |
| Female | 53.1% | 60.3% | 63.6% | 62.7% | 62.0% | 52.7% |
| Age | 68.1 ± 6.2 | 68.8 ± 5.9 | 69.6 ± 6.0 | 69.3 ± 6.4 | 68.8 ± 6.1 | 68.5 ± 5.9 |
| Race/Ethnicity | ||||||
| White | 97.6% | 97.8% | 96.8% | 97.0% | 97.6% | 97.6% |
| Other | 2.4% | 2.2% | 3.2% | 3.0% | 2.4% | 2.4% |
| BMI | 26.7 ± 4.6 | 26.0 ± 4.2 | 26.0 ± 4.3 | 27.2 ± 4.9 | 26.2 ± 4.3 | 25.7 ± 3.9 |
| Education | ||||||
| Less than college grad | 54.2% | 57.3% | 65.9% | 66.9% | 59.7% | 52.7% |
| College and beyond | 45.2% | 42.0% | 33.4% | 32.4% | 39.7% | 46.7% |
| Missing | 0.6% | 0.7% | 0.7% | 0.7% | 0.6% | 0.6% |
| Alcoholic drinks·day−1 | ||||||
| Non-drinker | 33.7% | 36.2% | 39.3% | 42.5% | 37.5% | 30.5% |
| <1 | 30.3% | 31.1% | 28.8% | 25.7% | 31.0% | 32.2% |
| 1 | 11.1% | 11.1% | 9.2% | 7.2% | 10.1% | 13.4% |
| >1 | 9.2% | 8.0% | 7.1% | 6.3% | 7.5% | 10.1% |
| Missing | 15.7% | 13.6% | 15.6% | 18.3% | 13.9% | 13.8% |
| Smoke status | ||||||
| Never | 46.8% | 50.2% | 51.0% | 50.5% | 50.2% | 47.4% |
| Former | 45.7% | 43.6% | 41.4% | 40.0% | 43.3% | 46.6% |
| Current | 7.5% | 6.2% | 7.6% | 9.5% | 6.5% | 6.0% |
| Diet Score c | 4.3 ± 1.9 | 4.5 ± 1.9 | 4.4 ± 1.9 | 3.9 ± 1.9 | 4.3 ± 1.9 | 4.7 ± 1.9 |
| Comorbidity Score d | 0.7 ± 0.8 | 0.7 ± 0.8 | 0.7 ± 0.8 | 0.7 ± 0.8 | 0.7 ± 0.8 | 0.7 ± 0.7 |
Values are presented as % or Mean ± SD;
Sitting time categories split into approximate tertiles: high sitting > 219 min/day, medium sitting ≤ 219 min/day to > 103 min/day, low sitting ≤ 103 min/day;
Physical Activity level categories split into approximate tertiles: low active ≤ 17 MVPA min/day, moderate active > 17 to ≤ 38 MVPA min/day, high active > 38 MVPA min/day.
ACS dietary guidelines adherence score(16).
Comorbidity score reflects the number of comorbidities, including high blood pressure, diabetes, and high cholesterol (0, 1, ≥2 comorbidities). CPS-II = Cancer Prevention Study-II.
Overall, reallocation of 30 min·day−1 of sitting to LPA (HR=0.94, 95% CI 0.92-0.96) or MVPA (HR=0.92, 0.90-0.93) was associated with significant reductions in mortality risk. However, there was significant variation by underlying MVPA level (Figure 1). In the stratified analysis, replacement of sitting with LPA was associated with a reduced mortality risk for only low (HR=0.86, 0.81-0.89) and moderately (HR=0.94, 0.91-0.97) active participants, but not high active participants. Benefits were greater when replacing sitting time with MVPA (HR=0.55, 0.47-0.62 low active; HR=0.83, 0.76-0.88 moderate active). Results for grouped causes of death were similar (Table 2).
Figure 1. Estimated risk (HR) for all-cause mortality associated with replacement of 30 minutes of sitting time with physical activity.
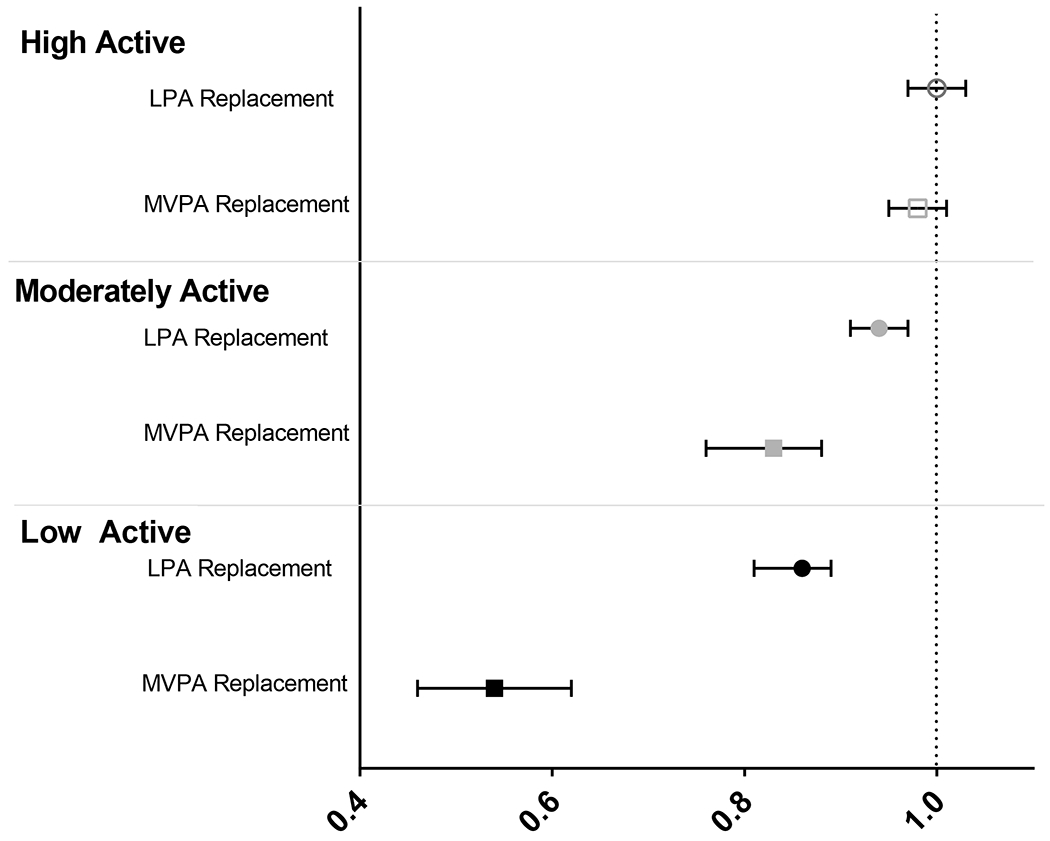
Models adjust for age (continuous), sex, race (white, other), alcohol use (non-drinker, <1, 1, ≥2 drinks/day, unknown), smoking status (never, current, former), years since quitting among former smokers (<10, 10-19, ≥ 20 years), cigarette frequency and smoking duration among current smokers (<20 cigarettes/day for ≤35 years, <20 cigarettes/day for >35 years, 20+ cigarettes/day for ≤35 years, 20+ cigarettes/day for >35 years), aspirin use (non-user, <15, 15-29, 30+ pills/month, unknown), education (high school or some college, college graduate or higher, unknown), occupational status (employed, not employed/retired), ACS dietary guidelines adherence score (0-<3, 3-<6, ≥6, unknown),16 comorbidity score (0, 1, ≥2 comorbidities, including high blood pressure, diabetes, and high cholesterol), and BMI (continuous, [kg/m2]). MVPA categories split into approximate tertiles: low active ≤ 17 MVPA min/day, moderate active > 17 to ≤ 38 MVPA min/day, high active > 38 MVPA min/day.
Table 2.
Multivariable adjusted HR (95% CI) of mortality associated with replacement of sitting time
| Activity Level (HR (95% CI))b | ||||
|---|---|---|---|---|
|
| ||||
| Low active | Moderate active | High active | ||
|
|
||||
| Cancer | No. deaths = 2085 | No. deaths = 2904 | No. deaths = 2528 | pint. a |
| Model 1 | ||||
| Replace with LPA | 0.90 (0.83-0.97) | 0.91 (0.88-0.97) | 1.01 (0.99-1.07) | |
| Replace with MVPA | 0.53 (0.39-0.70) | 0.81 (0.70-0.93) | 1.00 (0.97-1.06) | |
| Model 2 | ||||
| Replace with LPA | 0.91 (0.85-0.97) | 0.94 (0.89-0.98) | 1.03 (0.98-1.06) | 0.0026 LPA |
| Replace with MVPA | 0.69 (0.51-0.94) | 0.83 (0.74-0.96) | 1.00 (0.97-1.05) | 0.0004 MVPA |
| CVD | No. deaths = 3009 | No. deaths = 3548 | No. deaths = 2678 | |
| Model 1 | ||||
| Replace with LPA | 0.81 (0.76-0.86) | 0.91 (0.86-0.95) | 1.00 (0.96-1.06) | |
| Replace with MVPA | 0.44 (0.34-0.56) | 0.76 (0.67-0.86) | 0.99 (0.95-1.03) | |
| Model 2 | ||||
| Replace with LPA | 0.83 (0.79-0.89) | 0.91 (0.88-0.96) | 1.00 (0.97-1.07) | <0.0001 LPA |
| Replace with MVPA | 0.53 (0.41-0.68) | 0.83 (0.72-0.94) | 0.99 (0.95-1.04) | <0.0001 MVPA |
| All other causes | No. deaths = 3722 | No. deaths = 4227 | No. deaths = 3072 | |
| Model 1 | ||||
| Replace with LPA | 0.83 (0.78-0.89) | 0.94 (0.90-1.00) | 0.97 (0.94-1.01) | |
| Replace with MVPA | 0.40 (0.32-0.49) | 0.79 (0.70-0.88) | 0.96 (0.93-0.99) | |
| Model 2 | ||||
| Replace with LPA | 0.83 (0.79-0.89) | 0.94 (0.90-0.98) | 0.97 (0.94-1.01) | <0.0001 LPA |
| Replace with MVPA | 0.48 (0.37-0.59) | 0.80 (0.72-0.91) | 0.96 (0.93-1.00) | <0.0001 MVPA |
Model 1: adjusts for age (continuous) and sex; Model 2: adjusts for age, sex, race (white, other), alcohol use (non-drinker, <1, 1, ≥2 drinks/day, unknown), smoking status (never, current, former), years since quitting among former smokers (<10, 10-19, ≥ 20 years), cigarette frequency and smoking duration among current smokers (<20 cigarettes/day for ≤35 years, <20 cigarettes/day for >35 years, 20+ cigarettes/day for ≤35 years, 20+ cigarettes/day for >35 years), aspirin use (non-user, <15, 15-29, 30+ pills/month, unknown), education (high school or some college, college graduate or higher, unknown), occupational status (employed, not employed/retired), ACS dietary guidelines adherence score (0-<3, 3-<6, ≥6, unknown),(17) comorbidity score (0, 1, ≥2 comorbidities, including high blood pressure, diabetes, and high cholesterol), and BMI (continuous, [kg/m2]).
p value for interaction by PA category, boldface indicates statistical significance (p<0.01).
Physical Activity level categories split into approximate tertiles: low active ≤ 17 MVPA min/day, moderate active > 17 to ≤ 38 MVPA min/day, high active > 38 MVPA min/day.
HR = hazard ratio; CI = confidence interval; CVD = cardiovascular disease.
Given the significant interaction by underlying MVPA, analyses by sex, age, and BMI were restricted to the low and moderately active groups (Table 3). Results were similar when stratified on sex and BMI. However, significant interactions by age revealed larger mortality benefits for older adults when sitting was replaced with LPA.
Table 3.
Stratified multivariable adjusted HR (95% CI) of mortality associated with replacement of sitting time
| All-Cause HR (95% CI) | Cancer HR (95% CI) | CVD HR (95% CI) | Other HR (95% CI) | |
|---|---|---|---|---|
| Men (n=22978) | No. deaths=9469 | No. deaths=2409 | No. deaths=3282 | No. deaths=3778 |
| Replace with LPA | 0.91 (0.89-0.93) | 0.91 (0.88-0.98) | 0.88 (0.83-0.91) | 0.93 (0.88-0.97) |
| Replace with MVPA | 0.74 (0.70-0.78) | 0.88 (0.77-0.97) | 0.73 (0.67-0.81) | 0.66 (0.60-0.71) |
| Women (n=37976) | No. deaths=10026 | No. deaths=2580 | No. deaths=3275 | No. deaths=4171 |
| Replace with LPA | 0.89 (0.85-0.92) | 0.92 (0.86-1.00) | 0.89 (0.82-0.94) | 0.84 (0.81-0.89) |
| Replace with MVPA | 0.76 (0.71-0.81) | 0.86 (0.78-0.96) | 0.76 (0.68-0.82) | 0.69 (0.63-0.76) |
| pinta: 0.13 LPA, 0.55 MVPA | pint: 0.89 LPA, 0.86 MVPA | pint: 0.76 LPA, 0.81 MVPA | pint: 0.01 LPA, 0.34 MVPA | |
| Age < 65 (n=15375) | No. deaths=1742 | No. deaths=793 | No. deaths=396 | No. deaths=553 |
| Replace with LPA | 0.94 (0.88-1.01) | 0.94 (0.83-1.04) | 0.97 (0.83-1.13) | 0.91 (0.79-1.06) |
| Replace with MVPA | 0.73 (0.66-0.86) | 0.80 (0.66-0.97) | 0.81 (0.62-1.06) | 0.64 (0.50-0.80) |
| Age 65-<75 (n=33152) | No. deaths=9825 | No. deaths=2838 | No. deaths=3033 | No. deaths=3954 |
| Replace with LPA | 0.90 (0.88-0.94) | 0.91 (0.86-0.97) | 0.89 (0.83-0.94) | 0.91 (0.88-0.97) |
| Replace with MVPA | 0.74 (0.70-0.79) | 0.86 (0.76-0.94) | 0.74 (0.65-0.81) | 0.69 (0.64-0.76) |
| Age ≥ 75 (n=12427) | No. deaths=7928 | No. deaths=1358 | No. deaths=3128 | No. deaths=3442 |
| Replace with LPA | 0.88 (0.85-0.92) | 1.00 (0.83-1.11) | 0.86 (0.81-0.92) | 0.86 (0.80-0.91) |
| Replace with MVPA | 0.74 (0.70-0.79) | 0.97 (0.88-1.06) | 0.76 (0.68-0.83) | 0.65 (0.60-0.72) |
| pint: 0.04 LPA, 0.19 MVPA | pint: 0.50 LPA, 0.15 MVPA | pint: 0.11 LPA, 0.41 MVPA | pint: 0.04 LPA, 0.26 MVPA | |
| Normal weight BMI (n=24663) | No. deaths=8173 | No. deaths=1907 | No. deaths=2678 | No. deaths=3588 |
| Replace with LPA | 0.89 (0.86-0.94) | 0.91 (0.86-1.01) | 0.88 (0.82-0.94) | 0.88 (0.86-0.94) |
| Replace with MVPA | 0.70 (0.66-0.74) | 0.89 (0.79-0.99) | 0.68 (0.61-0.76) | 0.62 (0.56-0.68) |
| Overweight BMI (n=24575) | No. deaths=7645 | No. deaths=2113 | No. deaths=2562 | No. deaths=2970 |
| Replace with LPA | 0.91 (0.88-0.94) | 0.94 (0.88-0.98) | 0.88 (0.83-0.94) | 0.91 (0.86-0.97) |
| Replace with MVPA | 0.78(0.74-0.86) | 0.86 (0.76-0.97) | 0.81 (0.72-0.89) | 0.74 (0.68-0.83) |
| Obese BMI (n=11716) | No. deaths=3677 | No. deaths=969 | No. deaths=1317 | No. deaths=1391 |
| Replace with LPA | 0.89 (0.83-0.94) | 0.91 (0.81-1.00) | 0.86 (0.79-0.97) | 0.89 (0.81-0.97) |
| Replace with MVPA | 0.74 (0.67-0.81) | 0.83 (0.70-0.99) | 0.74 (0.64-0.86) | 0.70 (0.60-0.80) |
| pint: 0.68 LPA, 0.05 MVPA | pint: 0.98 LPA, 0.57 MVPA | pint: 0.57 LPA, 0.23 MVPA | pint: 0.83 LPA, 0.04 MVPA |
Models adjust for age (continuous), sex, race (white, other), alcohol use (non-drinker, <1, 1, ≥2 drinks/day, unknown), smoking status (never, current, former), years since quitting among former smokers (<10, 10-19, ≥ 20 years), cigarette frequency and smoking duration among current smokers (<20 cigarettes/day for ≤35 years, <20 cigarettes/day for >35 years, 20+ cigarettes/day for ≤35 years, 20+ cigarettes/day for >35 years), aspirin use (non-user, <15, 15-29, 30+ pills/month, unknown), education (high school or some college, college graduate or higher, unknown), occupational status (employed, not employed/retired), ACS dietary guidelines adherence score (0-<3, 3-<6, ≥6, unknown),(17) comorbidity score (0, 1, ≥2 comorbidities, including high blood pressure, diabetes, and high cholesterol), and BMI (continuous, [kg/m2]). Only moderate and low active participants included (n=60,954).
p value for interaction by PA category, boldface indicates statistical significance (p<0.05).
HR = hazard ratio; CI = confidence interval; CVD = cardiovascular disease.
Discussion
In this large prospective study, replacement of 30 min·day−1 of sitting with LPA or MVPA was associated with lower mortality risk, but results varied substantially by underlying MVPA level. Among low to moderately active adults (MVPA ≤38 min/day), replacing sitting with LPA was associated with a reduction in cancer, CVD, and all-cause mortality. Additionally, replacement of sitting with MVPA resulted in larger mortality benefits. However, among the highly active participants, the same reallocation of sitting to LPA or MVPA was not associated with additional mortality benefits.
Application of the ISM in this study revealed a significant association of reallocation of sitting time to LPA with mortality in low and moderately active participants. This finding is relevant to public health as LPA may be more attainable for certain groups failing to meet PA guidelines (e.g., older adults), and suggests an important strategy for gaining further health benefits from PA for many already engaging in MVPA. This study was one of the first to explore the role of age on the replacement of sitting time and found that older adults may benefit more from the replacement of sitting time with LPA. However, it is possible that the assessed LPAs may be of higher relative intensity for adults over age 65 years, resulting in larger than expected mortality risk estimates. It is also possible that participation in purposeful, leisure-time PA later in life may represent better general health.
Strengths and Limitations
Strengths of this study include the prospective design with long follow-up, a large sample size, and the use of a statistical approach which allows for the consideration of displaced activities. Nonetheless, it is important to note that these risk estimates are modeled using the ISM framework and are not describing associations of actual changes in behavior.
This study relied on self-reported PA and sitting time, which may be over- or underestimated and may not account for all waking hours. Another limitation is the lack of information on certain ADLs (e.g., cleaning, self-care, cooking) that are particularly common for older adults. Finally, participants are predominately white and educated, and therefore may not represent the general U.S. population.
Conclusions
Among the least and moderately active, replacing 30 min·day−1 of sitting with 30 min·day−1 of LPA or MVPA was associated with longevity, and reallocating sitting time to MVPA provided the most benefit for time invested. As many adults do not engage in any MVPA, evidence of associated benefits for LPA highlights the potential for targeting lower intensity PA behaviors to improve health.
Acknowledgements
The American Cancer Society funds the creation, maintenance, and updating of the Cancer Prevention Study-II. The authors express sincere appreciation to all Cancer Prevention Study-II participants and to each member of the study and biospecimen management group.
Footnotes
Publisher's Disclaimer: Disclaimer
Article contents have not been previously presented elsewhere. No financial disclosures were reported by the authors of this paper. The views expressed here are those of the authors and do not necessarily represent the American Cancer Society or the American Cancer Society – Cancer Action Network.
Conflict of interest statement: Authors declare no conflict of interest.
Financial disclosure: No financial disclosures were reported by the authors of this paper.
References
- 1.Arem H, Moore SC, Patel A, et al. Leisure time physical activity and mortality: A detailed pooled analysis of the dose-response relationship. JAMA Intern Med. 2015;175(6):959–67. [DOI] [PMC free article] [PubMed] [Google Scholar]
- 2.Moore SC, Lee IM, Weiderpass E, et al. Association of leisure-time physical activity with risk of 26 types of cancer in 1.44 million adults. JAMA Intern Med. 2016;176(6):816–25. [DOI] [PMC free article] [PubMed] [Google Scholar]
- 3.Moore SC, Patel AV, Matthews CE, et al. Leisure time physical activity of moderate to vigorous intensity and mortality: a large pooled cohort analysis. PLoS Med. 2012;9(11):e1001335. [DOI] [PMC free article] [PubMed] [Google Scholar]
- 4.Ekelund U, Steene-Johannessen J, Brown WJ, et al. Does physical activity attenuate, or even eliminate, the detrimental association of sitting time with mortality? A harmonised meta-analysis of data from more than 1 million men and women. Lancet (London, England). 2016;388(10051):1302–10. [DOI] [PubMed] [Google Scholar]
- 5.Healy GN, Wijndaele K, Dunstan DW, et al. Objectively measured sedentary time, physical activity, and metabolic risk: The Australian Diabetes, Obesity and Lifestyle Study (AusDiab). Diabetes Care. 2008;31(2):369–71. [DOI] [PubMed] [Google Scholar]
- 6.Matthews CE, George SM, Moore SC, et al. Amount of time spent in sedentary behaviors and cause-specific mortality in US adults. Am J Clin Nutr. 2012;95(2):437–45. [DOI] [PMC free article] [PubMed] [Google Scholar]
- 7.Patel AV, Bernstein L, Deka A, et al. Leisure time spent sitting in relation to total mortality in a prospective cohort of US adults. Am J Epidemiol. 2010;172(4):419–29. [DOI] [PMC free article] [PubMed] [Google Scholar]
- 8.Hu FB, Li TY, Colditz GA, Willett WC, Manson JE. Television watching and other sedentary behaviors in relation to risk of obesity and type 2 diabetes mellitus in women. JAMA. 2003;289(14):1785–91. [DOI] [PubMed] [Google Scholar]
- 9.Keadle SK, Moore SC, Sampson JN, Xiao Q, Albanes D, Matthews CE. Causes of death associated with prolonged TV viewing: NIH-AARP Diet and Health Study. Am J Prev Med. 2015;49(6):811–21. [DOI] [PMC free article] [PubMed] [Google Scholar]
- 10.Gomersall SR, Norton K, Maher C, English C, Olds TS. In search of lost time: When people undertake a new exercise program, where does the time come from? A randomized controlled trial. J Sci Med Sport. 2015;18(1):43–8. [DOI] [PubMed] [Google Scholar]
- 11.Mekary RA, Lucas M, Pan A, et al. Isotemporal substitution analysis for physical activity, television watching, and risk of depression. Am J Epidemiol. 2013;178(3):474–83. [DOI] [PMC free article] [PubMed] [Google Scholar]
- 12.Mekary RA, Willett WC, Hu FB, Ding EL. Isotemporal substitution paradigm for physical activity epidemiology and weight change. Am J Epidemiol. 2009;170(4):519–27. [DOI] [PMC free article] [PubMed] [Google Scholar]
- 13.Calle EE, Rodriguez C, Jacobs EJ, et al. The American Cancer Society Cancer Prevention Study II Nutrition Cohort: rationale, study design, and baseline characteristics. Cancer. 2002;94(9):2490–501. [DOI] [PubMed] [Google Scholar]
- 14.Calle EE, Terrell DD. Utility of the National Death Index for ascertainment of mortality among cancer prevention study II participants. Am J Epidemiol. 1993;137(2):235–41.25. [DOI] [PubMed] [Google Scholar]
- 15.Bramer GR. International statistical classification of diseases and related health problems. Tenth revision. World Health Stat Q. 1988;41(1):32–6.26. [PubMed] [Google Scholar]
- 16.McCullough ML, Patel AV, Kushi LH, et al. Following cancer prevention guidelines reduces risk of cancer, cardiovascular disease, and all-cause mortality. Cancer Epi Biomarkers Prev. 2011;20(6):1089–97. [DOI] [PubMed] [Google Scholar]