

Abstract
OBJECTIVE:
Headaches represent 0.9% to 2.6% of visits to a pediatric emergency department (PED). We noted a trend of increasing visits for headache in our tertiary care PED and sought to further characterize this trend.
METHODS:
We identified PED visits with International Classification of Disease, Ninth Revision, Clinical Modification diagnoses for headache at 25 hospitals in Pediatric Health Information System between 2003 and 2013. To further characterize demographics and treatment trends over time we used the electronic health record in our emergency department to identify children ages four to 18 between January 2007 and December 2014 with International Classification of Disease, Ninth Revision codes for headache: a random sample of 50 visits per year were chosen for chart review.
RESULTS:
Pediatric Health Information System visits for headache increased by 166% (18,041 in 2003 and 48,020 in 2013); by comparison, total PED visits increased by 57.6%. The percent admission increased by 300% (2020 admissions in 2003 and 8087 admissions in 2013). At our hospital, headache visits increased 111% from 896 visits in 2007 to 1887 visits in 2014; total PED visits increased 30.2%. The admission percentage for headache increased 187% with 156 admissions in 2007 and 448 in 2014. Management over time differed in the frequency of head computed tomography which decreased 3.7% per year (r = −0.93, 95% CI −0.99, −0.64) from 34% in 2007 to 18% in 2014.
CONCLUSION:
Pediatric emergency department visits for headache are increasing and a growing proportion of these patients are admitted. This finding identifies a potential patient population to target for interventions to improve outpatient management and reduce pediatric emergency department utilization.
Keywords: Pediatric, Headache, Emergency department, Trend, Imaging
Introduction
Recurrent or severe headaches affect from 10%1 to 51%2,3 of children in the United States. The prevalence of headaches can be even higher in adolescents, ranging from 21%4 to 82%.3 Of pediatric patients suffering from headache, 35% present to an emergency department (ED) for any reason at least once per year, compared with 17% of the general pediatric population without headaches.1 Pediatric patients with headache have a higher rate of hospitalization for any reason (5.1% per year) compared with their peers without headache (1.7% per year).1 In a pediatric emergency department (PED), nontraumatic, nonfebrile headaches represent 0.9%5 to 2.6%2 of visits. Admission percentages for headache range from 0.2%5 to 15% in PEDs.6 Thus pediatric headaches represent a significant burden upon patients, families, and the health care system.
The data presented by Straube et al. 2013 show that the prevalence of headaches in the pediatric population is increasing, however this conclusion is not commented on in the article which was focused on increased computed tomography (CT) utilization in EDs.3 Furthermore, an investigation of the National Hospital Ambulatory Medical Care Survey has suggested that pediatric ED visits for headache have increased from 1995 to 2008.7 Subjectively, we observed an increase in headache visits in our tertiary care PED. The objectives of this study were to quantify the increasing burden of headache visits seen in 25 pediatric emergency departments within the Pediatric Health Information System (PHIS) database and to characterize changes in the demographic profile, management and disposition of pediatric patients with headache within a single tertiary care PED from 2007 to 2014.
Methods
PHIS Data
PHIS is an administrative database containing data from 43 tertiary care pediatric hospitals in the United States. Participating hospitals submit de-identified data including demographics, procedures, medication administration, imaging, laboratories, and International Classification of Disease, Ninth Revision, Clinical Modification (ICD-9-CM) diagnoses. We included PED visits, between 2003 and 2013 for ICD-9-CM diagnoses of headache or migraine, and excluded diagnoses of traumatic brain injury and brain tumor. We analyzed the data from the 25 hospitals contributing data during all 11 years of our analysis (see supplemental file). The University of Pittsburgh institutional review board approved this activity and waived the requirement for informed consent.
Single Site Data
We obtained single site data from encounters in the PED at a single tertiary care hospital, Children's Hospital of Pittsburgh of UPMC, with an annual volume of approximately 85,000 visits. The hospital has a wide referral base and serves an urban, suburban, and large surrounding rural population.
Through a query of our electronic health record repository, we identified children aged four to 18 years visiting the PED between January 2007 and December 2014 with ICD-9-CM codes for headache and migraine. Exclusion codes for traumatic brain injury and brain tumor were applied but did not result in exclusions. The total number of patients meeting ICD-9 code criteria was too large for chart review of individual patients, so 50 visits per year were randomly selected using IBM SPSS Statistics Version 23 to further characterize demographics and management. Patient inclusion was determined by chart review performed by one of three reviewers. Visits were deemed ineligible if the presenting chief complaint was not headache or the patient was not diagnosed with a headache. Patients were also deemed ineligible if they were diagnosed with a brain tumor, traumatic brain injury, bacterial meningitis, or ventricular-peritoneal shunt malfunction. Chart review of a subsample of patients narrowed the study population to patients managed in the ED for headache and excluded patients who developed headache during their hospitalizations. We replaced ineligible visits in the 50-patient chart review with eligible visits of the same year randomly selected by SPSS.
Data Collection
We completed a standard data collection instrument for each patient using information from the electronic health record. Data were entered into SPSS database for analysis. Three investigators extracted the data, including the following variables: age, gender, race, ethnicity, chief complaint, head injury within 48 hours, history of concussion, past medical history, prehospital medication, fever ≥38.5°C, head imaging obtained during the encounter, historical head imaging, pharmacologic therapy received in PED, diagnosis, admission status, and length of admission. Since all the charts of the sample patients were individually reviewed, patients were excluded if they were not diagnosed with a headache in the ED. Additionally, reviewers were able to confirm that diagnostic testing and treatments were administered in the ED, rather than in the inpatient setting. We divided the 50 patients from each year amongst the three data extractors to minimize temporal bias in data extraction.
Data Analysis
We conducted statistical analysis through IBM SPSS Statistics 23. Statistical significance was defined as a P ≤ 0.05. A Pearson's coefficient was calculated for the number of ineligible visits over the study period. We multiplied the percentage of eligible visits per year in the 50-patient chart review by the number of total visits with ICD-9 codes for headache to produce an adjusted number of visits. The adjusted number of headache admissions per year was determined by multiplying the adjusted number of headache visits per year by the admission percentage of the 50-patient chart review per year. We described the final sample by frequency and averages of the studied variables. The variables were analyzed for associations with chi square and ANOVA, and the variables of the sample of headache visits were correlated with years by Spearman's coefficient. Confidence intervals of Spearman's coefficient were calculated using a calculator available at http://www.vassarstats.net/rho.html.8
The hospital's institutional review board approved this study.
Results
PHIS Data
Between 2003 and 2013, there were 18,754,119 PED visits to 25 pediatric hospitals in the PHIS dataset. Of those, 1.8% received the diagnosis of headache and 14.6% of these patients were admitted to the hospital. Visits for headache increased by 166% (18,041 in 2003 and 48,020 in 2013); by comparison, total PED visits increased by 57.6% (1,348,252 in 2003 and 2,125,337 in 2013) (Fig 1). Therefore visits for headache increased from 13.4 per 1000 ED visits in 2003 to 22.6 per 1000 ED visits in 2013. For those patients with a headache diagnosis, the percentage of admission increased by 300% (2020 admissions in 2003 and 8087 admissions in 2013) (Table 1 and Fig 2).
FIGURE 1.

Relative changes in headache and total PED visit rates over time. The graphing of percent change number of total and headache PED visits shows that the increase in visits for headaches is not merely accounted for by the increase in total PED visits. PED, pediatric emergency department.
TABLE 1.
Summary of Headache Visits and Admissions at 25 Pediatric Emergency Departments
| PED Visit Year | Total PED Visits | Total Headache Visits (% of Total PED Visits) |
Total Headache Admissions from PED (% of Headache Visits) |
|---|---|---|---|
| 2003 | 1348252 | 18041 (1.3) | 2020 (11.2) |
| 2004 | 1279177 | 18567 (1.5) | 2393 (12.9) |
| 2005 | 1400826 | 20342 (1.5) | 2783 (13.7) |
| 2006 | 1448147 | 20474 (1.4) | 2958 (14.4) |
| 2007 | 1540838 | 22364 (1.5) | 3595 (16.1) |
| 2008 | 1628489 | 25461 (1.6) | 4088 (16.1) |
| 2009 | 1964735 | 37770 (1.9) | 4842 (12.8) |
| 2010 | 1883899 | 38561 (2.1) | 5412 (14.0) |
| 2011 | 1993073 | 44593 (2.2) | 6336 (14.2) |
| 2012 | 2141346 | 47096 (2.2) | 7220 (15.3) |
| 2013 | 2125337 | 48020 (2.3) | 8087 (16.8) |
| Difference, No.(%)* | 777085 (57.6) | 29979 (166) | 6067 (300) |
Comparisons are between the year 2003 and 2013; PED, pediatric emergency department.
FIGURE 2.

Increasing admission rate for PED headache visits. The increase in the number of admissions for headache is attributable to both a rising number of PED visits for headache and by a rising portion of headache PED visits resulting in admission, as soon in Fig 2. PED, pediatric emergency department.
Single Site Data
Unadjusted Data
A total of 325,172 PED visits for children aged four to 20 years occurred from 2007-2014. Of these visits, 10,342 (3.2%) had an ICD-9 code for headache, and 2247 (21.7%) of these patients were admitted. Headache visits increased 111% from 896 visits in 2007 to 1887 visits in 2014; in comparison, total PED visits increased 30%. The percentage of admission for headache increased 187% with 156 admissions (17.4% of headache visits) in 2007 and 448 admissions (23.7% of headache visits) in 2014.
Adjusted Data
Fifty-one visits from the initial subset of 400 patients (14.0%) were excluded and replaced with randomly selected patients meeting inclusion criteria; the percentage of excluded visits did not significantly change during the study period (r = −0.395, 95% CI −0.86, 0.43, P = 0.33). Seven of the excluded visits left without being seen for a chief complaint of headache. Forty-four visits did not have a chief complaint of headache or PED diagnosis of headache. Two visits were excluded for diagnosis of VPS malfunction. One visit was excluded for new diagnosis of recurrent brain tumor. One visit was excluded for bacterial meningitis. One visit was excluded for TBI. Of the patients who were excluded from the study because there was no documented complaint or diagnosis of headache in the ED, 32 patients (72.7%) were admitted from the PED, suggesting that many admitted patients with an ICD-9 code of headache had headache as a secondary diagnosis. Thus raw ICD-9 coding data inflates the total headache visits and admission percentage. The percentage of eligible visits and the percentage of admissions of eligible visits were used to estimate adjusted totals and are displayed in Fig 3 and Table 2.
FIGURE 3.

Adjusteda headache visits and admissions relative to ED visits and admissions, 2007-2014. At a single tertiary PED, the number of visits for headache and admission for headache rose out of portion to the rise in total PED visits and admissions respectively.
aIndividual chart review revealed that not all visits or admissions with a ICD-9 code for headache had a documented complaint or diagnosis of headache. The total number of visits and admissions for headache ICD-9 codes was adjusted to account for this discrepancy. Triangles represent headaches admissions per 1000 ED admissions. Circles represent headache visits per 1000 ED visits. ICD-9, International Classification of Disease, Ninth Revision; PED, pediatric emergency department.
TABLE 2.
Headache Visits and Admissions per Year at a Single PED Adjusted* for Excluded Visits
| Adjusted Headache Visits |
Adjusted Headache Admissions |
Adjusted Headache Admission Rate |
|
|---|---|---|---|
| 2007 | 752.6 | 66.9 | 8.9% |
| 2008 | 602.4 | 80.0 | 13.3% |
| 2009 | 945.8 | 85.3 | 9.0% |
| 2010 | 1003.2 | 165.0 | 16.5% |
| 2011 | 1298.6 | 217.6 | 16.8% |
| 2012 | 1410.2 | 234.8 | 16.7% |
| 2013 | 1189.5 | 192.0 | 16.1% |
| 2014 | 1773.8 | 421.6 | 23.8% |
| Total | 8976.2 | 1463.1 | 16.3% |
Individual chart review revealed that not all visits or admissions with a ICD-9 code for headache had a documented complaint or diagnosis of headache. The total number of visits and admissions for headache ICD-9 codes was adjusted to account for this discrepancy.
Recorded patient demographics remained consistent throughout the study period. The average age of patients was 12.4 years (r = −0.16, 95% CI −0.78, 0.62, P = 0.71) with a median 13.0 years. Girls represented 60.8% (r = 0.00, 95% CI −0.70, 0.70, P = 1.00) of patients. Girls represent 47.5% of all visits to the PED. Caucasians composed 70.9% (r = −0.45, 95% CI −0.88, 0.38, P = 0.27) of patients, and blacks composed 29.1% (r = 0.45, 95% CI −0.38, 0.88, P = 0.27) of patients. Only 0.9% (r = −0.11, 95% CI −0.76, 0.65, P = 0.80) of patients were Hispanic. The racial proportions of all visits to the PED were 63.0% Caucasian, 33.1% black and 0.6% Hispanic. At presentation to the PED, 3.3% (r = −0.04, 95% CI −0.72, 0.68, P = 0.93) of patients had fever (T ≥ 38.5 C). History of recent head injury, history of concussion and medicines taken for headache before presentation were well documented in only 37.5%, 13.3%, and 56.0% of charts, respectively, thus limiting further analysis.
PED management of headache over time between 2007 and 2014 differed in two respects: (1) the admissions for headache increased, (2) the frequency of head CT decreased 4.3% per year (r = −0.98, 95% CI −1.00, −0.87, P = 0.000) from 36% in 2007 to 6% in 2014. The frequency of pharmacologic therapy increased 2.1% per year (r = 0.68, 95% CI −0.04, 0.94, P = 0.62) from 76% of patients receiving medications in 2007 to 84% in 2014, however this was not statistically significant.
In 2007, 36% of visits included head imaging obtained in the ED and all of these patients solely underwent CT scan; 44% of patients remained imaging naïve, meaning that they had no imaging in the ED and no record of prior imaging in the chart. The remaining 20% of visits had documented previous head imaging. Over the next eight years, CT usage and head imaging of patients with headache decreased overall while the use of MRI increased (Fig 4). Imaging naiveté increased, though not significantly (r = 0.43, 95% CI −0.39, 0.87, P = 0.29). In 2014, 14% of PED visits for headache included head imaging, including 6% of patients with CT, and 46% of patients remained imaging naïve.
FIGURE 4.
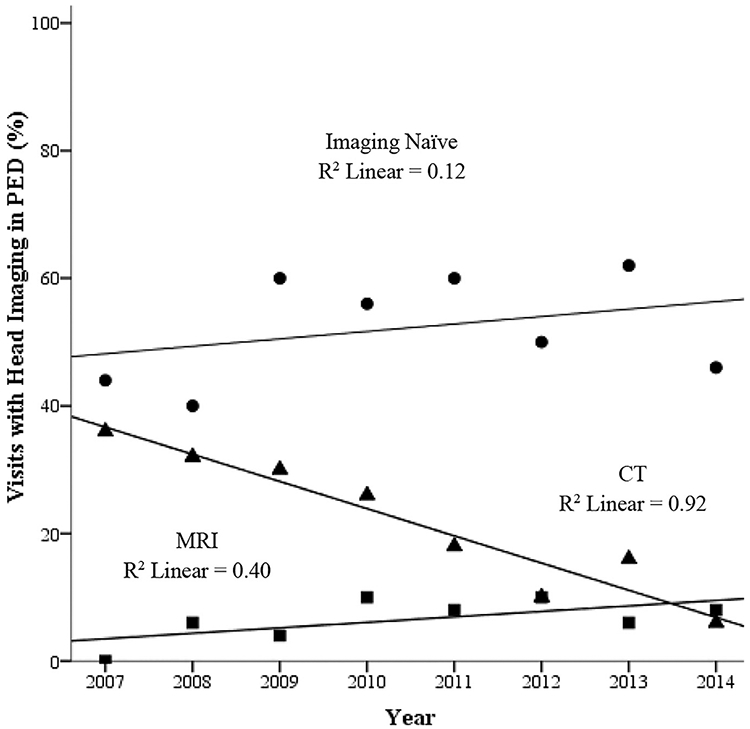
Head imaging for headache in PED. The number of CTs performed for PED visits for headache has decreased while the use of MRI has increased. The number of patients with no previously documented head imaging and no head imaging performed during the index visit, termed imaging naiveté, has not changed significantly. PED, pediatric emergency department.
The percentage of patients with headache that received any pharmacologic therapy in our PED increased from 76% in 2007 to 84% in 2014 (Table 3). During the eight-year period, 58.0% of patients received IV medications and 19.5% received only oral medications. The “migraine cocktail,” as defined by local protocol, comprises of metoclopramide or prochlorperazine plus ketorolac and normal saline intravenous fluid (IVF) bolus with or without diphenhydramine, was administered to 47.3% of patients. IVF and ketorolac were the most frequently administered medications at 55% and 51.8% respectively. Only diphenhydramine showed increasing utilization over time; 4% of patients in 2007 received this drug, compared with 50% of patients in 2014. Valproic acid, which is considered a rescue medication, was used more frequently over time with a maximum of 16% of visits in 2014. Dexamethasone is not standardly administered in the ED based on local protocol.
TABLE 3.
Pharmacologic Treatment for Headache in PED
| Medication | Spearman's Coefficient | 95% CI | P value | 2007 (%) | 2014 (%) |
|---|---|---|---|---|---|
| Pharmacologic therapy | 0.68 | −0.05, 0.94 | 0.06 | 76 | 84 |
| Oral treatment | 0.26 | −0.55, 0.82 | 0.53 | 8 | 16 |
| Any IV treatment | 0.30 | −0.51, 0.83 | 0.46 | 68 | 68 |
| Acetaminophen | 0.17 | −0.61, 0.78 | 0.68 | 6 | 10 |
| Dexamethasone | 0.17 | −0.61, 0.78 | 0.69 | 0 | 0 |
| Diphenhydramine | 0.85 | 0.36, 0.97 | 0.007 | 4 | 50 |
| Ibuprofen | 0.29 | −0.52, 0.83 | 0.49 | 4 | 10 |
| IVF | 0.54 | −0.27, 0.90 | 0.17 | 62 | 66 |
| Ketorolac | 0.05 | −0.68, 0.72 | 0.91 | 62 | 58 |
| Metoclopramide | 0.59 | −0.2, 0.91 | 0.12 | 48 | 58 |
| Naproxen | 0.11 | −0.64, 0.76 | 0.80 | 2 | 4 |
| Ondansetron | 0.33 | −0.49, 0.84 | 0.42 | 4 | 10 |
| Opioid | −0.31 | −0.83, 0.50 | 0.45 | 2 | 0 |
| Prochlorperazine | – | – | 0 | 0 | |
| Triptan | – | – | 0 | 0 | |
| Valproic acid | 0.85 | 0.36, 0.97 | 0.008 | 4 | 16 |
| Migraine Cocktail* | 0.56 | −0.23, 0.91 | 0.15 | 46 | 56 |
CI, confidence interval; IV, intravenous; IVF, intravenous fluids.
Migraine cocktail was defined by local protocol as metoclopramide or prochlorperazine plus ketorolac and normal saline intravenous fluid bolus with or without diphenhydramine. The components of the migraine cocktail were analyzed individually and as a grouping.
Statistically significant values are bolded.
The number of admitted patients per year discovered through our chart review was too limited to permit demographic analysis of trends; therefore the averages of admitted patients over the eight-year period 2007 to 2014 are presented in Table 4. Patients who were admitted were more likely to be older and female. Admitted patients were less likely to be imaging naïve. Medications administered more often to patients who were later admitted included dexamethasone, diphenhydramine, IVF, opioids, ketorolac, valproic acid, ondansetron, and migraine cocktail. Patients who were discharged from the PED were more likely to only receive oral medications, specifically ibuprofen.
TABLE 4.
Associated Factors with Admission for Headache
| Admitted (n = 67) | Percent | Discharged (n = 333) | Percent | Odds Ratio (95% CI) | P Value (Effect Size) | |
|---|---|---|---|---|---|---|
| Age (years) | 14.3 | 12.7 | 0.001(0.17) | |||
| White | 51/65 | 79 | 227/327 | 69 | 1.6 (0.9-3.0) | 0.14 |
| Black | 14/65 | 22 | 100/327 | 31 | 0.6 (0.3-1.2) | 0.14 |
| Male | 16 | 24 | 141 | 42 | 0.5 (0.3-0.8) | 0.005 |
| Female | 51 | 76 | 192 | 58 | 2.3 (1.3-4.3) | 0.005 |
| Imaging in PED | 21 | 33 | 81 | 24.5 | 1.4 (0.8-2.5) | 0.23 |
| Imaging naive | 25 | 37 | 184 | 55 | 0.5 (0.3-0.8) | 0.007 |
N, number; PED, pediatric emergency department.
Statistically significant values are bolded.
Discussion
This is the first study to report the trend in headache visits and to characterize the demographic profile, management, and disposition of pediatric patients with headache within a single tertiary care PED. Our study demonstrates that visits for headache to PEDs participating in PHIS have increased significantly over the last 11 years. Our single site data mirror the trend shown in the PHIS data, though the exact percent increase is not identical. It is unclear how much of this increase reflects an increasing prevalence of headache versus changes in the utilization of emergency departments by patients and families. Although prevalence data from the United States are lacking, a population-based study in Finland demonstrates a greater than two-fold increase in migraine headaches in school-aged children from 1992 to 2002.9
One possible contributor to the trend of increasing visits for headache is the increase in stress experienced by children. A population-based study of eight-year-old Finnish school children from 1981 to 1991 showed an increase in psychosomatic complaints, most notably headache and abdominal pain, that correlated strongly with measures of depression and anxiety.10 The relationship between mood and anxiety disorders with headache is well established.11 In this context, it is notable that mental health-related visits have also increased dramatically in the North America.12-16 Studies suggest a seasonal variation for both mental health-related complaints and headache in PED visits with a substantial increase in visits over the months during the school year,17,18 further supporting the association between mental health and headaches.
Other specific risk factors for pediatric headache include caffeine intake,19 smoking,19,20 lack of physical activity,19,20 being overweight,20,21 being a victim of bullying or physical abuse,22,23 and having limited free time.24 Of these, only caffeine intake appears to be increasing25; tobacco exposure, bullying, and obesity have not increased in recent years.26-28 Regarding activity trends, free time is decreasing while organized activities are increasing in equal proportion.29
Another possible contributor to the trend of increasing visits for headaches is the heightened awareness and increased reporting of concussions. Emergency Department visits for concussion have increased markedly in the last decade (>200% in the 14- to 19-year-old group),30 and postconcussion headaches are a common reason for seeking care.31 Regardless of its etiology, the increase in patients hospitalized for headache suggests an increasing frequency of failure for our outpatient therapies and support mechanisms.
Our study has several limitations. While we included data from children's hospitals in geographically diverse regions, the information is not nationally representative, and does not include pediatric visits to community hospitals. However, data from the National Hospital Ambulatory Medical Care Survey, a nationally representative stratified sample of all ED encounters, suggest that the number of ED visits for patients younger than 18 years with a chief complaint of headache have increased out of proportion to ED visits.7 Because our study utilizes aggregate administrative data from ICD-9-CM codes, it is limited by potential miscoding. Nevertheless, our study suggests increasing trends in PED-diagnosed pediatric headache and pediatric headache admissions.
Further research is necessary to determine the cause of increasing visits for headache in the pediatric population. Similar research on temporal trends for other complaints with a psychosomatic component including recurrent abdominal pain and regional pain syndromes may confirm the suspected correlation between headaches and other mental health-related somatic complaints. Research across the spectrum of home care, care delivered by primary care, and emergency department care is necessary to characterize trends in resource utilization and to identify potential targets of intervention. Lastly, the increase in both visits for headache and admissions for headache highlights the importance of studying management strategies for pediatric headache.
Conclusion
Pediatric emergency department visits for headache is increasing and a growing proportion of these patients are admitted. This trend represents a significant burden on patients, families, and the health care system. Further research is needed to determine the causes for this trend, focusing on the relative contribution of mood disorders, somatization, social stressors, and changes in access to health care and health care utilization. Research is also needed to develop more effective management strategies.
Supplementary Material
Acknowledgment
Statistical support was provided by Dan Winger and Li Wang who were funded by the National Institutes of Health through Grant Number UL1 TR001857. Katharina (Katie) Hayes, MD contributed to data collection.
Funding
The statisticians who assisted with the analysis are funded by the National Institutes of Health through Grant Number UL1 TR001857. This research did not directly receive any specific grant from funding agencies in the public, commercial, or not-for-profit sectors.
Footnotes
Conflict of Interest
The authors declare no conflict of interest or financial disclosures concerning the materials or methods used in this study or the findings specified in this article.
Supplementary materials
Supplementary material associated with this article can be found, in the online version, at doi:10.1016/j.pediatrneurol.2018.07.015.
References
- 1.Bethell C, Kemper KJ, Gombojav N, Koch TK. Complementary and conventional medicine use among youth with recurrent headaches. Pediatrics. 2013;132:e1173–e1183. [DOI] [PMC free article] [PubMed] [Google Scholar]
- 2.Massano D, Julliand S, Kanagarajah L, et al. Headache with focal neurologic signs in children at the emergency department. J Pediatr. 2014;165:376–382. [DOI] [PubMed] [Google Scholar]
- 3.Straube A, Heinen F, Ebinger F, von Kries R. Headache in school children: prevalence and risk factors. Dtsch Arztebl Int. 2013;110:811–818. [DOI] [PMC free article] [PubMed] [Google Scholar]
- 4.Lateef TM, Merikangas KR, He J, et al. Headache in a national sample of American children: prevalence and comorbidity. J Child Neurol. 2009;24:536–543. [DOI] [PMC free article] [PubMed] [Google Scholar]
- 5.Kan L, Nagelberg J, Maytal J. Headaches in a pediatric emergency department: etiology, imaging, and treatment. Headache. 2000;40:25–29. [DOI] [PubMed] [Google Scholar]
- 6.Bachur RG, Monuteaux MC, Neuman MI. A comparison of acute treatment regimens for migraine in the emergency department. Pediatrics. 2015;135:232–238. [DOI] [PubMed] [Google Scholar]
- 7.Larson DB, Johnson LW, Schnell BM, Goske MJ, Salisbury SR, Forman HP. Rising use of CT in child visits to the emergency department in the United States, 1995-2008. Radiology. 2011;259:793–801. [DOI] [PubMed] [Google Scholar]
- 8.Lowry R The confidence interval of rho. 2017; http://www.vassarstats.net/rho.html. Accessed September 26, 2017. [Google Scholar]
- 9.Anttila P, Metsahonkala L, Sillanpaa M. Long-term trends in the incidence of headache in Finnish schoolchildren. Pediatrics. 2006;117:e1197–e1201. [DOI] [PubMed] [Google Scholar]
- 10.Santalahti P, Aromaa M, Sourander A, Helenius H, Piha J. Have there been changes in children's psychosomatic symptoms? A 10-year comparison from Finland. Pediatrics. 2005;115:e434–e442. [DOI] [PubMed] [Google Scholar]
- 11.Borsook D, Maleki N, Becerra L, McEwen B. Understanding migraine through the lens of maladaptive stress responses: a model disease of allostatic load. Neuron. 2012;73:219–234. [DOI] [PubMed] [Google Scholar]
- 12.Mapelli E, Black T, Doan Q. Trends in pediatric emergency department utilization for mental health-related visits. J Pediatr. 2015;167:905–910. [DOI] [PubMed] [Google Scholar]
- 13.Sills MR, Bland SD. Summary statistics for pediatric psychiatric visits to US emergency departments, 1993-1999. Pediatrics. 2002;110:e40. [DOI] [PubMed] [Google Scholar]
- 14.Grupp-Phelan J, Harman JS, Kelleher KJ. Trends in mental health and chronic condition visits by children presenting for care at U. S. emergency departments. Public Health Rep. 2007;122:55–61. [DOI] [PMC free article] [PubMed] [Google Scholar]
- 15.Zima BT, Rodean J, Hall M, Bardach NS, Coker TR, Berry JG. Psychiatric disorders and trends in resource use in pediatric hospitals. Pediatrics. 2016;138:e20160909. [DOI] [PMC free article] [PubMed] [Google Scholar]
- 16.Mojtabai R, Olfson M, Han B. National trends in the prevalence and treatment of depression in adolescents and young adults. Pediatrics. 2016;138:e20161878. [DOI] [PMC free article] [PubMed] [Google Scholar]
- 17.Goldstein AB, Silverman MA, Phillips S, Lichenstein R. Mental health visits in a pediatric emergency department and their relationship to the school calendar. Pediatr Emerg Care. 2005;21:653–657. [DOI] [PubMed] [Google Scholar]
- 18.Caperell K, Pitetti R. Seasonal variation of presentation for headache in a pediatric emergency department. Pediatr Emerg Care. 2014;30:174–176. [DOI] [PubMed] [Google Scholar]
- 19.Milde-Busch A, Blaschek A, Borggrafe I, Heinen F, Straube A, von Kries R. Associations of diet and lifestyle with headache in high-school students: results from a cross-sectional study. Headache. 2010;50:1104–1114. [DOI] [PubMed] [Google Scholar]
- 20.Robberstad L, Dyb G, Hagen K, Stovner LJ, Holmen TL, Zwart JA. An unfavorable lifestyle and recurrent headaches among adolescents: the HUNT study. Neurology. 2010;75:712–717. [DOI] [PubMed] [Google Scholar]
- 21.Hershey AD, Powers SW, Nelson TD, et al. Obesity in the pediatric headache population: a multicenter study. Headache. 2009;49:170–177. [DOI] [PubMed] [Google Scholar]
- 22.Tietjen GE, Brandes JL, Peterlin BL, et al. Childhood maltreatment and migraine (part II). Emotional abuse as a risk factor for headache chronification. Headache. 2010;50:32–41. [DOI] [PubMed] [Google Scholar]
- 23.Williams K, Chambers M, Logan S, Robinson D. Association of common health symptoms with bullying in primary school children. BMJ. 1996;313:17–19. [DOI] [PMC free article] [PubMed] [Google Scholar]
- 24.Gassmann J, Vath N, van Gessel H, Kroner-Herwig B. Risk factors for headache in children. Dtsch Arztebl Int. 2009;106:509–516. [DOI] [PMC free article] [PubMed] [Google Scholar]
- 25.Ahluwalia N, Herrick K, Moshfegh A, Rybak M. Caffeine intake in children in the United States and 10-y trends: 2001-2010. Am J Clin Nutr. 2014;100:1124–1132. [DOI] [PMC free article] [PubMed] [Google Scholar]
- 26.Ahluwalia N, Dalmasso P, Rasmussen M, et al. Trends in overweight prevalence among 11-, 13- and 15-year-olds in 25 countries in Europe, Canada and USA from 2002 to 2010. Eur J Public Health. 2015;25(Suppl 2):28–32. [DOI] [PubMed] [Google Scholar]
- 27.Arrazola RA, Singh T, Corey CG, et al. Tobacco use among middle and high school students–United States, 2011-2014. MMWR. 2015;64:381–385. [PMC free article] [PubMed] [Google Scholar]
- 28.Perlus JG, Brooks-Russell A, Wang J, Iannotti RJ. Trends in bullying, physical fighting, and weapon carrying among 6th- through 10th-grade students from 1998 to 2010: findings from a national study. Am J Public Health. 2014;104:1100–1106. [DOI] [PMC free article] [PubMed] [Google Scholar]
- 29.Sturm R Childhood obesity—what we can learn from existing data on societal trends, part 1. Preventing Chronic Dis. 2005;2:A12. [PMC free article] [PubMed] [Google Scholar]
- 30.Bakhos LL, Lockhart GR, Myers R, Linakis JG. Emergency department visits for concussion in young child athletes. Pediatrics. 2010;126:e550–e556. [DOI] [PubMed] [Google Scholar]
- 31.Babcock L, Byczkowski T, Wade SL, Ho M, Mookerjee S, Bazarian JJ. Predicting postconcussion syndrome after mild traumatic brain injury in children and adolescents who present to the emergency department. JAMA Pediatr. 2013;167:156–161. [DOI] [PMC free article] [PubMed] [Google Scholar]
Associated Data
This section collects any data citations, data availability statements, or supplementary materials included in this article.