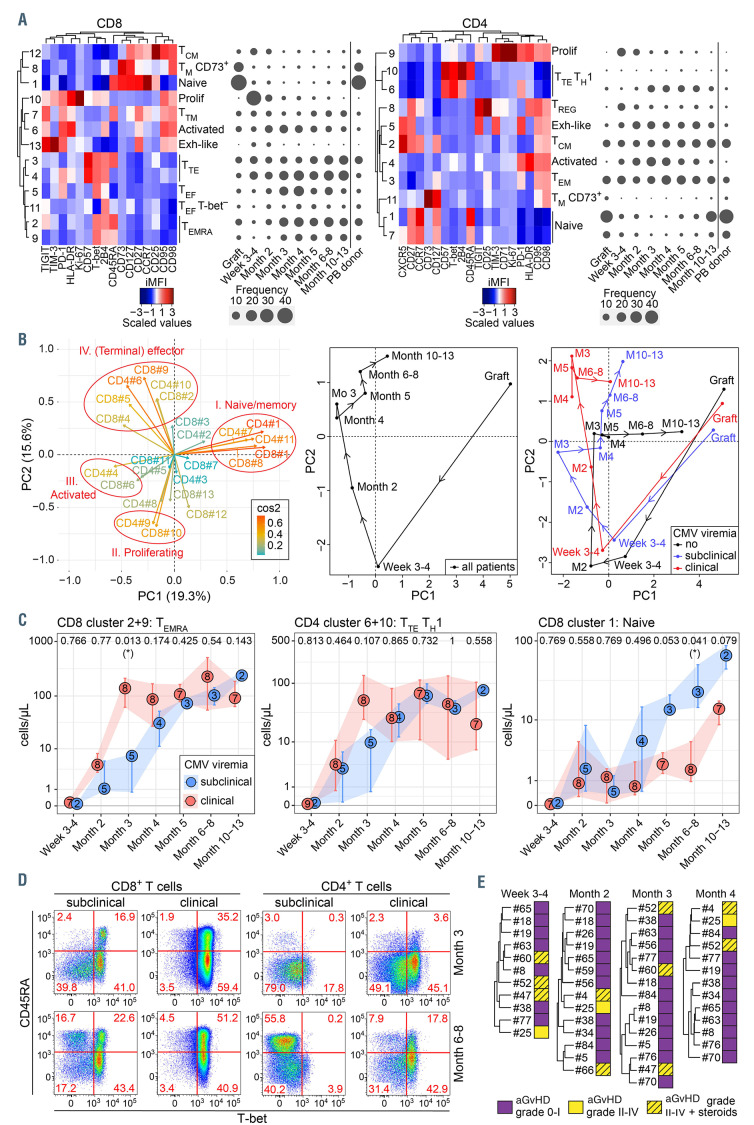
Figure 1.
Cytomegalovirus reactivation impacts T-cell reconstitution following haploindentical hematopoietic stem cell transplantation with post-transplant cyclophosphamide. (A) Integrated median fluorescence intensity (iMFI) values, considering both expression level and frequency of marker+ cells, of the CD8+ or CD4+ T-cell PhenoGraph clusters were visualized by heatmaps, while PhenoGraph cluster dynamics (median percentages of total CD8+ or CD4+ T cells) in haploidentical hematopoietic stem cell transplantatation (haplo-HSCT) patients were revealed by balloon plots. (B) Principle component analysis (PCA) of CD8+ and CD4+ T-cell cluster frequencies. The left panel depicts the clusters driving the PCA, the central and right panel show the median PCA coordinates of all patients, grouped together or according to cytomegalovirus (CMV) viremia (subclinical viremia, n=6; clinical viremia, n=13; no viremia, n=2), per time point in months after transplant. The central and right panel should be read in conjunction with the left panel; the relative position of data points in the central and right panel is indicative of dominance of T-cell clusters shown with a similar relative position in the left panel. (C) Dynamics of CD8+ TEMRA, CD4+ TTE TH1 and CD8+ naïve clusters in haplo-HSCT patients experiencing post-transplant CMV viremia. Medians with the number of patients per time point are shown and error bars represent interquartile range. Significance was determined by Kruskal-Wallis test and P-values are shown at the upper border of the plot for each time point (*P<0.05). (D) Flow cytometric analysis of CD45RA and T-bet expression in CD8+ and CD4+ T cells at month 3 and month 6-8 after transplantation. For both CMV groups a single representative patient is shown. (E) Hierarchical metaclustering using the Ward minimum variance method, of haplo-HSCT patients per month, based on the frequency of CD8+ and CD4+ T-cell PhenoGraph clusters. aGvHD: acute graft-versus-host disease; Exh: exhausted; PB: peripheral blood; Prolif: proliferating; TCM: central memory T cell; TEF: effector T cell; TEM: effector memory T cell; TEMRA: effector memory re-expressing CD45RA T cell; TM: memory T cell; TREG: regulatory T-cell T cell; TTE: terminal effector T cell; TM: transitional memory T cell.

