

Abstract
Crisis lines are a valuable community resource that anonymously and freely serve those in acute crisis. As a result of anonymity, it has been difficult to fully characterize crisis line services. However, appraising and improving crisis line services for the communities they serve is essential, even with the additional difficulty anonymity poses. This study seeks to increase our understanding of current crisis services and utilization via a characterization of various aspects of a United States crisis line service center over 12-months including features of calls (e.g., call length), callers (e.g., victimization history), and information provided to the caller (e.g., referrals). We examine five crisis lines totaling 5,001 calls from October 2018 to September 2019. Descriptive information is provided on call volume, patterns across time, caller characteristics, victimization types, and referrals. Although we were unable to assess prospective outcomes due to anonymity, 99.5% of callers that were asked (61.35% of all calls; n = 3,068) reported the call as helpful. This provides an important overview of crisis line services and suggests they are a valuable community health resource serving a range of callers. Given the findings of the present study, we conclude with a discussion of recommendations and implications for community crisis line centers and future research.
Keywords: crisis line, crisis services, caller characteristics, mental health, community health, public health
Introduction
Crisis lines serve the community and/or nation as a free resource, often available 24/7 to assist those in acute crisis (Kalafat et al., 2007). The goal of crisis line intervention is to provide immediate assistance to those in acute crisis as well as referrals for further support and/or resources as needed. Crisis lines are often run largely by volunteer staff trained in crisis intervention which includes active listening skills, crisis intervention, call management, suicide and risk assessment and management, referrals, and follow-ups. Further, some crisis lines train staff on specific issues related to mental health (e.g., substance use, mood disorders) and populations (e.g., Deaf or Hard of Hearing [HH], Veteran). Research suggests that crisis lines are the first contact with mental health related services for many people (e.g., Predmore et al., 2017), making them an especially important community and public health intervention. Given the vast current and potential utility of crisis lines, characterizing the current trends and utilization of these services is crucial to identifying targeted ways to improve such services.
Several studies have focused on crisis lines, specifically from the vantage point of particular concerns (e.g., suicidality; Barber et al., 2004; Gould et al., 2018), modalities (e.g., call, text; Evans et al., 2013), patterns of calling (e.g., O’Neill et al., 2019), and outcomes (e.g., referral follow through; Gould et al., 2012). With technological advances giving rise to modes of communication beyond phone calls, a number of text- and video-based crisis lines have emerged. These services may be particularly advantageous for certain groups, such as youth or Deaf and HH populations. Text-based crisis lines have been rated by adolescents as convenient, acceptable, and confidential, and are associated with increased help-seeking (Evans et al., 2013). Text lines also have advantages for staff (e.g., being able to serve multiple people at once). However, there is still much to be learned about crisis line services and continued investigations are crucial given their importance for public health and their service to many individuals, who are typically considered to be high risk (i.e., having high rates of suicide ideation or attempts; Bassilios et al., 2015; Burgess et al., 2008; Ohtaki et al., 2016).
One major challenge of crisis line research is characterizing both the calls and callers given that anonymity is a core tenant of these services (e.g., Coveney et al., 2012). Although anonymity is an important feature, it limits the ability to fully capture caller demographics, identify frequent callers, and reach out for follow-up contact. Despite such challenges, some research has successfully evaluated characteristics of frequent callers through unique data methods or follow up surveys. This research has identified that 2.6% to 22% of all calls are from frequent callers and has described common characteristics of frequent callers, such as calling about domestic violence and child protection, as well as having high-risk presentations (Middleton et al., 2017; O’Neill et al., 2019; Spittal et al., 2015). Anonymity also makes it difficult to evaluate the effectiveness of calls (e.g., O’ Connor et al., 2016). In response to this obstacle, researchers have evaluated effectiveness in a number of ways. Given one of the primary goals of crisis line services is to provide referrals for callers in need, some research has focused on follow through with mental health services, identifying that approximately 50% of callers followed through with seeking mental health services following a referral (Gould et al., 2012). Other research teams have focused on safety outcomes as an indicator of effectiveness. For example, Gould and colleagues (2017) found that crisis line interventions result in increased safety for individuals in crisis, with 80% of callers reporting that the call halted a suicide attempt and 90% reporting increased safety following call.
Other factors have been identified as useful in characterizing crisis services provided. For example, time factors, such as time of day, have been examined, with weekday calls during traditional business hours (e.g., 6am-6pm) being more likely to end with resolution or referrals compared to calls at other times (Britton et al., 2013). Studies that have focused on characterizing frequent callers via demographic variables and presenting concerns have aimed to provide services that meet the needs of frequent callers, expand techniques for staff, and improve the crisis service system overall (e.g., Middleton et al., 2014). Together, the extant literature on crisis lines seeks to describe current trends and identify groups that may benefit from crisis line services and/or crisis line adaptations (e.g., text lines). Beyond these outcomes, more in-depth efforts to assess demographic characteristics of callers, such as victimization histories and call content, remains challenging, yet are important for fully understanding and improving this important community and public health service.
The current study aims to descriptively characterize the calls received by a United States crisis line service center over a 12-month period, and more specifically, to examine the profile of users of the services, and services provided by the volunteers during the calls (e.g., referrals provided). The results of this study provide information about (a) who is calling, including the caller’s victimization history; (b) when calls are being made, which includes information on the call itself (e.g., duration, time of day, month); (c) caller needs, such as referrals; and (d) whether or not the callers found the service helpful. Based on these results, we offer recommendations for crisis line centers and the provision of services.
Methods
Data for the current study comes from a Midwest crisis line service center in the United States. This includes archival data on calls and texts from October 2018 to September 2019, resulting in 5,001 total contacts over the 12 months. It is important to note that this figure does not necessarily represent unique callers. Given anonymity, there is no way to know how many unique callers are represented and, thus, which observations are independent versus non-independent. Further, this specific crisis line center runs several different types of crisis services, some of which are advertised as state-wide crisis lines and others that are advertised as national crisis lines. However, the state-wide crisis lines are in no way limited to in-state callers and, therefore, could include those from other states. In addition, this crisis line center receives special funding for the purpose of providing services to some specific groups, including Deaf and HH individuals, though these specific subpopulations are not a primary focus of the current manuscript.
Of note is that the crisis services included in this investigation are broadly advertised as crisis/suicide services and are also well known for serving the Deaf/HH. Although this crisis line center does serve individuals calling from more specific groups (e.g., Veterans) or about specific concerns (e.g., domestic violence), these callers may be more likely to instead reach out to a specialized hotline (e.g. Veteran’s or Domestic Violence Hotline). Thus, these crisis services may have been competing with other more specialized services in the United States.
Crisis line staff included volunteers, all of whom completed a 49-hour training covering crisis intervention, risk assessment, call management, warning signs of commonly reported concerns (e.g., signs of sexual abuse), and clinical issues (e.g., panic attacks). The volunteers received regular supervision and were responsible for completing call report forms which included information on the call (e.g., time, date, length of call), suicidality and risk, caller demographics (e.g., Deaf or HH, immigrant), call description, and victimization type. It should be noted that to maintain anonymity, the callers were not explicitly asked to report demographics, rather the caller demographics reported here were only recorded in cases where the caller voluntarily self-disclosed such identities.
Victimization type was a broad category and encompassed lifetime victimization history. As such, victimization type could have included the current reason for calling but may also have indicated a history of victimization, without being the primary focus of the call. Volunteers did not specify whether each victimization type was current (e.g., the reason for the call), occurred in the past only, or both. In addition, volunteers were instructed to ask callers for feedback (e.g., was the call helpful?) at the end of their call. Data from the call report forms were manually entered into an electronic spreadsheet by staff. Institutional Review Board (IRB) approval was not required for use of the archival data because it was fully anonymous and considered to be no more than minimal risk by the IRB.
Sample
Included in the current data are calls and texts to the state-wide crisis line (Statewide Text Line: 3.16%, Statewide Phone Line: 94.56%), videophone calls to a national Deaf crisis line (Videophone Crisis Line: 5.44%), and teletypewriter (TTY) calls to two nation-wide crisis lines (Nationwide TTY Lines 1 and 2; see Table 1). Although individuals contacted the crisis line center through various modalities (i.e., text, TTY, video phone, voice phone), we use the term “caller” to refer to all individuals throughout the manuscript.
Table 1.
Crisis Line Modality Over Time
| Crisis Line Modality |
|||||||||||
|---|---|---|---|---|---|---|---|---|---|---|---|
| Month and Year |
Number of Calls |
Statewide Text Line |
Nationwide TTY Line 1 |
Nationwide TTY Line 2 |
Videophone Crisis Line |
Statewide Phone Line |
|||||
| n | % | n | % | n | % | n | % | n | % | ||
| Sep-19 | 375 | 13 | 3.47 | 45 | 12.00 | 0 | 0.00 | 24 | 6.40 | 293 | 78.13 |
| Aug-19 | 436 | 12 | 2.75 | 47 | 10.78 | 2 | 0.46 | 24 | 5.50 | 351 | 80.50 |
| Jul-19 | 432 | 10 | 2.31 | 31 | 7.18 | 0 | 0.00 | 29 | 6.71 | 362 | 83.80 |
| Jun-19 | 446 | 12 | 2.69 | 43 | 9.64 | 0 | 0.00 | 25 | 5.61 | 366 | 82.06 |
| May-19 | 460 | 18 | 3.91 | 75 | 16.30 | 0 | 0.00 | 28 | 6.09 | 339 | 73.70 |
| Apr-19 | 449 | 19 | 4.23 | 91 | 20.27 | 1 | 0.22 | 35 | 7.80 | 303 | 67.48 |
| Mar-19 | 473 | 18 | 3.81 | 124 | 26.22 | 2 | 0.42 | 22 | 4.65 | 307 | 64.90 |
| Feb-19 | 433 | 0 | 0.00 | 9 | 2.08 | 0 | 0.00 | 2 | 0.46 | 422 | 97.46 |
| Jan-19 | 354 | 27 | 7.63 | 52 | 14.69 | 1 | 0.28 | 23 | 6.50 | 251 | 70.90 |
| Dec-18 | 431 | 16 | 3.71 | 113 | 26.22 | 1 | 0.23 | 17 | 3.94 | 284 | 65.89 |
| Nov-18 | 358 | 9 | 2.51 | 60 | 16.76 | 0 | 0.00 | 23 | 6.42 | 266 | 74.30 |
| Oct-18 | 354 | 4 | 1.13 | 39 | 11.02 | 3 | 0.85 | 20 | 5.65 | 288 | 81.36 |
| Overall | 5001 | 158 | 3.16 | 730 | 14.60 | 10 | 0.20 | 272 | 5.44 | 3832 | 76.62 |
Note. TTY = Teletypewriter.
Victimization Types
The call report forms allowed staff to check as many victimization types as applicable from 39 options. Victimization type was not necessarily the primary reason for calling but, instead, represented the caller’s victimization history. For example, although a caller could have been calling about current suicidal ideation, if they reported a history of physical abuse, then both “suicide” and “physical abuse” would have been selected on the call report form. Although we recognize that alcohol- and drug-related calls as well as calls related to suicide are not “victimization,” we use this term throughout for brevity. Of note, volunteers were not required to check a victimization type which resulted in 896 (18% of all calls received in this period) call report forms having missing data for this outcome. In order to prevent inflation of the estimates due to missing data (e.g., Hertel, 1976), we chose the conservative approach of retaining the overall denominator of 5,001 when presenting results from victimization type. For completeness and transparency, we do provide all raw base rates for each victimization type, as well as the number of missing data points, by month, in Supplemental Tables 1 and 2.
Some victimization types were closely related to one another; consequently, related types were combined to create three composite variables: adult violence, child violence, and financial victimization. Adult violence was “endorsed” if any of the following were identified: adult physical assault, adult sexual assault, domestic and/or family violence, stalking or harassment, and elder abuse or neglect. We use the term “endorsed” to convey that the caller provided some information about a current or previous victimization type and, therefore, this type of victimization was “endorsed” by the caller (although the volunteer was the individual who did the recording of the information). Child violence included adult sexually abused/assaulted as a child, child physical assault or neglect, child pornography, child sexual abuse or assault, and kidnapping (custodial and non-custodial). Financial victimization included arson, burglary, robbery, and identity theft/fraud. Composite variables indicated whether or not a given victimization type was present for a caller, rather than a count of how many unique types of victimization were present within a given type. For example, if a caller “endorsed” adult physical assault and burglary, that individual would be counted as endorsing adult victimization and financial composite variables. Frequencies are reported separately for each of the categories in Supplemental Materials Table 1.
Results
First, we provide a basic description of the calls. Next, results are described descriptively across three areas: (1) call patterns across time, specifically over the course of 12-months and by time of day; (2) characterizing calls by caller demographics and reported past/current victimization type; and (3) referrals provided (i.e., providing information to the caller for other sources of support, such as external agencies).
Call Volume and Patterns across Time
The number of contacts received by the crisis line center per month ranged from 354 to 473 and were the highest in the spring/summer months (see Table 1 and Supplemental Tables 1-2). Across contact type (e.g., telephone, text), the median duration was 15 minutes (Mean = 22.50; SD = 23.29) and ranged from less than one to 300 minutes. Call lengths varied widely across and within modes of contact. Call length was longest for the Statewide Text Line, with a median of 60 minutes (Mean = 73.73; SD = 61.72; range = 2-300). Nationwide TTY Line 2 had the shortest call lengths, with a median of 10 minutes (Mean = 9.50; SD = 5.50, range = 0-20). The other modes of communication were similar to one another in terms of call length. Median videophone call length was 20 minutes (Mean = 25.92; SD = 21.56; range = 1-150), median Statewide Phone Line call length was 15 minutes (Mean = 20.59; SD = 18.27; range = 0-300) and median Nationwide TTY Line 2 call length was 15 minutes (Mean = 20.31; SD = 19.34; range = 0-210). We anticipate the large range for Statewide Phone Line may reflect multiple calls with a single caller within the recorded time period. That is, instead of completing unique call report forms, volunteers mistakenly recorded several calls with a single caller on one call report form. Of note, 99.7% (n = 3,820) of Statewide Phone Line calls were two hours or less in duration. When calls longer than two hours are removed from this estimate, the median call length for the Statewide Phone Line was still 15 minutes (Mean = 20.38; SD = 16.44).
Figure 1A provides an overview of victimization type endorsement (current or previous) reported within month, across the 12-month period. Across months, adult violence had the highest rates, ranging from 42% to 66% with peaks around the holidays and summer months. Childhood victimization remained relatively steady throughout the year with the exception of similar spikes around the holiday and summer months, peaking at around 35%. Reports of bullying were fairly low until summer, at which time they appeared to steadily increase, peaking around 50%. Financial victimization remained low and alcohol/drug concerns decreased over the 12-month period.
Figure 1.
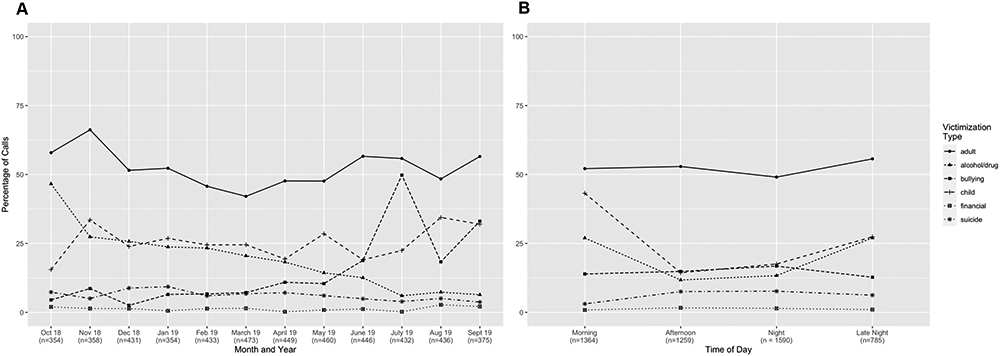
Line Plots Depicting Type of Victimization over Data Collection Months. Adult and child victimization types are composites that include several different types of adult (e.g., domestic violence, sexual violence) and child (e.g., child physical assault/neglect, child sexual abuse) violence. Victimization types are described in more detail within the manuscript. Callers could have “endorsed” more than one victimization type, so percentages do not necessarily add up to 100. (A) Displays the percent of calls by month where each composite victimization type was endorsed over the 12-month data collection period. A total of 896 (18% of total calls) were missing a victimization type. We retain the overall N as the denominator to guard against over-inflation of estimates. (B) Displays type of victimization over time of day (N = 4,998 non-missing data points across the 12-month data collection period). Morning = 6:00am-11:59am; Afternoon = 12:00pm-5:59pm; Night = 6:00pm-11:59pm; Late Night = 12:00am-5:59am.
Time of day, operationalized as morning (6:00am-11:59am), afternoon (12:00pm-5:59pm), night (6:00pm-11:59pm) and late night (12:00am-5:59am), showed similar patterns within victimization types (Figure 1B). For example, most victimization types are reported fairly consistently across the time of day blocks, with the exception of childhood violence and alcohol/drug related calls, which demonstrate a peak in the morning and late-night hours.
Caller Characteristics and Victimization Types
Figure 2 displays the overall frequencies of reported victimization type (Figure 2A), caller demographics (Figure 2B), and referrals provided (Figure 2C). The most common victimization type (Figure 2A) across the 12-month period was adult violence (51.89%), followed by child violence, alcohol/drug concerns, and bullying. Suicide and financial victimization were relatively infrequent. Frequencies by month and sub-categories (e.g., burglary, which is encompassed within “Financial” in the main analyses) are reported in Supplemental Tables 1 and 2. Caller demographics, which provide information related to subpopulations using the crisis lines, were also examined when available (N = 717; 14.33% of all calls). Although frequencies were not particularly high for any group, across all calls (N = 5,001) 7.04% of callers voluntarily reported that they were Deaf, 1.84% identified as LGBTQ, and 1.78% identified as having a disability. Across calls where demographics were voluntarily reported (N = 717), 49.09% of callers reported that they were Deaf, 12.83% identified as LGBTQ, and 12.41% identified as having a disability. Of note, this only includes those who explicitly identified themselves as fitting into these groups and may not reflect the “true” frequency. Further, individuals may have been categorized into more than one caller demographic group (i.e., subpopulations). Supplemental Figure 1 displays reported victimization type within demographic group. Across all demographic groups, adult violence was the most commonly reported victimization type. Within certain demographic groups, some victimization types were more prevalent than others. For example, among those reporting homelessness (n = 88), bullying had a high frequency (nearly 50%) relative to the other victimization types, and LGBTQ callers (n = 92) endorsed previous or current suicide-related concerns (nearly 40%) at a higher frequency relative to other groups (<5% for all other groups except immigrants who reported suicide 50% of the time).
Figure 2.
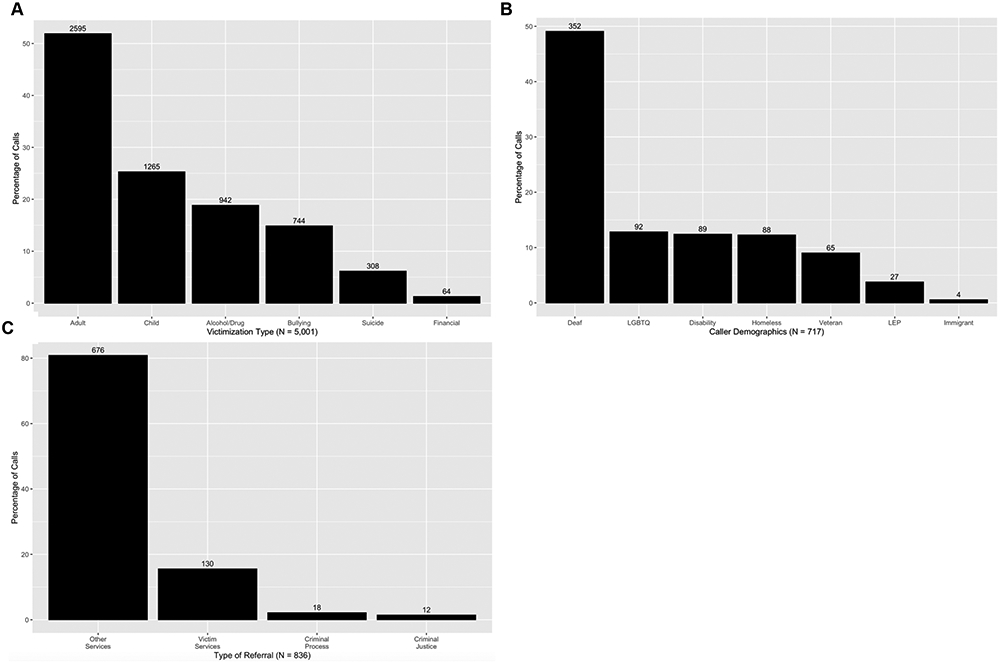
Bar Plots Depicting Call and Caller Characteristics Across All Calls. Participants could have endorsed more than one victimization type, demographic group, or referral type, thus percentages do not necessarily add up to 100. Number of calls are displayed above each bar. (A) Displays the frequency of victimization type across all calls (N = 5,001). A total of 896 (18% of total calls) were missing a victimization type. We retain the overall N as the denominator to guard against over-inflation of estimates. Adult and child victimization types are composites that include several different types of adult (e.g., domestic violence, sexual violence) and child (e.g., child physical assault/neglect, child sexual abuse) violence. (B) Displays the frequency of caller demographics across all calls in which callers voluntarily shared this demographic information (N = 717). LGBTQ = Lesbian, Gay, Bisexual, Transgender, Queer/Questioning; LEP = Limited English proficiency. Note that other caller demographics (e.g., race/ethnicity, gender) were not assessed due to the potential to compromise caller anonymity. (C) Displays types of referrals given across calls where referrals were provided (N = 836).
Referrals Provided During Call
When indicated, crisis line staff directed callers to external agencies for other services/information not provided by the crisis line center (number of calls where referrals provided = 836; 16.72% of overall sample; see Figure 2C). Notably, callers may have been provided with multiple referrals, and thus multiple referral types, on one call. Referrals, in this case, include any additional resources or services recommended to the caller (e.g., contact details for a given agency). For less than 3% of contacts (where referrals were provided), callers were directed to agencies or resources that provide assistance with the criminal justice system, such as agencies that offer legal advocacy or provide information about local court houses (“Criminal Process”), and less than 2% of callers were directed to agencies or resources that provide information about their criminal rights (e.g., contact information for a defense attorney; “Criminal Justice”). Approximately 16% of callers were directed to specific victim service agencies, such as domestic violence hotlines or shelters (“Victim Services”). The most common type of referral provided comprised “Other Services” (n = 676; 80.86% of all referrals), which included providing information and contact details about any other agency, treatment, or provider not included in the above categories (e.g., mental health or alcohol/drug treatment, social services, churches). Breakdown of referral types within Other Services was not possible given limitations of the archival data and volunteer forms (i.e., specific details about the referrals made beyond the types described here were not recorded in the data set). Among callers who received referrals, adult violence was the most commonly endorsed victimization type (see Supplemental Figure 2). Referral types appear to be consistent with reported concerns during calls. For example, within the two referral groups focused on legal referrals, financial and child victimization were prevalent (>20% of calls). However, it is difficult to know fully given the significant portion of referrals designated as “Other.” Among the Victim Service referrals, bullying and child victimization were endorsed more frequently than other areas (e.g., financial), suggesting that these referrals were appropriate for the presenting concerns (i.e., victimization type). It is important to note that the referral categories are likely underestimations given that, in some cases, referrals would be made to services within the crisis line center itself (e.g., American Sign Language interpreting services, case management). As such, these may not have been recorded as referrals. Supplemental Figure 3 demonstrates the types of referrals broken down by caller demographics. Last, over half of the callers (61.35%; n = 3,068) agreed to report on the whether or not they found the call helpful. Of those who agreed, 99.48% reported that the call was helpful.
Discussion
The results of this cross-sectional, descriptive study provide information regarding the rate of calls across time, call types, and referrals provided to callers. Although this study had some limitations, which are noted later, these limitations provide valuable insight into the quality improvement measures that should be taken by crisis line centers to ensure a comprehensive evaluation of services is possible and, thus, inform the recommendations provided in this section. As a whole, it is clear that this specific crisis line center deals largely with calls in which callers are reporting current or past adult and child violence. Consistent with the center’s broader focus, it also appears to receive calls from a notable portion of Deaf and HH callers (e.g., 49% of calls with demographic information were from Deaf and HH callers, whereas 3.6% of the United States population identifies as “deaf” or has serious difficulty hearing; Rochester Institute of Technology, 2011). Average call durations and call volume peaking during the late night hours were consistent with those reported by other research teams (see O’Neill et al., 2019 for a review).
As previously discussed, crisis line centers are often the first contact for individuals reaching out for mental health related services (Predmore et al., 2017). Rarely, though, has research focused on characterizing the victimization histories reported by callers, as we have done in the current study. For example, results demonstrated that Deaf callers were most frequently reporting adult violence relative to other victimization types. This aligns with the Deaf population having higher rates of psychological, physical, and sexual violence compared to the hearing population (e.g., Anderson & Pezzarossi, 2014). Additionally, it is well established that rates of suicide are higher among the LGBTQ population when compared to the rest of the population (e.g., Haas et al., 2010). This is consistent with our finding that among LGBTQ callers, approximately 35% were calling about suicide. As such, the patterns reflected here appear to be consistent with the larger literature on the mental health problems faced by specific types of callers and demonstrate the necessity for crisis line centers to equip themselves with the information necessary to serve callers from diverse backgrounds.
The results of this United States-based study have important public and community health implications. Although we do not have data on whether crisis calls resulted in improved prospective outcomes for callers, 99.5% of callers asked found the call helpful. This should be interpreted with caution given those who were satisfied are potentially more likely to respond to this question than those who were not, which may introduce selection bias. Even considering this, it seems reasonable that our results lend support to crisis lines as an effective and inexpensive service to help individuals in crisis and direct them to resources in their community. Crisis lines, therefore, continue to be an important public and community health intervention.
Several recommendations are worth considering. Although the current study focuses on a single (albeit broad with respect to victimization focus and populations served) crisis line center, these recommendations are likely applicable to other crisis line providers. First, the overall rate of referrals provided to callers were relatively low (16.72% of all calls) compared to other rates reported in the literature (e.g., between 47 [e.g., Gould et al., 2004] and 60% [Kalafat et al., 2007]) and given referrals are a primary function of the crisis line center that was the subject of this investigation. There could be several explanations for this pattern, such as callers declining referrals or just wanting to talk (e.g., Evans et al., 2013), support/needs met during the call thus not necessitating referrals, referral being made internally to the organization who provides the crisis service, volunteers failing to document referrals, and/or volunteers being less likely to provide referrals than paid staff. Regardless, this suggests that crisis line providers might benefit from having a clear referral protocol or making it standard practice to provide a given referral and document that the referral was made. This is especially important given (a) referral rates are sometimes used as an outcome variable in research especially for those crisis lines who treat referrals as a major function of their service and (b) previous research demonstrating that nearly one third of callers follow up on mental health referrals (Kalafat et al., 2007). Although providing referrals may not be the top priority for crisis line centers and may not be warranted in every situation, standard center-specific protocols would likely be beneficial to callers and volunteers and would allow for accurate evaluation of compliance and fidelity. Second, results suggest that staff should be equipped to handle calls from diverse groups of individuals and should receive training on how to conceptualize mental health problems within the context of a caller’s background or identity. Volunteer and staff trainings should focus on issues relevant to specific subpopulations and the issues they might be likely to call about (e.g., suicide within the LGBTQ population) as well referrals that may be beneficial to a caller based on their personal identities. Third, the rates of calls were lowest for groups such as immigrants and Veterans when compared to others such as Deaf and LGBTQ callers. Although this may be explained by the availability of other resources for these groups (e.g., Veterans’ Crisis Lines), it may also be worthwhile to increase dissemination efforts with a particular focus on these subpopulations through the use of targeted messaging (Karras et al., 2017), depending on the proportion of these populations within the region(s) the crisis line serves. Notably, there may be additional obstacles for callers with certain identities and backgrounds, such as language barriers in the case of immigrants and those with limited English proficiency. Thus, crisis lines would be well advised to be aware of translation and interpreting services available to them. Fourth, call volume appeared to be highest during the late night and early morning hours as well as during the late summer and fall (July-November). This is important for staff and volunteer management, suggesting these may be especially key times to consider when staffing crisis lines (although peak times may also vary based on other factors such as the day of the week [e.g., weekend versus weekday]; see O’Neill et al., 2019 for a full discussion of crisis line usage patterns). Fifth, the high median duration of text messaging contacts (60 minutes), although consistent with previous research, suggests that this modality may not be the most efficient communication method. However, this should be weighed with research demonstrating text messaging may be more convenient, acceptable, and widely used, particularly among younger age groups (e.g., Evans et al., 2013). Future research may consider focusing more specifically on modality, such as the identification of unique factors impacting effectiveness and/or acceptability of crisis intervention components delivered by text versus phone call. Finally, given only 61% of callers were asked if the call was helpful, it is important to emphasize the necessity of assessing this information consistently, as it is vital for evaluating crisis line services as community and public health interventions.
Although this serves as an important starting place for characterizing a crisis line service over a 12-month period, there are also several limitations that must be considered. Primarily, there were no systematic reliability checks (e.g., double coding) following data entry. Individuals performing data entry were trained and supervised, and the third author performed checks on subsamples of the data within each month period, however, this was not performed systematically, suggesting the possibility for data entry errors. Given the primary goal of crisis lines is to provide a public service, often at the hands of volunteers, data management understandably tends to be a secondary (or even tertiary) priority. However, recommendations for ongoing evaluation and improvement may require more stringent data design (e.g., developing more specific and user-friendly call report forms), recording (e.g., requiring specific details on any referral designated as “other”; indicating “not applicable” when a referral was not warranted; requiring volunteers to note a reason for calling), and data monitoring systems (e.g., quality assurance, double coding) to become a higher priority. Improvements in data design and recording could help address whether, for example, some callers were more likely to provide feedback on the helpfulness of a call than others, thus providing information about possible differences between those who chose to respond and those who did not. It would also be useful to more directly evaluate volunteer fidelity in asking whether or not the call is helpful in order to ascertain possible selection bias of this key variable. An additional limitation is that this study is purely descriptive. This is because we were unable to make inferences or statistical comparisons between groups, due to inability to assess independence of datapoints (i.e., calls) as a result of caller anonymity and lack of available data or sources to infer repeat callers, such as encrypted phone numbers. Although advantageous, anonymity makes it difficult to treat these values as “true” rates given we cannot be certain they reflect unique, independent callers. As a result, we were unable to make inferences about correlation or causation between variables. This limitation is not unique to our study and is also a well-known issue in the larger crisis line literature. Relatedly, the decision to use victimization type composites was due to interrelatedness of some types, specifically adult and child-related violence and financial victimization. This may have obscured certain nuances (e.g., demographic groups with high frequencies of child physical abuse/neglect) of relevance. Of note, though, all raw victimization type frequencies can be found in Supplemental Table 1. Further, it should be noted that there are specific hotlines that serve Veterans and individuals that identify as LGBTQ, for example, which may impact the interpretation of rates of certain groups utilizing crisis lines from this study alone. Thus, crisis lines should consider the demographic composition of their area and other available resources when evaluating the accessibility of their services to diverse groups. Lastly, because the call report forms used by the current crisis line center did not separate reason for calling and victimization history, we were unable to examine these separately. Crisis line centers should consider disaggregating this information in their call report forms or tracking. This could, for example, help crisis line centers better assess (a) how the current needs of callers are being met and (b) the types of callers, in terms of risk profile, that are utilizing their services. Despite these limitations, we believe this provides an important starting place for characterizing crisis line service utilization and assert that the characterization of call volume across time and month, coupled with information on caller victimization history, are especially unique features of this data set.
This study provides an important glance at 12-month call rates for a crisis line center and provides an overview of the types of callers, victimization, calls, and referrals. To extend this work, it is important to consider relevant outcome measures such as suicide risk or lethality, symptomatology, and service utilization. This would allow a more direct evaluation of the effectiveness of crisis line interventions and potentially provide more concrete recommendations for improving this community health service.
Supplementary Material
What is known about this topic:
Crisis line services provide a valuable community resource for those in acute crisis and are often the first contact for individuals seeking mental health services.
Research on crisis line services, particularly the characterization of callers, is difficult given anonymity.
What this papers adds:
A characterization of crisis line caller victimization histories whereby adult (e.g., domestic/sexual violence) and child (e.g., child physical assault/neglect or sexual abuse) violence were the most frequent types of victimization within this sample.
Providers should enrich volunteer training with information related to diversity, especially if their service targets specific subgroups such as Deaf people or Veterans.
Providers need to develop clear and standardized protocols for documenting calls and call outcomes.
Acknowledgments
The work was supported by the National Institute of Health grants [F31AA026177 to Cassandra L. Boness, T32AA13526 to Ashley C. Helle (PI: Kenneth J. Sher)]. These funding sources had no other involvement other than financial support. The authors have no conflicts of interest to declare.
We would like to thank Tyler Hannsz and Wendy Logan for their assistance with data entry and management.
Contributor Information
Cassandra L. Boness, Department of Psychological Sciences, University of Missouri, 200 South Seventh Street, Columbia, MO 65211.
Ashley C. Helle, Department of Psychological Sciences, University of Missouri, 200 South Seventh Street, Columbia, MO 65211.
Stephanie Logan, DeafLEAD, 2505 West Ash Street, Columbia, Missouri, 65203.
References
- Anderson ML, & Pezzarossi CMK (2014). Violence against deaf women: Effect of partner hearing status. Journal of Deaf Studies and Deaf Education, 19(3), 411–421. 10.1093/deafed/ent053 [DOI] [PubMed] [Google Scholar]
- Barber JG, Blackman EK, Talbot C, & Saebel J (2004). The themes expressed in suicide calls to a telephone help line. Social Psychiatry and Psychiatric Epidemiology, 39(2), 121–125. 10.1007/s00127-004-0718-8 [DOI] [PubMed] [Google Scholar]
- Bassilios B, Harris M, Middleton A, Gunn J, & Pirkis J (2015). Characteristics of people who use telephone counseling: Findings from secondary analysis of a population-based study. Administration and Policy in Mental Health and Mental Health Services Research, 42(5), 621–632. doi: 10.1007/s10488-014-0595-8 [DOI] [PubMed] [Google Scholar]
- Britton PC, Bossarte RM, Thompson C, Kemp J, & Conner KR (2013). Influences on call outcomes among veteran callers to the national veteran’s crisis line. Suicide and Life-Threatening Behavior, 43(5), 494–502. 10.1111/sltb.12033 [DOI] [PMC free article] [PubMed] [Google Scholar]
- Burgess N, Christensen H, Leach LS, Farrer L, & Griffiths KM (2008). Mental health profile of callers to a telephone counselling service. Journal of Telemedicine and Telecare, 14(1), 42–47. doi: 10.1258/jtt.2007.070610 [DOI] [PubMed] [Google Scholar]
- Coveney CM, Pollock K, Armstrong S, & Moore J (2012). Callers’ experiences of contacting a national suicide prevention helpline: Report of an Online Survey. Crisis, 33(6), 313–324. 10.1027/0227-5910/a000151 [DOI] [PMC free article] [PubMed] [Google Scholar]
- Evans WP, Davidson L, & Sicafuse L (2013). Someone to listen: Increasing youth help-seeking behavior through a text-based crisis line for youth. Journal of Community Psychology, 41(4), 471–487. 10.1002/jcop.21551 [DOI] [Google Scholar]
- Gould MS, Lake AM, Galfalvy H, Kleinman M, Munfakh J Lou, Wright, J., & McKeon, R. (2018). Follow-up with callers to the National Suicide Prevention Lifeline: Evaluation of callers’ perceptions of care. Suicide and Life-Threatening Behavior, 48(1), 75–86. 10.1111/sltb.12339 [DOI] [PubMed] [Google Scholar]
- Gould MS, Munfakh JLH, Kleinman M, & Lake AM (2012). National Suicide Prevention Lifeline: Enhancing mental health care for suicidal individuals and other people in crisis. Suicide and Life-Threatening Behavior, 42(1), 22–35. 10.1111/j.1943-278X.2011.00068.x [DOI] [PubMed] [Google Scholar]
- Haas AP, Eliason M, Mays VM, Mathy RM, Cochran SD, D’Augelli AR, … Clayton PJ (2010). Suicide and suicide risk in lesbian, gay, bisexual, and transgender populations: Review and recommendations. Journal of Homosexuality, 58, 10–51. 10.1080/00918369.2011.534038 [DOI] [PMC free article] [PubMed] [Google Scholar]
- Hertel BR (1976). Minimizing error variance introduced by missing data routines in survey analysis. Sociological Methods & Research, 4(4), 459–474. [Google Scholar]
- Kalafat J, Gould MS, Lou Harris Munfakh J, & Kleinman M (2007). An Evaluation of crisis hotline outcomes part 1: Nonsuicidal crisis callers. Suicide and Life-threatening Behavior, 37(3), 322–337. 10.1521/suli.2007.37.3.322 [DOI] [PubMed] [Google Scholar]
- Karras E, Lu N, Elder H, Tu X, Thompson C, Tenhula W, … Bossarte RM (2017). Promoting help seeking to veterans: A comparison of public messaging strategies to enhance the use of the veteran’s crisis line. Crisis, 38(1), 53–62. 10.1027/0227-5910/a000418 [DOI] [PubMed] [Google Scholar]
- Middleton A, Gunn J, Bassilios B, & Pirkis J (2014). Systematic review of research into frequent callers to crisis helplines. Journal of Telemedicine and Telecare, 20(2), 89–98. 10.1177/1357633X14524156 [DOI] [PubMed] [Google Scholar]
- Middleton A, Woodward A, Gunn J, Bassilios B, & Pirkis J (2017). How do frequent users of crisis helplines differ from other users regarding their reasons for calling? Results from a survey with callers to Lifeline, Australia's national crisis helpline service. Health & Social Care in the Community, 25(3), 1041–1049. doi: 10.1111/hsc.12404 [DOI] [PubMed] [Google Scholar]
- O’Connor RC, Rasmussen S, & Beautrais A (2016). Recognition of suicide risk, crisis helplines, and psychosocial interventions: A selective review. In O’Connor C & Pirkis J (Eds.), The international handbook of suicide prevention: Research, policy and practice (pp. 435–456). John Wiley & Sons. [Google Scholar]
- O’Neill S, Bond RR, Grigorash A, Ramsey C, Armour C, & Mulvenna MD (2019). Data analytics of call log data to identify caller behaviour patterns from a mental health and well-being helpline. Health Informatics Journal, 25(4), 1722–1738. 10.1177/1460458218792668 [DOI] [PubMed] [Google Scholar]
- Ohtaki Y, Oi Y, Doki S, Kaneko H, Usami K, Sasahara S, & Matsuzaki I (2017). Characteristics of telephone crisis hotline callers with suicidal ideation in Japan. Suicide and Life-Threatening Behavior, 47(1), 54–66. doi: 10.1111/sltb.12264 [DOI] [PubMed] [Google Scholar]
- Predmore Z, Ramchand R, Ayer L, Kotzias V, Engel C, Ebener P, … & Haas GL (2017). Expanding suicide crisis services to text and chat. Crisis, 38, 255–260. 10.1027/0227-5910/a000460 [DOI] [PubMed] [Google Scholar]
- Rochester Institute of Technology. (2011). National Technical Institute for the Deaf: Collaboratory on Economic, Demographic and Policy Studies. Retrieved from https://www.rit.edu/ntid/collaboratory#demographics [Google Scholar]
- Spittal MJ, Fedyszyn I, Middleton A, Bassilios B, Gunn J, Woodward A, & Pirkis J (2015). Frequent callers to crisis helplines: Who are they and why do they call? Australian & New Zealand Journal of Psychiatry, 49(1), 54–64. doi: 10.1177/0004867414541154 [DOI] [PubMed] [Google Scholar]
Associated Data
This section collects any data citations, data availability statements, or supplementary materials included in this article.