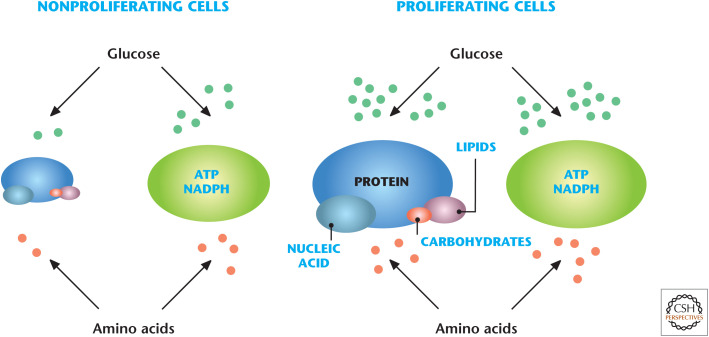
An instructive example of the integration of multiple metabolic pathways covered in this book is to examine the metabolic needs of proliferating cells (e.g., T cells, stem cells, and cancer cells). A distinguishing feature of proliferating cells compared with nonproliferating cells (e.g., quiescent or differentiated cells) is the massive anabolism that proliferating cells undergo when they double their total biomass to subsequently divide into two daughter cells. Cell metabolism is reprogrammed to increase the uptake of nutrients that feed metabolic pathways to ultimately supply carbon, nitrogen, ATP, and NADPH for production of lipids, proteins, and nucleotides needed to build two daughter cells (Fig. 1). ATP and NADPH are necessary to drive many of the thermodynamically unfavorable anabolic reactions. ATP and NADPH also maintain housekeeping functions, such as maintenance of ion gradients across membranes and antioxidant capacity, respectively. In contrast, nonproliferating cells do not have an excessive need to conduct anabolic functions and catabolize their nutrients to generate ATP and NADPH for housekeeping functions (Fig. 1). This review focuses on the metabolism of proliferating cells with special attention on T- and cancer-cell proliferation as examples of normal- and malignant-cell proliferation, respectively.
Figure 1.
Proliferating versus nonproliferating cells have different metabolic needs. Nonproliferating cells do not have an excessive need to conduct anabolic functions, thus they catabolize their nutrients to generate ATP and NADPH for housekeeping functions. In contrast, proliferating cells engage in a massive anabolic program to generate lipids, proteins, and nucleotides. (Adapted from Vander Heiden 2011, by permission from Macmillan Publishers Ltd.)
GLYCOLYSIS AND MITOCHONDRIAL METABOLISM ARE CENTRAL PATHWAYS SUPPORTING CELL PROLIFERATION
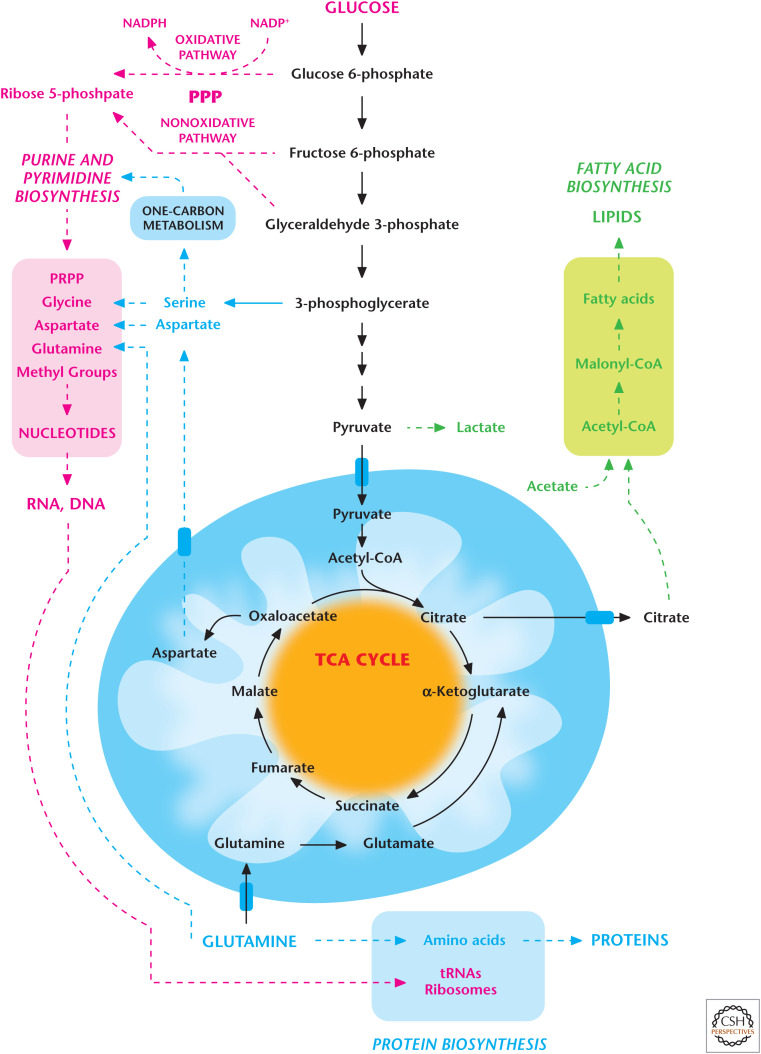
In the 1920s, Otto Warburg initially recognized that copious amounts of lactate are generated in rapidly proliferating ascites tumors (see Chandel 2020a). This phenomenon, termed the Warburg effect or aerobic glycolysis, has since been observed across several tumor types and proliferating T and embryonic stem cells. Many studies, including Warburg's study, conclude that proliferating cells do not engage robustly in mitochondrial metabolism and that aerobic glycolysis is the only major feature of proliferating cells' metabolic phenotype. However, as discussed in Chandel (2020b), mitochondria generate metabolites required for lipids, proteins, and nucleic acids. In fact, most cancer cells have functional mitochondrial oxidative metabolism. The current consensus in the field is that proliferating cells use extracellular nutrients (glucose, amino acids, and oxygen) to fuel glycolysis and mitochondrial metabolism for the production of lipids, proteins, and nucleotides (Fig. 2).
Figure 2.
Proliferating cells require glycolysis and mitochondrial metabolism. Proliferating cells use extracellular nutrients (glucose, amino acids, and oxygen) to fuel glycolysis and its subsidiary pathways, including pentose phosphate pathway (PPP) and one-carbon metabolism, as well as mitochondrial metabolism for the production of lipids, proteins, and nucleotides. (Adapted from Deberardinis et al. 2008, with permission from Elsevier.)
Proliferating cells increase glucose uptake and display robust flux through glycolysis and its subsidiary pathways, including the pentose phosphate, hexosamine, serine, and glycerol biosynthetic pathways, compared with quiescent cells. The pentose phosphate pathway (PPP) uses glucose 6-phosphate as a precursor to produce ribose 5-phosphate for synthesis of nucleotides. This pathway also is a source of the NADPH used to drive anabolic pathways and maintain antioxidant capacity (see Chandel 2020c). The hexosamine biosynthetic pathway uses fructose 6-phosphate, resulting in glycosylation of proteins, including the growth factor receptors that are essential to sustain the proliferative signaling (Chandel 2020d). The glycolytic intermediate 3-phosphoglycerate generates serine and, subsequently, glycine, an important precursor for glutathione (GSH) and purine synthesis. Serine also feeds into one-carbon metabolism to generate NADPH and folate intermediates needed for nucleotide synthesis (see Chandel 2020c). The glycolytic intermediate glyceraldehyde 3-phosphate generates glycerol 3-phosphate, which is used to produce lipids.
The increase in glycolytic flux requires a constant supply of NAD+, which is essential for the conversion of glyceraldehyde 3-phosphate to 1,3-bisphosphoglycerate by glyceraldehyde 3-phosphate dehydrogenase (step 6 of glycolysis). In this reaction, NAD+ becomes NADH. The regeneration of NAD+ can occur either by shuttling NADH into mitochondria to allow the mitochondrial electron transport chain complex I to generate the NAD+ and then shuttling it back to the cytoplasm or converting the end product of glycolysis pyruvate to lactate by lactate dehydrogenase A (LDH-A), which regenerates NAD+ from NADH. The shuttling of NADH into mitochondria is a slower process. Proliferating cells express abundant levels of LDH-A protein, thus, favoring the production of lactate, which is secreted from the cell. The release or uptake of lactate is through monocarboxylate transporters (MCTs) 1 and 4. At physiological pH, the lactate ion (CH3CH(OH)COO−) is dissociated from its proton H+. However, when transported through MCTs, the proton and lactate anion are associated as lactic acid. Thus, MCTs mediate membrane transport with 1:1 coupling between lactate and H+ fluxes. The secreted lactate is not simply a wasteful product containing carbon molecules. It can be recycled through the Cori cycle to generate glucose in the liver (see Chandel 2020e) or used by other cells, such as neurons, as a fuel source. The reaction catalyzed by lactate dehydrogenase (LDH) is a reversible reaction whereby lactate can be converted into pyruvate, and pyruvate subsequently enters the mitochondria to generate ATP. Interestingly, lactate and accompanying H+ (intracellular pH drop) have been shown to influence angiogenesis and cell migration through poorly understood mechanisms.
Glycolysis and its subsidiary pathways are not sufficient to fulfill the metabolic demands of proliferating cells. The other metabolic pathways that fulfill these demands are in the mitochondria. Mitochondrial one-carbon metabolism generates NADPH for redox balance within mitochondria and folate intermediates for nucleotide synthesis. Furthermore, the TCA-cycle intermediates are used as precursors for macromolecule synthesis. For example, the TCA-cycle intermediate citrate is exported to the cytosol for lipid synthesis (Chandel 2020f). Two-carbon acetyl-CoA and four-carbon oxaloacetate generate the six-carbon citrate. Pyruvate dehydrogenase (PDH) oxidizes pyruvate to generate acetyl-CoA. Pyruvate is produced by glycolysis and/or alanine in the cytosol and, subsequently, is transported into the mitochondria by the pyruvate transporter. Once mitochondrial citrate is generated, it can continue through the TCA cycle and eventually generate oxaloacetate for another round of condensation with acetyl-CoA, resulting in new citrate. However, proliferating cells export a substantial fraction of citrate to the cytoplasm, where it is cleaved by the enzyme ATP citrate lyase (ACLY) to produce acetyl-CoA and oxaloacetate. Acetyl-CoA is used by fatty acid synthase to synthesize lipids. Thus, glucose carbon can eventually become acetyl-CoA in the cytoplasm to produce lipids. The oxaloacetate produced generates malate or aspartate. Malate can be converted into pyruvate by the cytosolic malic enzyme to generate NADPH used for fatty acid synthesis. Aspartate is used for de novo nucleotide synthesis. Aspartate can also be generated within mitochondria from oxaloacetate and transported into the cytoplasm.
In addition to citrate, other TCA-cycle metabolites are used to generate biosynthetic reactions. For example, succinyl-CoA is used for heme synthesis. The export of the TCA-cycle intermediates depletes the cycle of metabolites and the rate-limiting metabolite oxaloacetate. Thus, the cycle must be replenished to generate different TCA-cycle metabolites, resulting in the generation of oxaloacetate and allowing the cycle to continue to function. An important replenishment mechanism is the use of glutamine conversion into glutamate and, subsequently, into α-ketoglutarate (glutaminolysis, see Chandel 2020b). In vitro and in vivo experiments show that many proliferating cells consume glutamine in significantly greater amounts than other amino acids available to the cell. Glutamine is the most abundant amino acid in plasma. Glutamine is also a required nitrogen donor for the de novo synthesis of both purines and pyrimidines, and in the rate-limiting step catalyzed by glutamine:fructose-6-phosphate amidotransferase, to form glucosamine 6-phosphate, a precursor for N- and O-linked glycosylation reactions. Finally, glutamine generates glutamate, which is one of the amino acids required for production of the tripeptide GSH, the others being cysteine and glycine.
It is important to note that not all proliferating cells will display glutaminolysis. For example, mouse embryonic stem cells use threonine to feed the TCA cycle. Furthermore, some proliferating cells use pyruvate to generate both acetyl-CoA and oxaloacetate through PDH and pyruvate carboxylase (PC), thus, relieving the necessity to perform glutaminolysis. Acetate can also generate acetyl-CoA for lipid synthesis. There are many inputs into the TCA cycle by amino acids (Chandel 2020b); thus, it is possible that in vivo there are likely other amino acids, aside from glutamine, that are essential in replenishing the TCA cycle as its metabolites are siphoned off for building macromolecules.
In addition to generating metabolites that build macromolecules, glycolysis and mitochondrial metabolism also produce ATP, which provides the Gibbs free energy (ATP/ADP) to drive unfavorable anabolic reactions. A widely held assumption is that rapidly proliferating cells generate ATP from glycolysis. However, multiple studies in the past decade have carefully evaluated the rate of ATP production from glycolysis and mitochondrial metabolism in proliferating cells and have concluded that although glycolysis does contribute to ATP production, the majority of ATP is derived from mitochondrial metabolism under normal and low-oxygen conditions in most proliferating cells. Endothelial cells are a notable exception and produce significant amounts of ATP from glycolysis. As long as mitochondrial enzymes in the TCA cycle or electron transport complexes are functional, proliferating cells can generate enough ATP through mitochondrial metabolism. Although TCA-cycle intermediates, like citrate, are siphoned off for building macromolecules in the cytoplasm, the constant replenishment of TCA-cycle metabolites by amino acids like glutamine can sustain the TCA cycle to generate the reducing equivalents NADH and FAHD2, which feed into the electron transport chain to produce ATP through oxidative phosphorylation.
NADPH DRIVES ANABOLISM AND MAINTAINS REDOX BALANCE IN PROLIFERATING CELLS
Many of the energetically unfavorable anabolic reactions in cells are coupled to NADPH/NADP+, and thus proliferating cells have high demand for NADPH production. NADPH is also used to bolster antioxidant capacity (see Chandel 2020c) in proliferating cells that produce ROS as a by-product of the enhanced oxidative metabolism that occurs in the mitochondria and protein folding in the endoplasmic reticulum. There are multiple sources of NADPH production that proliferating cells can use in the cytosol and mitochondria. The PPP, isocitrate dehydrogenase 1 (IDH1), one-carbon metabolism, and malic enzyme are major cytosolic sources of NADPH. One-carbon metabolism is a major source of mitochondrial NADPH. Different proliferating cells are likely dependent on different cytosolic or mitochondrial sources of NADPH. For example, cancer cells harboring a mutant K-ras oncogene use the nonoxidative arm of the PPP to generate ribose-5-phosphate, thus, bypassing the reaction that produces NADPH. In these cells, glutamine-derived malate production is used by cytosolic malic enzyme as the dominant source of NADPH. It is important to note that in any given cell, the dominant NADPH production site will be dependent on the available substrates and enzyme levels of a particular NADPH-generating reaction.
NUTRIENT UPTAKE THROUGH TRANSPORTERS IS ESSENTIAL FOR PROLIFERATION
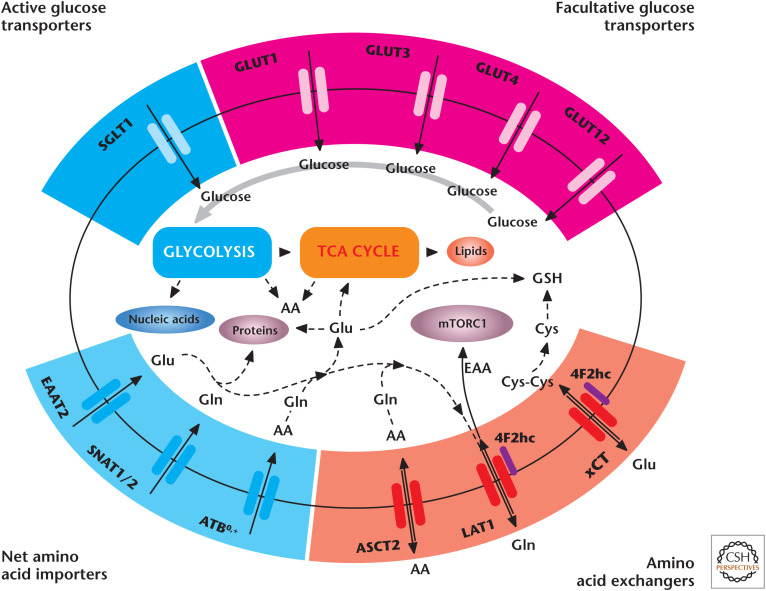
An obvious consideration when discussing metabolic requirements of cell proliferation is the uptake of nutrients. Amino acids and sugars are polar molecules and so cannot cross the cell membranes without members of the solute carrier (SLC) family of membrane transport proteins (Fig. 3). Glucose and other sugars cross the cell membrane either by facilitated diffusion through glucose transporters (GLUTs) or by active transport through sodium–glucose transporters (SGLTs). Many of the nutrient transporters have common names but do adhere to the specific SLC nomenclature; for example, GLUT1 is SLC2A1. There are 11 SLC families committed to the transport of amino acids. Some of these amino acid transporters important for cell proliferation are linked to the 4F2 heavy chain (4F2hc, CD98, or SLC3A2). 4F2hc is not a nutrient transporter but dimerizes and acts as a chaperone for transporters, such as LAT1 (SLC7A5) and xCT (SLC7A11). The 4F2hc/LAT1 complex exchanges glutamine and other amino acids out of the cell for essential amino acids transported into the cell to stimulate mechanistic target of rapamycin complex 1 (mTORC1), a potent anabolic kinase. The Na+-dependent transporter ASCT2 (SLC1A5) cooperates with 4F2hc/LAT1 by providing glutamine as an export substrate for essential amino acid (EAA) import. xCT exchanges glutamate out of the cell for cystine into the cell, for conversion into intracellular cysteine required for GSH synthesis. SNAT1 (SLC38A1) and SNAT2 transport glutamine into proliferating cells, whereas EAAT2 (SLC1A2) transports glutamate without exchanging for other amino acids. The expression of sugar and amino acid transporters at the transcriptional and posttranscriptional levels is regulated by growth factor activation of the PI3K (phosphoinositide 3-kinase) signaling pathway and nutrient availability (see below).
Figure 3.
Cell proliferation requires nutrient transporters. Glucose is imported through SGLTs or GLUTs to fuel glycolysis. Net amino acid transporters, including SNAT1, SNAT2, and ATB0,+, supply glutamine to fuel the TCA cycle and generation of glutamate for GSH synthesis. Glutamine and other amino acids serve as exchange substrates for transporters, such as ASCT2, 4F2hc/LAT1, and 4F2hc/xCT. LAT1 imports EAA to activate mTORC1. Cystine is transported through xCT to support GSH production. AA, amino acid(s); Cys, cysteine; Cys-Cys, cystine; EAA, essential amino acid(s); Glu, glutamate; Gln, glutamine; GLUT, glucose transporter; GSH, glutathione; SGLT, sodium–glucose transporter. (Adapted from McCracken and Edinger 2013, with permission from Elsevier.)
METABOLISM IN T CELLS IS AN EXAMPLE OF NORMAL PROLIFERATING CELLS
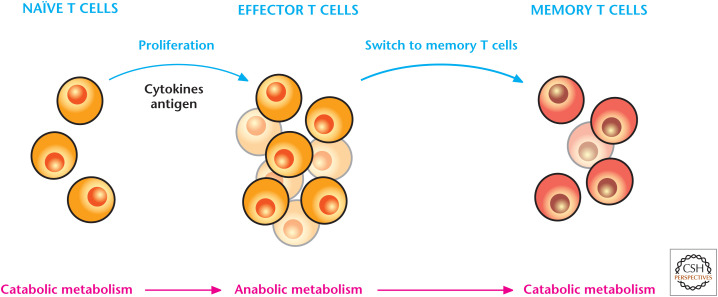
T cells respond to antigens; thus, are central regulators of adaptive immune responses. Quiescent naïve T cells, when challenged with an antigen during infection, rapidly undergo an activation program that initiates rapid proliferation and differentiation into effector T cells (Fig. 4). After the infection is curtailed, most effector T cells die, leaving behind a population of long-lived antigen-specific memory T cells. If a similar infection occurs, then TM cells can be reactivated, rapidly expanding into effector T cells to quickly control the infection. Metabolism dynamically changes throughout these different transitions in T cells. Quiescent T cells are not proliferating and do not have the anabolic requirements of proliferating T cells. Quiescent T cells do not display robust glycolysis, and they use glucose metabolism to generate pyruvate or fatty acid oxidation, which both fuel mitochondria to generate ATP for housekeeping functions, like plasma membrane ion homeostasis. Similarly, the memory T cells use fatty acid oxidation to sustain their survival.
Figure 4.
T cells engage in different types of metabolism depending on their functions. Naïve T cells, following exposure to an antigen during infection, engage in anabolic metabolism, which supports rapid T-effector-cell proliferation and cytokine production. After the infection is curtailed, the effector T-cell response subsides and a few antigen-specific memory T cells remain, which engage in catabolism of nutrients to maintain long-term survival.
Neither the quiescent nor memory T cells are in highly proliferative anabolic mode. T cells switch to an anabolic mode to increase the biomass accumulation required for generating daughter cells upon engagement of the T-cell receptor (TCR) by an antigen. T cells engage in robust glycolysis and mitochondrial metabolism to fulfill their anabolic needs. Glycolysis and its subsidiary biosynthetic pathways are stimulated in proliferating T cells. Mitochondrial TCA-cycle metabolism generates metabolites used for building macromolecules, and glutamine is used to replenish TCA-cycle intermediates. The mitochondrial electron transport chain (ETC) generates ROS, which are necessary for T-cell activation and proliferation. TCR ligation promotes the up-regulation of glucose and amino acid transporters to increase nutrient uptake, as well as the transcription factors c-Myc and estrogen-related receptor α (ERRα), to increase the expression of genes involved in intermediary metabolism. Aside from TCR activation, T cells require CD28 (cluster of differentation 28) costimulation for T-cell proliferation, which activates PI3K signaling pathways to promote glucose metabolism, as well as multiple anabolic pathways, as discussed in Chandel (2020d).
Rapidly proliferating CD4+ T cells can differentiate into different effector T-cell lineages, TH1, TH2, and TH17 or a T regulatory lineage (Treg). TH17 cells display a strong glycolytic phenotype caused by hypoxia-inducible factor 1 (HIF-1) activation in these cells, and blocking glycolysis impairs their function. Tregs display a glycolytic and mitochondrial metabolic phenotype. A critical question for the future is to decipher whether metabolism dictates these different T-cell phenotypes or is a consequence of the phenotype.
ABERRANT ACTIVATION OF SIGNALING PATHWAYS INCREASES ANABOLIC METABOLISM OF PROLIFERATING CANCER CELLS
The metabolism of proliferating cancer cells in part mirrors that of a proliferating T cell, with similar transcription factors, signaling pathways, and nutrients promoting similar anabolic metabolic pathways. The major difference between the two cell types is that cancer cells proliferate in a cell-autonomous manner, whereas T cells are instructed to proliferate by the presence of an antigen. Proliferating cancer cells engage in metabolic pathways that support the massive anabolic program required for the generation of two daughter cells, as discussed above. In mammalian cells, these metabolic pathways are under the control of growth factors and nutrient availability (as discussed in Chandel 2020d). Cancer cells aberrantly drive these signaling pathways that control metabolism. In particular, the gain of oncogenes and loss of tumor suppressor genes, two key features of cancer cells, co-opt metabolism into an anabolic program. During the evolution of a tumor, cancer cells have the metabolic plasticity to adjust to the different microenvironments they encounter, ranging from abundant to limiting nutrients.
Cancer is a heterogeneous collection of diseases with genomic heterogeneities between histologically similar tumors. Thus, it is of no surprise that cancer cells display metabolic heterogeneity and there is no universal cancer metabolism model sufficient to describe the metabolic changes required to support tumor growth. However, what is consistent among a spectrum of tumors is that to grow they need (1) sufficient energy (ATP and NADPH), (2) building blocks to generate macromolecules, and (3) redox balance maintenance due to their high-production ROS. Cancer cells can use diverse pathways to harness these three important constituents to support growth. For example, some tumors might acquire fatty acids in large amounts from the extracellular milieu and use it to generate membranes and fuel mitochondrial metabolism through fatty acid oxidation. In contrast, certain tumors will use glucose and glutamine to generate de novo lipid synthesis. Although glucose and glutamine have been linked as major fuel sources for cancer cells, it is likely that a range of other amino acids are also important sources of carbon and nitrogen molecules required for building macromolecules, as well as generating sufficient energy for growth. Mitochondria and glycolysis are two major sources of ATP in cancer cells, and, depending on their microenvironment nutrient availability and genetic lesions, these cells can engage in either one or both of these pathways for ATP generation. As discussed previously, there are multiple sources of NADPH and cancer cells can call on any or all of these sources.
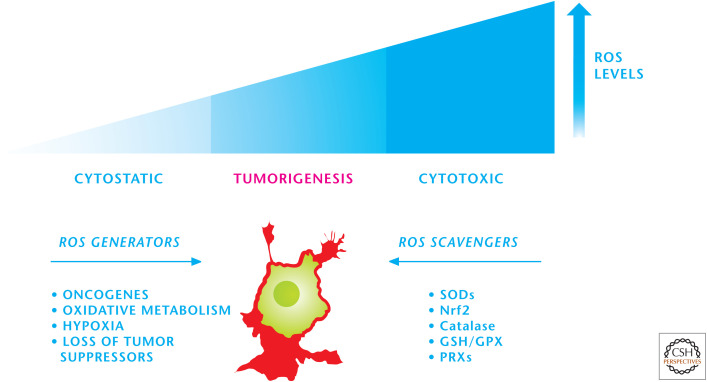
Finally, cancer cells use NADPH oxidases and the mitochondrial ETC to produce the ROS, which maintain many of the signaling pathways in an activated state. Cancer cells also show high protein folding levels in the endoplasmic reticulum, and this process also generates ROS as a by-product. The high rate of ROS production is counterbalanced by an equally high rate of antioxidant activity in cancer cells to maintain redox balance (Fig. 5). Cancer cells show different rates of ROS production and induce a multitude of antioxidant proteins and so are heterogeneous in their antioxidant profile and capacity. If cancer cells do not control their ROS levels, then they are susceptible to oxidative stress-induced cell death. The signaling pathways responsive to ROS are proximal to the locations of ROS generation, allowing activation of these pathways despite the high overall antioxidant activity in cancer cells that protects against oxidative stress-induced cell death.
Figure 5.
Cancer cells maintain redox balance. Cancer cells have an elevated production of ROS, which activates proximal signaling pathways necessary for tumorigenesis. The high rate of ROS production is counterbalanced by an equally high rate of antioxidant activity in cancer cells to maintain redox balance. GPX, glutathione peroxidases; PRXs, peroxiredoxins.
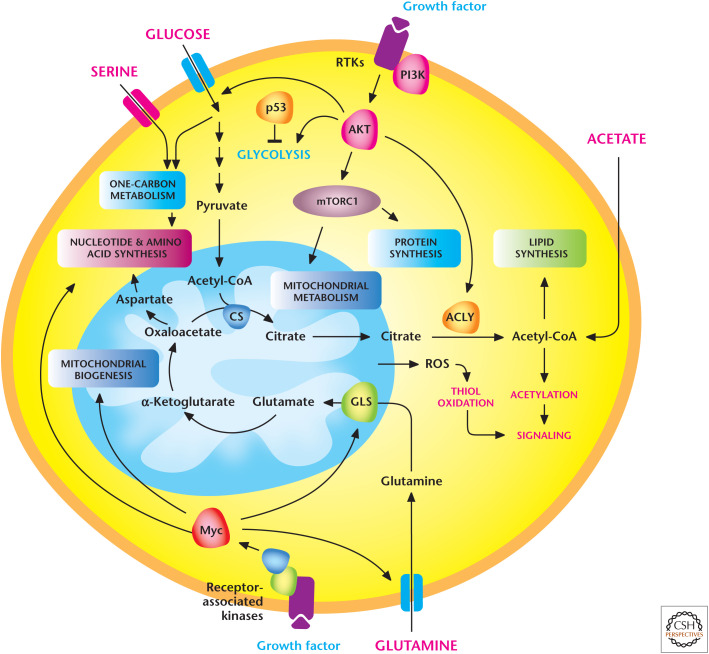
Despite the genetic and metabolic heterogeneity of tumor cells, it is worth mentioning a few recurring pathways that co-opt metabolism to support the growth of tumors (Fig. 6). In normal cells, growth factors, through engagement of their receptors, activate PI3K and its downstream pathways AKT and mTOR, which promote a robust anabolic program (see Chandel 2020d). Tumor cells have gain-of-function mutations in PI3K or loss-of-function mutations in PTEN, the negative regulator of PI3K, that alleviate the necessity of growth factor–dependent signaling. In fact, there are multiple oncogenes and tumor suppressors identified in the PI3K signaling pathway network, and aberrant activation of this pathway is among the most frequent alterations seen in a diverse set of cancers. For example, the oncogenic K-ras, which is frequently found in lung, colon, and pancreatic cancers, uses the PI3K pathway to stimulate anabolic metabolism for tumor growth. Oncogenic K-ras also uses the proto-oncogene MYC to promote an anabolic program to support growth. MYC is also aberrantly activated by chromosomal translocations, gene amplification, and single-nucleotide polymorphisms in a variety of cancers. MYC increases the expression of many genes, including those involved in anabolic pathways that support cell proliferation and growth, such as glycolysis, fatty acid synthesis, glutaminolysis, serine and glycine metabolism, nutrient transporters, and mitochondrial metabolism.
Figure 6.
Signaling pathways that regulate cancer cell metabolism. Tumor cells have gain-of-function mutations in PI3K or loss-of-function mutations in PTEN, the negative regulator of PI3K, that alleviate the necessity of growth factor–dependent signaling. MYC, which is aberrantly activated in a variety of cancers, increases the expression of many genes involved in anabolic pathways that support cell proliferation and growth. Metabolism can also regulate signaling, in part, through production of mitochondrial ROS and acetyl-CoA. GLS, glutaminase; ACLY, ATP-citrate lyase; CS, citrate synthetase. (Adapted from Ward and Thompson 2012.)
Aside from oncogenes, tumor suppressors, such as the p53 transcription factor and the kinase LKB1 (liver kinase B1), can also regulate metabolism. The p53 protein–encoding gene TP53 (tumor protein p53) is mutated or deleted in 50% of all human cancers. Since its initial discovery, much of the tumor-suppressive functions of p53 have been examined in the context of DNA repair, cell-cycle arrest, senescence, and apoptosis. However, in the past decade, p53 tumor-suppressive actions have begun to be ascribed to metabolism. p53 represses glucose flux through glycolysis. At this point, it is unclear whether this metabolic reprogramming contributes to the tumor-suppressive activity of p53. The serine-threonine kinase LKB1 is notably mutated in lung adenocarcinoma, and germline mutations of this gene are associated with Peutz–Jeghers syndrome, an autosomal dominant disorder characterized by growth of polyps in the gastrointestinal tract. LKB1 positively regulates the catabolic kinase AMPK (AMP-activated protein kinase) (see Chandel 2020d). Therefore, loss of LKB1 disables the ability to promote AMPK activation. This prevents cells from diminishing anabolic growth, which is necessary for adaptation during limiting of nutrients. However, it is not clear whether LKB1's tumor-suppressive function is through AMPK activation. There are reports to indicate that AMPK activation or inhibition could be tumor promoting or tumor suppressive depending on the context of the cancer.
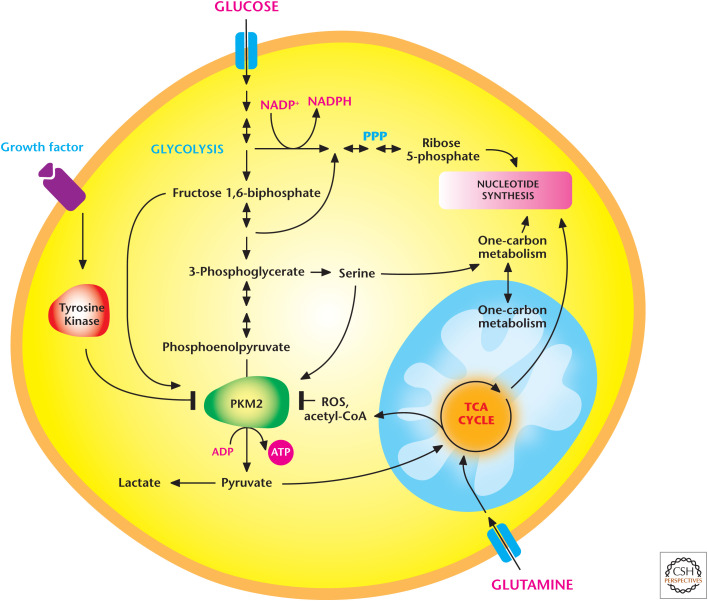
Cancer cells also express specific members of a metabolic enzyme family to fulfill their metabolic needs. The best-described example of selective isoform expression described to date is the pyruvate kinase family members (PKs). PKs catalyze the final irreversible and ATP-producing step of glycolysis in which phosphoenolpyruvate (PEP) is converted to pyruvate. There are four members of the PK family in mammals. The liver-restricted PKL and red blood cell–restricted PKR are splice variant isoforms encoded by the PK-LR gene. PKM1 and PKM2 are splice variant isoforms encoded by the PK-M gene. The M1 and M2 isoforms differ by a single exon and share ∼96% sequence identity at the amino acid level. Most proliferating cells, including cancer cells, express the M2 isoform of the enzyme rather than its M1 splice variant. Cancer cells engineered to express PKM1 instead of PKM2 display reduced tumor-forming ability, underscoring the importance of PKM2 for cancer progression. PKM2 alternates between a dimer that shows low catalytic activity and a highly active tetramer. Paradoxically, however, PKM2 has an enzymatic activity half that of PKM1 and is typically found inactive in vivo. This is due, in part, to tyrosine phosphorylation specific to the M2 isoform, a modification that inhibits its activity by disrupting tetramer assembly (Fig. 7). Furthermore, the increased availability of cytosolic acetyl-CoA in proliferating cells causes acetylation of PKM2 at lysine 305 to further reduce its activity. ROS also can oxidize PKM2 at specific cysteine residues, resulting in its inactivation. In contrast, PKM1 is constitutively active and not regulated by ROS or tyrosine kinase signaling. One model to explain why PKM2 is advantageous to cancer cells is that PKM2 fluctuates between an inactive and active state to regulate metabolism, depending on nutrient and growth factor availability. When nutrients are not limiting and growth factor–dependent signaling pathways are active, PKM2 is maintained in an inactive state, thus allowing the buildup of glycolytic intermediates that funnel into subsidiary pathways, such as the hexosamine pathway, PPP, and serine-dependent one-carbon metabolism pathway to support cell proliferation. When nutrients become limiting or growth factor signaling diminishes, cells switch from an anabolic to a catabolic program and also activate PKM2 to generate ATP. A perplexing observation is that proliferating cells showing low PKM2 activity can still generate lactate. In theory, diminished PKM2 activity should decrease pyruvate and thus lactate production. However, the discovery of an alternative glycolytic pathway, in which the PEP can be converted into lactate in the absence of PK activity, provides a possible explanation of how lactate can be generated in proliferating cells showing low PKM2 activity. The details of this alternative glycolytic pathway are currently being investigated, yet this exciting finding illustrates that there are still metabolic pathways to be discovered.
Figure 7.
Proliferating cancer cells express PKM2 to regulate glycolysis. PKM2 alternates between a dimer that shows low catalytic activity and a highly active tetramer. Proliferating cells typically have reduced PKM2 activity, in part, because of tyrosine phosphorylation, a modification that inhibits its activity by disrupting tetramer assembly. Acetylation at specific lysine residue and ROS-induced oxidation at a cysteine residue within PKM2 also reduce its activity. When nutrients are not limiting and growth factor–dependent signaling pathways are active, PKM2 is maintained in an inactive state, thus allowing the buildup of glycolytic intermediates that funnel into subsidiary pathways, such as the pentose phosphate pathway (PPP) and serine-dependent one-carbon metabolism pathway, to support cell proliferation. When nutrients become limiting or growth factor signaling diminishes, cells activate PKM2 to generate ATP. (Adapted from Ward and Thompson 2012.)
A salient feature of many tumors is that they reside in a low-oxygen environment (hypoxia) ranging from 0% to 2% O2 because the tumor cell proliferation rate often exceeds the rate of new blood formation (angiogenesis). The adaptation to hypoxia is coordinated by HIF-1 (see Chandel 2020d), which induces metabolic genes, such as those for GLUTs, glycolytic enzymes, and LDHA. HIF-1 also induces pyruvate dehydrogenase kinase-1, a negative regulator of PDH. This limits pyruvate oxidation in the mitochondria and concomitantly with high LDH expression diverts the pyruvate to produce lactate. This pyruvate limitation to mitochondria does not necessarily decrease mitochondrial metabolism. Cancer cells under hypoxia scavenge lipids from the extracellular milieu and, so, do not need to engage in de novo lipid synthesis. Oxygen begins to limit respiration in cells around 0.3% O2. Therefore, hypoxic tumor cells above this threshold are able to conduct fatty acid oxidation to generate ATP and TCA-cycle metabolites. Hypoxic tumor cells also engage in glutamine-dependent reductive carboxylation to generate TCA-cycle metabolites (discussed in the next section). Finally, there are tumors that display constitutive activation of HIF1 and HIF2 under normoxic conditions through a variety of mechanisms, including (1) hyperactivation of mTOR, (2) loss of von Hippel–Lindau protein (pVHL), (3) accumulation of ROS, and (4) accumulation of the TCA-cycle metabolites succinate or fumarate because of cancer-specific mutations in succinate dehydrogenase (SDH) or fumarate hydratase, respectively (discussed in the next section).
The combination of hypoxia, gain of oncogenes, loss of tumor suppressors, and high rate of protein folding in the endoplasmic reticulum results in high levels of ROS production. As noted above, cancer cells increase their antioxidant proteins to maintain redox balance. The major mechanism by which cancer cells increase their antioxidant proteins is through activating the transcription factor nuclear factor erythroid 2-related factor 2 (NRF2). Normally, NRF2 interacts with Kelch-like ECH-associated protein 1 (KEAP1), thus targeting NRF2 for proteasomal degradation. Elevated ROS oxidizes redox-sensitive cysteine residues on KEAP1, resulting in dissociation of KEAP1 from NRF2. Subsequently, NRF2 translocates to the nucleus, heterodimerizes with the small protein MAF, and binds to antioxidant-responsive elements within the regulatory regions of multiple antioxidant genes. Aside from elevated ROS, signaling pathways, such as the ERK1/2 mitogen-activated protein kinase pathway and PI3K, can activate NRF2. Furthermore, certain tumor cells have mutations of KEAP1 that result in constitutive activation of NRF2 and its target antioxidant genes. The loss of NRF2 in cancer cells increases oxidative stress to levels that trigger cell death, resulting in diminished tumorigenesis. This observation has led to the idea that increasing oxidative stress selectively in cancer cells might be a viable therapeutic strategy.
GENETIC ALTERATIONS IN SPECIFIC METABOLIC ENZYMES CAN DRIVE TUMORIGENESIS
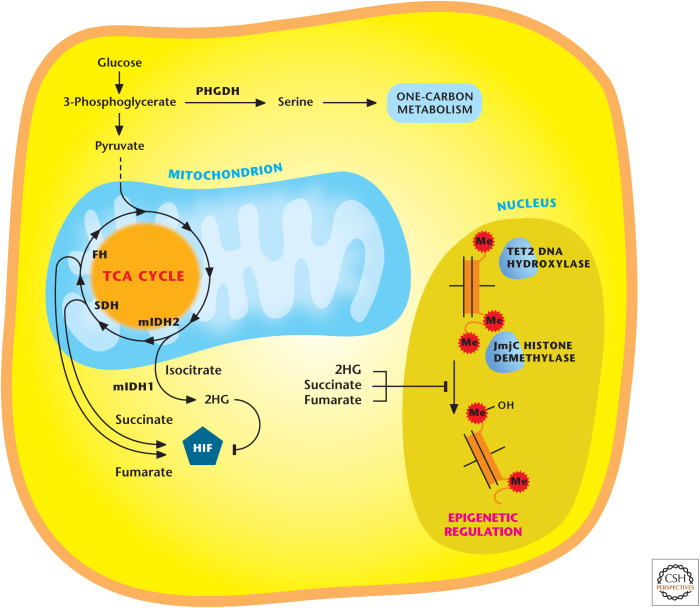
In recent years, it is increasingly appreciated that metabolic enzymes act genetically as tumor suppressors or oncogenes. Initial recognition of genetic alterations in metabolic enzymes driving cancer was the identification of loss-of-function germline heterozygous mutations in SDH and fumarate hydratase (FH) at the turn of this century. Loss of heterozygosity of SDH occurs in certain cases of paraganglioma, pheochromocytoma, and FH in leiomyoma and certain cases of renal cell carcinoma. The loss of FH and SDH prevents the TCA cycle from functioning properly and, thus, the cells rely on glycolysis for ATP generation. These cells are the exception, not the rule, for tumor cells relying exclusively on glycolysis for ATP generation. Although the canonical TCA cycle is not functioning in these cells, SDH- and FH-deficient tumors are able to use glutamine to generate α-ketoglutarate; a reverse TCA-cycle reaction ensues in which α-ketoglutarate is converted by isocitrate dehydrogenase 2 (IDH2) to generate isocitrate and, eventually, citrate. Subsequently, citrate can be exported into the cytosol to generate acetyl-CoA and oxaloacetate for de novo lipid and nucleotide synthesis, respectively. This process is glutamine-dependent reductive carboxylation, in which a carbon molecule from CO2 is used as a substrate (not a product) to generate citrate. Cells showing an electron transport deficiency also show reductive carboxylation. SDH and fumarate hydratase tumors generate high levels of succinate and fumarate, respectively, which can inhibit 2-α-ketoglutarate-dependent dioxygenase enzymes (Fig. 8). These include prolyl hydroxylases (PHDs), TET (ten-eleven translocation) DNA hydroxylases, and Jumonji-domain (JmjC) histone demethylase enzymes. The inhibition of these enzymes increases HIFs, as well as hypermethylation of DNA and histones. SDH and FH tumor cells also produce high levels of ROS that promote activation of HIFs and cell proliferation. Fumarate binds directly to GSH, thus increasing ROS levels. However, the ROS levels are maintained in a range that is compatible with survival and proliferation by fumarate binding to Keap1, the negative regulator of NRF2. This maintains redox balance in FH-deficient cells. FH and SDH tumors show the metabolic plasticity of tumor cells and how metabolites can have functions beyond their canonical roles in intermediary metabolism.
Figure 8.
Alterations in certain metabolic enzymes drive cancer. Mutations in TCA-cycle enzyme succinate dehydrogenase (SDH) and fumarate hydratase (FH) occurs in certain cancers, resulting in accumulation of succinate and fumarate, respectively. Mutations in cytosolic IDH1 or mitochondrial IDH2 occur in certain cancers and cause accumulation of 2-hydroxyglutarate (2HG). Succinate, fumarate, and 2HG inhibit histone demethylases and TET DNA hydoxylases. Succinate and fumarate can activate HIF, whereas R-2HG inhibits HIF. Elevated expression of wild-type phosphoglycerate dehydrogenase (PHGDH) in certain cancers increases serine biosynthesis to fuel one-carbon metabolism necessary for NADPH production and folate intermediates necessary for nucleotide synthesis. (Adapted from Cantor and Sabatini 2012, by permission from the American Association for Cancer Research.)
In recent years, whole-genome sequencing has led to the identification of cytosolic IDH1 and mitochondrial IDH2 mutations in a fraction of acute myeloid leukemias, gliomas, and chondrosarcomas. To date, there have been mutations found in mitochondrial isocitrate dehydrogenase 3 (IDH3) linked to cancer. All three enzymes catalyze the oxidative decarboxylation of isocitrate to produce CO2 and α-ketoglutarate. IDH1 and IDH2 generate NADPH, whereas IDH3 produces NADH, which is used for ATP generation. IDH1 and IDH2 are homodimers and IDH3 is a heterotrimer.
IDH1 and -2 mutations are somatically acquired where one allele remains wild type (WT) and the other allele mutated (MUT) at a single catalytic arginine. The WT/MUT IDH1 or IDH2 dimer allows for normal fast production of α-ketoglutarate and NADPH, therefore not perturbing metabolism of these mutant isocitrate dehydrogenase (IDH) cancer cells. But the WT/MUT dimer, at a slower rate, uses NADPH and converts α-ketoglutarate to the (R)-enantiomer of 2-hydroxyglutarate (R-2HG), eventually allowing R-2HG to accumulate to high levels. R-2HG is barely detectable under normal conditions. R-2HG inhibits α-ketoglutarate dioxygenases, TET2 DNA hydroxylases, and JmjC demethylases, which are central regulators of epigenetics. However, unlike fumarate and succinate, it does not inhibit PHDs, but rather stimulates, resulting in repression of HIF activity. The emerging model is that IDH mutations through R-2HG mediate their tumorigenic effects, in part, through epigenetic dysregulation. There are likely to be other mechanisms beyond epigenetics that fully explain R-2HG-dependent tumorigenesis. Currently, 2HG is being used as a biomarker for disease monitoring, and inhibitors specific to IDH1/2 are beginning to undergo clinical trials. Interestingly, R-2HG production through unknown mechanisms is also observed in certain cases of breast tumors that do not necessarily show IDH mutations, and also in tumor cell lines exposed to hypoxia in vitro.
Aside from mutations in metabolic enzymes, certain cancers show elevated expression of metabolic enzymes. To date, the best examples are the elevated expression of phosphoglycerate dehydrogenase (PHGDH) and glycine decarboxylase (GLDC). PHGDH catalyzes the conversion of 3-phosphoglycerate to 3-phosphohydroxypyruvate in the first step of the serine biosynthesis pathway (Fig. 8). The PHGDH protein is elevated in certain cases of malignant breast cancer and melanomas, resulting in increased flux of glucose carbon through the serine biosynthesis pathway that branches from glycolysis. Serine fuels the one-carbon metabolism necessary for NADPH production (see Chandel 2020c, Fig. 6) and folate intermediates necessary for nucleotide synthesis (see Chandel 2020g, Fig. 4) and methylation reactions (see Chandel 2020h, Fig. 11). Suppression of PHGDH in tumor cells that show high levels of PHGDH results in a decrease in serine synthesis and cell growth. GLDC overexpression was identified as a molecular signature of tumor-initiating cells (TICs) of non–small cell lung cancer (NSCLC), but not bulk NSCLC cells, again highlighting the issue of intratumor metabolic heterogeneity. GLDC is a component of the glycine cleavage system, which catalyzes glycine degradation to produce folate intermediate (see Chandel 2020c, Fig. 6). GLDC suppression diminishes proliferation and tumorigenicity of NSCLC TICs. Enhanced GLDC expression increases in pyrimidine biosynthesis and makes these cells susceptible to low doses of methotrexate, an inhibitor of the folate cycle (see Chandel 2020g, Fig. 11), highlighting how metabolic profiling might dictate therapy.
METABOLISM IS BEING TARGETED FOR CANCER THERAPY
During the past decade, there has been excitement about targeting metabolism as a rational strategy for the treatment of cancer (Box 1). However, it is important to recognize that this approach is not new, and antimetabolite drugs targeting nucleotide synthesis that were developed in the mid-20th century were the first widely successful class of drugs. They include analogs of pyrimidines (e.g., 5-fluorouracil), purines (e.g., azathioprine), and antifolates (methotrexate). Some of these drugs are still used in the treatment of leukemia, lung, breast, and colorectal cancers, and others, like methotrexate and azathioprine, are also used for treatment of inflammatory conditions, such as rheumatoid arthritis. However, these drugs also have adverse effects, primarily because they do not distinguish between highly proliferating normal cells and cancer cells, which require de novo nucleotide synthesis. Thus, it is not surprising that these antimetabolite drugs suppress the immune system and affect tissues that actively turn over.
Current efforts are deciphering metabolic enzymes on which cancer cells display a higher dependency than normal proliferating cells do. This is a daunting task because the metabolism of normal proliferating cells and cancer cells display many similarities in the metabolic and signaling pathways that they use. Unless these new cancer metabolic therapies can distinguish between malignant and nonmalignant cells, then the same types of toxicity that plague conventional antimetabolites could complicate the therapeutic targeting of cancer metabolism. Another consideration is that cancer cells display metabolic plasticity. Cancer cells can develop resistance to inhibition of a particular metabolic pathway through expression of alternate isoforms, up-regulation of alternate pathways, or the use of adjacent cells, such as adipocytes, to provide precursors for the biosynthesis of macromolecules. Finally, the metabolic heterogeneity observed among tumors of the same subtype, or even within a single tumor, can further make it challenging to target specific cancer metabolism.
So, what are possible metabolic enzymes that are good candidates for cancer therapy? The obvious candidate is targeting mutant IDH1 or IDH2 enzymes in tumors showing IDH1 or IDH2 mutations, respectively. Currently, there are drugs that can distinguish between mutant IDH1 and IDH2 versus their WT counterparts. However, these are the exception, rather than the rule, because very few tumors display gain-of-function mutations in metabolic enzymes. Current research efforts are designed to find metabolic enzymes that are overexpressed in certain cancer cells compared with normal cells. Much effort has been devoted to targeting glucose metabolism. One example is the overexpression of hexokinase (HK) II in many tumors. HKs catalyze the first step of glycolysis and, hence, are a potentially attractive target. There are four mammalian HKs (HKI–IV). HKI is the ubiquitously expressed isoform, whereas HKII is expressed in insulin-sensitive tissues, such as muscle and adipose. Preclinical studies show that HKII inhibition could be an effective cancer therapy. Likewise, targeting enzymes overexpressed in the glutaminolysis pathway are appealing for cancer therapy. Preclinical studies show that targeting glutaminase, the first step in glutaminolysis, could be effective against certain cancers. It is likely that targeting both glucose and glutamine metabolism would be effective compared with targeting either pathway because of metabolic plasticity. For example, overexpressing PC, thus allowing glucose-derived pyruvate to feed the TCA cycle by generating oxaloacetate and acetyl-CoA, could compensate for glutaminolysis inhibition. Glycolysis inhibition could be compensated by glutaminolysis generation of TCA-cycle metabolites that serve as precursors for gluconeogenesis. Importantly, it remains to be determined whether preventing glucose and/or glutamine metabolism is effective therapy for certain cancers without incurring toxicity similar to the classical antimetabolites targeting nucleotides synthesis.
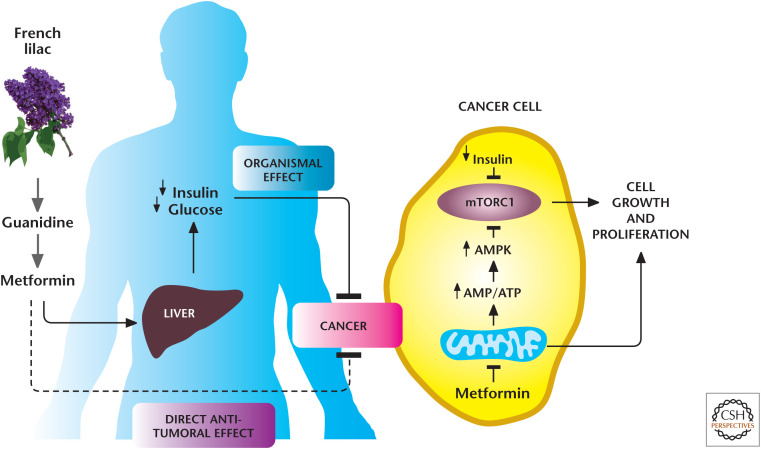
Box 1, Figure 1.
Metformin reduces tumorigenesis through multiple mechanisms. The biguanide metformin, modeled after guanidine derivatives, was first isolated from the French lilac Galega officinalis. Currently, metformin is the most commonly used drug worldwide to treat patients with type 2 diabetes mellitus. Metformin suppresses liver gluconeogenesis, thereby reducing glucose release from the liver. Recently, metformin has been repurposed as an anticancer agent. There are two not mutually exclusive mechanisms by which metformin reduces tumor growth: (1) at the organismal level, in which it reduces the levels of circulating insulin, a known mitogen for cancer cells, and (2) in a cell-autonomous manner, by targeting mitochondrial electron transport at complex I. (Adapted from Birsoy et al. 2012, by permission from Macmillan Publishers Ltd.)
The inhibition of glucose or glutamine metabolism in certain cancer cells significantly decreases NADPH and GSH levels, both decreasing antioxidant capacity, resulting in dramatic increases in ROS levels to induce cell death. Cancer cells generate increased ROS as by-products of their increased metabolism. ROS have a well-defined role in promoting and maintaining tumorigenicity. Yet, most clinical trials have failed to show beneficial effects of administering antioxidants in a variety of cancer types; in certain trials, antioxidants have been shown to promote cancer. This effect might be caused by the fact that many therapeutic antioxidants are not effective in targeting the low levels of mitochondrial ROS generated proximally to signaling pathways, which are required for tumorigenesis.
More recent studies have focused on disabling antioxidants selectively in cancer cells, thus, raising their ROS levels to thresholds that induce death. As mentioned earlier, cancer cells overexpress an array of antioxidant proteins, in part, through the activation of NRF2 to maintain ROS levels that allow protumorigenic signaling pathways to be activated without inducing cell death. In fact, studies have shown that disabling antioxidant mechanisms triggers ROS-mediated cell death in a variety of cancer cell types. This reliance on antioxidants may represent the cancer cell's “Achilles heel,” as nontransformed cells produce less ROS and, therefore, are less dependent on their detoxification. It is important to note that loss of NRF2 diminishes multiple antioxidant defense systems and, therefore, makes multiple types of ROS increase at a threshold that invokes damage to cancer cells. However, loss of a specific antioxidant defense system might result in elevation in ROS levels to levels below the threshold that causes damage. In this scenario, the elevated ROS levels hyperactivate signaling pathways to promote tumorigenesis, as observed during the loss of peroxiredoxin I, which increases tumorigenesis. Nevertheless, diminishing antioxidant capacity in cancer cells is likely to synergize with traditional chemotherapeutic agents, also known to increase ROS levels. It is perplexing that many people with cancer continue to take large concentrations of antioxidants in conjunction with chemotherapy, thus negating the potential benefits of their chemotherapy.
BOX 1.
METFORMIN: AN ANTIDIABETIC DRUG REPURPOSED AS AN ANTICANCER AGENT
One agent that, recently, has been the focus of many cancer metabolism therapeutic studies is the repurposing of the antidiabetic drug metformin as an anticancer agent. Metformin is widely used to treat patients with type 2 diabetes mellitus. Metformin suppresses liver gluconeogenesis, thereby reducing glucose release from the liver. In several recent retrospective studies, investigators have observed an association between metformin use and diminished tumor progression in patients suffering from different types of cancers (Box 1, Fig. 1). These data have prompted more than 100 ongoing prospective clinical trials to determine the efficacy of metformin as an anticancer agent. However, the underlying mechanism by which metformin diminishes tumor growth are just beginning to be unraveled. The two not mutually exclusive mechanisms by which metformin reduces tumor growth are (1) at the organismal level, in which it reduces the levels of circulating insulin, a known mitogen for cancer cells, and (2) in a cell-autonomous manner by targeting mitochondrial electron transport at complex I. The organismal mechanism is based on the observation that some cancer cells express insulin receptors, which are potent stimulators of PI3K pathways. Thus, metformin's inhibitory effect on hepatic gluconeogenesis to reduce circulating insulin levels would decrease tumor growth by diminishing insulin receptor activation of the PI3K pathway. The cell-autonomous mechanism is dependent on whether cancer cells express organic cation transporters (OCTs) to promote metformin into cells, resulting in complex I inhibition. Metformin has a safe toxicity ofile in normal tissues because it accumulates only in a few normal tissues that express OCT transporters, such as liver. In contrast, traditional complex I inhibitors, such as rotenone, readily accumulate in any normal or cancer cell and, consequently, are highly toxic. Metformin inhibition of mitochondrial complex I within cancer cells is likely to diminish tumor growth through multiple mechanisms, including preventing mitochondrial ROS generation required for mitogenic signaling, increasing AMP levels to activate the catabolic kinase AMPK, and inducing cell death when tumor cells become limiting for glucose and cannot generate ATP through glycolysis. Thus, the combination therapy of metformin with clinically used PI3K inhibitors that reduce glucose uptake and glycolysis is likely to be more efficacious than metformin alone. Cancer cells have a wide range in expression of OCTs and insulin receptors. The ongoing clinical trials using metformin as an anticancer agent should assess the expression levels of OCTs and insulin receptors in the tumors to identify those likely to be susceptible to metformin, which are those with the highest expression.
In conclusion, metabolism has regained its importance in cancer biology after being ignored for decades. The observations that signaling pathways, oncogenes, and tumor suppressors regulate metabolic enzymes has reenergized cancer metabolism. A pleasant consequence of reemergence of cancer metabolism is that it has emphasized the importance of metabolism in other fields, including inflammation, stem cells, and cell biology. The recent advances in metabolomics (see the Appendix) have revealed new metabolic pathways and allowed a more comprehensive assessment of tumor metabolism in patients. Furthermore, the discovery of certain mutations in metabolic enzymes linked to cancer has bolstered the idea that changes in metabolism are not simply a consequence of proliferating cells, but that they play a causal role in tumorigenesis. The current excitement surrounding cancer metabolism research is that the metabolic enzymes critical for cancer cell proliferation and survival are potential targets for cancer therapy. A big challenge, going forward, will be to decipher which metabolic enzymes necessary for tumorigenesis have a favorable therapeutic index.
Footnotes
From the recent volume Navigating Metabolism by Navdeep S. Chandel
Additional Perspectives on Metabolism available at www.cshperspectives.org
Additional Reading
*Reference is also in this collection.
- Birsoy K, Sabatini DM, Possemato R. 2012. Untuning the tumor metabolic machine: targeting cancer metabolism: a bedside lesson. Nat Med 18: 1022–1023. 10.1038/nm.2870 [DOI] [PubMed] [Google Scholar]
- Cantor JR, Sabatini DM. 2012. Cancer cell metabolism: one hallmark, many faces. Cancer Discov 2: 881–898. 10.1158/2159-8290.CD-12-0345 [DOI] [PMC free article] [PubMed] [Google Scholar]
- *.Chandel NS. 2020a. Glycolysis. Cold Spring Harb Perspect Biol 10.1101/cshperspect.a040535 [DOI] [PMC free article] [PubMed] [Google Scholar]
- *.Chandel NS. 2020b. Mitochondria. Cold Spring Harb Perspect Biol 10.1101/cshperspect.a040543 [DOI] [PMC free article] [PubMed] [Google Scholar]
- *.Chandel NS. 2020c. NADPH—the forgotten reducing equivalent. Cold Spring Harb Perspect Biol 10.1101/cshperspect.a040550 [DOI] [PMC free article] [PubMed] [Google Scholar]
- *.Chandel NS. 2020d. Signaling and metabolism. Cold Spring Harb Perspect Biol 10.1101/cshperspect.a040600 [DOI] [PMC free article] [PubMed] [Google Scholar]
- *.Chandel NS. 2020e. Carbohydrate metabolism. Cold Spring Harb Perspect Biol 10.1101/cshperspect.a040568 [DOI] [PMC free article] [PubMed] [Google Scholar]
- *.Chandel NS. 2020f. Lipid metabolism. Cold Spring Harb Perspect Biol 10.1101/cshperspect.a040576 [DOI] [PMC free article] [PubMed] [Google Scholar]
- *.Chandel NS. 2020g. Nucleotide metabolism. Cold Spring Harb Perspect Biol 10.1101/cshperspect.a040592 [DOI] [PMC free article] [PubMed] [Google Scholar]
- *.Chandel NS. 2020h. Amino acid metabolism. Cold Spring Harb Perspect Biol 10.1101/cshperspect.a040584 [DOI] [PMC free article] [PubMed] [Google Scholar]
- Chandel NS, Tuveson DA. 2014. The promise and perils of antioxidants for cancer patients. N Engl J Med 371: 177–178. 10.1056/NEJMcibr1405701 [DOI] [PubMed] [Google Scholar]
- Dang CV. 2012. Links between metabolism and cancer. Genes Dev 26: 877–890. 10.1101/gad.189365.112 [DOI] [PMC free article] [PubMed] [Google Scholar]
- DeBerardinis RJ, Thompson CB. 2012. Cellular metabolism and disease: what do metabolic outliers teach us? Cell 148: 1132–1144. 10.1016/j.cell.2012.02.032 [DOI] [PMC free article] [PubMed] [Google Scholar]
- Deberardinis RJ, Sayed N, Ditsworth D, Thompson CB. 2008. Brick by brick: metabolism and tumor cell growth. Curr Opin Genet Dev 18: 54–61. 10.1016/j.gde.2008.02.003 [DOI] [PMC free article] [PubMed] [Google Scholar]
- Fan J, Kamphorst JJ, Mathew R, Chung MK, White E, Shlomi T, Rabinowitz JD. 2013. Glutamine-driven oxidative phosphorylation is a major ATP source in transformed mammalian cells in both normoxia and hypoxia. Mol Syst Biol 9: 712. 10.1038/msb.2013.65 [DOI] [PMC free article] [PubMed] [Google Scholar]
- Gorrini C, Harris IS, Mak TW. 2013. Modulation of oxidative stress as an anticancer strategy. Nat Rev Drug Discov 12: 931–947. 10.1038/nrd4002 [DOI] [PubMed] [Google Scholar]
- Hardie DG, Alessi DR. 2013. LKB1 and AMPK and the cancer–metabolism link—ten years after. BMC Biol 11: 36. 10.1186/1741-7007-11-36 [DOI] [PMC free article] [PubMed] [Google Scholar]
- Israelsen WJ, Dayton TL, Davidson SM, Fiske BP, Hosios AM, Bellinger G, Li J, Yu Y, Sasaki M, Horner JW, et al. 2013. PKM2 isoform–specific deletion reveals a differential requirement for pyruvate kinase in tumor cells. Cell 155: 397–409. 10.1016/j.cell.2013.09.025 [DOI] [PMC free article] [PubMed] [Google Scholar]
- Keith B, Johnson RS, Simon MC. 2011. HIF1α and HIF2α: sibling rivalry in hypoxic tumour growth and progression. Nat Rev Cancer 12: 9–22. 10.1038/nrc3183 [DOI] [PMC free article] [PubMed] [Google Scholar]
- Klempner SJ, Myers AP, Cantley LC. 2013. What a tangled web we weave: emerging resistance mechanisms to inhibition of the phosphoinositide 3-kinase pathway. Cancer Discov 3: 1345–1354. 10.1158/2159-8290.CD-13-0063 [DOI] [PMC free article] [PubMed] [Google Scholar]
- Losman JA, Kaelin WG Jr.2013. What a difference a hydroxyl makes: mutant IDH, (R)-2-hydroxyglutarate, and cancer. Genes Dev 27: 836–852. 10.1101/gad.217406.113 [DOI] [PMC free article] [PubMed] [Google Scholar]
- McCracken AN, Edinger AL. 2013. Nutrient transporters: the Achilles' heel of anabolism. Trends Endocrinol Metab 24: 200–208. 10.1016/j.tem.2013.01.002 [DOI] [PMC free article] [PubMed] [Google Scholar]
- Patra KC, Wang Q, Bhaskar PT, Miller L, Wang Z, Wheaton W, Chandel N, Laakso M, Muller WJ, Allen EL, et al. 2013. Hexokinase 2 is required for tumor initiation and maintenance and its systemic deletion is therapeutic in mouse models of cancer. Cancer Cell 24: 213–228. 10.1016/j.ccr.2013.06.014 [DOI] [PMC free article] [PubMed] [Google Scholar]
- Pearce EL, Pearce EJ. 2013. Metabolic pathways in immune cell activation and quiescence. Immunity 38: 633–643. 10.1016/j.immuni.2013.04.005 [DOI] [PMC free article] [PubMed] [Google Scholar]
- Pollak M. 2013. Potential applications for biguanides in oncology. J Clin Invest 123: 3693–3700. [DOI] [PMC free article] [PubMed] [Google Scholar]
- Vander Heiden M. 2011. Targeting cancer metabolism: a therapeutic window opens. Nat Rev Drug Discovery 10: 671–684. 10.1038/nrd3504 [DOI] [PubMed] [Google Scholar]
- Ward PS, Thompson CB. 2012. Metabolic reprogramming: a cancer hallmark even Warburg did not anticipate. Cancer Cell 21: 297–308. 10.1016/j.ccr.2012.02.014 [DOI] [PMC free article] [PubMed] [Google Scholar]
- Yang M, Soga T, Pollard PJ. 2013. Oncometabolites: linking altered metabolism with cancer. J Clin Invest 123: 3652–3658. 10.1172/JCI67228 [DOI] [PMC free article] [PubMed] [Google Scholar]


