

Abstract
Differential diagnosis of wide QRS tachycardia (WQRST) on the electrocardiogram remains a challenging exercise. Correct diagnosis is important for prescribing appropriate therapy and determining prognosis. Differential diagnosis of wide QRS tachycardia revolves around differentiation between supraventricular tachycardia with aberrant conduction and ventricular tachycardia. Observations such as clinical history, findings of physical examination during tachycardia, AV dissociation, QRS morphology in lead V1 and lead V6, precordial concordance, RS complexes in precordial leads, contralateral bundle branch block during wide QRS tachycardia, R wave morphologies in lead aVR, and ventricular initial/terminal velocity of conduction ratio can help arrive at the correct diagnosis with reasonable accuracy. The observations described here can help arrive at the correct diagnosis of WQRST with both reasonable accuracy and confidence.
Keywords: aberrant conduction, supraventricular tachycardia, ventricular tachycardia, WPW syndrome
The diagnosis of wide QRS tachycardia can be challenging, but is essential for appropriate therapy. The differentiation is often between supraventricular tachycardia with aberrant conduction and ventricular tachycardia. A review of historical, clinical, electrocardiographic information during wide QRS tachycardia while keeping in mind the pitfalls and exceptions, may help arrive at the correct diagnosis with reasonable accuracy and confidence

1. INTRODUCTION
In 1960 Pick and Langendorf published, “Differentiation of supraventricular and ventricular tachycardia.1” Sixty years later, differential diagnosis of wide QRS tachycardia (WQRST) on the electrocardiogram remains a challenging exercise. Correct diagnosis is important for prescribing appropriate therapy and determining prognosis. For example, supraventricular tachycardia (SVT) with aberrant conduction is likely to respond to atrioventricular (AV) nodal blocking agents such as verapamil whereas such therapies may be counterproductive if administered to patients with ventricular tachycardia (VT).2 The aim of this review is to provide the relevant pathophysiologic explanation for the clinical and electrocardiographic observations used in the differential diagnosis of WQRST.
2. METHODS
Data for this review were identified by searches of MEDLINE, PubMed, and references from relevant articles using the search term “Differential diagnosis of wide QRS complex tachycardia.”
Only articles published in English between 1940 and 2021 were included.
3. REVIEW AND ANALYSIS
Electrical impulses that arise above or within the AV node are labeled supraventricular. As the impulse travels at a speed of three meters per second through the AV node and simultaneously down the bundle branches and His‐Purkinje system, it typically produces a narrow QRS complex of 80 mseconds duration. WQRST is characterized by the QRS duration of more than 120 milliseconds at a heart rate of >100 bpm.
4. ABERRANT CONDUCTION
A block or delay in conduction of supraventricular impulse in any of the bundle branches or His Purkinje system will prolong QRS duration and alter the morphology of the QRS complex resulting in aberrant conduction. It produces distinctive changes in lead V1 on the electrocardiogram: These electrocardiographic alterations may appear similar irrespective of the cause of slow conduction which may be functional (transient) or structural (permanent) due to scar.3 The speed of conduction will also be slower if the impulse originates in or traverses the myocardium to reach the His‐Purkinje system and will therefore produce a wide QRS complex. A VT originating in the left ventricle will produce RBBB morphology and a VT originating in the right ventricle will correspondingly produce LBBB morphology but under these circumstances, the QRS morphology in V1 may not resemble that of classic right or left bundle branch block.
The refractory periods of the right and left bundle are different. The longer refractory period of the right bundle branch predisposes it to conduction slowing or failure, particularly with sudden acceleration of the heart rate as seen in atrial fibrillation. As a result aberrant conduction, a transient functional block, more often exhibits RBBB morphology in lead V1.4
Heart rate exerts an “accordion” effect on the refractory period: as the heart rate slows, the refractory period of the conduction system lengthens and as heart rate speeds up, the refractory period shortens. Therefore the cycle length of the preceding R‐R interval determines the refractory period of the following beat. However, following a sudden acceleration in rate, the first few beats may still be attuned to a longer refractory period and conduction may partially or completely fail as evidenced by a wider QRS complex due to bundle branch block. Therefore a long cycle length (R‐R interval) followed by a shortened cycle length, as commonly seen in atrial fibrillation or premature atrial beats, may produce wide QRS complexes and this may continue for the next several beats until the refractory period shortens or the heart rate decreases. There are three types of aberrant conduction.
4.1. Ashman's Phenomenon
Ashman's phenomenon refers to aberrant conduction due to critical pre‐maturity; identical combinations of long and short cycle lengths may manifest as aberrant conduction (Figure 1A). A long R‐R interval is followed by a short R‐R interval that ends with a wide QRS complex often with RBBB morphology.5, 6 On termination of the wide complex rhythm there is no compensatory pause.
FIGURE 1.

(1) Ashman's phenomenon. The rhythm is atrial fibrillation. A long cycle (560 ms) followed by a short cycle (320 m) results in right bundle branch morphology aberrancy that last for 3 beats. (B) Acceleration‐dependent aberrancy. As the heart rate increases from 82 beats per minute to 88 bpm the QRS duration increases from 80 msec. to 160 ms Rhythm remains sinus. (C) Deceleration‐dependent aberrancy. As the heart rate decreases from 92 beats per minutes to 50 bpm as a result of 2:1 AV block, QRS duration increases from 80 to 120 ms
4.2. Acceleration and deceleration dependent aberrancy
Acceleration‐dependent aberrancy occurs when the heart rate exceeds the capacity of a diseased conduction system. Increased frequency of impulse transmission results in slowed conduction and widening of the QRS complex; LBBB morphology is more common. It is not dependent on the duration of the preceding cycle length (Figure 1B) often seen in patients with underlying heart disease.
Deceleration‐dependent aberrancy is observed as the heart rate slows down, therefore longer cycle lengths are associated with aberrant QRS complexes generally exhibiting LBBB morphology. It should be present in at least two sequential QRS complexes (Figure 1C) and should not be the result of ventricular escape rhythm. Conduction must be from the atrium to the ventricle through the AV node and not through the accessory pathway. It is believed to be due to the slowing of the conduction during phase 4 of the action potential (phase 4 aberrancy).
5. CAUSES OF WIDE QRS TACHYCARDIA (WQRST)
Causes of WQRST include: (1). Supraventricular tachycardia (SVT) with functional or persistent bundle branch block, (2) Ventricular tachycardia (VT), (3) SVT with preexcitation, or (4) Ventricular paced rhythm.7
6. DIFFERENTIAL DIAGNOSIS OF WIDE QRS TACHYCARDIA
Patient's medical history, physical examination during the arrhythmia, a baseline 12 lead electrocardiogram, and an electrocardiogram recorded during the wide complex tachycardia, are essential for establishing a correct diagnosis.
6.1. Clinical history
History of prior myocardial infarction (MI) and the onset of WQRST after the diagnosis of myocardial infarction, would suggest a diagnosis of ventricular tachycardia (sensitivity 97% specificity 100%, PPV 98%).8 History of congestive heart failure (CHF), angina pectoris also carry a high positive predictive value for VT.9
6.2. Physical examination
Heart rate and hemodynamics such as blood pressure ares not helpful in determining the mechanism of tachycardia. A normal blood pressure is not incompatible with the diagnosis of VT and a patient with SVT with aberrancy may present with hypotension.10 Presence of canon A waves during WQRST suggests the presence of AV dissociation.11 During AV dissociation atrial systole may occur while the tricuspid valve is closed producing a prominent “a” waves (canon A waves) in jugular venous pulse.12
The varying intensity of the first heart sound (S1) suggests the presence of AV dissociation. The position of the AV valve leaflets at the onset of systole and the PR interval determines the intensity of the first heart sound. During VT, because of AV dissociation, there is no constant relation between atrial systole (P waves) and ventricular systole (QRS complex). In the absence of an appropriate PR interval, the first heart sound appears softer than normal and muffled. But during capture beats, because of appropriate timing of atrial and ventricular systole, the first heart sound may be normal or louder. During AV dissociation the P to QRS intervals vary and the intensity of the first heart sound, therefore, varies as well.13
6.2.1. Carotid sinus massage, Valsalva maneuver
By increasing vagal tone, these maneuvers may result in transient AV block thus terminating SVT, but may have no effect on VT.
Adenosine is likely to terminate SVT by interrupting AV nodal conduction. In the presence of atrial tachycardia or atrial flutter with 1:1 AV conduction and aberrant ventricular conduction, adenosine may slow the ventricular rate and reveal atrial P waves or flutter waves long enough to establish a diagnosis. Usually, adenosine has no effect on VT.14
7. ELECTROCARDIOGRAPHIC FEATURES
A QRS duration greater than 140 mseconds favors a diagnosis of VT.15 Right superior (“northwest”) axis is suggestive of VT. Northwest axis results when ventricular impulses originate in the inferior wall or the apical segment of the ventricle. A change in the frontal plane axis of more than 40 degrees when compared to the QRS axis during sinus rhythm is often observed during VT. However, if the QRS axis and morphology during WQRST are identical to that recorded during sinus rhythm, a diagnosis of VT is unlikely (Figure 2).16 Presence of electrical alternans does not help in differentiating SVT with aberrant conduction from ventricular tachycardia.17
FIGURE 2.
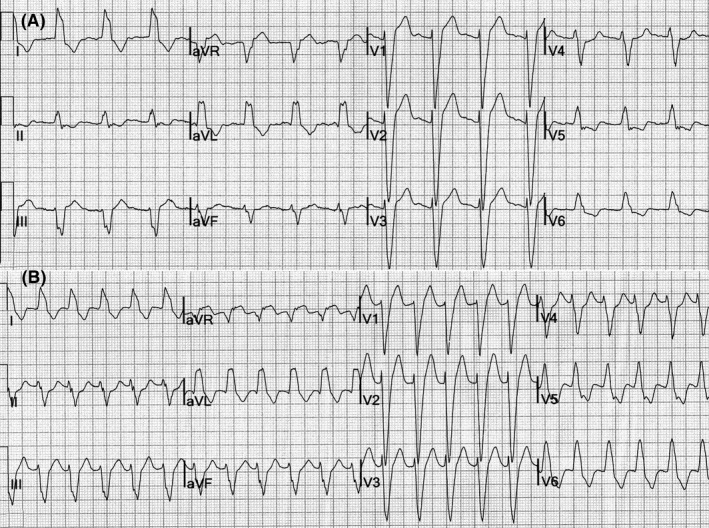
(A) Sinus rhythm, left bundle branch block. (B) SVT. The QRS morphology and frontal plane axis are identical to that in sinus rhythm
7.1. AV dissociation
In the absence of retrograde conduction of ventricular impulses to the atria, atrial and ventricular electrical activity is dissociated during VT; there are more QRS complexes than P waves. The presence of AV dissociation strongly favors a diagnosis of VT (Figure 3).18 The sensitivity of AV dissociation tends to be high (100%) while the specificity is low (20%–50%).19 It may be difficult to identify P waves in the midst of wide QRS complexes especially when the rate of WQRST is high. Although the presence of AV dissociation is highly suggestive of VT, its absence does not exclude VT.20 A single dissociated P wave at the onset of WQRST could be a reflection of AV dissociation and thus suggestive of VT.21
FIGURE 3.

12 lead electrocardiogram of VT showing AV dissociation. The P waves are marked by black dots that march through the QRS complexes. The RR interval from the VT beat to the fusion beat (F) is the same as the R‐R interval of the adjacent VT beats. Capture beats (C) are narrow and occur early. Preserved Q waves during the ventricular tachycardia. Deep and wide Q waves are seen in V1 and V2 suggestive of old anterior wall myocardial infarction. There is dominant R in aVR and northwest (right superior quadrant) axis
Fusion beats result from simultaneous ventricular depolarization by a supraventricular impulse, usually a sinus, as well as a VT beat. A QRS complex produced by fusion is neither identical to a QRS complex due to VT nor to a QRS complex produced by a sinus impulse alone but appears to be a hybrid between the two forms. The R‐R interval between the preceding VT complex and the QRS complex of the fusion beat is often the same as the R‐R interval of the VT. The presence of fusion beats is highly suggestive of VT (Figure 3).
Fusion beats should be differentiated from progressive aberrancy that may be observed at the onset of wide complex SVT and may be mistaken for fusion beats. Greenstein, et al, noted that the PR interval preceding a QRS complex that exhibits an intermediate degree of aberrancy is longer than the PR interval of a sinus beat, while the PR interval preceding a QRS complex that results from fusion is shorter than PR intervals of sinus beats.22
Capture beat occurs when a sinus impulse conducts through the AV node and depolarizes the ventricle producing a narrower QRS complex between wide VT complexes. As a result, the R‐R interval between the preceding VT beat and the QRS of the capture beat tends to be shorter than the R‐R intervals of the VT (Figure 3). The QRS complex of capture beats may appear similar to the QRS complexes observed during sinus rhythm; capture beats are a hallmark of VT and frequent sinus capture may render an otherwise regular VT irregular.23
7.2. QRS morphology
WQRST due to VT is far more common in older patients (>35 years of age). Griffith, et al, proposed a simple approach: if a firm diagnosis of SVT with aberrancy cannot be established on the basis of QRS morphology in leads V1 and V6 in this age group then the rhythm should be considered VT by default.24
7.2.1. Right bundle‐branch block morphology
A positive triphasic QRS complex in lead V1 (Figure 4A), particularly if normal axis is present, is likely to represent SVT with aberrant conduction. In one study, 57 of the 69 ECG tracings with confirmed SVT with aberrancy exhibited a triphasic QRS complex in lead V1 whereas only 6 out of 65 ECG tracings of VT had a triphasic QRS complex.25
FIGURE 4.

(A) SVT with right bundle branch block morphology: Triphasic QRS complexes are noted in V1 and V2. In V6 the R/S ratio is >1 (R wave amplitude is 1.1 mV and S wave amplitude is 0.8 mV). (B) VT with right bundle branch block morphology. The R wave in V1 is monophasic and the R/S ratio in V6 is <1
An R/S ratio >1 in lead V6 suggests a diagnosis of SVT with aberrant conduction.26 Monophasic QRS complexes in V1 and an R/S ratio <1 in V6 suggests a diagnosis of VT.27(Figure 4B).
7.2.2. Left bundle branch block morphology
The QRS complexes in lead V1 are negative in LBBB morphology. In SVT with LBBB morphology due to aberrant conduction, the QRS complex in lead V1 exhibits a narrow (<30 msec) initial R wave and a sharp, smooth descent (Figure 5A).28 Notching in the downslope of the S wave in lead V1 and/or V2 and an interval from the onset of the QRS complex to the nadir of the S wave >60 mseconds suggests a diagnosis of VT (Figure 5B), an observation initially made by Josephson, et al29, 30 These findings are more likely to be observed in patients with previous anterior wall infarction.
FIGURE 5.

(A) SVT with left bundle branch block morphology: There is a narrow sharp R wave in lead V1 and V2. In V6 the R/S ratio is >1 and there is no qR pattern. (B) VT with left bundle branch block morphology: note a notch in the descending limb of the QRS in V1 (black arrowhead). There is an RS pattern in lead V2 (black line). The duration from the onset of the QRS complex to the end of the S wave is 130 ms, suggestive of VT (Brugada criteria)
WQRST with LBBB morphology that exhibits a qR or R/S ratio <1 in lead V6 or right axis deviation suggests a diagnosis of VT.31 If the WQRST does not conform to any pattern of bundle branch block, it is likely due to VT. If the R wave in lead V1 is wider (>30 mseconds) during tachycardia than during sinus rhythm, the diagnosis is likely to be VT (Figure 6), a pattern more commonly observed in patients with old inferior wall infarction. WQRST in which a predominantly negative QRS complex in lead V1 crosses the baseline several times, resulting in a W pattern, is likely to be VT.
FIGURE 6.

The R wave in V1 during sinus rhythm is small and narrow. During VT, the R wave amplitude and duration has increased (>40 ms)
7.3. Precordial concordance
The presence of predominately positive QRS complexes across leads V1 through V6 is positive concordance (Figure 7A) and the presence of negative QRS complexes across the precordial leads is negative concordance (Figure 7B). During concordance, there is no R/S transition. Precordial concordance during WQRST suggests a diagnosis of VT (PPV 90%–100%, sensitivity 88%).32 Although precordial concordance is highly suggestive of VT, its absence does not exclude the diagnosis; less than 20% of WQRST due to VT exhibit concordance.
FIGURE 7.

(A) Positive concordance. All the QRS complexes from V1 to V6 have positive polarity. (B) Negative concordance. All the QRS complexes from V1 to V6 have negative polarity
Positive precordial concordance may also be observed during WQRST due to ventricular preexcitation in patients with Wolff–Parkinson–White syndrome.
7.4. Q waves during WQRST
Q waves suggestive of previous myocardial infarction noted on the patient's baseline ECG that are also present during WQRST favor a diagnosis of VT. Pathologic Q waves, the result of myocardial scar tissue, can result from infarction, sarcoidosis, or Chagas disease; scar tissue facilitates the occurrence of reentrant VT.
7.5. Width of the QRS complex compared
A diagnosis of VT is suggested if the width of QRS complexes recorded during WQRST is narrower than the QRS complex recorded while the patient is in sinus rhythm.33 On the other hand, in the case of WQRST due to SVT the width of the QRS is expected to be the same as during sinus rhythm or wider due to slowing of conduction.34, 35
7.6. Contralateral bundle branch block
If a persistent bundle branch block is present on a baseline ECG, contralateral bundle branch block during a WQRST would suggest a diagnosis of VT.32 For example, if sinus rhythm baseline EKG shows persistent left bundle branch block and during wide complex tachycardia, the QRS morphology suggests right bundle branch block this could only occur during VT (Figure 8). Supraventricular tachycardia with RBBB morphology aberrancy, in this scenario where there is a pre‐existing left bundle branch block during sinus rhythm, physiologically and logically would not be able to sustain AV nodal conduction of supraventricular beats.
FIGURE 8.

Left panel shows sinus rhythm with left bundle branch block. The same patient developed WQRST with the right bundle branch block pattern due to VT
7.7. R wave morphologies in lead aVR
A dominant R wave in lead aVR during WQRST suggests a diagnosis of VT (Figure 3). This likely to be seen in VT that originates in the apex or lower third of the ventricular septum, but only moderate sensitivity and specificity have been reported for this finding as a marker for VT. A qR pattern in aVR with a Q wave >40 mseconds or a negative QRS complex with a notch in the downslope of the initial component also suggests a diagnosis of VT.36
Dominant R‐wave in aVR during sinus rhythm can be seen in patients with left posterior fascicular block, right ventricular hypertrophy, and prior inferior wall infarction.
7.8. Ventricular initial/terminal velocity of conduction
The speed of conduction is faster when an electrical impulse travels through the His‐Purkinje system and slower if it travels through myocardium or scar tissue. If an impulse is traveling through the AV node and His‐Purkinje system, as in the case of SVT, conduction velocity will be rapid and the initial component of the QRS complex will exhibit a sharp inscription. When the impulse exits the conduction system and enters the myocardium, the speed of conduction slows, resulting in slurring of the terminal portion of the QRS complex. Conversely, an impulse that arises from the myocardium or scar tissue, as in VT, will exhibit a slurred initial component as it negotiates its way through the tissue but will achieve faster terminal conduction velocity as it enters the His‐Purkinje system. The ventricular initial and terminal conduction velocity ratio (Vi/Vt) is the vertical excursion (in mV) recorded during the initial (Vi) and terminal (Vt) 40 mseconds of the QRS complex. A Vi/Vt >1, is suggestive of SVT. A Vi/Vt </=1 is suggestive of VT19 (Figure 9).
FIGURE 9.

Initial and terminal velocity of conduction. Vi (Velocity in mV in initial 40 ms), Vt (Velocity in mV in terminal 40 ms) ratio of <1 suggests a diagnosis of VT
7.9. Change from wide‐complex to narrow complex tachycardia
A change in QRS morphology from wide to narrow QRS complexes favors a diagnosis of SVT with aberrant conduction.34
The clinical and electrocardiographic observations are summarized in Table S1.
8. ALGORITHMS/CRITERIA
In the past 40 years, several algorithms that approach the differential diagnosis of WQRST in a stepwise fashion have been proposed.39 Algorithms have used the observations described above in various combinations, focusing on a stepwise analysis of the electrocardiogram. However, if the first step of an algorithm indicates a diagnosis of VT, the observer may not search for other evidence. It is therefore essential that a 12 lead ECG of a WQRST be meticulously analyzed for all the above‐described observations, both increasing the confidence in the diagnosis and the interpretive skill of the clinician.
Algorithms do not include the important findings of the history or physical examination. In an attempt to simplify the approach, some algorithms exclude some important observations.
8.1. Wellens criteria
AV dissociation, QRS width >140 mseconds, and left axis deviation to favor a diagnosis of VT. In addition, using the morphologic appearance of QRS complexes in lead V1 and V6 first described by Marriott and Sandler in 1968, Wellens et al, proposed morphologic appearance of QRS complexes in leads V1 and V6 that could help differentiate SVT with aberrant conduction from VT.15
8.2. Griffith criteria
On the basis of multivariate analysis, Griffith et al, suggested a history of myocardial infarction, QRS morphology in leads aVF and V1, and frontal plane axis >40° when compared with the baseline ECG favored a diagnosis of VT.40 If none of these parameters were met, a diagnosis of SVT was established. They added that AV dissociation and the presence of PVC’s during sinus rhythm that exhibit morphology similar to that observed during WQRST increased the probability of a diagnosis of VT.
8.3. Brugada algorithm
Brugada and colleagues proposed that the presence of an RS complex in any precordial lead during WQRST in which the interval from the onset of the QRS complex to the nadir of the S wave is >100 mseconds, the presence of AV dissociation and QRS morphology in leads V1 and V6 are highly suggestive of VT (sensitivity of 99% and specificity of 96.5%)25 (Flow chart S1). Other studies were not able to substantiate high levels of sensitivity or specificity using this algorithm.19
8.4. Vereckei algorithm
Vereckei and colleagues proposed an algorithm that incorporates AV dissociation, the presence of an initial R wave in lead aVR, assessment of the morphology of wide QRS complex for bundle branch or fascicular block, and the estimation of the initial and terminal ventricular activation velocity ratio which, if <1, suggests a diagnosis of VT.
An updated Vereckei algorithm added three observations pertaining to the QRS morphology of lead aVR: 1. an initial R wave in aVR, 2. the presence of an initial R or Q wave >40 mseconds, and 3. the presence of a notch on the descending limb on a negative QRS complex in aVR. Their current algorithm includes a Vi/Vt, but did not include AV dissociation.41 (Flow chart.S2).
8.5. Lead II R wave peak time
Pava et al, noted that the intrinsicoid deflection time >50 mseconds measured in lead II from the onset to the peak of the QRS complex suggested a diagnosis of VT.42
8.6. RS/QRS ratio
RS/QRS ratio, which was defined as the ratio of the interval from the onset of the QRS complex to the nadir of the S wave, divided by the QRS width in lead V6, where a ratio of 0.41 apparently differentiated VT from SVT with aberrant conduction. This algorithm was useful for identifying posterior fascicular VT with RBBB morphology from SVT with aberrancy of RBBB morphology43.
8.7. Limb lead algorithm (LLA)
Ventricular tachycardia (VT) was diagnosed in the presence of at least 1 of the following: (1) monophasic R wave in lead aVR, (2) predominantly negative QRS in leads I, II, and III; and (3) opposing QRS complex in the limb leads: concordant monophasic QRS in all three inferior leads and concordant monophasic QRS in 2 or 3 of the remaining limb leads with a polarity opposite to that of the inferior leads. The sensitivity and specificity of this algorithm were comparable to the other algorithms described above. It has not been independently evaluated by other investigators44.
Vector orientation of these observation suggests that its accuracy will be high if the VT is arising from the inferior wall, lower septum, or apical segment of the myocardium. The use of single observation is unlikely to result in accurate differentiation of ventricular tachycardia from supraventricular tachycardia with aberrant conduction.
8.8. Scoring system
In this approach presence of initial R wave in V1, initial r 40 ms in V1/V2, notched S in V1, initial R in aVR, lead II R wave peak time ≥50 ms, no RS in V1‐V6 each was assigned one point, and atrioventricular dissociation if present was assigned two points. Higher scores were more specific for the diagnosis of VT however were identified only in 33% of all the VTs45.
Differentiation of WQRST using mathematical models and digitized electrocardiograms or use of special software to analyze the initial activation of the QRS complex in lead V1 and V2 for differentiating VT from SVT with aberrant conduction46 did not significantly change the accuracy likely to have limited application in day‐to‐day clinical practice.47 A comparison of various criteria and algorithms by independent authors found modest diagnostic accuracy, 70%–75%.48, 49
9. PITFALLS AND EXCEPTIONS
The clinical history, findings on physical examination during wide complex tachycardia, and a baseline ECG recorded during sinus rhythm may not be available.
Artifacts can be mistaken for WQRST, particularly if obtained as a rhythm strip in a telemetry or intensive care unit and may lead to additional but unnecessary tests or treatment. Often the peak of the baseline QRS complex marches through the artifact and can be identified (Figure 11). Some pseudo R‐R intervals may not be physiologically tenable and the patient is generally asymptomatic. The cause is commonly loss of electrode/skin contact, patient movement, or movement of the telemetry transmitter module.
FIGURE 11.

Artifacts: Artifacts can be mistaken for nonsustained ventricular tachycardia. In this rhythm strip, sinus rhythm QRS complexes are identified by red dots
In hyperkalemia high levels of extracellular potassium around the myocytes result in the slowing of conduction and prolongation of QRS duration. Atrial standstill may also occur with a concomitant loss of P waves.50
Antiarrhythmic drugs, specifically class 1C drugs, prolong the QRS duration and alter the morphology of the QRS complex, making a distinction between SVT with aberrant conduction and VT difficult. Tricyclic antidepressants and antiepileptic drug toxicity can also result in VT.7, 51
A QRS duration of less than 140 mseconds can be observed in VT arising from one of the fascicles or in the proximity of His‐Purkinje tissue. The relative narrowness of the QRS complex can be mistaken for SVT with aberrant conduction. VT due to bundle branch reentry can also present with relatively narrow QRS complexes; the presence of AV dissociation may help in making the correct diagnosis.
Atrioventricular dissociation can occur during junctional tachycardia. Aberrant conduction or pre‐existing bundle branch block can cause the rhythm to be mistaken for VT.
QRS complex alternans do not help in differentiating the cause of WQRST. VT can be irregular during the first 30 seconds.
An ECG recorded during an episode of WQRST can lead to misdiagnosis if the arm leads have been reversed; SVT with aberrancy can be mistaken for VT and P wave morphology, the hallmark for identifying lead reversal, may not be visible. The frontal plane axis may appear to be in the right superior quadrant, and an R wave may appear in lead aVR as a result of lead reversal, leading to an erroneous diagnosis of VT when the WQRST is really SVT with aberrant conduction.
During VT the initial portion of the QRS complex can be mistaken for atrial activity, leading to an erroneous diagnosis of SVT with aberrancy. When multiple surface leads are recorded, identification of QRS complex onset is enhanced by comparison of multiple leads and what appears to be a P wave can be correctly identified as part of the QRS complex.
A poorly synchronized cardioversion of WQRST due to SVT can induce VT or ventricular fibrillation if the shock is delivered in error on the T wave, falsely reinforcing an initial misdiagnosis of WQRST to be due to VT.
An ECG recorded during sinus rhythm may exhibit an R wave in lead aVR, northwest axis, and/or initial slurring of the QRS complex. An R wave in aVR may be present in patients with right ventricular hypertrophy or extreme right axis deviation. The occurrence of SVT with aberrant conduction in these cases can lead to an erroneous diagnosis of VT.
When a pre‐existing intraventricular conduction defect is present during sinus rhythm, the criteria for the differential diagnosis of WQRST are of limited value.52, 53, 54
Most of the above observations resulted from meticulous analysis of 12‐lead electrocardiograms recorded during sustained, regular WQRST. In some studies, these observations have been correlated with intracardiac electrophysiology studies.55 At times a rhythm strip of non‐sustained WQRST, or tracings recorded in telemetry monitoring units are presented for analysis and opinion. Inaccurate lead placement, standardization, recording speed, or lack of other data that can be gleaned from a 12 lead electrocardiogram decreases the accuracy of interpretation.
WQRST recorded in late pregnancy may also pose diagnostic limitations. The orientation of the heart and thus the QRS vector, may change due to the elevation of the diaphragm. Idiopathic VT arising from the outflow tract is more common in this age group. Frontal plane axis deviation and a QRS duration of <140 mseconds are common in outflow tract VT. Conventional criteria tend to be less sensitive when it comes to differentiating SVT with aberrancy from idiopathic VT.56
10. PRE‐EXCITED TACHYC ARDIA
In the presence of an accessory pathway capable of antegrade conduction, atrial arrhythmias such as atrial fibrillation, atrial flutter, and atrial tachycardia may conduct through the accessory pathway resulting in a pre‐excited WQRST (Figure 10). Unlike the AV node, which has a long refractory period and acts as a gatekeeper that prevents the majority of ectopic atrial impulses from reaching the ventricles, accessory pathways may have very short refractory periods that allow the majority of atrial impulses to reach the ventricles. Antidromic AV reentrant tachycardia will produce a WQRST, but the QRS morphology will depend on the location of the accessory pathway along the AV ring and its ventricular insertion site. The QRS morphology will resemble the morphology of the delta wave observed during sinus rhythm as the ventricle is pre‐excited by the accessory pathway bypassing the AV node and His‐Purkinje system.37, 38
FIGURE 10.

Atrial fibrillation with antegrade conduction through the left lateral accessory pathway resulting in pre‐excited tachycardia. Note shortest pre‐excited R‐R interval of <200 ms (Black dot)
11. VENTRICULAR PACED RHYTHM
A dual‐chamber pacemaker programmed in the DDD mode may track atrial activity during SVT and pace the ventricles at that rate (Figure 12). The pacing spikes may be inconspicuous and therefore may mimic WQRST. A chest X‐ray and intracardiac electrograms recorded from the device may assist diagnosis.
FIGURE 12.

Ventricular paced rhythm. A dual chamber pacemaker is programmed in the DDD mode that tracks atrial activity during atrial tachycardia and paces in the ventricle (red dots). When the P wave falls during the refractory period the tracking stops. The next beat (arrow) shows atrial and ventricular paced beats
12. CONCLUSION
In an attempt to differentiate WQRST due to aberrant conduction from VT, a detailed clinical history, the findings of physical examination during wide complex tachycardia, a review of medications, meticulous analysis of the 12‐lead ECG both during sinus rhythm and during WQRST while keeping in mind the pitfalls and exceptions, can help arrive at the correct diagnosis with both reasonable accuracy and confidence.57
CONFLICT OF INTERESTS
The authors declare no conflict of interest for this article.
Supporting information
Fig S1
Fig S2
Table S1
ACKNOWLEDGMENTS
I am deeply grateful to Dr Fred Morady of University of Michigan School of medicine Ann Arbor Michigan, and Dr Kalyanam Shivkumar of UCLA and Dr. Richard Lange of Paul Foster school of medicine, El Paso Texas for the review of this manuscript and very valuable suggestions.
Abedin Z. Differential diagnosis of wide QRS tachycardia: A review. J Arrhythmia. 2021;37:1162–1172. 10.1002/joa3.12599
funding information
There was no funding source.
REFERENCES
- 1.Pick A, Langendorf R. Differentiation of supraventricular and ventricular tachycardias. Prog. Cardiovasc. Dis. 1960;2(5):391–407. [DOI] [PubMed] [Google Scholar]
- 2.Buxton AE, Marchlinski FE, Doherty JU, Flores B, Josephson ME. Hazards of intravenous verapamil for sustained ventricular tachycardia. Am J Cardiol. 1987;59(12):1107–10. [DOI] [PubMed] [Google Scholar]
- 3.Brady WJ, Mattu A, Tabas J, Ferguson JD. The differential diagnosis of wide QRS complex tachycardia. Am J Emerg Med. 2017;35(10):1525–9. [DOI] [PubMed] [Google Scholar]
- 4.Menendez MM, Marriott HJ. Differential diagnosis of RSR’ and dominant R wave patterns in right chest leads. JAMA. 1966;198(8):843. [PubMed] [Google Scholar]
- 5.Gouaux JL, Ashman R. Auricular fibrillation with aberration simulating ventricular paroxysmal tachycardia. Am. Heart J. 1947;34(3):366–73. [DOI] [PubMed] [Google Scholar]
- 6.Chenevert M, Lewis RJ. Ashman’s phenomenon–a source of nonsustained wide‐complex tachycardia: case report and discussion. J Emerg Med. 1992;10(2):179–83. [DOI] [PubMed] [Google Scholar]
- 7.Kramer DB, Mihatov N, Buch KA, Zafar SF, Ruskin JN. Case 4‐2020: A 52‐year‐old woman with seizure disorder and wide‐complex tachycardia. New Engl J Med. 2020;382(5):457–67. 10.1056/NEJMcpc1913471 [DOI] [PubMed] [Google Scholar]
- 8.Tchou P, Young P, Mahmud R, Denker S, Jazayeri M, Akhtar M. Useful clinical criteria for the diagnosis of ventricular tachycardia. Am J Med. 1988;84(1):53–6. [DOI] [PubMed] [Google Scholar]
- 9.Baerman JM, Morady F, DiCarlo LA, de Buitleir M. Differentiation of ventricular tachycardia from supraventricular tachycardia with aberration: Value of the clinical history. Ann Emerg Med. 1987;16(1):40–3. [DOI] [PubMed] [Google Scholar]
- 10.Morady F, Baerman JM, DiCarlo LA, DeBuitleir M, Krol RB, Wahr DW. A prevalent misconception regarding wide‐complex tachycardias. JAMA. 1985;254(19):2790–2. [PubMed] [Google Scholar]
- 11.Schrire V, Vogelpoel L. The clinical and electrocardiographic differentiation of supraventricular and ventricular tachycardias with regular rhythm. Am. Heart J. 1955;49(2):162–87. [DOI] [PubMed] [Google Scholar]
- 12.Gürsoy S, Steurer G, Brugada J, Andries E, Brugada P. The Hemodynamic mechanism of pounding in the neck in atrioventricular nodal reentrant tachycardia. N. Engl. J. Med. 1992;327(11):772–4. [DOI] [PubMed] [Google Scholar]
- 13.Garratt CJ, Griffith MJ, Young G, Curzen N, Brecker S, Rickards AF, et al. Value of physical signs in the diagnosis of ventricular tachycardia. Circulation. 1994;90(6):3103–7. [DOI] [PubMed] [Google Scholar]
- 14.Marill KA, Wolfram S, deSouza IS, Nishijima DK, Kay D, Setnik GS, et al. Adenosine for wide‐complex tachycardia: Efficacy and safety*. Crit. Care Med. 2009;37(9):2512–8. [DOI] [PubMed] [Google Scholar]
- 15.Wellens HJ, Bär FW, Lie KI. The value of the electrocardiogram in the differential diagnosis of a tachycardia with a widened QRS complex. Am J Med. 1978;64(1):27–33. [DOI] [PubMed] [Google Scholar]
- 16.Dongas J, Lehmann MH, Mahmud R, Denker S, Soni J, Akhtar M. Value of preexisting bundle branch block in the electrocardiographic differentiation of supraventricular from ventricular origin of wide QRS tachycardia. Am J Cardiol. 1985;55(6):717–21. [DOI] [PubMed] [Google Scholar]
- 17.Kremers MS, Miller JM, Josephson ME. Electrical alternans in wide complex tachycardias. Am J Cardiol. 1985;56(4):305–8. [DOI] [PubMed] [Google Scholar]
- 18.Stevenson WG, Case AHT. 20‐2000: A 61‐year‐old man with a wide‐complex tachycardia. Cabot RC, Scully RE, Mark EJ, McNeely WF, Ebeling SH, Ellender SM, et al.,. Cabot RC Scully RE Mark EJ McNeely WF Ebeling SH Ellender SM N. Engl. J. Med.. 2000;342(26):1979–87.10874066 [Google Scholar]
- 19.Vereckei A, Duray G, Szénási G, Altemose GT, Miller JM. Application of a new algorithm in the differential diagnosis of wide QRS complex tachycardia. Eur Heart J. 2007;28(5):589–600. [DOI] [PubMed] [Google Scholar]
- 20.Lown B, Temte JV, Arter WJ, Ventricular Tachyarrhythmias. Circulation. 1973;47(6):1364–81. 10.1161/01.CIR.47.6.1364 [DOI] [PubMed] [Google Scholar]
- 21.Padala SK, Sidhu MS, Brown JR, Zipursky JS, Steckman DA, Parikh DR, et al. Non‐sustained wide complex tachycardia: An underappreciated sign to aid in diagnosis. Europace. 2016;18(7):1069–76. [DOI] [PubMed] [Google Scholar]
- 22.Greenstein E, Goldberger JJ. Implications of progressive aberrancy versus true fusion for diagnosis of wide complex tachycardia. Am J Cardiol. 2011;108(1):52–5. [DOI] [PubMed] [Google Scholar]
- 23.Kastor JA, Horowitz LN, Harken AH, Josephson ME. Clinical electrophysiology of ventricular tachycardia. N. Engl. J. Med. 1981;304(17):1004–20. [DOI] [PubMed] [Google Scholar]
- 24.Griffith MJ, Garratt CJ, Mounsey P, Camm AJ. Ventricular tachycardia as default diagnosis in broad complex tachycardia. Lancet. 1994;343(8894):386–8. [DOI] [PubMed] [Google Scholar]
- 25.Brugada P, Brugada J, Mont L, Smeets J, Andries EW. A new approach to the differential diagnosis of a regular tachycardia with a wide QRS complex. Circulation. 1991;83(5):1649–59. [DOI] [PubMed] [Google Scholar]
- 26.Marriott HJ. Differential diagnosis of supraventricular and ventricular tachycardia. Cardiology. 1990;77(3):209–20. [DOI] [PubMed] [Google Scholar]
- 27.Sandler IA, Marriotr HJL. The differential morphology of anomalous ventricular complexes of RBBB‐type in lead V 1: Ventricular ectopy versus aberration. Circulation. 1965;31(4):551–6. [DOI] [PubMed] [Google Scholar]
- 28.Reddy V, Reddy V, Mangat S, Shokr M, Kundumadam S, Laharwani H. Wide complex tachycardia in a COVID‐19 patient: What is the mechanism? J. Electrocardiol. 2020;60:200–2. [DOI] [PMC free article] [PubMed] [Google Scholar]
- 29.Dendi R, Josephson ME. A new algorithm in the differential diagnosis of wide complex tachycardia. Eur Heart J. 2007;28(5):525–6. [DOI] [PubMed] [Google Scholar]
- 30.Kindwall KE, Brown J, Josephson ME. Electrocardiographic criteria for ventricular tachycardia in wide complex left bundle branch block morphology tachycardias. Am J Cardiol. 1988;61(15):1279–83. [DOI] [PubMed] [Google Scholar]
- 31.Akhtar M, Shenasa M, Jazayeri M, Caceres J, Tchou PJ. Wide QRS complex tachycardia. Reappraisal of a common clinical problem. Ann Intern Med. 1988;109(11):905–12. [DOI] [PubMed] [Google Scholar]
- 32.Miller JM, Das MK, Yadav AV, Bhakta D, Nair G, Alberte C. Value of the 12‐lead ECG in wide QRS tachycardia. Cardiol. Clin. 2006;24(3):439–51. [DOI] [PubMed] [Google Scholar]
- 33.Arias MA, Domínguez‐Pérez L, Pachón M, Rodríguez‐Padial L. Wide QRS tachycardia complexes narrower than baseline: an uncommon electrocardiographic clue for ventricular tachycardia. Europace. 2008;10(11):1356. [DOI] [PubMed] [Google Scholar]
- 34.Wellens HJ. Electrophysiology: Ventricular tachycardia: Diagnosis of broad QRS complex tachycardia. Heart. 2001;86(5):579–85. [DOI] [PMC free article] [PubMed] [Google Scholar]
- 35.Abedin Z. Diffrential diagnosis of wide complex tachycardia. In: Essential cardiac electrophysiology, self‐assessment approach. 3rd ed. Minneapolis, MN: Cardiotext Publishing, 2019; p. 329–37. [Google Scholar]
- 36.Vereckei A. Current algorithms for the diagnosis of wide QRS complex tachycardias. Curr Cardiol Rev. 2014;10(3):262–76. [DOI] [PMC free article] [PubMed] [Google Scholar]
- 37.Jastrzębski M, Moskal P, Kukla P, Fijorek K, Kisiel R, Czarnecka D. Specificity of wide QRS complex tachycardia criteria and algorithms in patients with ventricular preexcitation. Ann Noninvasive Electrocardiol. 2018;23(2):e12493. [DOI] [PMC free article] [PubMed] [Google Scholar]
- 38.Antunes E, Brugada J, Steurer G, Andries E, Brugada P. The Differential diagnosis of a regular tachycardia with a wide QRS complex on the 12‐lead ECG: Ventricular tachycardia, supraventricular tachycardia with aberrant intraventricular conduction, and supraventricular tachycardia with anterograde conduction over an accessory pathway. Pacing Clin. Electrophysiol. 1994;17(9):1515–24. [DOI] [PubMed] [Google Scholar]
- 39.De Ponti R, Bagliani G, Padeletti L, Natale A. General approach to a wide QRS complex. Card Electrophysiol Clin. 2017;9(3):461–85. [DOI] [PubMed] [Google Scholar]
- 40.Griffith MJ, de Belder MA, Linker NJ, Ward DE, Camm AJ. Multivariate analysis to simplify the differential diagnosis of broad complex tachycardia. Br Heart J. 1991;66(2):166–74. [DOI] [PMC free article] [PubMed] [Google Scholar]
- 41.Vereckei A, Duray G, Szénási G, Altemose GT, Miller JM. New algorithm using only lead aVR for differential diagnosis of wide QRS complex tachycardia. Heart Rhythm. 2008;5(1):89–98. [DOI] [PubMed] [Google Scholar]
- 42.Pava LF, Perafán P, Badiel M, Arango JJ, Mont L, Morillo CA, et al. R‐wave peak time at DII: A new criterion for differentiating between wide complex QRS tachycardias. Heart Rhythm. 2010;7(7):922–6. [DOI] [PubMed] [Google Scholar]
- 43.Kim M, Kwon CH, Lee JH, Hwang KW, Choi HO, Kim Y‐G, et al. Right bundle branch block–type wide QRS complex tachycardia with a reversed R/S complex in lead V6: Development and validation of electrocardiographic differentiation criteria. Heart Rhythm. 2021;18(2):181–8. [DOI] [PubMed] [Google Scholar]
- 44.Chen Q, Xu J, Gianni C, Trivedi C, Della Rocca DG, Bassiouny M, et al. Simple electrocardiographic criteria for rapid identification of wide QRS complex tachycardia: The new limb lead algorithm. Heart Rhythm. 2020;17(3):431–8. [DOI] [PubMed] [Google Scholar]
- 45.Jastrzebski M, Sasaki K, Kukla P, Fijorek K, Stec S, Czarnecka D. The ventricular tachycardia score: a novel approach to electrocardiographic diagnosis of ventricular tachycardia. Europace. 2016;18(4):578–84. [DOI] [PubMed] [Google Scholar]
- 46.El Hajjaji I, Becker G, Kus T, Vinet A, Berkovitz A, Sturmer M. Novel criterion for the differential diagnosis of wide QRS complexes and wide complex tachycardia using the initial activation of QRS on leads V1 and V2. J. Electrocardiol. 2018;51(4):700–6. [DOI] [PubMed] [Google Scholar]
- 47.McGill TD, Kashou AH, Deshmukh AJ, LoCoco S, May AM, DeSimone CV. Wide complex tachycardia differentiation: An examination of traditional and contemporary approaches. J. Electrocardiol. 2020;60:203–8. [DOI] [PubMed] [Google Scholar]
- 48.Jastrzebski M, Kukla P, Czarnecka D, Kawecka‐Jaszcz K. Comparison of five electrocardiographic methods for differentiation of wide QRS‐complex tachycardias. Europace. 2012;14(8):1165–71. [DOI] [PubMed] [Google Scholar]
- 49.Kaiser E, Darrieux FCC, Barbosa SA, Grinberg R, Assis‐Carmo A, Sousa JC, et al. Differential diagnosis of wide QRS tachycardias: comparison of two electrocardiographic algorithms. Europace. 2015;17(9):1422–7. [DOI] [PubMed] [Google Scholar]
- 50.Hollowell H, Mattu A, Perron AD, Holstege C, Brady WJ. Wide‐complex tachycardia: beyond the traditional differential diagnosis of ventricular tachycardia vs supraventricular tachycardia with aberrant conduction. Am J Emerg Med. 2005;23(7):876–89. [DOI] [PubMed] [Google Scholar]
- 51.Goldstein JN, Dudzinski DM, Erickson TB, Linder G. Case 12‐2018: A 30‐year‐old woman with cardiac arrest. New Engl J Med. 2018;378(16):1538–49. 10.1056/NEJMcpc1800322 [DOI] [PubMed] [Google Scholar]
- 52.Alberca T, Almendral J, Sanz P, Almazan A, Cantalapiedra JL, Delcán JL. Evaluation of the specificity of morphological electrocardiographic criteria for the differential diagnosis of wide QRS complex tachycardia in patients with intraventricular conduction defects. Circulation. 1997;96(10):3527–33. [DOI] [PubMed] [Google Scholar]
- 53.Kremers MS, Black WH, Wells PJ, Solodyna M. Effect of preexisting bundle branch block on the electrocardiographic diagnosis of ventricular tachycardia. The American Journal of Cardiology. 1988;62(17):1208–12. [DOI] [PubMed] [Google Scholar]
- 54.Datino Romaniega T, Almendral J, Ávila P, González‐Torrecilla E, Atienza F, Arenal Á, et al. Specificity of electrocardiographic criteria for the differential diagnosis of wide QRS complex tachycardia in patients with intraventricular conduction defect. Heart Rhythm. 2013;10(9):1393–401. [DOI] [PubMed] [Google Scholar]
- 55.González R, Pardo J. Differential diagnosis of tachycardias with a widened QRS complex. Rev Med Chil. 1997;125(2):236–43. [PubMed] [Google Scholar]
- 56.Yadav AV, Nazer B, Drew BJ, Miller JM, El Masry H, Groh WJ, et al. Utility of conventional electrocardiographic criteria in patients with idiopathic ventricular tachycardia. JACC Clin Electrophysiol. 2017;3(7):669–77. [DOI] [PubMed] [Google Scholar]
- 57.Alzand BSN, Crijns HJGM. Diagnostic criteria of broad QRS complex tachycardia: decades of evolution. Europace. 2011;13(4):465–72. [DOI] [PubMed] [Google Scholar]
Associated Data
This section collects any data citations, data availability statements, or supplementary materials included in this article.
Supplementary Materials
Fig S1
Fig S2
Table S1