Abstract
Intracellular ADP‐ribosyltransferases catalyze mono‐ and poly‐ADP‐ribosylation and affect a broad range of biological processes. The mono‐ADP‐ribosyltransferase PARP10 is involved in signaling and DNA repair. Previous studies identified OUL35 as a selective, cell permeable inhibitor of PARP10. We have further explored the chemical space of OUL35 by synthesizing and investigating structurally related analogs. Key synthetic steps were metal‐catalyzed cross‐couplings and functional group modifications. We identified 4‐(4‐cyanophenoxy)benzamide and 3‐(4‐carbamoylphenoxy)benzamide as PARP10 inhibitors with distinct selectivities. Both compounds were cell permeable and interfered with PARP10 toxicity. Moreover, both revealed some inhibition of PARP2 but not PARP1, unlike clinically used PARP inhibitors, which typically inhibit both enzymes. Using crystallography and molecular modeling the binding of the compounds to different ADP‐ribosyltransferases was explored regarding selectivity. Together, these studies define additional compounds that interfere with PARP10 function and thus expand our repertoire of inhibitors to further optimize selectivity and potency.
Keywords: ADP-ribosylation, cell proliferation, compound screening, DNA repair, molecular modeling
ADP‐ribosyltransferases are involved in many different cellular processes, including DNA repair, signaling, and innate immunity. Inhibitors of PARP1/2 are in clinical use to treat several types of cancers. Here, we describe novel inhibitors of PARP10, which is deregulated in disease. We addressed the specificity of the inhibitors using structural and enzymatic studies, which will contribute to the further development of small molecule PARP inhibitors.
1. Introduction
ADP‐ribosylation is a reversible chemical modification of proteins, DNA and RNA, which uses NAD+ as a cofactor. This process is catalyzed by ADP‐ribosyltransferases (ARTs), which can be divided into two subfamilies according to their similarity to either the diphtheria toxin ART or the cholera toxin ART, referred to as ARTD and ARTC enzymes, respectively.[1] The former are intracellular ARTs and the individual members are named PARPs or TNKSs. These are subdivided into enzymes capable of mono‐ADP‐ribosylating (MARylating) substrates while others catalyze the addition of several ADP‐ribose (ADPr) units in an iterative process, thereby forming poly‐ADP‐ribose chains (PARylation).[2] Moreover, one of the family members appears to be catalytically inactive.[1a] The MARylating ARTDs comprise the largest group, which includes PARP10. Multiple cellular processes have been identified that are controlled by ADP‐ribosylation.[3] Arguably, the best studied process is DNA repair, in which damaged DNA provokes the activation of PARP1 and PARP2, which through PARylation define an environment that allows efficient base and nucleotide excision DNA repair.[4] Inhibition of these enzymes by so‐called PARP inhibitors (PARPi) is clinically relevant because PARPi are synthetically lethal with DNA double strand repair deficiencies as found for example in BRCA mutant tumor cells.[5]
MARylation has been linked to many different processes, including stress response and signal transduction.[3a] In particular, PARP10 (also known as ARTD10) was identified as an interaction partner of the oncoprotein MYC.[6] PARP10 efficiently automodifies both in vitro and in cells.[2, 7] A number of different protein substrates have been identified. This includes the NF‐κB signaling pathway component NEMO. Its function in mediating IKK activation is inhibited by MARylation.[8] Moreover, the catalytic activity of GSK3β, a kinase involved in signaling and metabolism, including WNT‐dependent gene regulation, is inhibited by MARylation.[9] PARP10‐mediated MARylation is antagonized by MAR hydrolases of the macrodomain type.[10] For example, the catalytic activity of MARylated GSK3β can be reactivated by MacroD2, one of the three known cellular hydrolases that remove ADPr from PARP10 MARylated substrates.[11]
PARP10 shuttles between the nuclear and cytosolic compartments, suggesting functions in both.[12] Indeed, the proliferating cell nuclear antigen (PCNA) was found to interact with PARP10, which is relevant for DNA damage tolerance.[13] PCNA has been shown to be important for nucleotide excision repair (NER) and in particular for translesion DNA synthesis (TLS).[14] Homozygous mutations in PCNA are associated with a neurodegenerative phenotype,[15] similar to defects in NER components in other syndromes, including Cockayne syndrome and Xeroderma pigmentosum.[16] The recruitment of catalytically active PARP10 by PCNA is important for TLS.[13] Therefore, the finding of a frameshift mutant in PARP10 associated with severe developmental delay is interesting.[17] Although relying on a single case, the identified 2 nucleotide deletion results in a frameshift after Thr216, removing most functional domains described thus far, including the catalytic domain of PARP10.[8b] Consistent with an effect in TLS are the observations that patient‐derived lymphoblasts are highly sensitive to hydroxyurea (HU) compared to control cells. Moreover, the knockout of PARP10 in tumor cells also enhances the sensitivity to HU treatment.[18] The replication stress inflicted by HU involves TLS for overcoming the replication blockade. A role of PARP10 in DNA repair is also consistent with the observation that HeLa PARP10 knockout cells compared to control cells proliferate less efficiently in tissue culture and when injected into immunocompromised mice form tumors less efficiently.[18] These findings suggest that inhibition of PARP10 might enhance the mutagenesis rate and thus could be synthetically lethal with defects in or interfering with other DNA repair pathways.
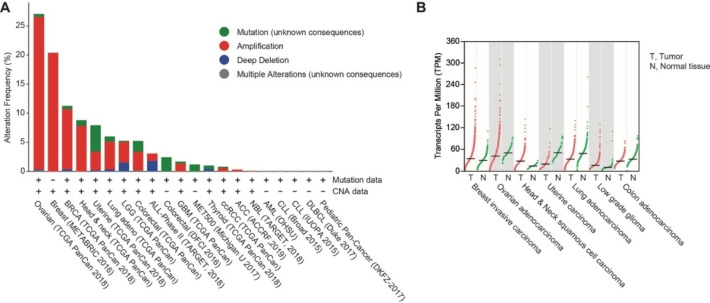
A conclusion of the observations summarized above is that PARP10 might have oncogenic properties. Therefore, alterations of the PARP10 locus were evaluated in human tumors using eBioPortal.[19] Amplification of the PARP10 locus is frequent in some tumors, including breast and ovarian cancer (Figure 1A). Moreover, the expression of PARP10 was evaluated using GEPIA.[20] This revealed that some breast and ovarian cancer have high expression, consistent with amplification of the genomic region (Figure 1B). Thus, PARP10 overexpression is postulated to be beneficial for some tumors and, consequently, PARP10 inhibition might have therapeutic benefits.
Figure 1.
Genetic alterations at and expression of the PARP10 locus. A. Genetic alterations as documented in cBioPortal.org (June 11, 2020). A curated set of non‐redundant studies with more than 500 tumors was analyzed. CNA refers to the presence of amplifications and/or deep deletions, the later possibly a homozygous deletion. The following tumors are indicated: ACC, adenoid cystic carcinoma; ALL, acute lymphoblastic leukemia; AML, acute myeloid leukemia; BRCA, breast invasive carcinoma; ccRCC, clear cell renal cell carcinoma; CLL, chronic myelogenous leukemia; DLBCL, diffuse large B cell lymphoma; GBM, glioblastoma multiforme; LGG, low‐grade glioma; MET500, metastatic solid tumors of diverse lineages and biopsy sites; NBL, neuroblastoma; UCS, uterine carcinosarcoma. B. PARP10 gene expression in tumors and comparable normal tissue as indicated. This information was retrieved from GEPIA.cancer‐pku.cn (August 14, 2020).
Furthermore, a recent study has linked enhanced PARP10 expression to cardiac hypertrophy.[21] In this system, PARP10 expression is controlled by a piRNA, which interferes with N6‐adenosine methylation and thus results in enhanced translation. Subsequently, PARP10 interferes with GSK3β, a known substrate of PARP10.[9, 11] This in turn promotes NFATC4 nuclear accumulation, a member of a transcription factor family long known to be involved in cardiac hypertrophy,[22] and altered gene regulation.[21] Although it has not been clarified whether catalytic activity is relevant in promoting cardiac hypertrophy, inhibitors of PARP10 might be beneficial to treat patients with chronic cardiac hypertrophy.
Previously, we established conditions that allowed screening for inhibitors of ARTs and identified OUL35 (1), a selective inhibitor of PARP10 (Figure 2).[23] Importantly, 1 is capable of penetrating cells, thereby rescuing cells from PARP10‐dependent apoptosis.[24] We have expanded on 1 and developed additional compounds, some of which were slightly more efficient.[25]
Figure 2.
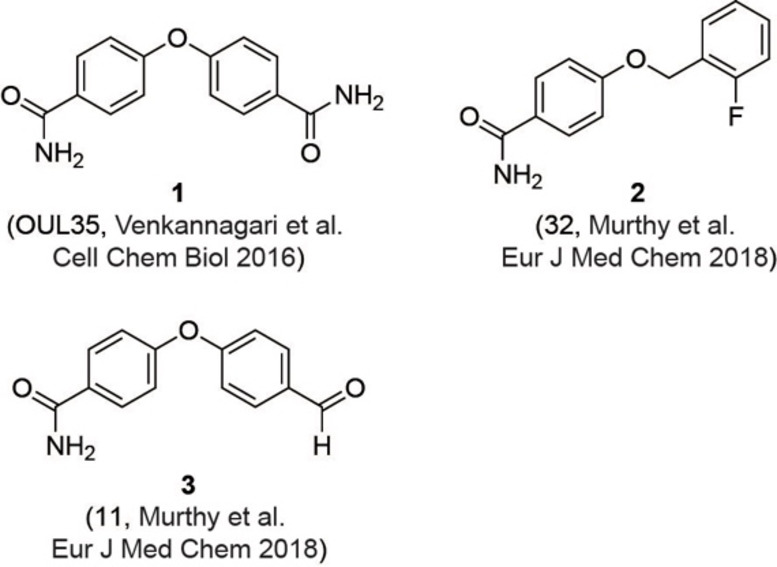
Previously described PARP10 inhibitors. Compound 1 and compounds 2 and 3 have been described by Venkannagari et al. and Murphy et al., respectively.[24a, 25]
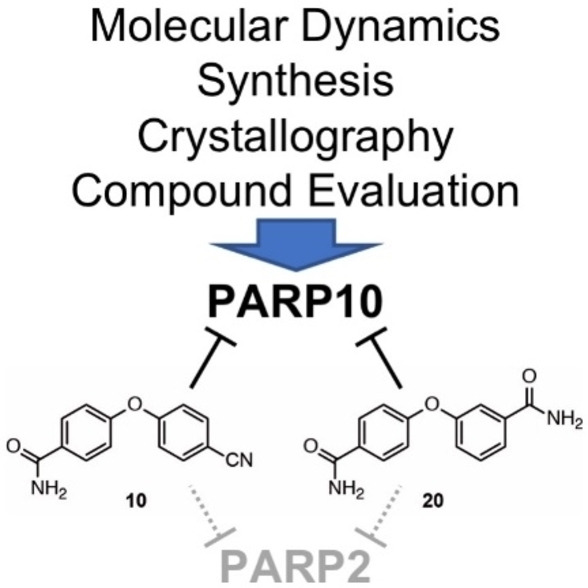
Compounds with similar potency in in vitro enzyme assays have been described, but for most it is unclear whether they penetrate cells.[26] Moreover, efforts have been made to develop inhibitors that are selective to other MARylating ARTDs, including PARP14 and PARP11.[26b, 27] Together, these findings reveal a number of different compounds that interfere with PARP10 catalytic activity with nanomolar efficiency, but only some of those are cell penetrable and their IC50 values in cell‐based assays are typically in the low micromolar range. We have now expanded the analysis of PARP10 inhibitors based on our previous work.[24a, 25] To this aim we have combined novel structural data, modeling and simulations with a synthetic effort of preparing 1 analogs tested in vitro and in cell experiments. The two PARP10 inhibitors here identified, 4‐(4‐cyanophenoxy)benzamide (10) and 3‐(4‐carbamoylphenoxy)benzamide (20) were both cell permeable and interfered with PARP10 toxicity. Interestingly, they both revealed a selective inhibition of PARP2 over PARP1. This is a distinct feature because current clinically used PARPis typically inhibit both enzymes. Our multidisciplinary approach expands the chemical space of PARP10 inhibitors and further provides new leads for understanding selectivity in PARPs’ inhibition.
2. Results and Discussion
2.1. Chemistry
The current study was carried out to further expand on PARP10 inhibitors. Our previous analyses demonstrated that OUL35 (4,4’‐oxybenzamide, 1, Figure 2) is useful in studying the function of PARP10 in cells.[24a] The activation of this enzyme, but not the catalytically inactive mutant PARP10‐G888W, in HeLa cervical carcinoma cells results in apoptosis and inhibition of cell proliferation.[24b] These effects are efficiently rescued by the selective PARP10 inhibitor 1. Also, the stability of PARP10 is enhanced by 1 in cellular thermal shift assays.[24a] These findings demonstrate that this compound is cell permeable and engages with the target PARP10. Similarly, 4‐[(2‐fluorobenzyl)oxy]benzamide (2) and 4‐(4‐formylphenoxy)benzamide (3) are capable of rescuing HeLa cells that overexpress PARP10.[25] These three compounds, which inhibit the catalytic domain of PARP10 with IC50 values in the range of 230–710 nm in in vitro experiments, are para‐substituted benzamides with aryl‐based substituents bound through ether linkages (Figure 2).
We synthesized further compounds with the two aryls in different geometric arrangement. In general, the reaction sequences for synthesizing the target compounds involved cross‐couplings and functional group transformations. Details of all preparative protocols and analytic data of the product compounds are provided in the Supporting Information. As representative examples, the syntheses of products 10 and 20, which proved most relevant in the subsequently described biological studies, are shown in Scheme 1.
Scheme 1.
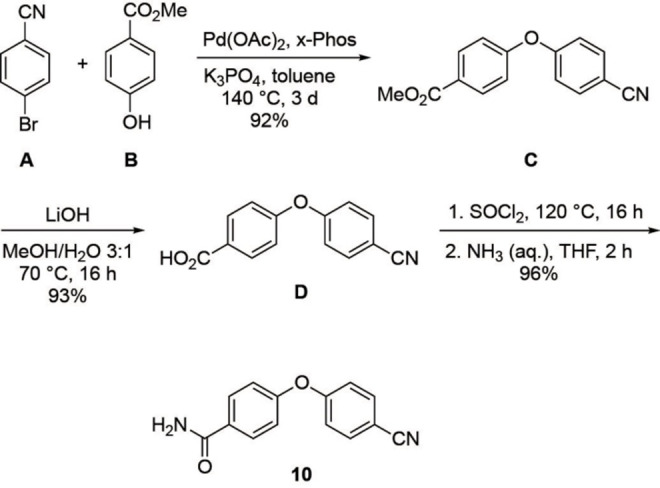
Synthesis of product 10.
The synthesis of 10 (Scheme 1) started by palladium‐catalyzed coupling of 4‐bromobenzonitrile (A) and methyl‐4‐hydroxy benzoate (B), which gave diaryl ether C in 92 % yield. Ester hydrolysis of C with lithium hydroxide as base led to acid D in 93 % yield. Finally, D was treated with thionyl chloride to provide the corresponding acyl chloride, which was directly amidated with aqueous ammonia to give 10 in 96 % yield.
As depicted in Scheme 2, diamide 20 was prepared via 19 being an isomer of the aforementioned product 10. In this case, the synthesis started by coupling 4‐bromobenzonitrile (A) and methyl‐3‐hydroxy benzoate (F), and analogous subsequent reactions as towards 10 led to 19 in high yield. In the final step, the nitrile group of 19 was hydrolyzed with the help of aqueous sodium perborate to give diamide 20 in 88 % yield.
Scheme 2.
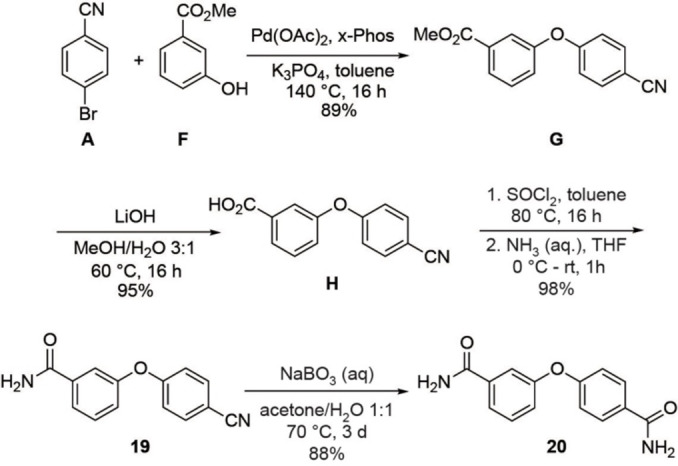
Synthesis of product 20.
2.2. Biochemical and Biological Evaluation
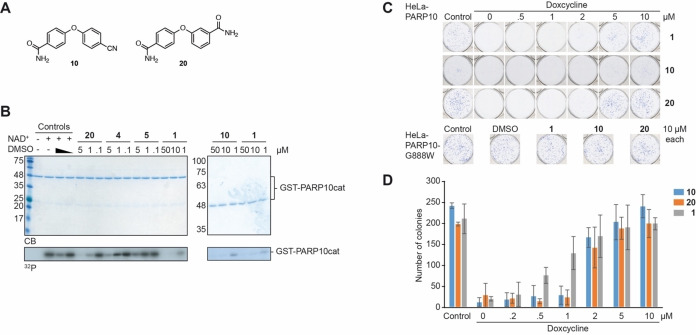
The compounds synthesized, as summarized in Table 1, were screened in in vitro ADP‐ribosylation assays that measured automodification of the catalytic domain of PARP10 and for their ability to antagonize the PARP10‐dependent inhibition of HeLa cells. General toxicity was evaluated on HeLa cells expressing PARP10‐G888W, a catalytically inactive version of PARP10.[2] None of the tested compounds listed in Table 1 showed general toxicity, with the exception of compound 19, which resulted in smaller colonies. We used a concentration of 10 μm for the preliminary assessment of the different compounds and as cut‐off for further biological analyses (Table 1). We focused on those compounds that were active both in the in vitro and in the cell‐based assays with HeLa‐PARP10 cells and did not show any toxicity on the HeLa‐PARP10‐G888W control cells. Examples of the in vitro ADP‐ribosylation and the cell proliferation assays are shown in Figure 3 and Supplementary Figure S1 and S2 in the Supporting Information.
Table 1.
Compounds screened for their general inhibitory potential towards PARP10 in vitro and in cells.
|
Comp. |
X |
Y |
PARP10cat[a] Automod. |
CFA[b] |
|---|---|---|---|---|
|
|
|
|
|
|
|
4 |
C(O)NH2 |
C(O)OH |
active |
inactive |
|
5 |
C(O)NH2 |
C(O)OMe |
active |
5‐10 μm |
|
6 |
C(S)NH2 |
C(O)OMe |
inactive |
inactive |
|
7 |
CN |
C(O)NHNH2 |
n.a.[c] |
inactive |
|
8 |
C(O)NH2 |
C(O)NHNH2 |
active |
inactive |
|
9 |
C(S)NH2 |
C(O)OH |
active |
inactive |
|
10 |
C(O)NH2 |
CN |
active |
1–2 μm |
|
11 |
C(O)NH2 |
5‐tetrazolyl |
active |
inactive |
|
12 |
C(S)NH2 |
5‐tetrazolyl |
active |
inactive |
|
13 |
C(S)NH2 |
CN |
active |
inactive |
|
14 |
C(O)OMe |
5‐tetrazolyl |
inactive |
inactive |
|
15 |
C(O)OH |
5‐tetrazolyl |
inactive |
inactive |
|
16 |
CN |
CN |
active |
inactive |
|
17 |
C(S)NH2 |
C(S)NH2 |
inactive |
inactive |
|
18 |
C(O)NH2 |
C(S)NH2 |
active |
5–10 μm |
|
|
|
|
|
|
|
19 |
CN |
C(O)NH2 |
active |
5–10 μm [d] |
|
20 |
C(O)NH2 |
C(O)NH2 |
active |
1–2 μm |
|
21 |
C(O)NH2 |
C(O)OH |
inactive |
inactive |
|
22 |
C(O)NH2 |
C(O)OMe |
inactive |
inactive |
|
23 |
5‐tetrazolyl |
C(O)NH2 |
active |
inactive |
|
24 |
C(S)NH2 |
C(O)NH2 |
active |
inactive |
|
25 |
C(O)NH2 |
CN |
active |
inactive |
|
26 |
C(O)NH2 |
5‐tetrazolyl |
active |
inactive |
|
27 |
C(O)NH2 |
C(S)NH2 |
active |
inactive |
|
|
|
|
|
|
|
28 |
CN |
CN |
inactive |
n.a. |
|
29 |
C(O)NH2 |
C(O)NH2 |
inactive |
inactive |
|
|
|
|
|
|
|
30 |
C(O)NH2 |
C(O)NH2 |
inactive |
n.a. |
|
31 |
CN |
C(O)NH2 |
inactive |
n.a. |
|
32 |
C(O)NH2 |
C(O)OH |
inactive |
n.a. |
|
|
|
|||
[a] Automodification and analysis by SDS‐PAGE, active and inactive refers to compounds that inhibited at 10 μm or did not, respectively. Examples are shown in Figures 3 and S1 in the Supporting Information.[b] Colony‐formation assay (CFA) in HeLa‐PARP10 cells with estimated IC50 values. [c] not analyzed (n.a.). [d] Very small colonies, suggesting some toxic effect.
Figure 3.
Compounds 10 and 20 inhibit PARP10 both in vitro and in cells. A) Structure of compounds 10 and 20. B) The bacterially expressed, catalytic domain of PARP10 (PARP10cat) was incubated with 32P‐labelled NAD+ as indicated. The compounds were solubilized in DMSO with the final concentration of the solvent being 0.05 %. Displayed are Coomassie blue stained SDS‐gels and the corresponding autoradiograms. In the control samples either 0.5 % or 0.05 % DMSO was used. C) Five hundred HeLa‐PARP10 or HeLa‐PARP10‐G888W cells were plated per well of a 6‐well plate and the expression of PARP10 induced with doxycycline. The indicated compounds were added at the given concentrations. The cells were grown for 8–10 days with doxycycline and compounds replenished every three days and then fixed and stained with methylene blue. Examples of individual wells are shown. D) The colonies in each well were counted. Every condition in each experiment was performed in triplicates. Mean values and standard deviations of 3 biological replicates are displayed. Nonlinear regression analysis revealed IC50 values of 1.66 μm (95 % confidence interval: 1.344 to 2.287), 1.84 μm (95 % confidence interval: wide), 0.78 μm (95 % confidence interval: 0,5224 to 1,268) for 10, 20 and 1, respectively.
Our findings revealed that in the series of para‐para compounds all derivatives with carbamoyl groups were active in vitro, while the compounds with carbamothioyl groups showed more variation, with 9, 12, 13 and 18 being active and 6 and 17 inactive (Table 1). With the exception of 18, in which the carbamothioyl moiety was combined with a carbamoyl group, all other thioamides were inactive when tested in cells. The 5‐tetrazolyl‐substituted compounds were only active in vitro when bearing a carbamoyl substituent (11 and 12), but all were inactive in cells (11, 12, 14, and 15). Nitriles were variable and, with the exception of 10, inactive in cells. A methyl ester bearing a carbamoyl group was active but not with a carbamothioyl substituent (5 vs 6, respectively). Acylhydrazides were inactive in cells (7 and 8).
In the series of benzamides with para and meta substituents, only compounds with para‐carbamoyl groups were active in vitro (20, 22, 25–27) with the exception of the combination with a meta‐carboxyl substituent (21) (Table 1). Of these only 20 was active in cells. Compound 23 with a meta‐carbamoyl substituent was active in vitro, while 29 with two meta‐carbamoyl substituents was inactive. Both compounds were inactive in cells. All other compounds that were in the meta‐meta, para‐ortho and meta‐ortho configuration were inactive in vitro and in cells (Table 1).
From these studies, 4‐(4‐cyanophenoxy)benzamide (10) and 3‐(4‐carbamoylphenoxy)benzamide (20) were most promising (Figure 3A), with both showing activity in cells (Figure 3C and D). Compounds 10 and 20 have nicotinamide‐mimicking carbamoyl groups and two‐ring structures linked by an oxygen, similar to their predecessors OUL35 (1), 2 and 3 (Figure 2). In compound 10 the carbamoyl substituent was replaced by a nitrile group, and in compound 20 the carbamoyl moiety was moved from the para to the meta position (Table 1). Compounds 10 and 20 were further analyzed and compared to 1. The initial evaluation of 10 and 20 indicated IC50 values of 1–2 μm. A more detailed analysis revealed that while compound 20 was similarly effective in in vitro assays compared to 1 (0.48 μm and 0.33 μm, respectively), compound 10 was roughly 10 times less efficient (Table 2). The measurements for 20 are consistent with recently published findings of the identical compound 8a, for which an IC50 of 0.51 μm was reported.[26b] Examples of the data used to calculate the IC50 values are given in Figure S3 in the Supporting Information.
Table 2.
IC50 (pIC50±SEM, n=3) values of indicated compounds against a panel of human PARPs.
|
|
1 (OUL35)[a] |
10 |
20 |
|---|---|---|---|
|
PARP1 |
>100 μm |
>100 μm |
>100 μm |
|
PARP2 |
>100 μm |
27 μm |
1.7 μm (5.77±0.12) |
|
PARP3 |
>100 μm |
>100 μm |
>100 μm |
|
PARP4 |
23 μm |
>100 μm |
7 μm |
|
TNKS1 |
>100 μm |
>100 μm |
21 μm |
|
TNKS2 |
>100 μm |
>100 μm |
6.5 μm |
|
PARP10 |
330 nm |
3.64 μm (5.44±0.03) |
480 nm (6.32±0.15) |
|
PARP12 [b] |
>100 μm |
>10 μm |
>10 μm |
|
PARP14 |
23 μm |
>100 μm |
41 μm |
|
PARP15 [b] |
>10 μm |
11 μm (4.95±0.10) |
1.7 μm (5.56±0.11) |
|
PARP16 [b] |
4.17 μm |
>10 μm |
>10 μm |
[a] Data taken from Venkannagary et al. Cell Chem. Biol. (2016). [b] Concentration limited by DMSO tolerance.
The in vitro analysis on the catalytic domain of PARP10 was complemented by measuring inhibition of full‐length PARP10 immunoprecipitated from HEK293 cells. The inhibition with 10 and 20 was similar to the inhibition of the catalytic domain and thus the effects on PARP10 and PARP10cat were comparable (Figure S1 in the Supporting Information). Moreover, we determined the IC50 values in our cell‐based assays. We determined IC50 values of 1.7 μm and 1.8 μm for 10 and 20, respectively, compared to 0.8 μm for 1 (OUL35) (Figure 3). Thus, both substances were slightly less efficient compared to 1 and overall being in the same order of magnitude as a previous in cell analysis, which had given an IC50 of 1.35 μm.[24a] Thus, the 10‐fold difference of the IC50 observed in the in vitro assays for compound 10 compared to 1 and 20 was reduced in the cell‐based experiments. It is possible that the uptake of 10 into cells is more efficient than for 20 and 1. In addition to this, 10 might be more stable than the other two compounds. These differences might explain why 10 appears equally efficient in cells despite being 10 times less potent in vitro.
2.3. Selectivity
To evaluate the selectivity of compounds 10 and 20, IC50 values against a panel of human PARPs were determined (Table 2). The two compounds and 1 revealed different spectra of inhibition of the various PARPs. All three were inactive towards PARP1. However, 10 and particularly 20 inhibited PARP2 but not PARP1, which was unexpected (see below). Compared to 1, which shows mild selectivity for PARP4 and PARP14, 10 inhibited PARP15 somewhat less efficiently than PARP10. In contrast to 1 and 10, compound 20 showed activity towards PARP4, TNKS2 and PARP15 and mildly towards TNKS1 and PARP14 (Table 2).
When modeled in PARP10 and PARP14, compound 1 enters the binding pocket with one of the benzamide groups. The overall poses of 1 in the two models is comparable to the co‐crystal with PARP15‐Y598 L (Figure 4A). The binding is stabilized in both PARP10 and PARP14 by pi‐stacking interactions with a Tyr residue, which was not obvious in the PARP15 crystal structure, although a Tyr was sufficiently close. Typical PARPi H‐bond interactions with the backbone of a Gly and side chain hydroxyl of Ser residues were seen for all three PARPs (Figure 4C). The other part of the molecule, i. e. the second carbamoyl, orients toward the solvent (Figure 4C).
Figure 4.
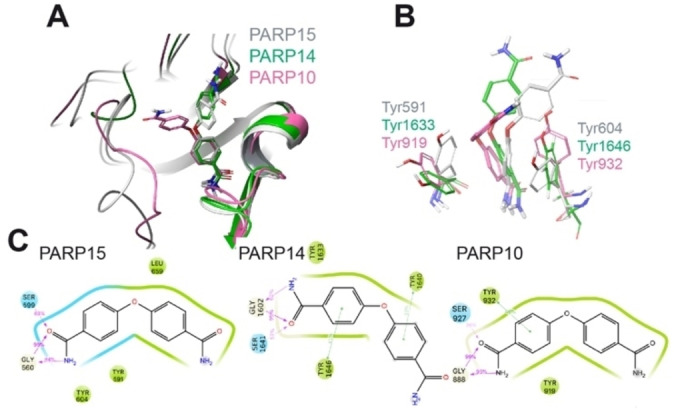
Modeling of the interaction of compound 1 with mono‐ADP‐ribosyltransferases. A) Structural comparison of the modeled PARP10 and PARP14 in complex with compound 1 with the deposited crystal structure of 1‐PARP15‐Y598L complex (PDB id. 6EK3). PARP10, 14 and 15 are in pink, green, and grey cartoon representation, respectively. 1 is in stick representation with the same color code as used for the proteins. Non‐polar hydrogens are not displayed. B) Details of the relative position of OUL35 are shown with respect to the Tyr residues in PARP10, PARP14 and PARP15‐Y598L. The color‐code is the same as used in panel A. C) 2D interaction scheme of OUL35 with PARP10, PARP14 and PARP15‐Y598L, respectively. The percentage of occurrence of the main interactions during the overall MD trajectories is also indicated. Green and cyan spheres indicate hydrophobic and polar residues, respectively. While grey and white spheres are for glycine and water, respectively. Green lines indicate pi‐stacking interactions, while pink arrows indicate the presence of hydrogen bonds.
In PARP14, the loop between Gly1615 and Gly1631 assumes an open conformation, while the corresponding loop (Gly901‐Gly917) is closed in PARP10. As a result, 1 (OUL35) is more exposed to the solvent when in complex with PARP14 compared to PARP10 (Figure S4 in the Supporting Information). This higher surface exposure of the ligand to the solvent suggests an overall weaker binding to PARP14 and supports the reduced IC50 values obtained in the catalytic activity measurements (Table 2). Modeling of a compound 1‐PARP4 complex was not possible due to the lack of structural information for this enzyme.
As pointed out above, compounds 10 and 20 appeared to have more promiscuous effects compared to 1 (Table 2). Compound 10, in which one carbamoyl was replaced by a nitrile, showed some activity also for PARP2 and PARP15. We modeled the 10‐PARP2 and 10‐PARP15 complexes (Figure 5) and the stability of the representative binding poses was evaluated and compared to the complexes with compound 1 using the Glide score (Figure S5 in the Supporting Information). Our modeled complexes followed the affinity trend with 10 scoring better in the pockets of PARP10 and PARP15 (Glide score −8.20 and −8.22, respectively) compared to PARP2 (−6.64). In our model of the complex with PARP2, the nitrile of 10 comes in close contact with the side chain of Ser328. To minimize the steric clash during molecular dynamics (MD) simulations, the hydrogen of the hydroxyl group of Ser328 rotates away from the nitrile, thus leaving the oxygen pointing towards the nitrogen atom of the ligand (Figure 5A). Unlike for PARP2, in PARP15 and PARP10 the nitrile is exposed to the solvent, while the 3‐carbamoylphenoxy group inside the pocket interacts with the Tyr/Gly amino acids, consistent with the experimental structures obtained with 1 (Figure 5B).
Figure 5.
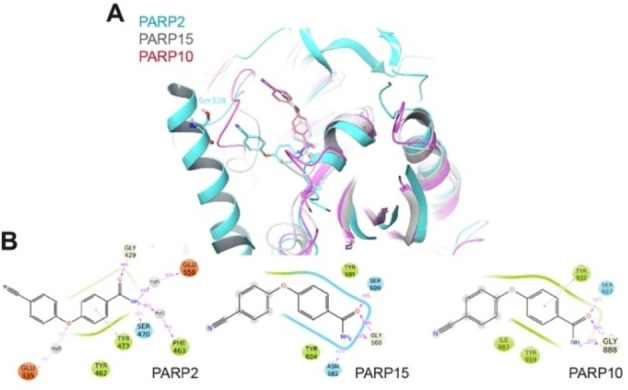
Modeling of the interaction of compound 10 with mono‐ADP‐ribosyltransferases. A) Structural comparison of the modeled 10‐PARP2, 10‐PARP15 and 10‐PARP10 complexes as derived from the MD simulations. The models for PARP2, 10 and 15 are in blue, pink and grey cartoon representations, respectively. 10 is in stick representation with the same color code as used for the proteins. Non‐polar hydrogens are not displayed. Notice that in PARP2, Ser328 exposes the hydroxyl group toward the nitril group of the ligand. B) 2D interaction schemes of the modeled complexes. The percentage of occurrence of the main interactions during the overall MD trajectories is also indicated. Green, red and cyan spheres indicate hydrophobic, negatively charged and polar residues, respectively. While grey and white spheres are for Glycine and water, respectively. Green lines indicate pi‐stacking interactions, while pink arrows indicate the presence of hydrogen bonds.
Compound 20 is similarly potent as PARP10 inhibitor as compound 1 (Table 2). 20 shows selectivity towards PARP10, but we also observed that it inhibited both PARP2 and PARP15 with a potency of 1.7 μm and less potent also PARP4, TNKS1 and TNKS2. Thus, compound 20 is less specific than 1 and 10. As the two benzamide motifs in 20 are linked by oxygen in a para‐meta positions, we decided to solve a crystal structure to determine which carbamoyl is binding in the nicotinamide pocket and thus clarify how the compound interacts with the target protein (Figure 6A). The crystal structure of PARP15 with compound 20, which was refined to 1.95 Å resolution (Table S1 in the Supporting Information), demonstrates interaction of the carbamoyl in meta position in the nicotinamide binding pocket. In this configuration, H‐bonds are established with Gly560 and Ser599 (Figure 6A). The compound extends towards the acceptor loop and the para‐substituted benzamide forms an H‐bond with Ser585. The para‐benzamide moiety is located near Tyr598 with no apparent pi‐stacking interaction. Nevertheless, this might explain further its activity towards PARP15. The binding mode causes also reduced selectivity in comparison with 1. In the latter case, the substituent is fixed to para‐position causing clashing with an active site glutamate of PARP1‐4 and TNKS1 and TNKS2, e. g. Glu558 in PARP2 (Figure 6B). Despite the different binding mode 20 extends to the same region in the acceptor site as 1.
Figure 6.
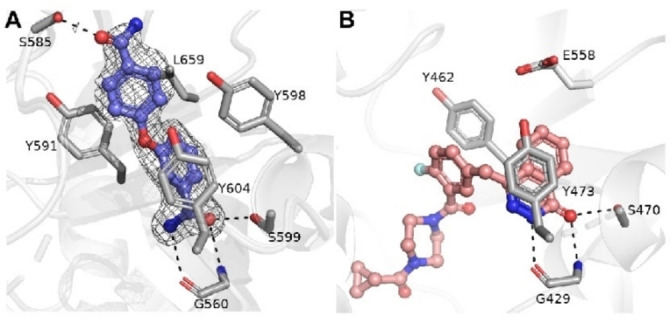
Structural comparison of PARP15 – compound 20 and PARP2 – Olaparib complexes. A) Crystal structure of PARP15 in complex with compound 20. Sigma A weighted omit Fo−Fc electron density map is colored in light grey and contoured at 2.5 σ. Amino acid residues and compound 20 are colored in purple and magenta, respectively. Hydrogen bonds between 20 and residues are indicated by black dash lines. B) The crystal structure of PARP2 in complex with Olaparib (PDB accession code 4TVJ). The residues and compound are colored in white and magenta, respectively.
The profiling of 20 showed that it inhibits PARP2 but not PARP1 or PARP3 (Table 2). This was unexpected as PARPi typically do not discriminate between PARP1 and PARP2, which is also true for clinically relevant inhibitors.[28] This >100‐fold selectivity could be used for the development of specific PARP2 inhibitors and therefore we attempted to solve also a crystal structure of an PARP2‐20 complex. However, we observed only partial density of 20 in the active site. It appeared that part of the compound was mobile and did not reveal electron density. The structure was therefore not refined and deposited, as the information gained would be limited.
We have also modeled compound 20 in PARP2, 10, 14, and 15 (Figure 7). The modeling of 20 in PARP15 was done to establish the accuracy of the modeling procedure. We were able to reproduce the binding pose observed in the crystal (Figure 7A). This includes the Gly560 hydrogen bond interaction to the meta‐benzamide and a potential additional interaction to Asn582 (Figure 7B). During MD the benzamide moiety exposed toward the solvent slightly adjusted its position in the binding pocket to optimize hydrophobic contacts (Figure 7A). In PARP10 and 14 the simulated poses of 20 were closely related to the pose the ligands assumed in PARP15 when the meta‐benzamide moiety was compared, which is positioned deep in the binding pocket (Figure 7C−E). A larger variability was observed for the orientations of the solvent‐exposed para‐benzamide moiety of the molecule (Figure 7C). In PARP2, 20 assumed a more restricted geometry due to the smaller solvent exposure with respect to the other PARP proteins considered (Figure 7F). This is due to the helical regulatory domain, which is present in PARP2 but not in the MARylating ARTDs. The regulatory domain limits the ensemble of possible conformations that the molecule can assume within PARP2 (Figure 7F). In addition to the Tyr/Gly conserved interactions involving one side of the molecule, a further stabilization comes from electrostatic contacts between the other side and Ser328 (Figure 7G). Different from the case of compound 10, the carbamoyl substituent can reach a suitable distance from the side chain of Ser328 to establish a conserved H‐bond interaction. Of note is that all the considerations based on our modeling procedures have a reliability proportional to the binding affinity of the ligands toward the selected target.
Figure 7.
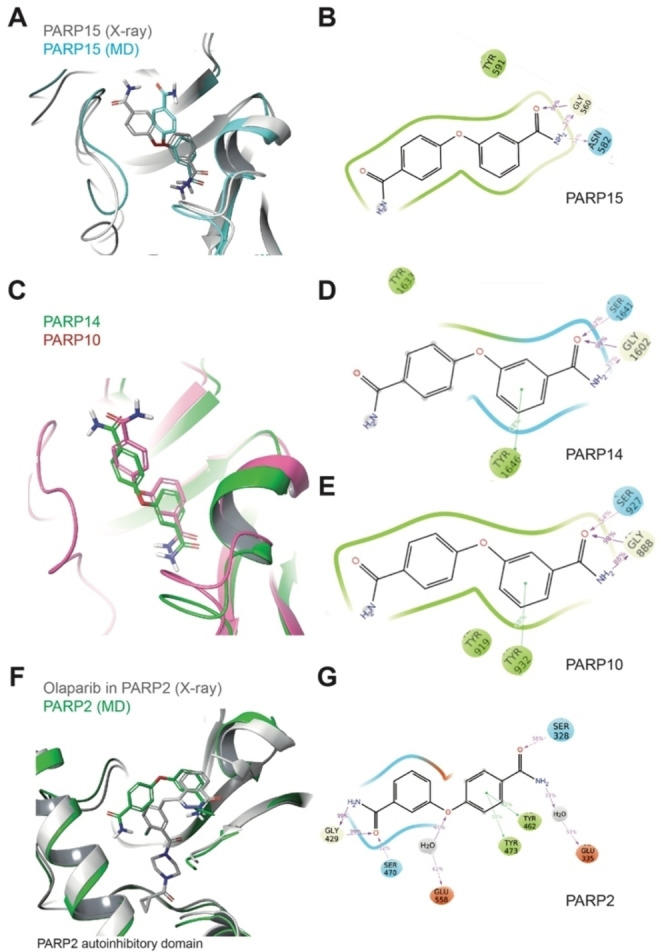
Comparative structural analysis of compound 20 in different ARTDs using MD simulations. A) Structural comparison of the modeled 20‐PARP15 (representative structure from MD simulation) with the 20‐PARP15 crystal structure. B) 2D interaction schemes of the modeled 20‐PARP15 complex (from panel A). C) Structural comparison of the modeled 20‐PARP10 and 14 complexes (representative structures from MD simulation). D) 2D interaction scheme of the modeled 20‐PARP14 complex (from panel C). E) 2D interaction scheme of the modeled 20‐PARP10 complex (from panel C). F) Structural comparison of the modeled 20‐PARP2 (representative structure from MD simulation) and the Olaparib‐PARP2 crystal complexes. G) 2D interaction schemes of the modeled 20‐PARP2 complex (from panel E). For panels B, D and F: The percentage of occurrence of the main interactions during the overall MD trajectories is indicated. Green, red and cyan spheres indicate hydrophobic, negatively charged and polar residues, respectively. While grey and white spheres are for Gly and water, respectively. Green lines indicate pi‐stacking interactions, while pink arrows indicate the presence of hydrogen bonds.
3. Conclusion
Recent studies addressing the functional relevance of PARP10/ARTD10 suggest strongly that this protein is involved in many different processes. These include links to DNA repair,[13, 17, 18] to cardiac hypertrophy,[21] signaling and innate immunity,[8a, 29] and the amplification of the locus in tumors (Figure 1). Thus, the development of selective inhibitors of PARP10 is of increasing interest. In the current study we expanded on previous efforts to define such inhibitors. Based on OUL35 (1),[24a] we developed additional compounds (Table 1). The best ones were similar in potency to 1 when analyzed in in vitro and in cell‐based assays (Figures 3, S1 and S2 in the Supporting Information). These compounds, 4‐(4‐cyanophenoxy)benzamide (10) and 3‐(4‐carbamoylphenoxy)benzamide (20), were analyzed for selectivity against a panel of different human ARTDs (Table 2) and their interaction with different ARTDs using a crystal structure and MD modeling (Figures 4–7). Unexpectedly, 20 and to a lesser extent 10 were able to inhibit PARP2 but not PARP1. This is notable because previously characterized inhibitors typically interfere with both PARP1 and PARP2.[28a] This is the case for clinically used inhibitors, which are synthetically lethal with homologous recombination DNA repair defects.[4b, 30] Thus, our new compounds and their analyses regarding selectivity and molecular interaction, together with the increasing knowledge about PARPi documented in the literature, will help to develop these compounds further. This will be necessary to obtain compounds that are specific for individual ARTDs, beyond PARP1 and 10 and TNKS1 and TNKS2, which have been associated with diseases.[31] The studies in progress on additional ARTDs will likely identify disease relevant interactions that might benefit from specific inhibitors.
Experimental Section
Cell Lines and Cell Culture
HeLa Flp‐In T‐REx‐PARP10 and ‐PARP10‐G888W cells were cultivated in DMEM supplemented with 10 % heat‐inactivated fetal calf serum (FCS) at 37 °C in 5 % CO2.[24b] Colony formation assays were performed as described.[24a] In short, 300 HeLa cells, expressing either PARP10 or PARP10‐G888W, were seeded in 6‐well culture plates. Protein expression was induced by adding 500 ng/mL doxycycline and the medium was also supplemented with the compounds as indicated in the text and figure legends. The cells were stained after 8–10 days using methylene blue and the colony proliferation assessed using ImageJ. IC50 curves were fitted using [Inhibitor] vs. response ‐ Variable slope (four parameters) analysis in GraphPad Prism version 8 (GraphPad Software).
Cloning, Protein Expression and Purification
GST‐PARP10cat was expressed in Escherichia coli BL‐21 and purified using glutathione‐sepharose beads in pull‐down buffer (100 mm Tris, pH 7.6, 250 mm NaCl, 50 mm KCl, 5 mm MgCl2, 0.5 % NP‐40, 0.1 % Triton X‐100) at 4 °C. After washing, the beads were equilibrated in reaction buffer (50 mm Tris pH 8.0; 0.2 mm TCEP; 4 mm MgCl2; 0.2 % NP‐40) and ADP‐ribosylation was carried out in 30 μl of this buffer with 50 μm β‐NAD+ and 1 μCi 32P‐NAD+ at 30 °C for 30 min in the presence or absence of the indicated inhibitors. Reactions were stopped in SDS‐sample buffer and the proteins analyzed by SDS‐PAGE. The gels were stained with Coomassie blue and the incorporated 32P‐label was visualized using X‐ray films. For measuring full‐length protein, HA‐PARP10 was expressed transiently in HEK293 cells. The cells were harvested in TAP lysis buffer (50 mm Tris, pH 7.5; 150 mm NaCl; 1 mm EDTA; 10 % glycerol; 1 % NP‐40; 1 mm DTT; PIC). HA‐PARP10 was immunoprecipitated with anti‐HA (Covance) antibodies and protein G beads at 4 °C for 1 h. The beads were washed in TAP lysis buffer and in reaction buffer prior to ADP‐ribosylation assays.
For additional proteins used in the study, expression clones were generated with pNIC28‐Bsa4 containing an N‐terminal His tag (PARP1‐4, 12, 14–16, TNKS1 and TNKS2) or pNIC‐CH (PARP10) with a C‐terminal His tag and expressed and purified as described earlier.[24a] Briefly, the proteins were expressed in E. coli Rosetta2 (DE3) cells. Cells were grown in autoinduction TB medium supplemented with trace elements (Formedium) and further supplemented with 8 g/L glycerol. Kanamycin (50 μg/mL) and chloramphenicol (34 μg/mL) were used as selection markers. The cells were grown at 37 °C with shaking until the OD600 reached approximately 1.0. After that, the temperature was reduced to 18 °C for expression overnight (14–16 h). The cells were harvested by centrifugation at 4 °C. The cell pellets were resuspended in lysis buffer (100 mm HEPES pH 7.5, 500 mm NaCl, 10 % glycerol, 10 mm imidazole, 0.5 mm tris[(2‐carboxyethyl)phosphine] at 1.5 mL per 1 g of pellet and stored at −20 °C.
The cell pellets were thawed and supplemented with 20 mg/mL DNase (Roche), 0.1 mm Pefabloc (Sigma‐Aldrich), and 0.25 mg lysozyme (Fluka Analytical) and incubated on ice for 5 min before sonication (Branson 450D sonifier) with 50 % amplitude for 2 min with 5‐s on/5‐s off pulse using a ‐inch horn. After sonication, the cell lysates were clarified by centrifugation at 35,000 x g and 4 °C for 20 min. The supernatant was filtered through a 0.45‐μm filter syringe. Proteins were purified using Ni‐affinity chromatography and size‐exclusion chromatography. In some cases, the 6 x His tag was cleaved from the fusion proteins (PARP12 and 16) with a TEV protease and subsequently run through the Ni‐affinity column.
Activity Assay
Dose response experiments were carried out by converting unused NAD+ to a fluorescent compound as we have previously reported.[23, 24, 25] Half‐log dilutions of inhibitors were used and reactions were performed in quadruplicates. IC50 curves were fitted using sigmoidal dose response curve (four variables) in GraphPad Prism version 5.04 (GraphPad Software).
Crystallization
PARP15 was co‐crystallized with compound 20 utilizing the existing crystallization conditions for PARP15.[32] 1.5 μL of 10 mm compound 20 (in 100 % DMSO) was mixed with 20 μL of 10.6 mg/mL PARP15 and incubated for 1 min at 20 °C for crystallization. 80 nL of the protein‐ligand solution was mixed with 120 nL of well solution consisting of 0.2 m NH4Cl pH 7.5, 18 % (w/v) PEG 3350. Crystals were grown in sitting drops using vapour‐diffusion at 20 °C and were obtained in 24 hours. Atomic coordinates and structure factors have been deposited to the Protein Data Bank under accession number 6RY4 and raw diffraction images are available at IDA https://doi.org/10.23729/f17e760a‐296f‐4cf6‐a52a‐f1fa85109f1c.
Data Collection, Processing and Refinement
PARP15 crystals were cryo‐protected with 0.2 m NH4Cl pH 7.5 in 30 % (v/v) MPD (2‐methyl‐2,4‐pentanediol). X‐ray diffraction dataset from a single crystal was collected on beamline I04 at Diamond Light Source (Oxfordshire, UK). The data were processed and scaled with XDS.[33] Phases for the structure of PARP15 in complex with 11 were obtained by molecular replacement with Phaser[34] using previously determined PARP15 structure as a search model (PDB accession code 3BLJ). The model was refined with REFMAC5 from CCP4i2 package.[35] For PARP2 in complex to compound 11, phases were obtained using Phaser and 4TVJ was used as search model). Manual model building and local real space refinement were performed using Coot.[36] Data and refinement parameters are shown in Table S1 in the Supporting Information.
Docking
The molecules are docked in the different protein structures using the Induced‐Fit docking (IFD) algorithm from Glide.[37] The docking grid is centered around the co‐crystallized ligands in the X‐ray structures. The conformational sampling of the ligands is performed within an energy window of 2.5 kcal/mol. In the first stage of the IFD algorithm, softened‐potential docking generates 20 poses. The scaling factors to soften the potentials of the receptors and ligands are set to 0.7 and 0.5, respectively. For each of the top 20 poses ranked by GlideScore[38] during the initial softened‐potential docking step, all residues within 5.0 Å of ligand poses are minimized with the Prime MD.[39] After minimization, the complexes are ranked by Prime energy. The complexes within 7 kcal/mol of the minimum energy structure undergo a final round of Glide docking and scoring, when each ligand is redocked in the minimized binding pocket and rescored using the Xp glide scoring function.[38b] All the poses generated are visually inspected and the best pose is chosen as starting geometry for the MD simulation.
MD Simulations
Each protein‐ligand complex is included within a water box of variable dimensions to ensure a buffer distance of 10 Å between the protein and the wall of the box. The water molecules are represented by the TIP3P force field.[40] Na+ or Cl− ions are added to neutralize the system. NaCl is added to reach an ionic strength of 0.15 M. The systems are relaxed following the default protocol in Desmond.[41] The production run is performed in the NPT ensemble, setting the temperature to 300 K and the pressure to 1 atm. The simulation is carried out using the Nose‐Hoover chain thermostat[42] with a relaxation time of 1 ps and the Martyna‐Tobias‐Klein barostat[43] with a relaxation time of 2 ps. The bonds involving hydrogen atoms are constrained. The integration timestep is set to 2 fs. The simulation time for all the systems is set to 120 ns, which appears in general suitable to achieve convergence of the protein structure and of the ligand orientation (in terms of RMSD with respect to the starting geometry). At the end of the MD simulation, the trajectory is clustered using the geometry of the ligand to build the RMSD matrix. The centroid of each of the five most populated clusters is used to score the ligand poses.
Scoring
For each cluster representative, a docking grid is built around the ligand's position. The ligand‐protein interactions are then scored using the Glide Xp scoring function. In this step, the ligands are treated as rigid bodies and the search algorithm of the docking procedure is shut down, in order to preserve the geometry of the complex as extracted from the MD simulations. Importantly, we notice also that the binding pockets of these proteins are consistently exposed to the solvent. In order to avoid biases coming from the instantaneous configuration of the solvent around the ligand, we decided to remove the solvent in the scoring stage. In this way, the scoring reflects only the protein‐ligand interactions and reveals different degrees of solvent exposure of the ligands.
4. Author Contributions
PK, GR, LL, CB, and BL designed the research concept, analyzed data and prepared the manuscript. PK, BEL, and CV performed catalytic and cell‐based assays. AC synthesized compounds. SM and MMM generated the crystal structure. RG performed the modelling and the MD simulations. AGP, SM, and STS evaluated the compounds on different ARTDs. All authors reviewed and approved the final version of the manuscript.
Conflict of interest
The authors declare no conflict of interest.
Supporting information
As a service to our authors and readers, this journal provides supporting information supplied by the authors. Such materials are peer reviewed and may be re‐organized for online delivery, but are not copy‐edited or typeset. Technical support issues arising from supporting information (other than missing files) should be addressed to the authors.
Supporting Information
Acknowledgements
We thank D. Meister for initial MD simulations, the profile area Molecular Science and Engineering of the RWTH Aachen University for continuous support. The use of the facilities and expertise of the Biocenter Oulu Structural Biology core facility, a member of Biocenter Finland, Instruct‐ERIC Centre Finland and FINStruct is gratefully acknowledged. We thank the staff members of Diamond Light Source beamline I04.
The work was supported by the Deutsche Forschungsgemeinschaft to BL (Lu 466/16‐1 and 466/16‐2), by the RWTH Aachen University program on Multiscale Biology to PK, GR, CB, and BL ( MSCALE013), by the Academy of Finland (grant no. 287063 and 294085) and by Sigrid Jusélius and Jane and Aatos Erkko foundations to LL.
P. Korn, A. Classen, S. Murthy, R. Guareschi, M. M. Maksimainen, B. E. Lippok, A. Galera-Prat, S. T. Sowa, C. Voigt, G. Rossetti, L. Lehtiö, C. Bolm, B. Lüscher, ChemistryOpen 2021, 10, 939.
References
- 1.
- 1a.Lüscher B., Butepage M., Eckei L., Krieg S., Verheugd P., Shilton B. H., Chem. Rev. 2018, 118, 1092–1136; [DOI] [PubMed] [Google Scholar]
- 1b.Hottiger M. O., Hassa P. O., Lüscher B., Schüler H., Koch-Nolte F., Trends Biochem. Sci. 2010, 35, 208–219; [DOI] [PubMed] [Google Scholar]
- 1c.Munnur D., Bartlett E., Mikolcevic P., Kirby I. T., Rack J. G. Matthias, Mikoc A., Cohen M. S., Ahel I., Nucleic Acids Res. 2019, 47, 5658–5669; [DOI] [PMC free article] [PubMed] [Google Scholar]
- 1d.Dolle C., Ziegler M., FEBS J. 2017, 284, 3999–4001. [DOI] [PubMed] [Google Scholar]
- 2.Kleine H., Poreba E., Lesniewicz K., Hassa P. O., Hottiger M. O., Litchfield D. W., Shilton B. H., Lüscher B., Mol. Cell 2008, 32, 57–69. [DOI] [PubMed] [Google Scholar]
- 3.
- 3a.Bütepage M., Eckei L., Verheugd P., Lüscher B., Cells 2015, 4, 569–595; [DOI] [PMC free article] [PubMed] [Google Scholar]
- 3b.Crawford K., Bonfiglio J. J., Mikoc A., Matic I., Ahel I., Crit. Rev. Biochem. Mol. Biol. 2018, 53, 64–82. [DOI] [PubMed] [Google Scholar]
- 4.
- 4a.Hanzlikova H., Caldecott K. W., Trends Genet. 2019, 35, 412–422; [DOI] [PubMed] [Google Scholar]
- 4b.Curtin N., Biochem. Soc. Trans. 2014, 42, 82–88. [DOI] [PubMed] [Google Scholar]
- 5.Ashworth A., Lord C. J., Nat. Rev. Clin. Oncol. 2018, 15, 564–576. [DOI] [PubMed] [Google Scholar]
- 6.Yu M., Schreek S., Cerni C., Schamberger C., Lesniewicz K., Poreba E., Vervoorts J., Walsemann G., Grötzinger J., Kremmer E., Mehraein Y., Mertsching J., Kraft R., Austen M., Lüscher-Firzlaff J., Lüscher B., Oncogene 2005, 24, 1982–1993. [DOI] [PubMed] [Google Scholar]
- 7.
- 7a.Morgan R. K., Cohen M. S., ACS Chem. Biol. 2015, 10, 1778–1784; [DOI] [PMC free article] [PubMed] [Google Scholar]
- 7b.Eckei L., Krieg S., Bütepage M., Lehmann A., Gross A., Lippok B., Grimm A. R., Kummerer B. M., Rossetti G., Lüscher B., Verheugd P., Sci. Rep. 2017, 7, 41746. [DOI] [PMC free article] [PubMed] [Google Scholar]
- 8.
- 8a.Verheugd P., Forst A. H., Milke L., Herzog N., Feijs K. L., Kremmer E., Kleine H., Lüscher B., Nat. Commun. 2013, 4, 1683; [DOI] [PubMed] [Google Scholar]
- 8b.Kaufmann M., Feijs K. L., Lüscher B., Curr. Top. Microbiol. Immunol. 2015, 384, 167–188. [DOI] [PubMed] [Google Scholar]
- 9.Feijs K. L., Kleine H., Braczynski A., Forst A. H., Herzog N., Verheugd P., Linzen U., Kremmer E., Lüscher B., Cell Commun. Signaling 2013, 11, 5. [DOI] [PMC free article] [PubMed] [Google Scholar]
- 10.Feijs K. L., Forst A. H., Verheugd P., Lüscher B., Nat. Rev. Mol. Cell Biol. 2013, 14, 443–451. [DOI] [PMC free article] [PubMed] [Google Scholar]
- 11.Rosenthal F., Feijs K. L., Frugier E., Bonalli M., Forst A. H., Imhof R., Winkler H. C., Fischer D., Caflisch A., Hassa P. O., Lüscher B., Hottiger M. O., Nat. Struct. Mol. Biol. 2013, 20, 502–507. [DOI] [PubMed] [Google Scholar]
- 12.Kleine H., Herrmann A., Lamark T., Forst A. H., Verheugd P., Lüscher-Firzlaff J., Lippok B., Feijs K. L., Herzog N., Kremmer E., Johansen T., Müller-Newen G., Lüscher B., Cell Commun. Signaling 2012, 10, 28. [DOI] [PMC free article] [PubMed] [Google Scholar]
- 13.Nicolae C. M., Aho E. R., Vlahos A. H., Choe K. N., De S., Karras G. I., Moldovan G. L., J. Biol. Chem. 2014. [DOI] [PMC free article] [PubMed] [Google Scholar]
- 14.Slade D., Genes (Basel) 2018, 9. [DOI] [PMC free article] [PubMed] [Google Scholar]
- 15.Baple E. L., Chambers H., Cross H. E., Fawcett H., Nakazawa Y., Chioza B. A., Harlalka G. V., Mansour S., Sreekantan-Nair A., Patton M. A., Muggenthaler M., Rich P., Wagner K., Coblentz R., Stein C. K., Last J. I., Taylor A. M., Jackson A. P., Ogi T., Lehmann A. R., Green C. M., Crosby A. H., J. Clin. Invest. 2014, 124, 3137–3146. [DOI] [PMC free article] [PubMed] [Google Scholar]
- 16.Jeppesen D. K., Bohr V. A., Stevnsner T., Prog. Neurobiol. 2011, 94, 166–200. [DOI] [PMC free article] [PubMed] [Google Scholar]
- 17.Shahrour M. A., Nicolae C. M., Edvardson S., Ashhab M., Galvan A. M., Constantin D., Abu-Libdeh B., Moldovan G. L., Elpeleg O., Neurogenetics 2016, 17, 227–232. [DOI] [PMC free article] [PubMed] [Google Scholar]
- 18.Schleicher E. M., Galvan A. M., Imamura-Kawasawa Y., Moldovan G. L., Nicolae C. M., Nucleic Acids Res. 2018, 46, 8908–8916. [DOI] [PMC free article] [PubMed] [Google Scholar]
- 19.
- 19a.Cerami E., Gao J., Dogrusoz U., Gross B. E., Sumer S. O., Aksoy B. A., Jacobsen A., Byrne C. J., Heuer M. L., Larsson E., Antipin Y., Reva B., Goldberg A. P., Sander C., Schultz N., Cancer Dis. 2012, 2, 401–404; [DOI] [PMC free article] [PubMed] [Google Scholar]
- 19b.Gao J., Aksoy B. A., Dogrusoz U., Dresdner G., Gross B., Sumer S. O., Sun Y., Jacobsen A., Sinha R., Larsson E., Cerami E., Sander C., Schultz N., Sci. Signaling 2013, 6, pl1. [DOI] [PMC free article] [PubMed] [Google Scholar]
- 20.Tang Z., Li C., Kang B., Gao G., Li C., Zhang Z., Nucleic Acids Res. 2017, 45, W98-W102. [DOI] [PMC free article] [PubMed] [Google Scholar]
- 21.Gao X. Q., Zhang Y. H., Liu F., Ponnusamy M., Zhao X. M., Zhou L. Y., Zhai M., Liu C. Y., Li X. M., Wang M., Shan C., Shan P. P., Wang Y., Dong Y. H., Qian L. L., Yu T., Ju J., Wang T., Wang K., Chen X. Z., Wang Y. H., Zhang J., Li P. F., Wang K., Nat. Cell Biol. 2020. [DOI] [PubMed] [Google Scholar]
- 22.Crabtree G. R., Cell 1999, 96, 611–614. [DOI] [PubMed] [Google Scholar]
- 23.Venkannagari H., Fallarero A., Feijs K. L., Lüscher B., Lehtiö L., Eur. J. Pharm. Sci. 2013, 49, 148–156. [DOI] [PubMed] [Google Scholar]
- 24.
- 24a.Venkannagari H., Verheugd P., Koivunen J., Haikarainen T., Obaji E., Ashok Y., Narwal M., Pihlajaniemi T., Lüscher B., Lehtiö L., Cell Chem. Biol. 2016, 23, 1251–1260; [DOI] [PubMed] [Google Scholar]
- 24b.Herzog N., Hartkamp J. D., Verheugd P., Treude F., Forst A. H., Feijs K. L., Lippok B. E., Kremmer E., Kleine H., Lüscher B., FEBS J. 2013, 280, 1330–1343. [DOI] [PubMed] [Google Scholar]
- 25.Murthy S., Desantis J., Verheugd P., Maksimainen M. M., Venkannagari H., Massari S., Ashok Y., Obaji E., Nkizinkinko Y., Lüscher B., Tabarrini O., Lehtiö L., Eur. J. Med. Chem. 2018, 156, 93–102. [DOI] [PubMed] [Google Scholar]
- 26.
- 26a.Ekblad T., Lindgren A. E., Andersson C. D., Caraballo R., Thorsell A. G., Karlberg T., Spjut S., Linusson A., Schüler H., Elofsson M., Eur. J. Med. Chem. 2015, 95, 546–551; [DOI] [PubMed] [Google Scholar]
- 26b.Holechek J., Lease R., Thorsell A. G., Karlberg T., McCadden C., Grant R., Keen A., Callahan E., Schüler H., Ferraris D., Bioorg. Med. Chem. Lett. 2018, 28, 2050–2054; [DOI] [PubMed] [Google Scholar]
- 26c.Suto M. J., Turner W. R., Arundel-Suto C. M., Werbel L. M., Sebolt-Leopold J. S., Anti-Cancer Drug Des. 1991, 6, 107–117; [PubMed] [Google Scholar]
- 26d.Ferraris D. V., J. Med. Chem. 2010, 53, 4561–4584; [DOI] [PubMed] [Google Scholar]
- 26e.Morgan R. K., Kirby I. T., Vermehren-Schmaedick A., Rodriguez K., Cohen M. S., ACS Med. Chem. Lett. 2019, 10, 74–79. [DOI] [PMC free article] [PubMed] [Google Scholar]
- 27.
- 27a.Upton K., Meyers M., Thorsell A. G., Karlberg T., Holechek J., Lease R., Schey G., Wolf E., Lucente A., Schüler H., Ferraris D., Bioorg. Med. Chem. Lett. 2017, 27, 2907–2911; [DOI] [PubMed] [Google Scholar]
- 27b.Kirby I. T., Kojic A., Arnold M. R., Thorsell A. G., Karlberg T., Vermehren-Schmaedick A., Sreenivasan R., Schultz C., Schüler H., Cohen M. S., Cell Chem. Biol. 2018, 25, 1547–1553 e1512; [DOI] [PubMed] [Google Scholar]
- 27c.Yuen L. H., Dana S., Liu Y., Bloom S. I., Thorsell A. G., Neri D., Donato A. J., Kireev D., Schüler H., Franzini R. M., J. Am. Chem. Soc. 2019, 141, 5169–5181. [DOI] [PubMed] [Google Scholar]
- 28.
- 28a.Wahlberg E., Karlberg T., Kouznetsova E., Markova N., Macchiarulo A., Thorsell A. G., Pol E., Frostell A., Ekblad T., Oncu D., Kull B., Robertson G. M., Pellicciari R., Schüler H., Weigelt J., Nat. Biotechnol. 2012, 30, 283–288; [DOI] [PubMed] [Google Scholar]
- 28b.Min A., Im S. A., Cancers (Basel). 2020, 12. [DOI] [PMC free article] [PubMed] [Google Scholar]
- 29.Krieg S., Pott F., Eckei L., Verheirstraeten M., Bütepage M., Lippok B., Goffinet C., Lüscher B., Verheugd P., bioRxiv 2020, 2020.2001.2007.896977. [Google Scholar]
- 30.Lord C. J., Ashworth A., Science 2017, 355, 1152–1158. [DOI] [PMC free article] [PubMed] [Google Scholar]
- 31.
- 31a.Vyas S., Chang P., Nat. Rev. Cancer 2014, 14, 502–509; [DOI] [PMC free article] [PubMed] [Google Scholar]
- 31b.Lehtiö L., Chi N. W., Krauss S., FEBS J. 2013, 280, 3576–3593. [DOI] [PubMed] [Google Scholar]
- 32.Karlberg T., Klepsch M., Thorsell A. G., Andersson C. D., Linusson A., Schüler H., J. Biol. Chem. 2015, 290, 7336–7344. [DOI] [PMC free article] [PubMed] [Google Scholar]
- 33.Kabsch W., Acta Crystallogr. Sect. D 2010, 66 (Pt 2), 133–144. [DOI] [PMC free article] [PubMed] [Google Scholar]
- 34.McCoy A. J., Grosse-Kunstleve R. W., Adams P. D., Winn M. D., Storoni L. C., Read R. J., J. Appl. Crystallogr. 2007, 40, 658–674. [DOI] [PMC free article] [PubMed] [Google Scholar]
- 35.Potterton L., Agirre J., Ballard C., Cowtan K., Dodson E., Evans P. R., Jenkins H. T., Keegan R., Krissinel E., Stevenson K., Lebedev A., McNicholas S. J., Nicholls R. A., Noble M., Pannu N. S., Roth C., Sheldrick G., Skubak P., Turkenburg J., Uski V., von Delft F., Waterman D., Wilson K., Winn M., Wojdyr M., Acta Crystallogr. Sect. D 2018, 74, 68–84. [DOI] [PMC free article] [PubMed] [Google Scholar]
- 36.Emsley P., Cowtan K., Acta Crystallogr. Sect. D 2004, 60, 2126–2132. [DOI] [PubMed] [Google Scholar]
- 37.Sherman W., Day T., Jacobson M. P., Friesner R. A., Farid R., J. Med. Chem. 2006, 49, 534–553. [DOI] [PubMed] [Google Scholar]
- 38.
- 38a.Friesner R. A., Banks J. L., Murphy R. B., Halgren T. A., Klicic J. J., Mainz D. T., Repasky M. P., Knoll E. H., Shelley M., Perry J. K., Shaw D. E., Francis P., Shenkin P. S., J. Med. Chem. 2004, 47, 1739–1749; [DOI] [PubMed] [Google Scholar]
- 38b.Friesner R. A., Murphy R. B., Repasky M. P., Frye L. L., Greenwood J. R., Halgren T. A., Sanschagrin P. C., Mainz D. T., J. Med. Chem. 2006, 49, 6177–6196. [DOI] [PubMed] [Google Scholar]
- 39.Jacobson M. P., Pincus D. L., Rapp C. S., Day T. J., Honig B., Shaw D. E., Friesner R. A., Proteins 2004, 55, 351–367. [DOI] [PubMed] [Google Scholar]
- 40.Jorgensen W. L., Chandrasekhar J., Madura J. D., Impey R. W., Klein M. L., J. Chem. Phys. 1983, 79, 926–935. [Google Scholar]
- 41.K. J. Bowers, E. Chow, H. Xu, R. O. Dror, M. P. Eastwood, B. A. Gregersen, J. L. Klepeis, I. Kolossvary, M. A. Moraes, F. D. Sacerdoti, J. K. Salamon, Y. Shan, D. E. Shaw, Proc. 2006 ACM/IEEE Conf. Supercomput. – SC'06 2006, 26.
- 42.Hünenberg P. H., Adv. Polym. Sci. 2005, 173, 105–149. [Google Scholar]
- 43.Martyna G. J., Tobias D. J., Klein M. L., J. Chem. Phys. 1994, 101, 4177–4189. [Google Scholar]
Associated Data
This section collects any data citations, data availability statements, or supplementary materials included in this article.
Supplementary Materials
As a service to our authors and readers, this journal provides supporting information supplied by the authors. Such materials are peer reviewed and may be re‐organized for online delivery, but are not copy‐edited or typeset. Technical support issues arising from supporting information (other than missing files) should be addressed to the authors.
Supporting Information


