

Abstract
Motivation
The growth and survival of myeloma cells are greatly affected by their surrounding microenvironment. To understand the molecular mechanism and the impact of stiffness on the fate of myeloma-initiating cells (MICs), we develop a systems biological model to reveal the dynamic regulations by integrating reverse-phase protein array data and the stiffness-associated pathway.
Results
We not only develop a stiffness-associated signaling pathway to describe the dynamic regulations of the MICs, but also clearly identify three critical proteins governing the MIC proliferation and death, including FAK, mTORC1 and NFκB, which are validated to be related with multiple myeloma by our immunohistochemistry experiment, computation and manually reviewed evidences. Moreover, we demonstrate that the systematic model performs better than widely used parameter estimation algorithms for the complicated signaling pathway.
Availability and implementation
We can not only use the systems biological model to infer the stiffness-associated genetic signaling pathway and locate the critical proteins, but also investigate the important pathways, proteins or genes for other type of the cancer. Thus, it holds universal scientific significance.
Supplementary information
Supplementary data are available at Bioinformatics online
1 Introduction
It is well known that multiple myeloma (MM) is the second most common hematologic malignancy in the USA (Peng et al., 2014). In particular, bone marrow stromal cells (BMSCs) in the surrounding microenvironment play a critical role in the growth of myeloma cells (Feng et al., 2010; Paszek et al., 2005; Teru et al., 2007; Tilghman and Parsons, 2008; Tilghman et al., 2010; Ulrich et al., 2009).
Previous studies have reported that the BMSCs collected from myeloma patients are stiffer than those from healthy donors (Feng et al., 2010), and the stiffness of myeloma BMSCs is further enhanced when they are cocultured with MM cells via changes in cellular architecture (Dan et al., 2015; Feng et al., 2010). Then, as the surface of both the MM cells and the BMSCs becomes harder, leading to more gel spreading, myeloma-initiating cells (MICs) receive more support for growth (Peng et al., 2014) and form a vicious cycle. For these reasons, it is crucial to reveal the dynamic regulations, disrupt this vicious loop and determine the critical proteins of the stiffness-associated signaling pathway for MM.
As developments in biological science continue to accumulate, signaling pathways and their models are becoming increasingly important and complicated. Various techniques based on global optimization have been proposed to estimate the parameters of pathway models (Chen et al., 2009; Sun et al., 2012). Simulated annealing (SA) (Chen et al., 2009; Jeon et al., 2002; Shockley et al., 2018) and genetic algorithm (GA) (Goldberg, 1989; Sun et al., 2012; Thomas et al., 2016) are most commonly used for parameter estimation of signaling pathway.
However, the convergence speed for SA-based algorithm is notoriously slow and its performance depends on the initial values of the parameters (Jeon et al., 2002). For example, although recently developed PyDREAM application (Shockley et al., 2018) can greatly alleviate this problem, it still depends on the prior distribution of parameters that make it hard to choose the appropriate distribution, especially for the high-dimensional parameter vectors. On the other hand, GA-based algorithm is subjected to produce a ‘premature’ solution (Goldberg, 1989), thus causing low estimation accuracy. For instance, GA-based BioNetFit application (Thomas et al., 2016) can significantly speed up parameter estimation process by high-performance computation, but it is not good at increasing the parameter estimation accuracy for high dimensional models.
Thus, the purpose of this study is to provide such a parameter estimation strategy for the large-scale signaling pathway that could be applied not only for this MM study but also for other similar biological problems. First, it infers a stiffness-associated signaling pathway with candidate proteins by comparing the proteins’ expression obtained from reverse-phase protein array (RPPA) technology (Sergio et al., 2010; Tibes et al., 2006) between the normal and myeloma stem cells. Then, we employ modularized factor graph (MFG), multistage parameter estimation and parameter analysis (Koh et al., 2006; Peng et al., 2014; Zhang et al., 2017a) to locate such key biomarkers from these candidate proteins that have significant impact on this signaling pathway and further demonstrate the robustness of the model.
Here, we propose the following three innovative schemes: first, this study designs a biological experiment to simulate surface pressure for normal and MM cells under an in vivo bone marrow environment at the start, followed by employing the RPPA technique to obtain a time-series protein expression data for both cells. Second, we use the highly differential proteins between the normal and MM cells to infer a stiffness-associated signaling pathway, which is described by a Markov chain (Nelander et al., 2008) and ordinary differential equations (ODEs) (Zhang et al., 2007). Third, we use our well-developed multistage parameter estimation algorithm for this large-scale stiffness-associated signaling pathway (Peng et al., 2014) to obtain the most potential proteins for MM cancer.
In summary, this study aims to reveal the dynamic regulations of MICs by developing a coherent mathematical model and biochemical experimental protocols, and then investigate the key roles of critical proteins that are related to many cellular responses, including apoptosis, cell cycle regulation, induction of expression of cytokine genes and cellular differentiation. Since we infer a stiffness-associated signaling pathway, it can help biologists disrupt the vicious loop involving MICs and BMSCs by computing the expression of crucial proteins which regulate the apoptosis or growth rate of cancer cells.
Our mathematical model explores three crucial proteins (FAK, mTORC1 and NFκB), which not only have been demonstrated to be key biomarkers for MM by our biological experiments and manually reviewed evidences (Olivier Decaux et al., 2010; Rena et al., 2004; Zhang et al., 2013), but also represent three important biological pathways in the development and progression of MM. Our immunohistochemistry experimental results indicate that high NFκB expression and constitutive activation are common events in MM (Saez‐Rodriguez et al., 2009; Tai et al., 2000). Additionally, manually reviewed evidences prove that FAK associates with integrins, which are important in the crosstalk between cells and extracellular matrix (Katz, 2010; Mclean et al., 2005; Sulzmaier et al., 2014; Tai et al., 2015) and mTORC1 is related to the PI3K-AKT pathway. Deregulation of the PI3K-AKT-mTOR pathway is widespread in cancer including MM (Soares, 2012). Moreover, these three pathways can interact with each other and the changes in one pathway can affect the activities of the other pathways. For example, NFκB can bind to the promoter of and regulate the expression of FAK (Sulzmaier et al., 2014). Therefore, the concerted activation of these three pathways in MM have profound effects on the outcome of this disease. Finally, we demonstrate that our multistage algorithm performs better than the widely used GA and particle swarming optimization (PSO) for the inferred large-scale signaling pathway.
2 Materials and methods
2.1 Experimental work
Supplementary Material S1 lists the ethics statement and experimental procedure including the essential experimental information for our computational method.
2.2 Computational method
In general, we explore the key proteins for the stiffness-associated signaling pathway by gradually narrowing down the scope as shown in Figure 1. Step 1 is to choose the candidate proteins by integrating the RPPA experimental results into the related pathway analysis. Then, step 2 is to estimate the parameters for these candidate proteins of the signaling pathway. Lastly, step 3 is to locate the key biomarkers from these candidate proteins.
Fig. 1.

The workflow of the systematic procedure. (A) Model development (left panel shows Markov chain detailed in Figure S4A of Supplementary Material S3). (B) Model training (right panel shows model testing results detailed in Figure S1 of Supplementary Material S6). (C) Model testing (left panel shows the sensitivity analysis result detailed in Figure S2 of Supplementary Material S7)
Step 1: Since previous research (Abe, 2011; De Raeve and Vanderkerken, 2002; Noonan and Borrello, 2011) report that a rigid environment can promote the proliferation of MMs, we employed 100 and 400 Pa pressures to simulate normal and tumor cells, respectively, as in a previous setup (Feng et al., 2010). First, we coarse-grained screen significantly expressed proteins from the experimental data carried out by the RPPA technique. Next, these potential candidate proteins become the input of the canonical pathway database, the Ingenuity Pathway Analysis (IPA) (Apostolos et al., 2014), to obtain the enriched signaling pathways. Finally, these enriched signaling pathways are merged as a generic signaling pathway with the help of the experimentalist.
Step 2: First, the genetic signaling pathway is described by ODEs. Second, a PSO method (Gao et al., 2017; Zhang et al., 2019b) is used to roughly estimate the key parameters of the ODEs. Third, three stages are employed to increase the accuracy of the key parameter estimation: (i) using a Markov chain to divide the genetic signaling pathway into submodules; (ii) decomposing the genetic signaling pathway into two subpathways by a MFG algorithm (Koh et al., 2006); (iii) estimating the key parameters with a belief propagation (BP) algorithm (Peng et al., 2014).
Step 3: The most crucial proteins for MM cancer are explored by parameter analysis after model development, training and testing.
3 Results
3.1 Step 1: model development
3.1.1 Using the coarse-grained method to screen protein
Since a rigid environment promotes the proliferation of myeloma cells (Anderson, 2007; Arshi et al., 2016; Yamashita, 2012), this research employs 100 Pa rigidities to simulate normal cells and 400 Pa rigidities to simulate myeloma stem cells. Then, we preprocessed RPPA data and chose significantly upregulated and downregulated proteins to construct the raw genetic signaling pathway. These procedures are detailed in Supplementary Material S2 and S3.
3.1.2 Constructing the generic signaling pathway
The top 10 upregulated proteins selected from the previous step are input for IPA (Apostolos et al., 2014) to obtain the candidate pathways. With the help of the experimentalists, these candidate pathways are combined to generate a raw genetic signaling pathway (Fig. S3 of Supplementary Material S3). Since Figure S3 of Supplementary Material S3 is too complicated to infer its key parameters, this study employs previously well-defined removing rules (Peng et al., 2014; Saez‐Rodriguez et al., 2009) to simplify it into a genetic signaling pathway (Fig. 2). The removing rule (Peng et al., 2014) that deletes unimportant proteins is as follows: if protein A can activate protein B and protein B can activate protein C, then protein B is removed to allow A to directly activate C.
Fig. 2.

The structure of the genetic BMSC’s stiffness-associated signaling pathway
3.2 Step 2: model training
Step 2 employs a multistage parameter estimation algorithm to train the key parameters of the model with three major stages: initialization, MFG and refinement stages. Since we employ a Markov chain and MFG to reduce the large-scale signaling pathway, we denote this multistage parameter estimation algorithm as Markov chain modularized factor graph (MCMFG).
3.2.1 Initialization
ODEs are employed to describe the structural genetic signaling pathway as in previous studies (Zhang and Zhang, 2017; Zhang et al., 2007, 2016). However, the size of the genetic signaling pathway (Fig. 2) is too large to accurately optimize its key parameters by classical optimization methods (Chen et al., 2009; Gao et al., 2017; Zhang et al., 2017b, 2019b). Thus, we employ a Markov chain (Fig. S4A of Supplementary Material S3) to divide the genetic signaling pathway into 19 submodules (Fig. S4B of Supplementary Material S3) by the previously used rules (Peng et al., 2014): (i) each module has at least one phosphorylated protein; and (ii) each module has at least one phosphorylated protein with RPPA data.
Here, protein is used as an example to show how to employ ODEs to describe the signaling pathway as Equation (1).
| (1) |
where [‘Name’] denotes the concentration of the protein ‘Name’. , denote the phosphorylation rate of activated by , and respectively. denotes the dephosphorylation rate of Supplementary Material S4 lists 40 ODEs with 45 parameters and 19 submodules for the genetic signaling pathway.
We use PSO to estimate the initial key parameters of each submodule as Equation (2).
| (2) |
where denotes the objective function of the parameter optimization. denotes the protein concentration as a function of time series data obtained by ODE equation simulations. denotes the RPPA time series protein concentration. is and is the parameter vector. Here, and represent the index for the protein and time. and represent the number of proteins and time points, respectively.
3.2.2 Using a modularized factor graph (MFG) to optimize the key parameters of the model
Here, we consider that cell growth and apoptosis are the two major phenotypes for MM cancer. Then, we employ a MFG (Koh et al., 2006) to gradually reduce the search range of the key parameters by decomposing the genetic signaling pathway (Fig. 2) into two subpathways (Fig. S4C and D of Supplementary Material S3) by the following rules.
Rule 1: starting from the protein directly related to the growth or apoptosis phenotype, keep seeking upstream proteins that directly inhibit or promote the growth or apoptosis phenotype until we cannot find new upstream proteins. After that, the first subpathway consists of these selected proteins. Rule 2: if the number of shared proteins for the two subpathways is greater than 90% of the total number of proteins, these two subpathways are merged. Rule 3: if the number of the proteins of one subpathway is twice that of another subpathway, this subpathway is resolved again by rules 1, 2 and 3. It should be noted because the MFG developed by Koh et al. (2006) has been widely used for biological signaling networks (Chaouiya, 2007; Nim et al., 2013; Quach et al., 2007), neurobiology (Parr et al., 2019), and drug resistance study (Niederberger et al., 2015; Peng et al., 2014), we consider that it is a reliable method for us to identify such proteins that are closely related to cell apoptosis or growth phenotypes for MM.
Because several parameters simultaneously exist in modules 1 to 7 and 13 to 16 of Fig. S4B of Supplementary Material S3, it is impossible to optimize the parameters for each subpathway.
To reconcile the conflicts among parameters of shared proteins, we first define the individual compatibility function [Equation (3)] for each factor node in the context of an individual factor graph and then combine all the compatibility functions across two factor graphs (or the combined factor graph) in one objective function [Equation (4)] through which the shared parameters can be optimized by applying the BP algorithm, detailed in Supplementary Material S5. Note that the initial values (or the initial ranges) of the parameters used in the BP algorithm are obtained from the initialization step of our MFG algorithm. Finally, the best set of ranges of the model parameters with smaller lengths of intervals can be obtained through the BP algorithm from the initial ranges with larger lengths of intervals.
| (3) |
where denotes the error term between the simulation results and the experimental results; is the set of parameters and represents parameters that are not in the parameter set of. Edata represents the set of experiential data and m is the protein index from the experiential data.
| (4) |
Equation (4) is a maximum-likelihood function that considers the total compatibility of all nodes [Equation (3)] for the optimal range of the parameters, where is a normalizing constant and represents a well-defined probability function.
3.2.3 Refinement
We use PSO to train the model by setting the initial values based on the ranges from the above steps. The refinement step is repeated five times. Figure 1B shows that both simulated and experimental curves have the same trend for P21 and CyclinD after the model training. The remaining data are listed in Figure S1 of Supplementary Material S6.
3.3 Step 3: model testing
3.3.1 Model cross validation
As mentioned above, the experimental data consists of 19 proteins at four time points [t = 0, 30 and 60 min and overnight (12 h)]. Here, leave-one-out cross validation (LOOCV) (Gao et al., 2017; Zhang et al., 2017b, 2019a) is employed to validate the predictive power of the model. Table S1 of Supplementary Material S7 lists the relation errors for each protein. We employ a well-developed statistical test procedure (Zhang et al., 2019a, b) to verify the difference between the simulated results and the experimental results for all the proteins. Since the P-values listed in Table S1 of Supplementary Material S8 are greater than 0.05, there is no statistically significant difference between the simulated and experimental data for all the proteins. Therefore, our proposed method has sufficient predictive power.
3.3.2 Algorithm performance comparison
We compare the parameter estimation performance of MCMFG with two widely used methods, GA (Sun et al., 2012) and PSO by using object error (OE) (Peng et al., 2014), described by Equation (5).
| (5) |
We repeat 10 times to compute OE and use Student’s t-test (Peng et al., 2014) to validate the statistical significance among these three algorithms by OE. Figure 3 shows that MCMFG performs better parameter estimation than GA and PSO with a smaller P-value.
Fig. 3.

The algorithm comparison among PSO, GA and MCMFG
3.4 Parameter analysis
3.4.1 Identifiability analysis
The identifiability analysis employs the coefficient of variation (CV) (Sun et al., 2012; Zhang et al., 2016) defined as the ratio of the standard deviation to the mean of the estimated values to determine if the parameter is identifiable or not. If the CV of the parameter is greater than 1, it is unidentifiable; otherwise it is identifiable. Figure S1 of Supplementary Material S7 shows that 77.78% of our parameters are identifiable.
3.4.2 Sensitivity analysis
Sensitivity analysis quantitatively determines the impact of the specific parameters on the output. To understand the relationship between system responses and variations in individual model parameter values, local sensitivity analysis is performed by Equation (6) (Sun et al., 2012).
| (6) |
Here, is the sensitivity coefficient. denotes the concentration of the critical proteins (Casp3, p90RSK, CyclinD1, p21 and p7056k) which directly affect the cell phenotype switch. represents the estimated parameter, the change of which () is set to 1%. Figure S2 of Supplementary Material S7 shows that each protein (Casp3, p90RSK, CyclinD1, p21 and p7056k) is just sensitive to at most two parameters, with sensitivity coefficients is greater than 0.5, and the maximum sensitivity of the parameter for these five proteins is 1.3397 for CyclinD1 (Fig. 1C). Therefore, the sensitivity analysis shows that our system is rather robust.
3.4.3 Variation analysis
Equation (7) computes the parameter variation for two experimental conditions.
| (7) |
where denotes the variation of the parameter, and denote the parameter values under two different conditions.
Figure 4 shows that parameter indices 2, 13, 16, 18 and 26 have significant variations. Listed in Table S1 of Supplementary Material S9, these indices are the corresponding parameters of k_pFAK, k_NFκB_pAKTs473, k_mTORC1_pAKTs473, k_P70S6K1_pmTORC1 and k_CyclinD_pP21 in the ODE system (Supplementary Material S4), which are closely related to proteins FAK, mTORC1 and NFκB. They are considered as the critical proteins of the stiffness-associated signaling pathway. Based on the previous research procedures (Fan et al., 2017; Wen et al., 2016), we show that patients with MM have more positive and relatively stronger nuclear staining for NFκB (Fig. 5A) than that of healthy individuals (Fig. 5B).
Fig. 4.

The variation analysis results. The x- and y-axis are parameter variation and the name of parameters (Table S1 of Supplementary Material S9), respectively
Fig. 5.

Immunohistochemistry experiment. NFκB staining for the (A) patient (20%), (B) healthy individual (5%). It is noted that the percentage of positively stained cells (subscript of A and B) is determined by two independent pathologists
Figure 6 shows that increasing or decreasing the concentration of the three crucial proteins (FAK, mTORC1 and NFκB) can regulate the dynamics of Casp3 and CyclinD1 for our inferred signaling pathway (Fig. 2). As indicated by previous research, Casp3 (McIntosh et al., 2017) and CyclinD1 (Zhang et al., 2007) are closely related to cell apoptosis and cell growth rate, respectively. For example, when we increase the concentration of FAK (FAK+) in the model, the concentration of CyclinD1 associated with cell proliferation significantly increases (dark red in Fig. 6) and the concentration of Casp3 associated with cell apoptosis significantly decreases (shallow green in Fig. 6). On the contrary, when we decrease the concentration of FAK (FAK−) in the model, the concentration of CyclinD1 associated with cell proliferation significantly decreases (shallow red in Fig. 6) and the concentration of Casp3 associated with cell apoptosis significantly increases (dark green in Fig. 6). Moreover, we can observe the same results for mTORC1 and NFκB from Figure 6.
Fig. 6.
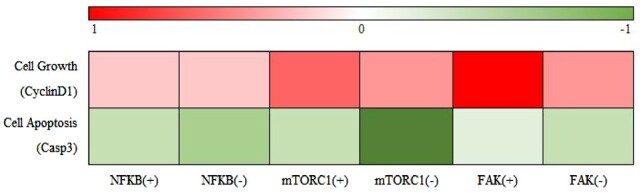
Impact of the crucial proteins on cell phenotype. (+) and (−) denote increasing and decreasing the initial concentration of corresponding protein concentration. Red and green indicate strong and weak concentration, respectively (Color version of this figure is available at Bioinformatics online.)
4 Discussion
This research aims to disrupt the vicious stiffening loop involving MICs and BMSCs using the following three major scenarios. First, we developed an integrative framework (Fig. 1) to infer the BMSC stiffness-associated signaling pathway related to MIC cellular responses, including apoptosis and growth. Then, we demonstrated that not only the robustness and predictive capacity of the signaling pathway model (Table S1 of Supplementary Material S8, Fig. S1 of Supplementary Material S6, Figs S1C and S2 of Supplementary Material S7), but also that the MCMFG algorithm has greater accuracy of parameter estimation than GA and PSO for the inferred stiffness-associated signaling pathway (Figs 2 and 3).
Second, we revealed the critical proteins (FAK, mTORC1 and NFκB) from the stiffness-associated signaling pathway (Fig. 2) by parameter analysis (Fig. 4). Then, we confirmed the impact of FAK, mTORC1 and NFκB on MM cancer by using manually reviewed the evidence and experimental data as follows: (i) focal adhesion kinase (FAK) is a nonreceptor tyrosine kinase. FAK associates with integrin adhesion molecules to exert its signaling activities. Since adhesion molecules are the key players in the survival of MM cells (Katz, 2010), it is evident that the FAK-associated pathway is vital to cancer progression in MM. (ii) mTORC1 is a major downstream mediator of the PI3K/AKT signaling pathway. Deregulation of the mTOR signaling pathway has been reported in many types of human cancer (Soares, 2012). The mTORC1 pathway is an important therapeutic target in the treatment of MM (Chen et al., 2014). (iii) Abnormal activation of the NFκB pathway is frequent in human lymphoid cancers, such as Hodgkin’s lymphoma (Arshi et al., 2016) and mucosa-associated lymphoid tissue (MALT) lymphoma (Weiss and Freeman, 2001). The prominent role of NFκB pathway activation came to light in 2007 when two independent research groups report their similar findings in the same issue of cancer cell (Tai et al., 2000). Both classical and alternative pathways of NFκB activation are involved in MM (Saez‐Rodriguez et al., 2009). Moreover, Figure 5 confirms that NFκB plays an important role in MM cancer.
Third, we investigated the impact of regulating the concentration of the crucial proteins on the MM phenotype, as shown in Figure 6. FAK, mTORC1 and NFκB are all positively related to cell growth (CyclinD1) and negatively related to cell apoptosis (Casp3), which are validated by manually reviewed evidences as follows: (i) Serrels et al. (2015) indicates that FAK plays important roles in maintaining tumor cell proliferation, survival and invasion. In particular, overexpression and activation of FAK can induce immune suppression in the tumor microenvironment, allowing tumor cells to evade antitumor immunity and grow unchecked. (ii) Chen et al. (2014) discovered that mTORC1 activation by PRL-3 promotes both cancer progression (Zu et al., 2015) and cancer cell survival by reprogramming metabolic pathways or controlling Mcl-1 expression through translation in cancer cells (Mills et al., 2008; Pusapati et al., 2016). Inhibition of Pim2 results in decreased mTORC1 activity and diminished cell proliferation in MM (Lu et al., 2013). (iii) Yano et al. (2005) showed that the consequences of constitutive NFκB activation in MM are prolonged tumor cell proliferation and survival, which increase the therapy resistance.
In general, since we inferred the structure of the BMSC stiffness-associated signaling pathway related to MIC responses and explored their crucial proteins, it is possible for us to break the vicious stiffening loop between MIC and BMSCs by regulating cell growth or the apoptosis rate.
Although we have constructed a fundamental framework for inferring crucial proteins in related pathways, other questions remain. For example, circadian rhythms have a great impact on cancer cells (Fu and Lee, 2003). In particular, Khapre et al. (2014) and O’Keeffe et al. (2017) demonstrate that the circadian clock controls the activity of the mTOR pathway through BMAL1-dependent mechanisms and NFκB is closely related to the circadian clock. To the best of our knowledge, the connection between circadian rhythm of FAK and MM cells is still unclear. Since the major aim of this research is to develop an efficient data mining algorithm to investigate MM cancer cells’ related proteins, we are going to explore the connection between FAK and MM cancer cells in the distant future. Also, RPMI8226 is the only cell line used in this study limited to our capacity, though our study on this cell line produced nice results and proved our hypothesis. Therefore, because comprehensive study of different myeloma cell lines is beyond the aim of this manuscript, our future studies will warrant the use of more cell lines to evaluate if the discoveries made here can be generalized across cell lines. Furthermore, since there is still a room to improve the efficiency of this algorithm, more efficient optimization algorithm is needed in future work.
Supplementary Material
Acknowledgements
This work was supported by the General Program from National Natural Science Foundation of China and the National Science and Technology Major Project.
Funding
This work was supported by National Key Research and Development Program of China [2017YFA0505500]; the Strategic Priority Research Program of the Chinese Academy of Sciences [XDB13040700], National Natural Science Foundation of China [61372138, 31771476]; and the National Science and Technology Major Project [2018ZX10201002].
Conflict of Interest: none declared.
Contributor Information
Le Zhang, College of Computer Science; Medical Big Data Center, Sichuan University, Chengdu 610065, China; Chongqqing Zhongdi Medical Information Technology Co., Ltd, Chongqing 401320, China.
Guangdi Liu, College of Computer and Information Science, Southwest University, Chongqing 400715, China; Library of Chengdu University, Chengdu University, Chengdu 610106, China.
Meijing Kong, College of Computer and Information Science, Southwest University, Chongqing 400715, China.
Tingting Li, College of Mathematics and Statistics, Southwest University, Chongqing 400715, China.
Dan Wu, Department of Radiology, Wake Forest University School of Medicine, Winston-Salem, NC 27157, USA.
Xiaobo Zhou, Department of Radiology, Wake Forest University School of Medicine, Winston-Salem, NC 27157, USA.
Chuanwei Yang, Systems Biology, The University of Texas MD Anderson Cancer Center, Houston, TX 77030, USA.
Lei Xia, Cancer Center, Research Institute of Surgery, Daping Hospital, Third Military Medical University, Chongqing 400042, China.
Zhenzhou Yang, Cancer Center, Research Institute of Surgery, Daping Hospital, Third Military Medical University, Chongqing 400042, China.
Luonan Chen, Key Laboratory of Systems Biology, CAS Center for Excellence in Molecular Cell Science, Institute of Biochemistry and Cell Biology, Shanghai Institutes for Biological Sciences, Chinese Academy of Sciences, Shanghai 200031, China; Center for Excellence in Animal Evolution and Genetics, Chinese Academy of Sciences, Kunming 650223, China; Shanghai Research Center for Brain Science and Brain-Inspired Intelligence, Shanghai 201210, China.
References
- Abe M. (2011) Targeting the interplay between myeloma cells and the bone marrow microenvironment in myeloma. Int. J. Hematol., 94, 334–343. [DOI] [PubMed] [Google Scholar]
- Anderson K.C. (2007) Targeted therapy of multiple myeloma based upon tumor-microenvironmental interactions. Exp. Hematol., 35 (4 Suppl. 1), 155–162. [DOI] [PubMed] [Google Scholar]
- Apostolos Z. et al. (2014) Ingenuity pathway analysis (IPA). Oncoscience, 1, 117.
- Arshi A. et al. (2016) Rigid microenvironments promote cardiac differentiation of mouse and human embryonic stem cells. Sci. Technol. Adv. Mater., 14, 301–304. [DOI] [PMC free article] [PubMed] [Google Scholar]
- Chaouiya C. (2007) Petri net modelling of biological networks. Brief. Bioinform., 8, 210–219. [DOI] [PubMed] [Google Scholar]
- Chen W.W. et al. (2009) Input–output behavior of ErbB signaling pathways as revealed by a mass action model trained against dynamic data. Mol. Syst. Biol., 5, 239. [DOI] [PMC free article] [PubMed] [Google Scholar]
- Chen X. et al. (2014) Genetic and pharmacologic evidence that mTOR targeting outweighs mTORC1 inhibition as an antimyeloma strategy. Mol. Cancer Ther., 13, 504. [DOI] [PubMed] [Google Scholar]
- Chen Y. et al. (2014) Hyperactivation of mammalian target of rapamycin complex 1 (mTORC1) promotes breast cancer progression through enhancing glucose starvation-induced autophagy and Akt signaling. J. Biol. Chem., 289, 1164. [DOI] [PMC free article] [PubMed] [Google Scholar]
- Dan W. et al. (2015) CD138-negative myeloma cells regulate mechanical properties of bone marrow stromal cells through SDF-1/CXCR4/AKT signaling pathway. Biochim. Biophys. Acta, 1853, 338–347. [DOI] [PMC free article] [PubMed] [Google Scholar]
- De Raeve H.R., Vanderkerken K. (2002) The role of the bone marrow microenvironment in multiple myeloma. Histol. Histopathol., 17, 1921–1925. [DOI] [PubMed] [Google Scholar]
- Fan X. et al. (2017) The expression profile and prognostic value of APE/Ref‐1 and NPM1 in high‐grade serous ovarian adenocarcinoma. APMIS, 125, 857. [DOI] [PubMed] [Google Scholar]
- Feng Y. et al. (2010) Unique biomechanical interactions between myeloma cells and bone marrow stroma cells. Prog. Biophys. Mol. Biol., 103, 148–156. [DOI] [PubMed] [Google Scholar]
- Fu L., Lee C.C. (2003) The circadian clock: pacemaker and tumour suppressor. Nat. Rev. Cancer, 3, 350. [DOI] [PubMed] [Google Scholar]
- Gao H. et al. (2017) Developing an agent-based drug model to investigate the synergistic effects of drug combinations. Molecules, 22, 2209. [DOI] [PMC free article] [PubMed] [Google Scholar]
- Goldberg D.E. (1989) Genetic algorithms in search, optimization, and machine learning. Addison-Wesley., 7, 2104–2116. [Google Scholar]
- Jeon Y.J. et al. (2002) An efficient simulated annealing algorithm for network reconfiguration in large-scale distribution systems. IEEE Power Eng. Rev., 22, 61–62. [Google Scholar]
- Katz B.Z. (2010) Adhesion molecules: the lifelines of multiple myeloma cells. Semin. Cancer Biol., 20, 186–195. [DOI] [PubMed] [Google Scholar]
- Khapre R.V. et al. (2014) BMAL1-dependent regulation of the mTOR signaling pathway delays aging. Aging, 6, 48–57. [DOI] [PMC free article] [PubMed] [Google Scholar]
- Koh G. et al. (2006) A decompositional approach to parameter estimation in pathway modeling. Bioinformatics, 22, e271. [DOI] [PubMed] [Google Scholar]
- Lu J. et al. (2013) Pim2 is required for maintaining multiple myeloma cell growth through modulating TSC2 phosphorylation. Blood, 122, 1610. [DOI] [PMC free article] [PubMed] [Google Scholar]
- McIntosh A. et al. (2017) SipA activation of caspase-3 is a decisive mediator of host cell survival at early stages of Salmonella enterica serovar Typhimurium infection. Infect. Immun., 85, e00393-17. [DOI] [PMC free article] [PubMed] [Google Scholar]
- Mclean G.W. et al. (2005) The role of focal-adhesion kinase in cancer. A new therapeutic opportunity. Nat. Rev. Cancer, 5, 505–515. [DOI] [PubMed] [Google Scholar]
- Mills J.R. et al. (2008) mTORC1 promotes survival through translational control of Mcl-1. Proc. Nat. Acad. Sci. USA, 105, 10853. [DOI] [PMC free article] [PubMed] [Google Scholar]
- Nelander S. et al. (2008) Models from experiments: combinatorial drug perturbations of cancer cells. Mol. Syst. Biol., 4, 216. [DOI] [PMC free article] [PubMed] [Google Scholar]
- Niederberger T. et al. (2015) Factor graph analysis of live cell–imaging data reveals mechanisms of cell fate decisions. Bioinformatics, 31, 1816–1823. [DOI] [PubMed] [Google Scholar]
- Nim T.H. et al. (2013) Systematic parameter estimation in data-rich environments for cell signalling dynamics. Bioinformatics, 29, 1044–1051. [DOI] [PMC free article] [PubMed] [Google Scholar]
- Noonan K., Borrello I. (2011) The immune microenvironment of myeloma. Cancer Microenviron., 4, 313.. [DOI] [PMC free article] [PubMed] [Google Scholar]
- O’Keeffe S.M. et al. (2017) NF-κB signalling is involved in immune-modulation, but not basal functioning, of the mouse suprachiasmatic circadian clock. Eur. J. Neurosci., 45, 1111. [DOI] [PubMed] [Google Scholar]
- Olivier Decaux M.C. et al. (2010) Inhibition of mTORCI activity by REDD1 induction in myeloma cells resistant to bortezomib cytotoxicity. Cancer Sci., 101, 889–897. [DOI] [PMC free article] [PubMed] [Google Scholar]
- Parr T. et al. (2019) Neuronal message passing using mean-field, bethe, and marginal approximations. Sci. Rep., 9, 1889. [DOI] [PMC free article] [PubMed] [Google Scholar]
- Paszek M.J. et al. (2005) Tensional homeostasis and the malignant phenotype. Cancer Cell, 8, 241–254. [DOI] [PubMed] [Google Scholar]
- Peng H. et al. (2014) Characterization of p38 MAPK isoforms for drug resistance study using systems biology approach. Bioinformatics, 30, 1899–1907. [DOI] [PMC free article] [PubMed] [Google Scholar]
- Pusapati R.V. et al. (2016) mTORC1-dependent metabolic reprogramming underlies escape from glycolysis addiction in cancer cells. Cancer Cell, 29, 548. [DOI] [PubMed] [Google Scholar]
- Quach M. et al. (2007) Estimating parameters and hidden variables in non-linear state-space models based on ODEs for biological networks inference. Bioinformatics, 23, 3209–3216. [DOI] [PubMed] [Google Scholar]
- Rena F. et al. (2004) Regulation of NF-kB in multiple myeloma: therapeutic implications. Clin. Adv. Hematol. Oncol., 2, 162–166. [PubMed] [Google Scholar]
- Saez‐Rodriguez J. et al. (2009) Discrete logic modelling as a means to link protein signalling networks with functional analysis of mammalian signal transduction. Mol. Syst. Biol., 5, 2295–2297. [DOI] [PMC free article] [PubMed] [Google Scholar]
- Sergio I. et al. (2010) Identification of optimal drug combinations targeting cellular networks: integrating phospho-proteomics and computational network analysis. Cancer Res., 70, 6704–6714. : [DOI] [PMC free article] [PubMed] [Google Scholar]
- Serrels A. et al. (2015) Nuclear FAK controls chemokine transcription, Tregs, and evasion of anti-tumor immunity. Cell, 163, 160–173. [DOI] [PMC free article] [PubMed] [Google Scholar]
- Shockley E.M. et al. (2018) PyDREAM: high-dimensional parameter inference for biological models in python. Bioinformatics, 34, 695–697. [DOI] [PMC free article] [PubMed] [Google Scholar]
- Soares P. (2012) The mTOR signalling pathway in human cancer. Int. J. Mol. Sci., 13, 1886–1918. [DOI] [PMC free article] [PubMed] [Google Scholar]
- Sulzmaier F.J. et al. (2014) FAK in cancer: mechanistic findings and clinical applications. Nat. Rev. Cancer, 14, 598–610. [DOI] [PMC free article] [PubMed] [Google Scholar]
- Sun X. et al. (2012) Cytokine combination therapy prediction for bone remodeling in tissue engineering based on the intracellular signaling pathway. Biomaterials, 33, 8265–8276. [DOI] [PMC free article] [PubMed] [Google Scholar]
- Tai Y.L. et al. (2015) Emerging roles of focal adhesion kinase in cancer. Biomed Res. Int., 2015, 1–13. [DOI] [PMC free article] [PubMed] [Google Scholar]
- Tai Y.T. et al. (2000) Isolation and characterization of human multiple myeloma cell enriched populations. J. Immunol. Methods, 235, 11–19. [DOI] [PubMed] [Google Scholar]
- Teru H. et al. (2007) Understanding multiple myeloma pathogenesis in the bone marrow to identify new therapeutic targets. Nat. Rev. Cancer, 7, 585–598. [DOI] [PubMed] [Google Scholar]
- Thomas B.R. et al. (2016) BioNetFit: a fitting tool compatible with BioNetGen, NFsim and distributed computing environments. Bioinformatics, 32, 798–800. [DOI] [PMC free article] [PubMed] [Google Scholar]
- Tibes R. et al. (2006) Reverse phase protein array (RPPA): validation of a novel proteomic technology and utility for analysis of primary leukemia specimens and hematopoetic stem cells (HSC). Mol. Cancer Ther., 5, 2512–2521. [DOI] [PubMed] [Google Scholar]
- Tilghman R.W. et al. (2010) Matrix rigidity regulates cancer cell growth and cellular phenotype. PLoS One, 5, e12905. [DOI] [PMC free article] [PubMed] [Google Scholar]
- Tilghman R.W., Parsons J.T. (2008) Focal adhesion kinase as a regulator of cell tension in the progression of cancer. Semin. Cancer Biol., 18, 45–52. [DOI] [PMC free article] [PubMed] [Google Scholar]
- Ulrich T.A. et al. (2009) The mechanical rigidity of the extracellular matrix regulates the structure, motility, and proliferation of glioma cells. Cancer Res., 69, 4167–4174. [DOI] [PMC free article] [PubMed] [Google Scholar]
- Weiss Y., Freeman W.T. (2001) On the optimality of solutions of the max-product belief propagation algorithm in arbitrary graphs. IEEE Trans. Inf. Theory, 47, 736–744. [Google Scholar]
- Wen X. et al. (2016) APE1 overexpression promotes the progression of ovarian cancer and serves as a potential therapeutic target. Cancer Biomark., 17, 313–322. [DOI] [PubMed] [Google Scholar]
- Yamashita H. (2012) Analysis of microenvironment-mediated cell behavior -mechanisms for sensing matrix rigidity and regulating cell migration. Kyoto University., N4676, 16915.
- Yano S. et al. (2005) Characterization and localization of side population cells in mouse skin. Stem Cells, 23, 834–841. [DOI] [PubMed] [Google Scholar]
- Zhang J. et al. (2013) Asiatic acid, a triterpene, inhibits cell proliferation through regulating the expression of focal adhesion kinase in multiple myeloma cells. Oncol. Lett., 6, 1762–1766. [DOI] [PMC free article] [PubMed] [Google Scholar]
- Zhang L. et al. (2007) Development of a three-dimensional multiscale agent-based tumor model: simulating gene-protein interaction profiles, cell phenotypes and multicellular patterns in brain cancer. J. Theor. Biol., 244, 96–107. [DOI] [PubMed] [Google Scholar]
- Zhang L. et al. (2016) Investigation of mechanism of bone regeneration in a porous biodegradable calcium phosphate (CaP) scaffold by a combination of a multi-scale agent-based model and experimental optimization/validation. Nanoscale, 8, 14877. [DOI] [PMC free article] [PubMed] [Google Scholar]
- Zhang L. et al. (2017a) EZH2-, CHD4-, and IDH-linked epigenetic perturbation and its association with survival in glioma patients. J. Mol. Cell Biol., 9, 477–488. [DOI] [PMC free article] [PubMed] [Google Scholar]
- Zhang L. et al. (2017b) Building up a robust risk mathematical platform to predict colorectal cancer. Complexity, 2017, 1. [Google Scholar]
- Zhang L. et al. (2019a) Comprehensively benchmarking applications for detecting copy number variation. PLoS Comput. Biol., 15, e1007069. [DOI] [PMC free article] [PubMed] [Google Scholar]
- Zhang L. et al. (2019b) Computed tomography angiography-based analysis of high-risk intracerebral haemorrhage patients by employing a mathematical model. BMC Bioinformatics, 20 (Suppl. 7), 193. [DOI] [PMC free article] [PubMed] [Google Scholar]
- Zhang L., Zhang S. (2017) Using game theory to investigate the epigenetic control mechanisms of embryo development: comment on: “Epigenetic game theory: how to compute the epigenetic control of maternal-to-zygotic transition” by Qian Wang et al. Phys. Life Rev., 20, 140–142. [DOI] [PubMed] [Google Scholar]
- Zu Y. et al. (2015) PRL-3 activates mTORC1 in cancer progression. Sci. Rep., 5, 17046. [DOI] [PMC free article] [PubMed] [Google Scholar]
Associated Data
This section collects any data citations, data availability statements, or supplementary materials included in this article.