

Abstract
Most genetic studies of nonalcoholic fatty liver disease (NAFLD) have been conducted in Whites. In this large and ethnically diverse cohort, we assessed the transportability of previously identified genetic variants for NAFLD, built a genetic risk score (GRS), and examined its association with NAFLD risk in multiple ethnic groups. Thirty previously identified genome‐wide association studies (GWAS) variants (P < 5 × 10⁻⁸) and 17 other variants associated with NAFLD were examined in a nested case‐control study of NAFLD (1,448 cases/8,444 controls) in this multi‐ethnic cohort study. We then built a GRS using 11 independent single‐nucleotide polymorphisms from these prior studies and examined its association with NAFLD by cirrhosis status across multiple ethnic groups. Of the 30 GWAS SNPs, 20 (67%) were replicated (P < 0.05) in the pooled multi‐ethnic population. The highest percentage of replication was seen in Latinos (43%), followed by Japanese Americans (37%), Whites (17%), and Native Hawaiians and African Americans (≤10%). Several genetic variants, including those in PNPLA3 (patatin‐like phospholipase domain containing 3), HSD17B13 (hydroxysteroid 17‐beta dehydrogenase 13), TM6SF2 (transmembrane 6 superfamily member 2), GATAD2A (GATA zinc finger domain containing 2A), GCKR (glucokinase regulator), SUGP1 (SURP and G‐patch domain containing 1), MBOAT7 (membrane bound O‐acyltransferase domain containing 7), TRIB1 (tribbles pseudokinase 1), SAMM50 (sorting and assembly machinery component), and ERLIN1 (ER lipid raft associated 1)–CHUK (component of inhibitor of nuclear factor kappa B kinase complex)–CWF19L1 (CWF19 like cell cycle control factor 1) gene cluster, were replicated in at least two ethnic groups. An 11‐SNP weighted GRS was associated with NAFLD risk in the multi‐ethnic population (odds ratio [OR] per SD increase = 1.41; 95% confidence interval [CI] = 1.32‐1.50), as well as in each ethnic group (OR ranged from 1.30 in African Americans to 1.52 in Latinos). The GRS–NAFLD association was stronger for NAFLD with cirrhosis (OR = 1.67; 95% CI = 1.46‐1.92) compared to NAFLD without cirrhosis (OR = 1.37; 95% CI = 1.28‐1.46) (P heterogeneity = 0.003). Conclusion: In this ethnically diverse cohort, we replicated several key genetic variants for NAFLD and showed the utility of GRS based on the risk alleles for NAFLD risk stratification in multiple ethnic groups.
In this large and ethnically diverse study, we assessed the transportability of previously identified genetic variants for NAFLD, built a genetic risk score (GRS) with independent SNPs, and examined its association with NAFLD risk in multiple ethnic groups. Several genetic variants were replicated in at least two ethnic groups. A 11‐SNP weighted GRS was associated with NAFLD risk in the multiethnic population with stronger association for NAFLD with cirrhosis. Our study showed the utility of GRS based on the risk alleles for NAFLD risk stratification in multiple ethnic groups.
Abbreviations
- ALT
alanine aminotransferase
- AUC
area under the curve
- BMI
body mass index
- CHUK
component of inhibitor of nuclear factor kappa B kinase complex
- CI
confidence interval
- CPN1
carboxypeptidase N
- CWF19L1
CWF19 like cell cycle control factor 1
- ERLIN1
ER lipid raft associated 1
- FFS
fee‐for‐service
- GATAD2A
GATA zinc finger domain containing 2A
- GCKR
glucokinase regulator
- GRS
genetic risk score
- HSD17B13
hydroxysteroid 17‐beta dehydrogenase 13
- ICD
International Classification of Diseases
- LD
linkage disequilibrium
- LYPLAL1
lysophospholipase like 1
- MAF
minor allele frequency
- MBOAT7
membrane bound O‐acyltransferase domain containing 7
- MEC
multi‐ethnic cohort
- NAFLD
nonalcoholic fatty liver disease
- OR
odds ratio
- PC
principal component
- PNPLA3
patatin‐like phospholipase domain containing 3
- PPP1R3B
protein phosphatase 1 regulatory subunit 3B
- SAMM50
sorting and assembly machinery component
- SERPINA1
serpin family A member 1
- SNP
single nucleotide polymorphism
- SUGP1
SURP and G‐patch domain containing 1
- TM6SF2
transmembrane 6 superfamily member 2
- TRIB
tribbles pseudokinase
Nonalcoholic fatty liver disease (NAFLD) is the most common cause of chronic liver disease,( 1 ) affecting at least a quarter of the world’s population.( 2 ) NAFLD is predicted to become the leading indication for liver transplantation( 3 ) and a major risk factor for hepatocellular carcinoma that can develop even without cirrhosis.( 4 ) Between 2015 and 2030, the NAFLD prevalence is projected to increase 21% to 101 million in the United States.( 5 ) U.S. Latinos experience the highest prevalence of NAFLD compared with other ethnic groups.( 6 ) In this multi‐ethnic cohort (MEC), we showed that NAFLD is the most common etiology of chronic liver disease in Latinos, Japanese Americans, Native Hawaiians, African Americans and Whites, and the prevalence of NAFLD in Latinos, Japanese Americans, and Native Hawaiians is higher relative to Whites.( 7 )
Genome‐wide association studies (GWASs) have identified several variants associated with hepatic fat content,( 8, 9, 10, 11, 12 ) circulating liver enzymes,( 9, 10, 13, 14, 15 ) and NAFLD development and disease severity.( 16, 17, 18, 19, 20 ) Among the variants identified, a single nucleotide polymorphism (SNP) in patatin‐like phospholipase domain containing 3 (PNPLA3) (rs738409) has been confirmed in multiple GWASs among predominantly European or Asian ancestry.( 11, 12, 13, 16, 17, 18, 20 ) An SNP of TM6SF2 (transmembrane 6 superfamily member 2; rs58542926) has been reported in at least two GWASs of European ancestry,( 10, 16 ) in addition to an earlier exome‐wide association study.( 21 ) Several variants in HSD17B13 (hydroxysteroid 17‐beta dehydrogenase 13) have also been linked to NAFLD in previous studies,( 13, 16 ) again in predominantly European ancestry. Other previously identified GWAS‐significant variants for NAFLD, liver fat content, or liver enzymes include SNPs in GCKR (glucokinase regulator), GATAD2A (GATA zinc finger domain containing 2A), NCAN (neurocan), PPP1R3B (protein phosphatase 1 regulatory subunit 3B), TRIB2 (tribbles pseudokinase 2), CPN1 (carboxypeptidase N), ERLIN1 (ER lipid raft associated 1), and SAMM50 (sorting and assembly machinery component).( 9, 11, 13, 15, 19 ) Prior studies (although not in the context of genome‐wide assessment) have also identified variants that were associated with NAFLD histopathological features including those in MBOAT7 (membrane bound O‐acyltransferase domain containing 7), SERPINA1 (serpin family A member 1), HFE, and MARC1 (mitochondrial amidoxime reducing component 1).( 22, 23 ) More than half of the NAFLD GWASs were conducted among individuals of European ancestry,( 8, 9, 10, 11, 14, 16, 20 ) whereas three studies were conducted exclusively among Japanese in Japan.( 17, 18, 19 ) Three prior GWASs consisted of multi‐ethnic populations,( 12, 13, 15 ) but only one study included Hispanics and African Americans.( 12 ) Few subsequent studies have examined whether the associations between selected variants and NAFLD were replicated in U.S. Hispanics and African Americans,( 24, 25 ) but these variants have yet to be examined in other populations.
Increasing studies have shown the utility of genetic risk score (GRS), which combines the effects of individual SNPs into a single score for risk prediction of multiple diseases, including NAFLD.( 26 ) Despite promising results in predicting NAFLD development and progression, prior studies generated the GRS based on a few selected genetic variants without taking into account all previously identified GWAS‐significant variants. Furthermore, although these GRS studies were conducted among non‐Whites, including Mexicans and Japanese, no prior studies have included Asians, Latinos, African Americans, or Native Hawaiians in the United States.( 26 ) The underrepresentation of non‐European ancestry populations in GWAS for discovery creates a major gap in the use of genetic information for predicting, preventing, and treating disease across populations.( 27, 28, 29, 30 )
In this large and most ethnically diverse prospective study to date, we assessed the transportability of prior GWAS findings and how these variants contribute to NAFLD across populations. We then used the GWAS SNPs to build GRS and assessed its association with NAFLD risk by disease severity in multiple ethnic groups.
Materials and Methods
Study Population
MEC Background
We conducted a nested case‐control study within the MEC. Details of the cohort design and baseline characteristics of participants have been previously described.( 31 ) Briefly, the MEC is a population‐based prospective study designed to investigate the roles of dietary, lifestyle, and genetic factors in cancer and chronic disease etiology. The cohort includes more than 215,000 men and women, aged 45‐75 years at enrollment during 1993‐1996. The MEC consists of participants primarily from five ethnic groups (African Americans, Japanese Americans, Latinos, Native Hawaiians, and Whites) living in Hawaii and California, primarily Los Angeles County. At baseline, participants completed a mailed questionnaire that included information on anthropometry, lifestyle, diet, family, and personal medical history. Because in this study NAFLD cases were identified using the Medicare fee‐for‐service (FFS) claim files, we restricted the study population to MEC‐Medicare FFS participants (n = 123,196).( 32 ) We excluded participants who were not from the five major ethnic groups (n = 7,511), had invalid dietary data based on implausible macronutrient intakes (n = 4,498), and missing baseline information on the important variables (body mass index [BMI] and diabetes; n = 931). A total of 110,256 eligible participants were available for nested case‐control analysis of NAFLD.( 33 )
Case‐Control Samples
As described previously,( 7, 33 ) NAFLD cases were identified from eligible participants using International Classification of Diseases (ICD), Ninth Revision codes 571.8 and 571.9, and ICD Tenth Revision codes K75.81, K760, K7689, K741, and K769), one inpatient or two or more outpatient/carrier FFS claims on different dates between 1999 and 2016, and excluding other liver disease etiology. We included all NAFLD cases with blood or buccal samples (n = 1,498). NAFLD cases were further stratified by cirrhosis status as described previously.( 33 ) Controls were selected among eligible participants across nested case‐control studies within the MEC who met the following criteria: genotyped using the Illumina Multi‐ethnic Genotyping Array (MEGA) chip (San Diego, CA) in the five major ethnic groups, valid information on type 2 diabetes status, and BMI, and did not have chronic liver disease.
The institutional review boards for the University of Southern California and the University of Hawaii approved this study. NAFLD cases and controls consented to genetic association studies.
Genotyping, Quality Control, and Genotype Imputation
Samples were genotyped using the MEGA chip. This chip was developed to ensure genome‐wide coverage of variants down to 1% frequency in non‐European ancestry populations. We conducted intensive quality control of samples, including SNP and sample call‐rate filtering, concordance checks of interplate and intraplate controls, and removal of redundant or discordant variants based on location and call rates (Supporting Fig. S1). Post–quality control data contained 1,189,906 SNPs, 1,448 cases, and 8,444 controls. This sample was stratified on self‐reported ethnicity, then imputed using Minimac4 with both the TOPMed reference panel (version r2) and the 1000 Genomes (1000G) Project reference panel (Phase 3 v5).
Statistical Methods
SNP Selection and Replication Analysis
We searched the literature for GWASs of NAFLD or NAFLD‐related quantitative traits (i.e., imaging quantified hepatic fat and/or circulating liver enzymes). We also included non‐GWASs of histopathologic features of NAFLD that may reflect disease severity. A total of 47 variants reported in prior studies (30 SNPs identified in GWAS with P < 5 × 10⁻⁸ ( 8, 9, 10, 11, 12, 13, 14, 15, 16, 17, 18, 19, 20 ) and 17 non‐GWAS SNPs( 8, 11, 22, 23, 34, 35, 36 )) were included in our analysis. The median imputation quality score (R2) for the 47 SNPs across five ethnic groups was 0.990 (interquartile range: 0.958‐0.999). We compared allele frequencies of these SNPs with those from 1000G by ethnicity, and all SNPs showed no differences compared with this panel; thus, all 47 SNPs were retained in the analysis.
Multivariable logistic regression models were used to determine the SNP and NAFLD association (assuming an additive genetic model), adjusting for age at blood collection, sex, BMI, type 2 diabetes, and population stratification using principal components (PCs) 1‐5. PCs were estimated using PC‐AiR and a set of over 15,000 independent SNPs.( 37 ) Most global ancestry variation among the five ethnic groups was captured in the five PCs (Supporting Fig. S2). First‐degree and second‐degree related samples were removed, resulting in a final analytical sample of 1,448 cases and 8,444 controls (Supporting Fig. S1). We assessed the SNP‐NAFLD associations in all ethnic groups combined and by ethnicity. Likelihood ratio tests were used to determine whether the associations varied significantly across ethnic groups.
GRS Analysis
We developed a GRS using independent SNPs from both prior GWAS SNPs with P < 5 × 10⁻⁸ and non‐GWAS SNPs that were replicated in our study. We included non‐GWAS SNPs because they have been previously associated with NAFLD severity.( 22, 23 ) We checked linkage disequilibrium (LD) patterns using 1000G reference populations, and SNPs were considered independent if LD r2 < 0.3 in the study population in which the SNPs were discovered. A total of 12 independent SNPs were initially selected. We removed one SNP (rs28929474) because it was rare in all ethnic groups (minor allele frequency [MAF] < 0.01) except in Whites. Thus, 11 SNPs were used to derive GRS: rs738409 (PNPLA3), rs58542926 (TM6SF2), rs1260326 (GCKR), rs13118664 (HSD17B13), rs4808199 (GATAD2A), rs2954021 (TRIB2), rs4240624 (PPP1R3B), rs10883437 (CPN1), rs10883451 (ERLIN1), rs429358 (apolipoprotein E [APOE]), and rs641738 (MBOAT7).
Although we preferentially considered using external weights (i.e., risk allele effect estimates from prior GWASS), only three variants (out of 11) had effect estimates for binary NAFLD status (the same outcome variable as in this study), while the remaining variants were assessed for effects on quantitative traits (e.g., hepatic fat content, liver enzyme levels) in prior studies. Furthermore, because most prior studies were conducted among Europeans or East Asians, the effect estimates may not be applied to other populations; we therefore used internal ethnic‐specific and multi‐ethnic weights to derive the GRS.
To account for uncertainty in risk allele effect sizes and to down‐weigh the contribution of variants with less precisely estimated associations, we applied inverse variance weights that incorporate the standard error of the variant effect estimates. The GRS was computed using the formula , where βn and SE(βn) are the per‐allele log(OR) and standard error of the nth SNP, respectively, and SNPn is the dosage for the risk allele (range: 0‐2) of the nth SNP. The GRS was examined as both continuous (per SD increase in standardized GRS) and categorical (quartiles; cutoffs determined using the distribution among controls) using logistic regression models.
We assessed the associations of GRS with NAFLD in all ethnic groups combined and by ethnicity. None of the 11 SNPs used to compute the GRS showed statistically significantly heterogeneity of effects across ethnic groups except for rs4240624; thus, the effect estimates (β and SE) obtained from the multi‐ethnic population (i.e., pooling all five ethnic groups) were used to derive the GRS. We further performed the following sensitivity analyses: (1) excluding rs4240624 in all combined analysis; and (2) using ethnic‐specific effect estimates for rs4240624 while using the pooled estimates for the remaining 10 SNPs in the ethnic‐specific GRS. We also performed sensitivity analysis using unweighted GRS computed as the sum of the risk alleles of the 11 SNPs. Receiver operating characteristic (ROC) analysis was also conducted, and discrimination between cases and controls was measured using the area under the ROC curve (AUC).
Finally, we examined whether the GRS‐NAFLD association varied by disease severity (NAFLD with or without cirrhosis), age, sex, BMI, and type 2 diabetes. All P values were based on two‐sided tests. Analyses were performed using R software version 4.0.2.
Results
Sample Characteristics
The mean age was 66.0, 68.4, and 66.8 years in NAFLD cases without cirrhosis, NAFLD cases with cirrhosis, and controls, respectively (Table 1). There were more women in cases (58.8% and 61.9% for cases without and with cirrhosis, respectively) than in controls (53.8%). Among NAFLD cases without cirrhosis, Japanese Americans accounted for 62.0% of the cases, followed by Latinos (15.1%), Whites (12.1%), Native Hawaiians (6.4%), and African Americans (4.4%). Among cases with cirrhosis, Latinos and Japanese each contributed to approximately 34% of the cases, followed by Whites (14.4%), African Americans (9.7%), and Native Hawaiians (6.9%). Across ethnic groups, cases (particularly cases with cirrhosis) had higher BMI and prevalence of type 2 diabetes compared with controls.
TABLE 1.
Characteristics of NAFLD Cases and Controls in the Multi‐ethnic Cohort
| NAFLD Cases Without Cirrhosis (n = 1,232) | NAFLD Cases With Cirrhosis (n = 216) | Controls (n = 8,444) | ||||
|---|---|---|---|---|---|---|
| Mean | SD | Mean | SD | Mean | SD | |
| Age at blood collection, years | 66.0 | 7.6 | 68.4 | 7.5 | 66.8 | 8.0 |
| African American | 68.7 | 7.6 | 68.7 | 6.4 | 68.6 | 8.0 |
| Native Hawaiian | 63.1 | 6.9 | 65.9 | 7.0 | 64.3 | 7.4 |
| Japanese American | 66.0 | 7.8 | 69.6 | 7.7 | 67.8 | 8.3 |
| Latino | 66.4 | 7.0 | 67.6 | 6.9 | 66.5 | 7.0 |
| White | 66.2 | 7.7 | 68.3 | 9.0 | 62.8 | 7.9 |
| Median | IQR | Median | IQR | Median | IQR | |
| BMI, kg/m2 | 26.1 | 5.8 | 28.3 | 7.0 | 26.7 | 6.0 |
| BMI by race | ||||||
| African American | 29.7 | 6.4 | 28.8 | 9.1 | 27.5 | 6.3 |
| Native Hawaiian | 29.1 | 6.4 | 30.0 | 5.2 | 28.1 | 6.9 |
| Japanese American | 25.0 | 4.8 | 27.1 | 5.4 | 25.0 | 4.8 |
| Latino | 28.1 | 6.5 | 30.2 | 7.2 | 27.4 | 5.2 |
| White | 26.7 | 6.0 | 27.8 | 8.3 | 24.5 | 4.1 |
| N | % | N | % | N | % | |
| Female | 763 | 58.8 | 127 | 61.9 | 4544 | 53.8 |
| Race/ethnicity | ||||||
| African American | 54 | 4.4 | 21 | 9.7 | 2511 | 29.7 |
| Native Hawaiian | 79 | 6.4 | 15 | 6.9 | 1911 | 22.6 |
| Japanese American | 764 | 62.0 | 74 | 34.3 | 2134 | 25.3 |
| Latino | 186 | 15.1 | 75 | 34.7 | 1547 | 18.3 |
| White | 149 | 12.1 | 31 | 14.4 | 341 | 4.0 |
| Type 2 diabetes by ethnicity | ||||||
| African American | 47 | 87.0 | 17 | 81.0 | 1357 | 54.0 |
| Native Hawaiian | 54 | 68.4 | 14 | 93.3 | 880 | 46.0 |
| Japanese American | 443 | 58.0 | 65 | 87.8 | 1147 | 53.7 |
| Latino | 144 | 77.4 | 69 | 92.0 | 849 | 54.9 |
| White | 73 | 49.0 | 27 | 87.1 | 50 | 14.7 |
Abbreviation: IQR, interquartile range.
Replication of Prior GWAS Variants
All prior GWAS variants showed MAF > 0.05 among Whites in this study, except rs28929474 (MAF = 0.018) (Supporting Table S1). Many of the prior GWAS variants were also common in non‐Whites in this study, although about 2‐3 SNPs (rs28929474, rs2228603, and rs4240624) were rare in each of the non‐White populations (MAF < 0.05) (Supporting Table S1). Of the 30 prior GWAS‐significant SNPs, 20 (67%) were replicated (P < 0.05) in the multi‐ethnic population (Table 2). The top‐ranked SNPs included several highly correlated variants on chromosome 22 (LD r2 : 0.68~1.00 across ethnic groups), mapped to PNPLA3, with the leading SNPs rs3747207 (P = 7.54 × 10⁻¹⁴), rs738409 (P = 1.05 × 10⁻¹³), and rs738408 (P = 1.65 × 10⁻¹³). Approximately 40% increased NAFLD risk was observed among individuals carrying the A allele of rs3747207 (odds ratio [OR] = 1.39; 95% confidence interval [CI] =1.28‐1.52), the G allele of rs738409 (OR = 1.39; 95% CI = 1.28‐1.52), and the T allele of rs738408 (OR = 1.39; 95% CI = 1.27‐1.52). The A allele in SAMM50 (rs44391686) was associated with 20% increased risk (OR = 1.20; 95% CI = 1.10‐1.31). Two low to moderately correlated SNPs (r2 : 0.12~0.18 in Japanese Americans, African Americans and Latinos; r2 = 0.41 in Whites) on chromosome 19, rs58542926 (TM6SF2), and rs4808199 (GATAD2A) were also replicated in this multi‐ethnic population, with the stronger association observed for rs58542926 (OR = 1.35; 95% CI = 1.16‐1.57). Two correlated SNPs on chromosome 2 (rs1260326 and rs780094; r2 = 0.69~0.92 across ethnic groups), mapped to GCKR, were significantly associated with 14%‐16% increased NAFLD risk. Finally, nine SNPs of the ERLIN1–CHUK (component of inhibitor of nuclear factor kappa B kinase complex)–CWF19L1 (CWF19 like cell cycle control factor 1) gene cluster on chromosome 10 were replicated with approximately 17%‐20% increased risk associated with the risk alleles.
TABLE 2.
Associations Between Prior GWAS Variants* and NAFLD Risk in the Multi‐ethnic Cohort, all Ethnic Groups Combined
| SNP | CHR | Position† | Gene | Alleles Risk/Ref | Risk Allele Frequency | OR (95% CI)‡ | P |
|---|---|---|---|---|---|---|---|
| rs1260326§ | 2 | 27730940 | GCKR | T/C | 0.37 | 1.16 (1.06‐1.28) | 0.001 |
| rs780094 | 2 | 27741237 | GCKR | T/C | 0.38 | 1.14 (1.05‐1.25) | 0.003 |
| rs13118664§ | 4 | 88239609 | HSD17B13 | A/T | 0.76 | 1.10 (0.99‐1.22) | 0.07 |
| rs9992651 | 4 | 88232510 | HSD17B13 | G/A | 0.76 | 1.10 (0.99‐1.22) | 0.08 |
| rs6834314 | 4 | 88213808 | HSD17B13 | A/G | 0.71 | 1.08 (0.98‐1.19) | 0.11 |
| rs2954021§ | 8 | 126482077 | TRIB2 | A/G | 0.44 | 1.07 (0.98‐1.17) | 0.12 |
| rs4240624§ | 8 | 9184231 | PPP1R3B | G/A | 0.11 | 1.13 (0.95‐1.33) | 0.16 |
| rs10883451§ | 10 | 101924418 | ERLIN1 | T/C | 0.82 | 1.20 (1.06‐1.37) | 0.005 |
| rs1408579 | 10 | 101912194 | ERLIN1 | C/T | 0.82 | 1.20 (1.06‐1.37) | 0.005 |
| rs2862954 | 10 | 101912064 | ERLIN1 | T/C | 0.82 | 1.20 (1.06‐1.37) | 0.005 |
| rs11591741 | 10 | 101976501 | CHUK | G/C | 0.83 | 1.17 (1.03‐1.33) | 0.02 |
| rs11597086 | 10 | 101953705 | CHUK | A/C | 0.84 | 1.17 (1.03‐1.33) | 0.02 |
| rs12784396 | 10 | 102027407 | CWF19L1 | C/T | 0.83 | 1.17 (1.03‐1.33) | 0.02 |
| rs17668255 | 10 | 102000701 | CWF19L1 | C/T | 0.84 | 1.17 (1.02‐1.33) | 0.02 |
| rs17729876 | 10 | 101999746 | CWF19L1 | G/A | 0.84 | 1.17 (1.02‐1.33) | 0.02 |
| rs17668357 | 10 | 102003906 | CWF19L1 | G/C | 0.84 | 1.17 (1.02‐1.33) | 0.02 |
| rs11597390 | 10 | 101861435 | CPN1 | G/A | 0.79 | 1.09 (0.97‐1.23) | 0.16 |
| rs10883437§ | 10 | 101795361 | CPN1 | T/A | 0.64 | 1.05 (0.95‐1.16) | 0.37 |
| rs28929474 | 14 | 94844947 | SERPINA1 | T/C | 0.004 | 1.31 (0.67‐2.37) | 0.40 |
| rs58542926§ | 19 | 19379549 | TM6SF2 | T/C | 0.07 | 1.35 (1.16‐1.57) | 7.84−05 |
| rs4808199§ | 19 | 19545099 | GATAD2A | A/G | 0.24 | 1.15 (1.05‐1.27) | 0.003 |
| rs2228603 | 19 | 19329924 | NCAN | T/C | 0.04 | 1.14 (0.94‐1.39) | 0.18 |
| rs429358§ | 19 | 45411941 | APOE | T/C | 0.85 | 1.08 (0.94‐1.24) | 0.27 |
| rs3747207 | 22 | 44324855 | PNPLA3 | A/G | 0.33 | 1.39 (1.28‐1.52) | 7.54−14 |
| rs738409§ | 22 | 44324727 | PNPLA3 | G/C | 0.33 | 1.39 (1.28‐1.52) | 1.05−13 |
| rs738408 | 22 | 44324730 | PNPLA3 | T/C | 0.33 | 1.39 (1.27‐1.52) | 1.65−13 |
| rs2281135 | 22 | 44332570 | PNPLA3 | A/G | 0.32 | 1.36 (1.25‐1.49) | 3.94−12 |
| rs2896019 | 22 | 44333694 | PNPLA3 | G/T | 0.32 | 1.36 (1.24‐1.48) | 6.96−12 |
| rs2294915 | 22 | 44340904 | PNPLA3 | T/C | 0.34 | 1.35 (1.24‐1.47) | 8.63−12 |
| rs2143571 | 22 | 44391686 | SAMM50 | A/G | 0.33 | 1.20 (1.10‐1.31) | 4.02−05 |
Only prior GWAS SNPs at P < 5 × 10⁻⁸ were included.
Position based on GRCh38.
Adjusted for age, sex, BMI, type 2 diabetes, and PCs 1‐5.
SNPs included in the GRS.
Abbreviations: A, adenine; APOE, apolipoprotein E; C, cytosine; CHR, chromosome; G, guanine; NCAN, neurocan; T, thymine.
When assessing the SNP‐NAFLD associations by ethnicity, of the 30 prior GWAS SNPs, we found the highest number of replicated associations in Latinos, followed by Japanese Americans and Whites, with 13 (43%), 11 (37%), and 5 (17%) replicated SNPs, respectively (Fig. 1 and Supporting Table S1). Only three (10%) and two (7%) SNPs were replicated in Native Hawaiians and African Americans, all in agreement with previous studies. None of the SNP associations showed significant heterogeneity of effects across ethnicity except rs4240624 (P heterogeneity = 0.04). The leading PNPLA3 variants showed similar magnitude of the risk allele associations across five ethnic populations (OR: 1.21‐1.57), although statistically significant in only Whites, Latinos, and Japanese Americans, with the strongest association seen among Latinos. Two SNPs in GCKR (rs1260326 and rs780094) were significantly associated with NAFLD in African Americans and Latinos. Furthermore, rs58542926 (TM6SF2) were also replicated in Japanese Americans (OR = 1.30, 95% CI = 1.06‐1.58), Whites (OR = 1.74; 95% CI = 1.01‐3.00), and Native Hawaiians (OR = 1.73; 95% CI = 1.16‐2.51), but not in Latinos or African Americans. The only significant differences in SNP association across ethnicity was observed for rs4240624 in PPP1R3B: a positive association (OR = 1.36, 95% CI = 1.09‐1.70) in Latinos, but no significant association in other ethnic groups. Of the 20 SNPs replicated in the multiethnic population, 11 were replicated in Latinos, followed by nine in Japanese Americans, four in Whites, two in Native Hawaiians, and two in African Americans.
FIG. 1.
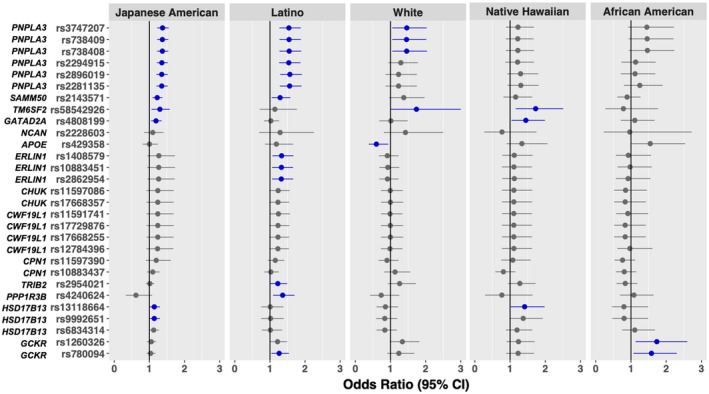
The associations of previously identified GWAS variants and NAFLD risk by ethnicity in the multi‐ethnic cohort. All prior GWAS SNPs at P < 5 × 10⁻⁸, except rs28929474, were included (n = 29 SNPs). Error bars indicate 95% CI; dark blue indicates P < 0.05.
Replication of Non‐GWAS Variants Related to NAFLD Development and Histopathological Features
Of the 17 non‐GWAS variants associated with NAFLD development and histological features, three SNPs (rs17580, rs1800562, and rs6230572) were low‐frequency variants (MAF < 0.05) in Latinos, Native Hawaiians, African Americans and Japanese Americans, while they were relatively more common in Whites (MAF > 0.05).
In the multiethnic population, we confirmed the association with three independent variants including rs4823173 (PNPLA3; OR = 1.37; 95% CI = 1.26‐1.50), rs10401969 (SUGP1 [SURP and G‐patch domain containing 1]; OR = 1.34; 95% CI = 1.17‐1.53), and rs641738 (MBOAT7; OR = 1.16; 95% CI = 1.04‐1.29). Two SNPs (in complete LD in each ethnic population: r2 = 1) of TRIB1 were also replicated (OR = 1.14; 95% CI = 1.04‐1.25) (Table 3).
TABLE 3.
Associations Between Previously Reported Genetic Variants* and NAFLD Risk in the Multi‐ethnic Cohort, All Ethnic Groups Combined
| SNP | CHR | Position† | Gene | Alleles Risk/Ref | Risk Allele Frequency | OR (95% CI)‡ | P |
|---|---|---|---|---|---|---|---|
| rs2642438 | 1 | 220970028 | MARC1 | G/A | 0.76 | 1.07 (0.96‐1.20) | 0.21 |
| rs12137855 | 1 | 219448378 | LYPLAL1 | C/T | 0.89 | 1.04 (0.89‐1.21) | 0.64 |
| rs4374383 | 2 | 112770770 | MERTK | G/A | 0.46 | 1.03 (0.94‐1.13) | 0.54 |
| rs72613567 | 4 | 88231392 | HSD17B13 | T/TA | 0.75 | 1.08 (0.98‐1.20) | 0.11 |
| rs62305723 | 4 | 88231429 | HSD17B13 | G/A | 0.98 | 1.11 (0.82‐1.52) | 0.52 |
| rs1800562 | 6 | 26093141 | HFE | G/A | 0.99 | 1.05 (0.73‐1.56) | 0.81 |
| rs2980888 | 8 | 126507308 | TRIB1 | T/C | 0.25 | 1.14 (1.04‐1.25) | 0.01 |
| rs2954038 | 8 | 126507389 | TRIB1 | C/A | 0.24 | 1.14 (1.04‐1.25) | 0.01 |
| rs1227756 | 10 | 71588504 | COL13A1 | A/G | 0.33 | 1.03 (0.94‐1.13) | 0.53 |
| rs6487679 | 12 | 9371332 | PZP | C/T | 0.15 | 1.09 (0.96‐1.24) | 0.18 |
| rs887304 | 12 | 3757548 | EFCAB4B | T/C | 0.10 | 1.11 (0.95‐1.31) | 0.19 |
| rs17580 | 14 | 94847262 | SERPINA1 | A/T | 0.02 | 1.24 (0.89‐1.69) | 0.18 |
| rs10401969 | 19 | 19407718 | SUGP1 | C/T | 0.11 | 1.34 (1.17‐1.53) | 2.40−05 |
| rs641738§ | 19 | 54676763 | MBOAT7 | T/C | 0.34 | 1.16 (1.04‐1.29) | 0.01 |
| rs11322783 | 19 | 39739153 | IFNL3/4 | C/CT | 0.31 | 1.01 (0.90‐1.13) | 0.86 |
| rs12979860 | 19 | 39738787 | IFNL3/4 | C/T | 0.70 | 1.00 (0.90‐1.12) | 0.98 |
| rs4823173 | 22 | 44328730 | PNPLA3 | A/G | 0.31 | 1.37 (1.26‐1.50) | 2.69−12 |
NAFLD‐associated SNPs reported in prior epidemiologic studies but not in the context of GWAS.
Position based on GRCh38.
Adjusted for age, sex, BMI, type 2 diabetes, and PCs 1‐5.
SNP included in the GRS.
Abbreviations: A, adenine; C, cytosine; CHR, chromosome; COL13A1, collagen type XIII alpha 1 chain; EFCAB4B, EF‐hand calcium binding domain 4B; G, guanine; IFNL3/4, interferon lambda precursor 3/4; MARC1, mitochondrial amidoxime reducing component 1; MERTK, MER proto‐oncogene, tyrosine kinase; PZP, pregnancy zone protein; T, thymine.
When examined by ethnicity, no statistically significant heterogeneity was found across ethnic groups (P heterogeneity > 0.05). Although at least one SNP was replicated in Japanese Americans, Latinos, Whites and Native Hawaiians, none of the 17 SNPs were replicated in African Americans (Supporting Table S2). The association for rs10401969 (SUGP1) was confirmed in Japanese Americans, Whites, and Native Hawaiians (OR: 1.35‐1.69). Several SNPs showed ethnic‐specific associations; rs641738 (MBOAT7; OR = 1.22; 95% CI = 1.04‐1.43) was replicated only in Japanese Americans, whereas TRIB1 SNPs (rs2980888 [OR = 1.25; 95% CI = 1.00‐1.54] and rs2954038 [OR = 1.24; 95% CI = 1.00‐1.54]) were replicated only in Latinos. Furthermore, a low‐frequency SNP in SERPINA1 (rs17580) was replicated among Whites only (OR = 2.26; 95% CI = 1.07‐4.77).
Genetic Risk Score
The median GRS in cases among Japanese Americans, Latinos, Whites, Native Hawaiians, and African Americans was 28.3, 28.6, 22.4, 24.8 and 19.8, respectively, and that in controls was 26.1, 24.8, 20.5, 21.4 and 18.4, respectively (Supporting Fig. S3). We found statistically significant associations of the 11‐SNP GRS with NAFLD risk in the multi‐ethnic population (Table 4 and Fig. 2). Per SD increase in the GRS was associated with 41% increased overall NAFLD risk (95% CI = 1.32‐1.50). Compared with individuals at the bottom 25% of the GRS, those at the top 25% had approximately doubled risk (OR = 2.17; 95% CI = 1.77‐2.67). We observed similar or even stronger associations for GRS in each ethnic group, with the largest magnitude of association observed in Latinos. Each SD increase in GRS was associated with over 50% increased risk in Latinos (OR = 1.52; 95% CI = 1.31‐1.76) (Table 4). Approximately 30%‐44% increased NAFLD risk per SD GRS was observed among Japanese Americans (OR = 1.33; 95% CI = 1.23‐1.45), Native Hawaiians (OR = 1.44; 95% CI = 1.17‐1.77), Whites (OR = 1.35; 95% CI = 1.09‐1.67), and African Americans (OR = 1.30; 95% CI = 1.04‐1.63). Compared with individuals at the bottom 25% of the GRS, individuals at the top 25% had significantly increased NAFLD risk in Latinos (OR = 2.81; 95% CI = 1.87‐4.27), Japanese Americans (OR = 2.18; 95% CI = 1.72‐2.77), Whites (OR = 2.56; 95% CI = 1.39‐4.83), Native Hawaiians (OR = 1.86; 95% CI = 1.07‐3.31), and African Americans (OR = 2.05; 95% CI = 1.05‐4.19) (Fig. 2). The discriminatory accuracy of GRS (treated as per SD increase) for NAFLD risk overall or by ethnicity was modest, with AUC ranging from 0.57 to 0.62 (Supporting Table S3).
TABLE 4.
Associations Between Weighted GRS* and NAFLD and Related Cirrhosis, Overall and by Ethnicity
| Per 1 SD GRS | Controls | All NAFLD | NAFLD Without Cirrhosis | NAFLD With Cirrhosis | P het ‡ | ||||||
|---|---|---|---|---|---|---|---|---|---|---|---|
| Cases | OR (95% CI)† | P | Cases | OR (95% CI)† | P | Cases | OR (95% CI)† | P | |||
| All combined | 8,444 | 1,448 | 1.41 (1.32‐1.50) | 6.59−25 | 1,232 | 1.37 (1.28‐1.46) | 1.29−19 | 216 | 1.67 (1.46‐1.92) | 2.44−13 | 0.03 |
| Japanese American | 2,134 | 838 | 1.33 (1.23‐1.45) | 1.42−11 | 764 | 1.30 (1.19‐1.41) | 2.89−09 | 74 | 1.83 (1.43‐2.33) | 1.14−06 | 0.01 |
| Latino | 1,547 | 261 | 1.52 (1.31‐1.76) | 1.96−08 | 186 | 1.52 (1.29‐1.79) | 7.11−07 | 75 | 1.53 (1.20‐1.95) | 0.001 | 0.80 |
| White | 341 | 180 | 1.35 (1.09‐1.67) | 0.01 | 149 | 1.33 (1.07‐1.65) | 0.01 | 31 | 1.56 (1.04‐2.35) | 0.03 | 0.32 |
| Native Hawaiian | 1,911 | 94 | 1.44 (1.17‐1.77) | 0.0005 | 79 | 1.43 (1.15‐1.79) | 0.001 | 15 | 1.52 (0.95‐2.43) | 0.08 | 0.51 |
| African American | 2,511 | 75 | 1.30 (1.04‐1.63) | 0.02 | 54 | 1.34 (1.03‐1.74) | 0.03 | 21 | 1.18 (0.77‐1.79) | 0.45 | 0.43 |
GRS analyzed as per 1 SD and included 11 SNPs.
Adjusted for age, sex, BMI, type 2 diabetes and PCs 1‐5.
P for heterogeneity in the associations between GRS and NAFLD risk with and without cirrhosis.
FIG. 2.
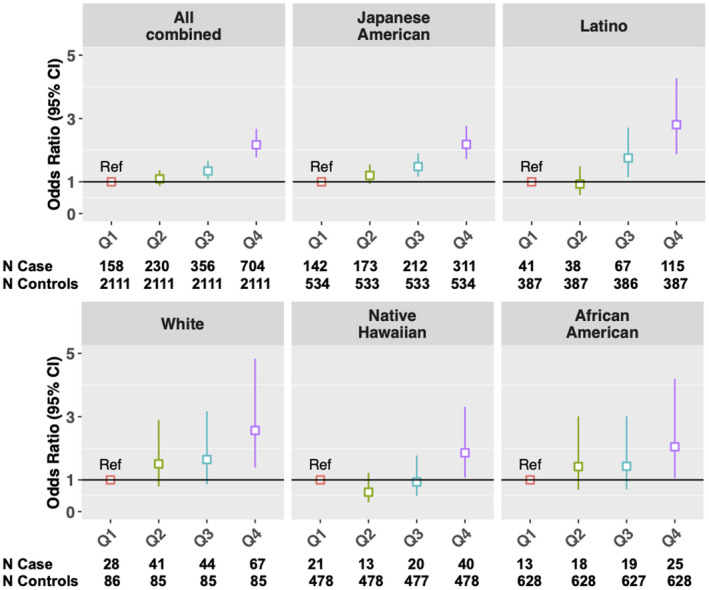
GRS and NAFLD risk in the multi‐ethnic cohort, overall and by ethnicity. GRS was categorized into quartiles: ≤ 25% (Q1; reference group), > 25 to ≤ 50% (Q2), > 50 to ≤ 75% (Q3), and > 75% (Q4); numbers of NAFLD cases and controls in each category are shown at the bottom.
When further examining by NAFLD severity, we observed a stronger association among NAFLD cases with cirrhosis (per SD GRS: OR = 1.67; 95% CI = 1.46‐1.92) than cases without cirrhosis (per SD GRS: OR = 1.37; 95% CI = 1.28‐1.46) (P heterogeneity = 0.03; Table 4). Similarly, compared with individuals at the bottom 25% of the GRS, those with GRS > 75% had over 3‐fold risk of NAFLD with cirrhosis (OR = 3.07; 95% CI = 1.92‐4.93), compared with approximately 2‐fold risk of NAFLD without cirrhosis (OR = 2.03; 95% CI = 1.64‐2.52). When stratifying by ethnicity, a stronger association for NAFLD with cirrhosis (per SD GRS: OR = 1.83; 95% CI = 1.43‐2.33) than NAFLD without cirrhosis (per SD GRS: OR = 1.30; 95% CI = 1.19‐1.41) was found in Japanese American only (P heterogeneity = 0.01), but no such statistically significant difference was observed in the other four ethnic groups (Table 4). Nevertheless, the GRS was still associated with risk of NAFLD with cirrhosis in Whites (per SD GRS: OR = 1.56; 95% CI = 1.04‐2.35) and Latinos (per SD GRS: OR = 1.53; 95% CI = 1.20‐1.95). The discriminatory accuracy of GRS was overall modest in all ethnic groups combined or ethnic‐specific analysis (AUC: 0.54‐0.65); the AUC was slightly higher for NAFLD with cirrhosis than NAFLD without cirrhosis in Japanese Americans and Whites, but it was similar between the cirrhosis and noncirrhosis groups in the other ethnic groups (Supporting Table S3).
Because the association of rs4240624 with NAFLD varied significantly across ethnic groups (Pheterogeneity = 0.04), we performed sensitivity analysis by excluding this SNP from the GRS analysis in the multi‐ethnic population, and the results were very similar. Per SD increase in GRS was associated with 41% increased risk (95% CI = 1.32‐1.50). Similar association was also observed when GRS was analyzed using quartiles (top 25% vs. bottom 25%: OR = 2.18; 95% CI = 1.78‐2.69). In ethnic‐specific analysis, we performed sensitivity analysis by using ethnic‐specific effect estimates (weights) for rs4240624, while keeping multiethnic effect estimates for the remaining 10 SNPs, and the results were similar. Finally, using the unweighted approach (i.e., sum of the risk alleles from the 11 SNPs) in the GRS analysis yielded similar results for the multi‐ethnic population and ethnic‐specific analyses (Supporting Fig. S4).
When assessing whether the GRS‐NAFLD association varied by age, sex, BMI or type 2 diabetes, we observed no statistically significant heterogeneity for all of the variables (P heterogeneity > 0.56) except for sex (P heterogeneity = 0.003) (Supporting Table S4). Stronger association was observed among women (top 25% vs. bottom 25%: OR = 2.51; 95% CI = 1.90‐3.35) than in men (OR = 1.73; 95% CI = 1.30‐2.34).
Discussion
In this study, we replicated NAFLD variants in PNPLA3, HSD17B13, TM6SF2, GATAD2A, GCKR, SUGP1, MBOAT7, TRIB1, SAMM50, and ERLIN1‐CHUK‐CWF19L1 gene cluster identified from European or East Asian studies in the U.S. multi‐ethnic populations. Furthermore, GRS developed from these variants was significantly associated with NAFLD risk in Latinos, Japanese Americans, Native Hawaiians, Whites, and African Americans. The risk associated with GRS was stronger among NAFLD with cirrhosis.
One of the most important genetic variants for NAFLD, rs738409 (Ile148Met) in PNPLA3, was first identified in GWASs of hepatic fat content( 11, 12 ) and circulating liver enzymes( 13 ); subsequent GWASs of NAFLD further confirmed the association. The G allele of rs738409 has been shown to reduce lipase activity, resulting in hepatic fat accumulation.( 38 ) Evidence from experimental studies suggests that rs738409 increases NAFLD risk through a molecular mechanism involving accumulation of the variant protein (148Met) on intracellular lipid droplets.( 39 ) We confirmed the association of rs738409 with NAFLD risk in Latinos, Japanese Americans and Whites, and found it to be suggestive in African Americans, but not present in Native Hawaiians. A recent GWAS of percent liver fat among MEC participants found the G allele to be significantly associated with higher liver fat content in Whites, Latino, and Japanese Americans,( 40 ) which is consistent with our findings. The magnitude of association in the MEC Whites and Japanese Americans was similar to those reported in GWASs conducted among European ancestry( 16, 20 ) and Japanese in Japan.( 17, 18 ) Previous replication studies in Hispanics and African Americans showed similar findings.( 24, 25 ) In our study, the G allele is most prevalent in Japanese Americans (allele frequency: 0.47) and Latinos (0.46), followed by Whites and Native Hawaiians (0.26), but less frequent in African Americans (0.15), consistent with prior reports.( 12 ) The lower G allele frequency and smaller number of African‐American cases (n = 75) may partially explain the weaker association observed in this population (Supporting Fig. S5).
Another key genetic variant for NAFLD, rs58542926 (c.449C > T encodes Glu167Lys) in TM6SF2, was replicated in Japanese Americans, Native Hawaiians, and Whites in this study, but not in Latinos or African Americans. A GWAS of liver‐biopsy confirmed NAFLD in Whites and an exome‐wide association study in African Americans, Latinos, and Whites reported that the T allele of rs58542926 was associated with 61% increased NAFLD risk among Whites( 16 ) and with increased circulating alanine aminotransferase (ALT) levels and lower levels of total and low‐density cholesterol.( 21 ) A recent GWAS in the U.K. biobank confirmed the association of T allele with elevated circulating ALT and reported higher hepatic fat content associated with this variant.( 10 ) Prior GWASs conducted among Japanese in Japan found no association with rs58542926.( 17, 18, 19 ) In contrast, we found significant association in our Japanese Americans, and for the first time reported a similar magnitude of the association in Native Hawaiians as seen in Whites. The T allele frequency is low across ethnic groups, ranging from 4% in African Americans to 13% in Native Hawaiians. In humans, the T allele of rs58542926 is associated with significantly lower TM6SF2 protein expression in liver.( 41 ) In mouse studies, selective knockdown of Tm6sf2 expression in liver was associated with increased hepatic triacylglycerol content and decreased very‐low‐density lipoprotein secretion.( 21 )
Two correlated SNPs in GCKR (rs1260326 and rs780094; r2 : 0.69~0.92 across ethnic populations) were replicated in our multi‐ethnic population as well as in Latinos and African Americans. Although these two variants were initially reported to be associated with NAFLD risk in Japanese,( 19 ) they were not replicated in Japanese Americans in this study. The T allele of rs1260326 was associated with 25% and 64% increased NAFLD risk in Latinos and African Americans, respectively, which was comparable to previous findings in Japanese( 19 ) and African Americans.( 24 ) The T allele of rs1260326 is much less common in African American (0.16), compared with that in the other four ethnic populations (0.36~0.55). The nonsynonymous variant of GCKR (rs1260326) encodes Pro446Leu; the T allele of this variant was shown to reduce the ability of glucokinase regulatory protein, encoded by GCKR, to inhibit glucokinase.( 42 ) The corresponding increased glucokinase activity then leads to lower blood glucose (due to higher hepatic uptake) but favors hepatic fat accumulation.( 22 )
Two variants of HSD17B13 (rs13118664 and rs9992651) identified in prior GWASs among predominantly Whites were also replicated in this multiethnic population; however, it was only significant in Japanese Americans and suggestive in Native Hawaiians. SNPs rs13118664 and rs9992651 (LD: r2 = 1) were first identified in Whites, demonstrating 26% decreased NAFLD risk among individuals carrying the A allele of rs9992651 or the T allele of rs13118664.( 16 ) We found a similar, although weaker, association in Japanese Americans (OR = 0.87; 95% CI = 0.77‐0.99). The A allele of rs9992651 is slightly more common among Japanese Americans in this study (0.30) than in Whites (0.23). Another protein‐truncating variant in HSD17B13 (rs72613567; T > TA insertion), first identified in exome sequencing among persons of European ancestry,( 43 ) was also replicated in Japanese Americans in our study.
Several genetic variants related to NAFLD histopathological features, including rs641738 in MBOAT7, were also replicated in our study. This SNP was first identified in GWAS as a risk locus for alcohol‐associated cirrhosis( 44 ) and subsequently was associated with higher hepatic triglyceride content and increased risk of fibrosis in Whites.( 45 ) However, the association of rs641738 with NAFLD was not observed in Whites in our study, possibly due to the relatively small number of NAFLD cases among Whites; instead, it was associated with increased risk of NAFLD in Japanese Americans. Finally, a group of SNPs in the ERLIN1‐CHUK‐CWF19L1 gene cluster on chromosome 10 were replicated in Latinos, despite initially identified among Whites.( 9 )
We generated an 11‐SNP GRS to assess the combined effect of these variants on NAFLD risk across and within each ethnic group. We found statistically significant associations of GRS with NAFLD in the multi‐ethnic population as well as in all ethnic groups. In contrast to previous studies that used only a few selected SNPs to build the GRS,( 26 ) our study conducted a comprehensive assessment of all prior GWAS SNPs and selected independent variants to be included in the GRS analysis. Despite significant association between GRS and NAFLD, the AUCs ranged from 0.57 in African Americans to 0.62 in Latinos. Only a few studies so far have evaluated GRS for NAFLD in non‐White populations, and they showed a similar range in discrimination capacity. In a study conducted among severely obese (BMI ≥ 40 kg/m2) Mexicans (n = 130), a four‐SNP weighted GRS (derived from SNPs in PNPLA3, GCKR, PPP1R3B, and LYPLAL1 [lysophospholipase like 1]) was significantly associated with hepatic fat content and higher ALT levels; the AUC for their GRS was 0.56.( 46 ) In a large study of liver biopsy–confirmed NAFLD in Japanese (n = 902 cases), a three‐SNP unweighted GRS (derived from SNPs in PNPLA3, GCKR, and GATAD2A) was significantly associated with increased NAFLD risk (AUC = 0.65; 95% CI = 0.63‐0.67).( 19 ) A GRS using four SNPs in PNPLA3, GCKR, TM6SF2, and MBOAT7 was also significantly associated with NAFLD risk in Whites (3‐fold increased risk among individuals at the top tertile of the GRS); however, no AUC information was provided.( 47 ) Additional large studies in multiethnic populations are warranted to further determine the discrimination capacity of the GRS for NAFLD.
Finally, results in this study suggest that the 11‐SNP GRS may also be associated with NAFLD progression, as a stronger association was observed among NAFLD with cirrhosis compared to those without cirrhosis. Again, only a few prior studies examined the combined effects of NAFLD‐related SNPs on disease progression or severity, with a focus on SNPs in PNPLA3 and TM6SF2. A recent study reported that a three‐SNP unweighted GRS (PNPLA3, TM6SF2, and HSD17B13) was associated with risk of cirrhosis (both NAFLD and alcohol‐related) in a meta‐analysis of population‐based studies in Whites: Compared to individuals without any risk allele (i.e., score = 0), those carrying any three risk alleles (i.e., score = 3) had over 2‐fold increased risk of cirrhosis (OR = 3.1; 95% CI = 2.7‐3.5).( 48 ) Another study conducted in Whites also showed that per‐unit increase in a three‐SNP unweighted GRS (PNPLA3, TM6SF2, and KLF6) was associated with risk of NASH cirrhosis (OR = 3.62; 95% CI = 1.63‐9.69).( 49 )
Furthermore, among studies conducted in non‐White populations, a two‐SNP GRS (PNPLA3 and TM6SF2) was associated with risk of advanced fibrosis (OR = 1.61; 95% CI = 1.19‐2.17) in Koreans,( 50 ) and a four‐SNP weighted GRS (PNPLA3, GCKR, PPP1R3B, and LYPLAL1) was associated with risk of advanced steatosis stage or NASH( 46 ) (the highest vs. lowest tertile OR = 2.55; 95% CI = 1.02‐6.22) in Mexicans of extreme obesity.( 46 ) Overall, our findings, particularly results in Whites, Japanese Americans and Latinos, were consistent with prior studies. However, there has been a lack of such studies conducted in African Americans or Native Hawaiians.
Our study has several strengths. We leveraged a large and well‐characterized cohort of ethnically diverse population; this replicate GRS study of NAFLD risk variants is in a multi‐ethnic population. Our ethnic‐specific analysis yields replication estimates and shows transportability of GWAS findings for multiple ethnic groups, including Latinos and Japanese Americans who have notably high NAFLD prevalence, and African Americans and Native Hawaiians who have not been well‐studied in the context of genetics. Remarkably, several GWAS variants, including those key genetic determinants for NAFLD, showed similar associations across ethnic groups. Limitations of the study include the identification of NAFLD cases using ICD codes from Medicare claims, which may lead to selection of NAFLD cases with more severe disease. Because we did not have imaging data, participants with undiagnosed NAFLD might have been inadvertently included in the control group, which may lead to biased associations. However, the associations would have been attenuated in this case. Furthermore, for the mostly investigated locus PNPLA3, our results were consistent with prior studies, which used liver biopsy or imaging data for NAFLD diagnosis.( 11, 12, 16, 19, 40 ) Another limitation is the limited number of NAFLD cases in certain ethnic groups, including African Americans and Native Hawaiians; thus, despite the observed significant association of the GRS with NAFLD risk in African Americans and Native Hawaiians, respectively, results need to be validated in future studies with larger sample size in these ethnic groups. Furthermore, data on several clinical variables related to NAFLD development and/or progression, such as homeostasis model assessment of insulin resistance or liver enzymes (e.g., ALT, aspartate aminotransferase) were not available in this study, thus not allowing us to adjust for these variables in the analysis. Finally, due to the lack of validation of the GRS (primarily because of the lack of external multi‐ethnic study population), the GRS results need to be further validated in future multiethnic populations.
In conclusion, in this ethnically diverse cohort we replicated several genetic variants for NAFLD and showed the utility of GRS based on the risk alleles for NAFLD risk stratification in multiple ethnic groups. Our findings support the notion that adding GRS to the risk prediction model based on clinical and other risk factors may improve risk prediction for NAFLD. Furthermore, the GRS tool may be useful to screen large populations, provide lifestyle modification advice to patients genetically predisposed, and potentially in long‐term studies, define the impact on liver‐related mortality and liver cancer development.
Supporting information
Supplementary Material
Supported by the National Cancer Institute (R01CA228589 to V.W.S. and U01CA164973 to L.L.M.).
Potential conflict of interest: Dr. Noureddin owns stock in Anaetos and Rivus Pharma. He owns stock in and received grants from Viking. He advises and received grants from Gilead and Novartis. He advises 89 Bio, Intercept, Pfizer, Novo Nordisk, Blade, EchoSens, Fractyl, Terns, OWL, Siemens, Roche Diagnostic, and Abbott. He received grants from Allergan, BMS, Galectin, Genfit, Conatus, Enanta, Madrigal, Shire, and Zydus.
References
Author names in bold designate shared co‐first authorship.
- 1.Wree A, Broderick L, Canbay A, Hoffman HM, Feldstein AE. From NAFLD to NASH to cirrhosis‐new insights into disease mechanisms. Nat Rev Gastroenterol Hepatol 2013;10:627‐636. [DOI] [PubMed] [Google Scholar]
- 2.Younossi ZM, Koenig AB, Abdelatif D, Fazel Y, Henry L, Wymer M. Global epidemiology of nonalcoholic fatty liver disease—meta‐analytic assessment of prevalence, incidence, and outcomes. Hepatology 2016;64:73‐84. [DOI] [PubMed] [Google Scholar]
- 3.Pais R, Barritt AS, Calmus Y, Scatton O, Runge T, Lebray P, et al. NAFLD and liver transplantation: current burden and expected challenges. J Hepatol 2016;65:1245‐1257. [DOI] [PMC free article] [PubMed] [Google Scholar]
- 4.Paradis V, Zalinski S, Chelbi E, Guedj N, Degos F, Vilgrain V, et al. Hepatocellular carcinomas in patients with metabolic syndrome often develop without significant liver fibrosis: a pathological analysis. Hepatology 2009;49:851‐859. [DOI] [PubMed] [Google Scholar]
- 5.Estes C, Razavi H, Loomba R, Younossi Z, Sanyal AJ. Modeling the epidemic of nonalcoholic fatty liver disease demonstrates an exponential increase in burden of disease. Hepatology 2018;67:123‐133. [DOI] [PMC free article] [PubMed] [Google Scholar]
- 6.Rich NE, Oji S, Mufti AR, Browning JD, Parikh ND, Odewole M, et al. Racial and ethnic disparities in nonalcoholic fatty liver disease prevalence, severity, and outcomes in the United States: a systematic review and meta‐analysis. Clin Gastroenterol Hepatol 2018;16:198‐210.e192. [DOI] [PMC free article] [PubMed] [Google Scholar]
- 7.Setiawan VW, Stram DO, Porcel J, Lu SC, Le Marchand L, Noureddin M. Prevalence of chronic liver disease and cirrhosis by underlying cause in understudied ethnic groups: the multiethnic cohort. Hepatology 2016;64:1969‐1977. [DOI] [PMC free article] [PubMed] [Google Scholar]
- 8.DiStefano JK, Kingsley C, Craig Wood G, Chu X, Argyropoulos G, Still CD, et al. Genome‐wide analysis of hepatic lipid content in extreme obesity. Acta Diabetol 2015;52:373‐382. [DOI] [PMC free article] [PubMed] [Google Scholar]
- 9.Feitosa MF, Wojczynski MK, North KE, Zhang Q, Province MA, Carr JJ, et al. The ERLIN1‐CHUK‐CWF19L1 gene cluster influences liver fat deposition and hepatic inflammation in the NHLBI Family Heart Study. Atherosclerosis 2013;228:175‐180. [DOI] [PMC free article] [PubMed] [Google Scholar]
- 10.Parisinos CA, Wilman HR, Thomas EL, Kelly M, Nicholls RC, McGonigle J, et al. Genome‐wide and Mendelian randomisation studies of liver MRI yield insights into the pathogenesis of steatohepatitis. J Hepatol 2020;73:241‐251. [DOI] [PMC free article] [PubMed] [Google Scholar]
- 11.Speliotes EK, Yerges‐Armstrong LM, Wu J, Hernaez R, Kim LJ, Palmer CD, et al. Genome‐wide association analysis identifies variants associated with nonalcoholic fatty liver disease that have distinct effects on metabolic traits. PLoS Genet 2011;7:e1001324. [DOI] [PMC free article] [PubMed] [Google Scholar]
- 12.Romeo S, Kozlitina J, Xing C, Pertsemlidis A, Cox D, Pennacchio LA, et al. Genetic variation in PNPLA3 confers susceptibility to nonalcoholic fatty liver disease. Nat Genet 2008;40:1461‐1465. [DOI] [PMC free article] [PubMed] [Google Scholar]
- 13.Chambers JC, Zhang W, Sehmi J, Li X, Wass MN, Van der Harst P, et al. Genome‐wide association study identifies loci influencing concentrations of liver enzymes in plasma. Nat Genet 2011;43:1131‐1138. [DOI] [PMC free article] [PubMed] [Google Scholar]
- 14.Prins BP, Kuchenbaecker KB, Bao Y, Smart M, Zabaneh D, Fatemifar G, et al. Genome‐wide analysis of health‐related biomarkers in the UK Household Longitudinal Study reveals novel associations. Sci Rep 2017;7:11008. [DOI] [PMC free article] [PubMed] [Google Scholar]
- 15.Yuan X, Waterworth D, Perry JRB, Lim N, Song K, Chambers JC, et al. Population‐based genome‐wide association studies reveal six loci influencing plasma levels of liver enzymes. Am J Hum Genet 2008;83:520‐528. [DOI] [PMC free article] [PubMed] [Google Scholar]
- 16.Anstee QM, Darlay R, Cockell S, Meroni M, Govaere O, Tiniakos D, et al. Genome‐wide association study of non‐alcoholic fatty liver and steatohepatitis in a histologically characterised cohort. J Hepatol 2020;73:505‐515. [DOI] [PubMed] [Google Scholar]
- 17.Kawaguchi T, Sumida Y, Umemura A, Matsuo K, Takahashi M, Takamura T, et al. Genetic polymorphisms of the human PNPLA3 gene are strongly associated with severity of non‐alcoholic fatty liver disease in Japanese. PLoS One 2012;7:e38322. [DOI] [PMC free article] [PubMed] [Google Scholar]
- 18.Kitamoto T, Kitamoto A, Yoneda M, Hyogo H, Ochi H, Nakamura T, et al. Genome‐wide scan revealed that polymorphisms in the PNPLA3, SAMM50, and PARVB genes are associated with development and progression of nonalcoholic fatty liver disease in Japan. Hum Genet 2013;132:783‐792. [DOI] [PubMed] [Google Scholar]
- 19.Kawaguchi T, Shima T, Mizuno M, Mitsumoto Y, Umemura A, Kanbara Y, et al. Risk estimation model for nonalcoholic fatty liver disease in the Japanese using multiple genetic markers. PLoS One 2018;13:e0185490. [DOI] [PMC free article] [PubMed] [Google Scholar]
- 20.Namjou B, Lingren T, Huang Y, Parameswaran S, Cobb BL, Stanaway IB, et al. GWAS and enrichment analyses of non‐alcoholic fatty liver disease identify new trait‐associated genes and pathways across eMERGE Network. BMC Med 2019;17:135. [DOI] [PMC free article] [PubMed] [Google Scholar]
- 21.Kozlitina J, Smagris E, Stender S, Nordestgaard BG, Zhou HH, Tybjærg‐Hansen A, et al. Exome‐wide association study identifies a TM6SF2 variant that confers susceptibility to nonalcoholic fatty liver disease. Nat Genet 2014;46:352‐356. [DOI] [PMC free article] [PubMed] [Google Scholar]
- 22.Krawczyk M, Liebe R, Lammert F. Toward genetic prediction of nonalcoholic fatty liver disease trajectories: PNPLA3 and beyond. Gastroenterology 2020;158:1865‐1880.e1861. [DOI] [PubMed] [Google Scholar]
- 23.Emdin CA, Haas ME, Khera AV, Aragam K, Chaffin M, Klarin D, et al. A missense variant in Mitochondrial Amidoxime Reducing Component 1 gene and protection against liver disease. PLoS Genet 2020;16:e1008629. [DOI] [PMC free article] [PubMed] [Google Scholar]
- 24.Palmer ND, Musani SK, Yerges‐Armstrong LM, Feitosa MF, Bielak LF, Hernaez R, et al. Characterization of European ancestry nonalcoholic fatty liver disease‐associated variants in individuals of African and Hispanic descent. Hepatology 2013;58:966‐975. [DOI] [PMC free article] [PubMed] [Google Scholar]
- 25.Wagenknecht LE, Palmer ND, Bowden DW, Rotter JI, Norris JM, Ziegler J, et al. Association of PNPLA3 with non‐alcoholic fatty liver disease in a minority cohort: the Insulin Resistance Atherosclerosis Family Study. Liver Int 2011;31:412‐416. [DOI] [PMC free article] [PubMed] [Google Scholar]
- 26.Vespasiani‐Gentilucci U, Gallo P, Dell'Unto C, Volpentesta M, Antonelli‐Incalzi R, Picardi A. Promoting genetics in non‐alcoholic fatty liver disease: combined risk score through polymorphisms and clinical variables. World J Gastroenterol 2018;24:4835‐4845. [DOI] [PMC free article] [PubMed] [Google Scholar]
- 27.Popejoy AB, Fullerton SM. Genomics is failing on diversity. Nature 2016;538:161‐164. [DOI] [PMC free article] [PubMed] [Google Scholar]
- 28.Bustamante CD, Burchard EG, De la Vega FM. Genomics for the world. Nature 2011;475:163‐165. [DOI] [PMC free article] [PubMed] [Google Scholar]
- 29.Martin AR, Gignoux CR, Walters RK, Wojcik GL, Neale BM, Gravel S, et al. Human demographic history impacts genetic risk prediction across diverse populations. Am J Hum Genet 2017;100:635‐649. [DOI] [PMC free article] [PubMed] [Google Scholar]
- 30.Rosenberg NA, Huang L, Jewett EM, Szpiech ZA, Jankovic I, Boehnke M. Genome‐wide association studies in diverse populations. Nat Rev Genet 2010;11:356‐366. [DOI] [PMC free article] [PubMed] [Google Scholar]
- 31.Kolonel LN, Henderson BE, Hankin JH, Nomura AMY, Wilkens LR, Pike MC, et al. A multiethnic cohort in Hawaii and Los Angeles: baseline characteristics. Am J Epidemiol 2000;151:346‐357. [DOI] [PMC free article] [PubMed] [Google Scholar]
- 32.Setiawan VW, Virnig BA, Porcel J, Henderson BE, Le Marchand L, Wilkens LR, et al. Linking data from the Multiethnic Cohort Study to Medicare data: linkage results and application to chronic disease research. Am J Epidemiol 2015;181:917‐919. [DOI] [PMC free article] [PubMed] [Google Scholar]
- 33.Noureddin M, Zelber‐Sagi S, Wilkens LR, Porcel J, Boushey CJ, Le Marchand L, et al. Diet associations with nonalcoholic fatty liver disease in an ethnically diverse population: the multiethnic cohort. Hepatology 2020;71:1940‐1952. [DOI] [PMC free article] [PubMed] [Google Scholar]
- 34.Chalasani N, Guo X, Loomba R, Goodarzi MO, Haritunians T, Kwon S, et al. Genome‐wide association study identifies variants associated with histologic features of nonalcoholic fatty liver disease. Gastroenterology 2010;139:1567‐1576. [DOI] [PMC free article] [PubMed] [Google Scholar]
- 35.Kitamoto A, Kitamoto T, Nakamura T, Ogawa Y, Yoneda M, Hyogo H, et al. Association of polymorphisms in GCKR and TRIB1 with nonalcoholic fatty liver disease and metabolic syndrome traits. Endocr J 2014;61:683‐689. [DOI] [PubMed] [Google Scholar]
- 36.Trépo E, Valenti L. Update on NAFLD genetics: From new variants to the clinic. J Hepatol 2020;72:1196‐1209. [DOI] [PubMed] [Google Scholar]
- 37.Conomos MP, Miller MB, Thornton TA. Robust inference of population structure for ancestry prediction and correction of stratification in the presence of relatedness. Genet Epidemiol 2015;39:276‐293. [DOI] [PMC free article] [PubMed] [Google Scholar]
- 38.He S, McPhaul C, Li JZ, Garuti R, Kinch L, Grishin NV, et al. A sequence variation (I148M) in PNPLA3 associated with nonalcoholic fatty liver disease disrupts triglyceride hydrolysis. J Biol Chem 2010;285:6706‐6715. [DOI] [PMC free article] [PubMed] [Google Scholar]
- 39.BasuRay S, Wang Y, Smagris E, Cohen JC, Hobbs HH. Accumulation of PNPLA3 on lipid droplets is the basis of associated hepatic steatosis. Proc Natl Acad Sci U S A 2019;116:9521‐9526. [DOI] [PMC free article] [PubMed] [Google Scholar]
- 40.Park SL, Li Y, Sheng X, Hom V, Xia L, Zhao K, et al. Genome‐wide association study of liver fat: the multiethnic cohort adiposity phenotype study. Hepatol Commun 2020;4:1112‐1123. [DOI] [PMC free article] [PubMed] [Google Scholar]
- 41.Sookoian S, Castaño GO, Scian R, Mallardi P, Fernández Gianotti T, Burgueño AL, et al. Genetic variation in transmembrane 6 superfamily member 2 and the risk of nonalcoholic fatty liver disease and histological disease severity. Hepatology 2015;61:515‐525. [DOI] [PubMed] [Google Scholar]
- 42.Agius L. Hormonal and metabolite regulation of hepatic glucokinase. Annu Rev Nutr 2016;36:389‐415. [DOI] [PubMed] [Google Scholar]
- 43.Abul‐Husn NS, Cheng X, Li AH, Xin Y, Schurmann C, Stevis P, et al. A protein‐truncating HSD17B13 variant and protection from chronic liver disease. N Engl J Med 2018;378:1096‐1106. [DOI] [PMC free article] [PubMed] [Google Scholar]
- 44.Buch S, Stickel F, Trépo E, Way M, Herrmann A, Nischalke HD, et al. A genome‐wide association study confirms PNPLA3 and identifies TM6SF2 and MBOAT7 as risk loci for alcohol‐related cirrhosis. Nat Genet 2015;47:1443‐1448. [DOI] [PubMed] [Google Scholar]
- 45.Mancina RM, Dongiovanni P, Petta S, Pingitore P, Meroni M, Rametta R, et al. The MBOAT7‐TMC4 variant rs641738 increases risk of nonalcoholic fatty liver disease in individuals of European descent. Gastroenterology 2016;150:1219‐1230.e1216. [DOI] [PMC free article] [PubMed] [Google Scholar]
- 46.León‐Mimila P, Vega‐Badillo J, Gutiérrez‐Vidal R, Villamil‐Ramírez H, Villareal‐Molina T, Larrieta‐Carrasco E, et al. A genetic risk score is associated with hepatic triglyceride content and non‐alcoholic steatohepatitis in Mexicans with morbid obesity. Exp Mol Pathol 2015;98:178‐183. [DOI] [PubMed] [Google Scholar]
- 47.Di Costanzo A, Belardinilli F, Bailetti D, Sponziello M, D’Erasmo L, Polimeni L, et al. Evaluation of polygenic determinants of non‐alcoholic fatty liver disease (NAFLD) by a candidate genes resequencing strategy. Sci Rep 2018;8:3702. [DOI] [PMC free article] [PubMed] [Google Scholar]
- 48.Gellert‐Kristensen H, Richardson TG, Davey Smith G, Nordestgaard BG, Tybjaerg‐Hansen A, Stender S. Combined effect of PNPLA3, TM6SF2, and HSD17B13 variants on risk of cirrhosis and hepatocellular carcinoma in the general population. Hepatology 2020;72:845‐856. [DOI] [PubMed] [Google Scholar]
- 49.Vespasiani‐Gentilucci U, Dell’Unto C, De Vincentis A, Baiocchini A, Delle Monache M, Cecere R, et al. Combining genetic variants to improve risk prediction for NAFLD and its progression to cirrhosis: a proof of concept study. Can J Gastroenterol Hepatol 2018;2018:7564835. [DOI] [PMC free article] [PubMed] [Google Scholar]
- 50.Koo BK, Joo SK, Kim D, Bae JM, Park JH, Kim JH, et al. Additive effects of PNPLA3 and TM6SF2 on the histological severity of non‐alcoholic fatty liver disease. J Gastroenterol Hepatol 2018;33:1277‐1285. [DOI] [PubMed] [Google Scholar]
Associated Data
This section collects any data citations, data availability statements, or supplementary materials included in this article.
Supplementary Materials
Supplementary Material