

Abstract
Recent studies have demonstrated that multivariate machine learning algorithms applied to human functional MRI data can decode information segregated in cortical columns, despite the voxel-size being large relative to the width of columns. The mechanism by which low spatial-resolution imaging decodes information represented in a fine-scale organization is not clear.
To investigate mechanisms underlying decoding signals we employed high-resolution Gradient-Echo BOLD functional MRI of visual area V1. We show that in addition to fine-scale organizations, coarse-scale structures also convey discriminative power for decoding the stimulated eye. Discriminative power is conveyed by both macroscopic blood vessels and gray matter regions. We hypothesize that draining regions biased towards ocular-dominance columns with preference to one eye underlie the functional ocular-dominance specificity of vessels. Our findings indicate that coarse-scale structures and macroscopic blood vessels contribute to decoding of features represented at the fine scale of cortical columns.
Keywords: functional MRI, fMRI, Ultra high-field, 7 Tesla, High-resolution, Multivariate analysis, Decoding, Classification, Visual cortex, Striate cortex, V1, Cortical columns, Ocular dominance
Introduction
Recent studies have demonstrated the ability of multivariate machine learning algorithms applied to Gradient-Echo (GE) Blood Oxygenation Level Dependent (BOLD) functional-MRI (fMRI) data obtained at 3 Tesla to decode visual stimuli (Haxby et al., 2001; Kamitani and Tong, 2005; Haynes and Rees, 2005). These algorithms decoded information segregated in cortical columns, e.g. ocular dominance, orientation and direction of motion. This result seems to be surprising given the large size of the voxels relative to the width of columns in humans (voxel size, 3×3×3 mm3; width of columns, 1 mm or less), and the relatively wide point-spread function of GE BOLD fMRI signals at 3 Tesla (~3.5 mm; Engel et al., 1997; Parkes et al., 2005; Shmuel et al., 2007a). The mechanism by which low resolution imaging decodes information represented at a fine scale relative to the voxel size is not clear. Biased sampling of cortical columns by the large voxels has been hypothesized (Kamitani and Tong, 2005, 2006; Haynes and Rees, 2006; Kriegeskorte et al., 2006). Biased sampling (also termed the ‘hyperacuity’ mechanism, and henceforth ‘voxel biased sampling’) occurs due to the specific position that a large voxel takes within a fine columnar organization with local variations, even if the overall preferences represented by the columns are distributed equally across the investigated cortical region. Alternatively, draining regions that cover cortical maps and columns non-homogeneously could cause selective responses of their corresponding blood vessels (Kamitani and Tong, 2005, 2006; Kriegeskorte et al., 2006). In this scenario, henceforth termed ‘biased draining regions’, selective signals from macroscopic blood vessels can be captured by large voxels, and therefore could contribute to decoding of stimuli coded at the resolution of cortical columns.
The hypothesized mechanism of voxel biased sampling has been challenged by Op de Beeck (2009). According to Op de Beeck (2009), if multivariate analyses pick up fine-scale functional organizations, it can be expected that spatial smoothing will degrade their ability to decode signals from such organizations. The author tested this prediction using fMRI patterns of activity obtained from the primary visual cortex in response to oriented gratings. It was found that smoothing did not decrease the sensitivity of multivariate analyses to decode the orientation of grating stimuli. Op de Beeck (2009) concludes that the mechanism of decoding relies on coarse-scale spatial organization, even when the decoded information is represented at the fine scale of cortical columns. The ‘biased draining regions’ mechanism described above, suggesting that macroscopic blood vessels may contribute to fMRI-based decoding, is of a scale coarser than the fine scale of cortical columns. Selective signals from macroscopic blood vessels are therefore expected to be more resilient to spatial smoothing.
Human visual area V1 includes a fine-scale functional organization according to the stimulated eye (Horton et al., 1990; Goodyear and Menon, 2001; Cheng et al., 2001; Yacoub et al., 2007). The width of each ocular-dominance column (ODC) is approximately 1 mm; the average cycle of left- and right-eye ODCs is approximately 2 mm. The present study is aimed at testing whether macroscopic vessels and coarse structures in human V1 carry functional signals that can be used for decoding the stimulated eye. Preliminary results were presented previously (Shmuel et al., 2007b).
Methods
Data acquisition.
High-resolution (acquired at 0.5×0.5×3 mm3; reconstructed at 0.25×0.25×3 mm3) GE fMRI data were obtained at 7 Tesla from 3 subjects (data from Yacoub et al. 2007 were reanalyzed). Each scan included an epoch of baseline in which a blank gray image was presented, and alternating epochs of left- or right-eye stimulation. Ocular dominance columns (ODC) were imaged in one slice overlapping the upper or lower bank of the calcarine sulcus. The slice was selected to be parallel to- and maximally overlapping with a flat gray matter region in V1. For each subject, a region of interest (ROI) was selected that delineated the flat gray matter region within the slice. Based on anatomical images, the ROI was selected to cover virtually no white matter. More detailed descriptions of the methods used for data acquisition can be found in Yacoub et al. (2007).
Blood vessels and gray matter regions.
Voxels were sorted according to a continuous rank of features of gray matter or blood vessels regions. First, voxels were rank ordered separately according to the inverse of their GE signal and their response amplitude (see previous use of these criteria for identifying macroscopic blood vessels by Menon et al. (1993), Kim et al. (1994) Cheng et al. (2001), Shmuel et al. (2007a) and Olman et al. (2007)). In a second step, the voxel-wise rank was averaged over these 2 criteria. The result indicated the likelihood that a voxel resided in a blood vessel (high average rank) or in gray matter (low average rank).
Fisher Score.
The Fisher Score for discriminating the stimulated eye was computed for signals sampled voxel-wise from ODCs within gray matter and from blood vessels, in order to assess the discriminative power of signals within the two types of regions. The Fisher Score, also termed the Fisher Criterion, is used in the more general framework of Fisher’s linear discriminant. It is defined as the ratio of the between-class variance to the total within-class variance,
where μi and stand for the mean and variance of samples in class i. Here, i = {1, 2}, representing the distribution of intensities in a voxel associated with stimulation of left- and right-eye, respectively.
Results
Figure 1A presents ODC maps obtained from three subjects, S1, S2 and S3, using GE BOLD fMRI. Note that the relatively large red / blue regions reflect the ocular dominance of the underlying neurons only with partial accuracy. As we reported previously (Yacoub et al., 2007), Hahn Spin-Echo based functional imaging resolved a pattern of ODCs that was finer and more consistent with previous post-mortem studies (Horton et al., 1990) compared to GE imaging. In spite of the superiority of Hahn Spin-Echo in resolving the pattern of ODCs, in the current analysis we focus on GE BOLD fMRI which has been used for decoding at 3 Tesla.
Fig. 1. Macroscopic blood-vessels in V1 carry information on the stimulated eye.
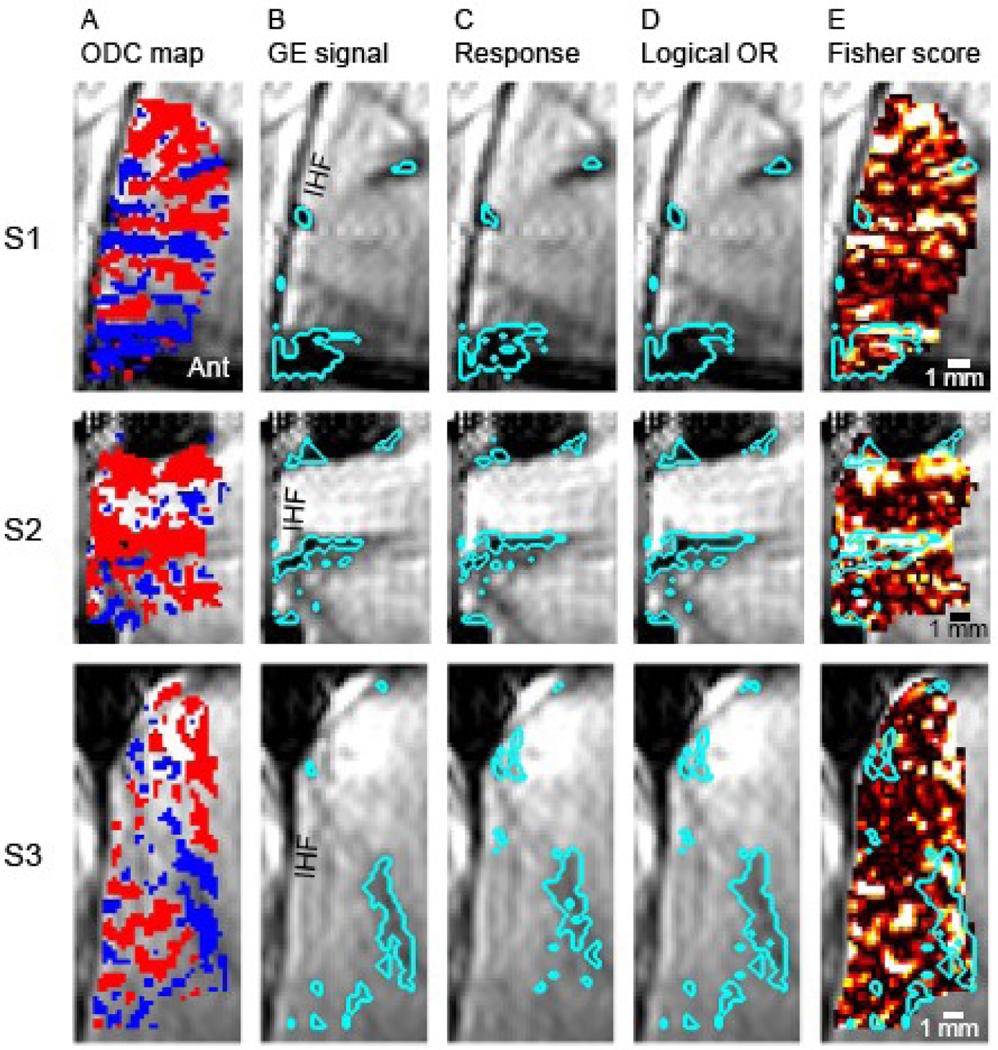
The 3 rows depict results from subjects S1, S2 and S3, respectively. (A) Differential functional ODC maps obtained using GE BOLD fMRI. Red (representing the contra-lateral eye) or blue colored voxels passed the statistical threshold (p < 0.15). Ant, anterior; IHF, Inter-hemispheric fissure. Scale bar, 1 mm. (B-D) demonstrate the classification of voxels as belonging to macroscopic blood-vessels or gray matter regions. The background image within these images is the mean GE BOLD fMRI image. The cyan colored curves enclose the 10% of voxels within the region of interest (ROI) that show features expected from blood vessels. These include low GE signal (in B), and high response amplitude (in C). (D) The logical OR of regions enclosed by cyan colored curves in (B) and (C). (E) The voxel-wise Fisher score for discriminating the stimulated eye. Super-imposed are the cyan colored curves delineating macroscopic blood vessels obtained by the logical OR (from D). Regions classified as belonging to blood vessels carry information that can be used for decoding the stimulated eye.
Figure 1B–D demonstrates the method used for ranking voxels according to the likelihood of belonging to a macroscopic blood vessel or gray matter. The regions delineated within the cyan curves in Figure 1B represent voxels with the lowest GE signal within the ROI; they constitute 10% of the voxels within the subject-specific ROI shown in Figure 1A. Figure 1C presents the 10% regions with the largest response amplitude to stimuli (average of left- and right-eye stimulation) relative to baseline. Figure 1D shows the logical OR of the regions delineated in B and C. The regions delineated based on low GE signal and on large response amplitude overlap significantly, demonstrating an overall consistent classification of voxels as representing blood vessels using these 2 criteria. Figure 1E shows the spatial pattern within the ROI of the voxel-wise Fisher score for discriminating the stimulated eye. Superimposed are the cyan colored curves that delineate macroscopic blood vessels. Note the existence of voxels showing high discriminative power (bright colors) within regions that are likely to represent macroscopic blood vessels in all 3 subjects.
To investigate whether, in addition to fine-scale, coarse-scale functional structures convey discriminative power for decoding the stimulated eye, we analyzed the data in 3 filtering formats. Figure 2A presents the differential ODC map from subject S1 computed from unfiltered, band-pass filtered (cycles shorter than 1 mm or longer than 4 mm were filtered out), and low-pass filtered (cycles shorter than 4 mm were filtered out). Differential responses with absolute amplitude larger than 0 can be seen in all 3 filtering regimes. This result indicates that information on the stimulated eye is conveyed not only at the fine scale organization of ODC with cycles of about 2 mm, but also at a coarser scale. To compare the discriminative power of OD responses across the 3 filtering regimes, we recomputed the Fisher score (Figure 2B). The analysis of the unfiltered data shows regions in a fine scale organization with positive Fisher score. As expected, peaks in this organization seem to correspond to regions with selectivity to the stimulated eye shown in Figure 2A. A fine-scale organization showing a positive Fisher score can also be seen after band-pass filtering. The analysis of the low-pass filtered data shows that coarse-scale patches likewise carry power for discriminating the stimulated eye.
Fig. 2. Spatial distribution of discriminative power for decoding the stimulated eye.
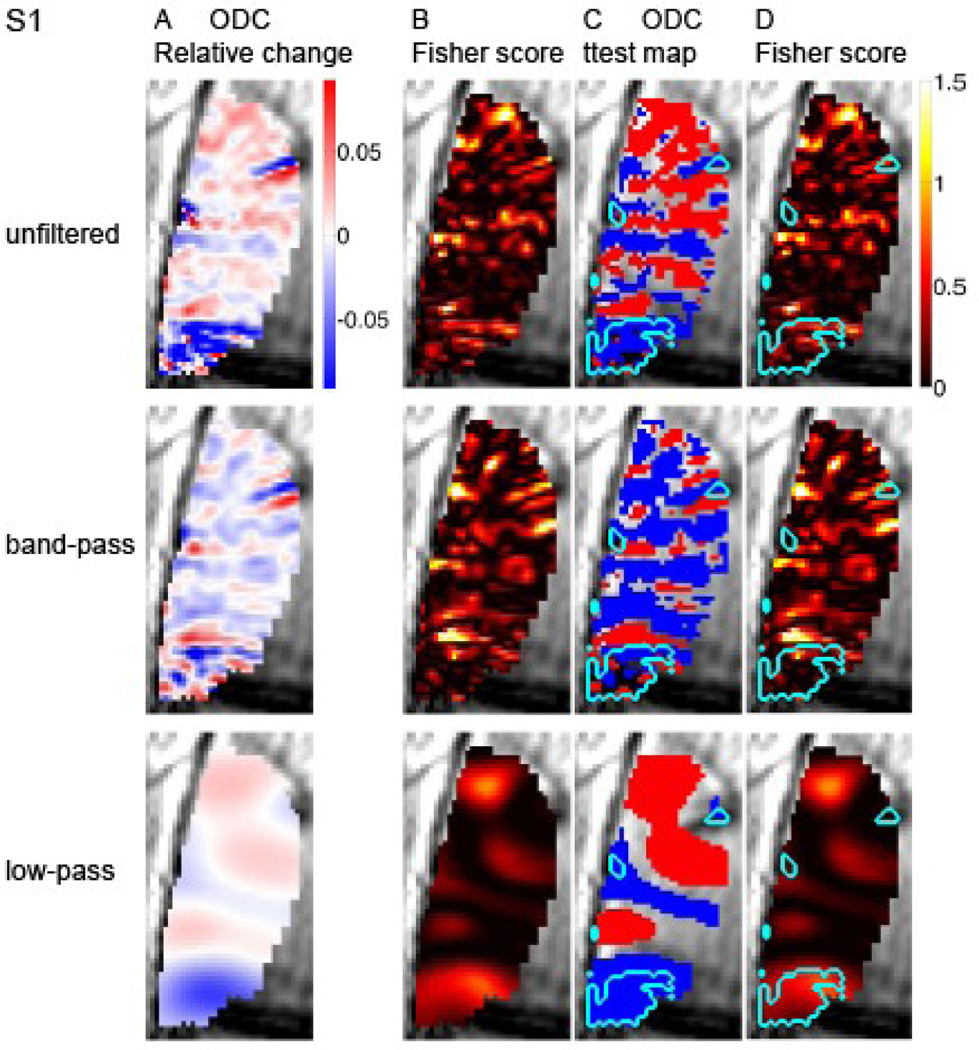
The first, second and third rows present analysis of unfiltered data, band-pass and low-pass filtered data respectively. (A) Differential ODC maps. The color index represents differential responses in units of changes relative to the GE signal at baseline. (B) Fisher score maps. (C) Differential ODC maps. The voxel-wise eye-preference was determined by a ttest (p < 0.15). Superimposed is the delineation of macroscopic blood vessel regions. (D) Fisher score maps. Superimposed is the delineation of macroscopic blood vessel regions. S1, subject 1.
Figure 3A–B and 4A–B present similar analysis of the data from subjects S2 and S3, respectively. The organization of the ODC map based on the unfiltered data from S2 is on the whole coarser than that of S1, with a dominance of large red patches representing the contra-lateral eye. These large patches demonstrate high capacity for discriminating the stimulated eye in both the unfiltered and low-pass filtered data (Figure 3B). More similar to S1, the ODC map in S3 is composed of both a fine-scale organization and coarse scale structures that carry the capacity to discriminate the stimulated eye (Figure 4A–B).
Fig. 3. Spatial distribution of discriminative power for decoding the stimulated eye.
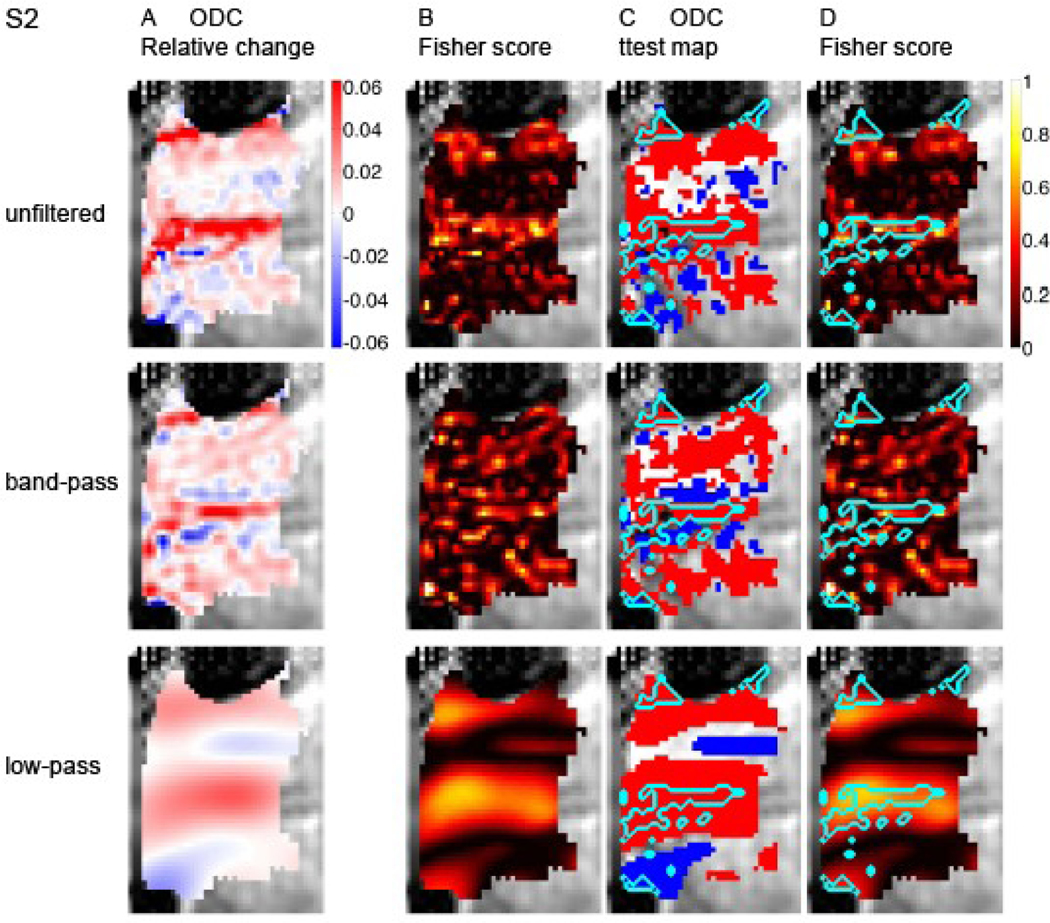
Data from subject S2 is presented in a format identical to that in Figure 2.
Fig. 4. Spatial distribution of discriminative power for decoding the stimulated eye.
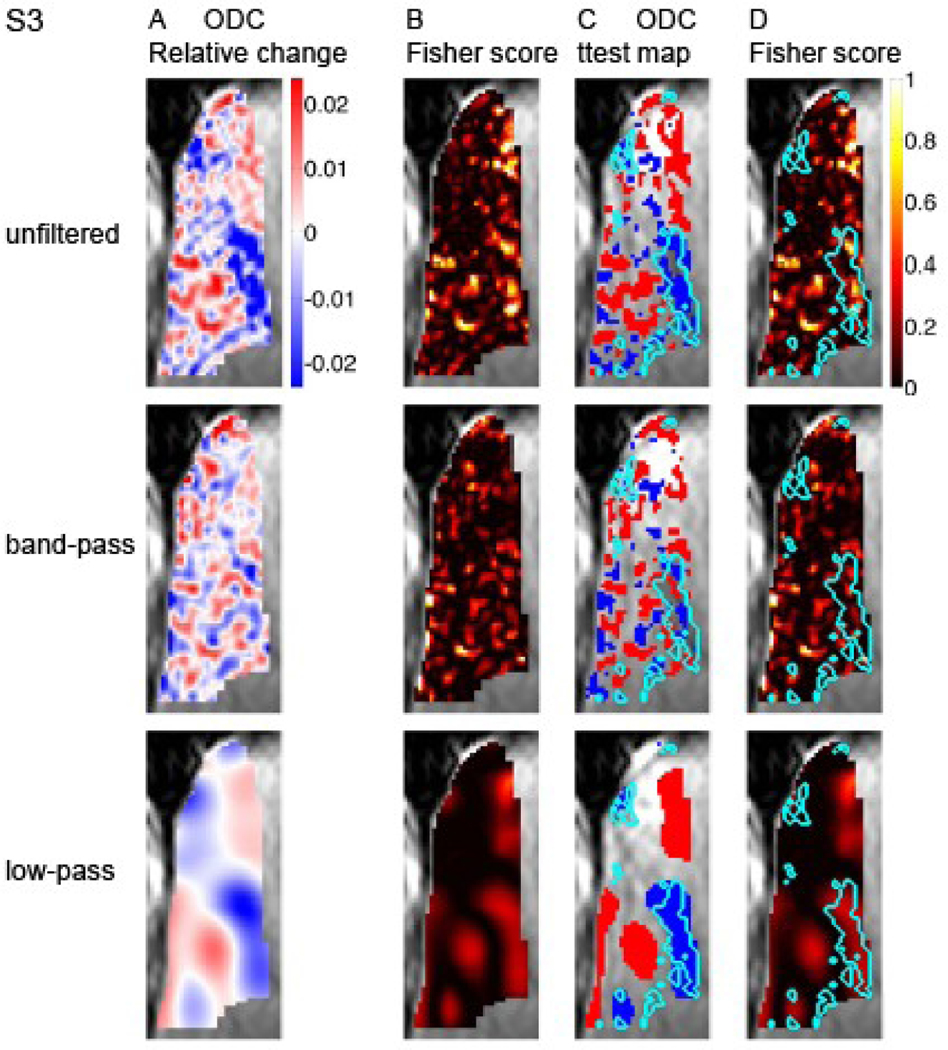
Data from subject S3 is presented in a format identical to that in Figure 2.
To test the possible spatial correspondence between macroscopic blood vessels (Figure 1) and the coarse scale functional patches (panels A-B in Figures 2, 3 and 4), we superimposed the delineation of macroscopic blood vessels on the ODC and Fisher score maps (Figure 2 C and D, respectively). The largest connected region delineated as a macroscopic blood vessel region overlaps with a patch showing preference to one eye and a high Fisher score in the coarse-scale map (anterior ROI in Figures 2C–D, low-pass filtered data). Note that an overall similar eye preference is shown by this region in the unfiltered data too. Similar results were obtained from subjects S2 and S3 (S2, Figure 3C–D, large red structure; S3, Figure 4C–D, blue patch in anterior part of the ROI). Overall, in all 3 cases presented here, regions reflecting contributions from macroscopic blood vessels and their vicinity are associated with coarse structures showing selectivity to one eye and power for discriminating the stimulated eye. Figure 5 quantifies the relative discriminative power conveyed by the coarse- and fine-scale structures and by blood vessels and gray matter regions. It shows plots of the voxel-wise Fisher score. In all 3 subjects, capacity for discriminating the stimulated eye is carried by both the fine- (Fig. 5B; band-pass filtered data) and coarse-scale (Fig. 5C; low-pass filtered data) organizations. The mean Fisher score averaged over voxels in each subject was 0.16±0.04, 0.16±0.06 and 0.16±0.07 for the unfiltered, band-pass filtered and low-pass filtered data, respectively (mean±SD, n=3 subjects). To present the discriminative capacity according to tissue type, the voxel-wise Fisher score is plotted here as a function of rank of likelihood of belonging to gray matter (left side of plots) or macroscopic blood vessels. In the actual ranking procedure used for the results presented here we did not apply thresholding as employed in Figure 1. Instead, voxels were sorted and ranked according to the likelihood that they belonged to a gray matter region (low mean rank) or a blood vessel (high mean rank). In all 3 subjects, discriminative power is distributed in the unfiltered data over the continuum of tissue type. The histogram obtained from subject 3 demonstrates 2 peaks of discriminative power, one likely in gray matter and the other likely from contributions of macroscopic blood vessels. In subjects 1 and 2, voxels that likely belong to blood vessels show high discriminative power for decoding the stimulated eye. In blood vessel regions, the peaks in Fisher scores using the unfiltered data (Figure 5A) either became higher (S1 and S2) or did not change (S3) after the data were low-pass filtered (Figure 5C). In contrast, the Fisher scores in blood-vessel regions were lower in the band-pass filtered data compared to the unfiltered data. The mean Fisher score averaged over the 10% voxels with the highest likelihood of belonging to blood vessels in each subject was 0.23±0.03, 0.15±0.04 and 0.33±0.14 for the unfiltered-, band-pass filtered and low-pass filtered data, respectively. These findings further link the discriminative power of macroscopic blood vessels to coarse-scale structures constituted by vessels and regions adjacent to them.
Fig. 5. Discriminative power for decoding the stimulated eye carried by fine- and coarse-scale structures, macroscopic blood-vessels and gray matter regions in V1.

(A-C) present unfiltered, band-pass, and low-pass filtered data, respectively. The band-pass filter filtered out signals with cycles shorter than 1 mm or longer than 4 mm. The low-pass filter filtered out signals with cycles shorter than 4 mm. Each of the plots shows the voxel-wise (blue dots) and moving average (red curve) Fisher scores for discriminating the stimulated eye in one subject under one filtering regime. Fisher scores are shown as a function of the rank assigned to the voxel as likely belonging to gray matter (low rank) or macroscopic blood vessel (high rank). Voxels classified as belonging to blood vessels carry information that can be used for decoding the stimulated eye.
In gray matter regions, the Fisher scores were higher in the band-pass filtered data compared to the unfiltered data. The mean Fisher score averaged over the 10% voxels with the highest likelihood of belonging to gray matter was 0.14±0.09, 0.19±0.13 and 0.15±0.04 (mean±SD, n=3 subjects) for the unfiltered, band-pass filtered and low-pass filtered data, respectively. Note that part of the small increase in Fisher score of the low-pass compared to the unfiltered data is due to leakage of discriminative power from blood vessel to gray matter region by the low-pass filtering (see, for example, Figure 3A and 3C).
Discussion
Using GE BOLD fMRI data, we demonstrated that coarse-scale structures and regions of both macroscopic blood vessels and gray matter demonstrate discriminative power for decoding the stimulated eye. We hypothesize that draining regions biased towards ODCs with preference to one eye underlie the stimulated eye specificity of macroscopic blood vessels.
Part of the coarse-scale structures overlapped with gray matter regions (red structures in Figures 2C and 4C) possibly reflecting global effects of unequal representation (see below). The other coarse-scale patches were associated with regions delineated as macroscopic blood vessels (Figures 2–4). The mechanism likely involves both intra- and extra-vascular BOLD. The latter influences parenchyma regions adjacent to blood vessels, and degrades their functional specificity that otherwise could potentially be imaged.
One possible mechanism underlying the ocular specificity of macroscopic blood vessels could be due to global effects, e.g. larger response amplitude to the contra-lateral eye in V1. Such larger response amplitude could result from unequal representations of the two eyes. Along these lines, the nasal (contra-lateral) retina is preferentially represented in 57% of monkey V1, compared to 43% with preferential representation of the temporal (ipsi-lateral) retina (Tychsen and Burkhalter 1997). As an example from the data presented here, the large vessel in the center of the ROI of subject S2 corresponds to a coarse structure that responds preferentially to the contra-lateral eye (Figure 3C). A second possible mechanism could be more local, independent of global unequal representations. Such a mechanism could arise from locally biased draining regions that include a larger representation of one feature (here, one eye), even in the absence of a global bias in favor of that feature. Along these lines, the large vessel region at the anterior part of the ROI of subject S1 corresponds to a coarse structure that responds preferentially to stimulation of the ipsi-lateral eye, which is not expected to be globally over-represented in V1 (Figure 2C).
While the large vessel contributions to GE BOLD persist at high magnetic fields, their relative contribution to fMRI signals at 7 Tesla is smaller than at 3 Tesla. The BOLD effect at 7 Tesla is characterized by a higher ratio of response amplitude from gray matter to response amplitude from macroscopic blood vessels in comparison to 4 Tesla (Yacoub et. al, 2001) and 3 Tesla (Jochimsen et al., 2004). The mechanism underlying this phenomenon involves large relative contributions from blood via intra-vascular BOLD at 3 Tesla (Jochimsen et al., 2004) and even 4 Tesla (Duong et al., 2003) compared to smaller relative contributions from blood at 7 Tesla (Duong et al., 2003), and higher extra-vascular contribution from the microvasculature at 7 Tesla (Yacoub et al., 2001, 2003). Therefore, we expect even larger contributions from macroscopic blood vessels to decoding signals at 3 Tesla compared to 7 Tesla.
Our analysis also indicates that differential analysis does not guarantee complete elimination of signals from macroscopic blood vessels when using GE BOLD fMRI (Yacoub et al, 2007). Inherent suppression of signals that arise from large blood vessels during data-acquisition should be the preferred strategy for detecting high resolution structures even if differential analysis is pursued. Such suppression can be achieved, for example, by Spin-Echo based functional imaging at ultrahigh magnetic fields (Yacoub et al., 2008).
While here we emphasize contributions of macroscopic blood vessels to decoding analyses, and their role in decoding based on low resolution images, our results do not rule out contributions to decoding from cortical columns in gray matter regions. In fact, we show that gray matter regions sampled at high spatial resolution also carry information on the stimulated eye at 7 Tesla (Fig. 5). Note that the mechanism of ‘voxel biased sampling’ from gray matter regions is not investigated in this report, because here we present high-resolution data with voxels that are small relative to the spatial frequency of the ODC organization. Therefore, decoding at low-resolution likely involves contributions from macroscopic blood vessels as demonstrated here, and possibly contributions from gray matter regions via voxel biased sampling, though contributions from gray matter are expected to diminish at the lower magnetic fields. Preliminary multi-scale analysis of data obtained at 7 Tesla (not shown) indicates that gray matter regions sampled at low resolution do carry discriminative power for decoding the stimulated eye (Shmuel et al., 2007b). For a straight forward demonstration of the mechanisms, we preferred to use here a voxel-wise univariate measure of discriminability rather than multivariate measures employed by Op de Beeck (2009). Note that a higher average univariate Fisher score should correspond to a higher success rate of classification using correlational multivariate analysis employed by Op de Beeck. In contrast, unlike the univariate measure we used here, support-vector machines consider dependencies between voxels. In considering contributions to multivariate decoding, we do expect dependencies between the responses of voxels within a coarse-scale structure or a macroscopic blood vessel. Note, however, that at least in the case of blood vessels these dependencies should not play a crucial role at 3 Tesla, because the regarded vessels can be captured by as few as 3–4 voxels of 3 by 3 mm.
Op de Beeck (2009) challenged the hypothesized mechanism of voxel biased sampling using responses in V1 to oriented gratings rather than to ocular dominance. Could macroscopic blood vessels convey information for decoding orientation stimuli? An earlier presentation has shown that macroscopic blood vessels in V1 do in fact carry information on the orientation of visual grating stimuli as well (Gardner et al., 2006). Similar to the globally larger response to the contra-lateral eye (Tychsen and Burkhalter, 1997; S2 here), spatially coarse selective signals could also contribute to orientation selective responses from macroscopic blood vessels. The underlying mechanism may include the oblique effect (Furmanski and Engel, 2000) and radial representation biases (Sasaki et al., 2006). As for information at a finer scale, e.g. locally biased draining regions, the spatial frequencies of the organizations for orientation and ODCs are approximately equal along the anterior-posterior axis. They are, however, different in the medio-lateral axis, due to the elongation of ODCs along that axis. This elongation makes draining veins, which tend to be elongated, more likely to carry undiluted information on the stimulated eye than on stimulus orientation. We therefore expect contributions from macroscopic blood vessels in V1 to decoding oriented stimuli at 3 Tesla due to global unequal representation (the oblique effect) and radial representation biases, and possibly due to locally biased draining regions.
Acknowledgements
All data collection was performed at CMRR. Supported by NIH grants P41 RR08079, P30 NS057091, R01-MH070800 and R01-EB000331, by the Max-Planck Society and the Canada Research Chairs program.
Footnotes
Publisher's Disclaimer: This is a PDF file of an unedited manuscript that has been accepted for publication. As a service to our customers we are providing this early version of the manuscript. The manuscript will undergo copyediting, typesetting, and review of the resulting proof before it is published in its final citable form. Please note that during the production process errors may be discovered which could affect the content, and all legal disclaimers that apply to the journal pertain.
References
- Cheng K, Waggoner RA, Tanaka K. (2001) Human ocular dominance columns as revealed by high-field functional magnetic resonance imaging. Neuron 32, 359–374. [DOI] [PubMed] [Google Scholar]
- Duong TQ, Yacoub E, Adriany G, Hu XP, Ugurbil K, Kim SG (2003) Microvascular BOLD contribution at 4 and 7 T in the human brain: gradient-echo and spin-echo fMRI with suppression of blood effects. Magnetic Resonance in Medicine 49, 1019–1027. [DOI] [PubMed] [Google Scholar]
- Engel SA, Glover GH, Wandell BA (1997) Retinotopic organization in human visual cortex and the spatial precision of functional MRI. Cerebral Cortex 7, 181–192. [DOI] [PubMed] [Google Scholar]
- Furmanski CS, Engel SA (2000) An oblique effect in human primary visual cortex. Nature Neuroscience 3, 535–536. [DOI] [PubMed] [Google Scholar]
- Gardner JL, Sun P, Tanaka K, Heeger DJ, Cheng K. (2006) Classification analysis with high spatial resolution fMRI reveals large draining veins with orientation specific responses. Proceedings of the Society for Neuroscience meeting, Atlanta. [Google Scholar]
- Goodyear BG, Menon RS (2001) Brief visual stimulation allows mapping of ocular dominance in visual cortex using fMRI. Hum. Brain Mapp. 14, 210–217. [DOI] [PMC free article] [PubMed] [Google Scholar]
- Haxby JV, Gobbini MI, Furey ML, Ishai A, Schouten JL, Pietrini P. (2001) Distributed and overlapping representations of faces and objects in ventral temporal cortex. Science 293, 2425–2430. [DOI] [PubMed] [Google Scholar]
- Haynes JD, Rees G. (2005) Predicting the orientation of invisible stimuli from activity in primary visual cortex. Nature Neurosci. 8, 686–691. [DOI] [PubMed] [Google Scholar]
- Haynes JD, Rees G. (2006) Decoding mental states from brain activity in humans. Nature reviews Neuroscience 7:523–34. [DOI] [PubMed] [Google Scholar]
- Horton J, Dagi L, McCrane E, de Monasterio F. (1990) Arrangement of ocular dominance columns in human visual cortex. Arch. Ophthalmol. 108, 1025–1031. [DOI] [PubMed] [Google Scholar]
- Jochimsen TH, Norris DG, Mildner T, Moller HE (2004) Quantifying the intra- and extravascular contributions to spin-echo fMRI at 3 T. Magnetic Resonance in Medicine 52, 724–732. [DOI] [PubMed] [Google Scholar]
- Kamitani Y, Tong F. (2005) Decoding the visual and subjective contents of the human brain. Nature Neurosci. 8, 679–685. [DOI] [PMC free article] [PubMed] [Google Scholar]
- Kamitani Y, Tong F. (2006) Decoding seen and attended motion directions from activity in the human visual cortex. Current Biology 16:1096–102. [DOI] [PMC free article] [PubMed] [Google Scholar]
- Kim SG, Hendrich K, Hu XP, Merkle H, Ugurbil K. (1994) Potential pitfalls of functional MRI using conventional gradient-recalled echo techniques. NMR in Biomedicine 7, 69–74. [DOI] [PubMed] [Google Scholar]
- Kriegeskorte N, Goebel R, Bandettini PA (2006) Information-based functional brain mapping. Proceedings of the National Academy of Science 103:3863–8. [DOI] [PMC free article] [PubMed] [Google Scholar]
- Menon RS, Ogawa S, Tank DW, Ugurbil K. (1993) Tesla gradient recalled echo characteristics of photic stimulation-induced signal changes in the human primary visual-cortex. Magnetic Resonance in Medicine 30, 380–386. [DOI] [PubMed] [Google Scholar]
- Olman CA, Inati S, Heeger DJ (2007) The effect of large veins on spatial localization with GE BOLD at 3 T: Displacement, not blurring. Neuroimage 34, 1126–35. [DOI] [PubMed] [Google Scholar]
- Op de Beeck H. (2009) Against hyperacuity in brain reading: Spatial smoothing does not hurt multivariate fMRI analyses? Neuroimage, in press. [DOI] [PubMed] [Google Scholar]
- Parkes LM, Schwarzbach JV, Bouts AA, Deckers RHR, Pullens P, Kerskens CM, Norris DG (2005) Quantifying the spatial resolution of the gradient echo and spin echo BOLD response at 3 tesla. Magnetic Resonance in Medicine 54, 1465–1472. [DOI] [PubMed] [Google Scholar]
- Sasaki Y, Rajimehr R, Kim BW, Ekstrom LB, Vanduffel W, Tootell RB (2006) The radial bias: a different slant on visual orientation sensitivity in human and nonhuman primates. Neuron 51(5):661–70. [DOI] [PubMed] [Google Scholar]
- Shmuel A, Yacoub E, Chaimow D, Logothetis NK, Ugurbil K. (2007a) Spatio-temporal point-spread function of fMRI signal in human gray matter at 7 Tesla. NeuroImage 35, 539–552. [DOI] [PMC free article] [PubMed] [Google Scholar]
- Shmuel A, Raddatz G, Chaimow D, Logothetis NK, Ugurbil K, Yacoub E. (2007b) Origin of decoding signals in the visual cortex: gray matter or macroscopic blood vessels? Proceedings of the Organization for Human Brain Mapping, Chicago, USA. [Google Scholar]
- Tychsen L, Burkhalter A. (1997) Nasotemporal Asymmetries in V1: Ocular Dominance Columns of Infant, Adult, and Strabismic Macaque Monkeys. The Journal of Comparative Neurology 388:32–46. [DOI] [PubMed] [Google Scholar]
- Yacoub E, Duong TQ, Van de Moortele PF, Lindquist M, Adriany G, Kim SG, Ugurbil K, Hu XP (2003) Spin-echo fMRI in humans using high spatial resolutions and high magnetic fields. Magnetic Resonance in Medicine 49, 655–664. [DOI] [PubMed] [Google Scholar]
- Yacoub E, Harel N, Ugurbil K. (2008) High-field fMRI unveils orientation columns in humans. Robust detection of ocular dominance columns in humans. Proc Natl Acad Sci U S A 105(30):10607–12. [DOI] [PMC free article] [PubMed] [Google Scholar]
- Yacoub E, Shmuel A, Logothetis NK, Ugurbil K. (2007) Robust detection of ocular dominance columns in humans using Hahn Spin Echo BOLD functional MRI at 7 Tesla. Neuroimage 37:1161–77. [DOI] [PMC free article] [PubMed] [Google Scholar]
- Yacoub E, Shmuel A, Pfeuffer J, Van de Moortele PF, Adriany G, Andersen P, Vaughan JT, Merkle H, Ugurbil K, Hu XP (2001) Imaging brain function in humans at 7 tesla. Magnetic Resonance in Medicine 45, 588–594. [DOI] [PubMed] [Google Scholar]