

Abstract
SHANK‐associated RH domain interacting protein (SHARPIN) plays an important role in carcinogenesis, as well as inflammation and immunity. Our study explored the effects and underlying mechanisms of SHARPIN in clear cell renal cell carcinoma (ccRCC). By analyzing The Cancer Genome Atlas database, we found that upregulated SHARPIN in patients with ccRCC led to a poor prognosis. Semiquantitative immunohistochemical analysis of clinical samples was carried out and the results suggested the positive association between SHARPIN and hypoxia‐induced factor‐2α (HIF‐2α). Von Hippel‐Lindau protein (pVHL) is a tumor suppressor that contributes to degrading HIF‐2α. Mechanically, SHARPIN promoted the ubiquitination and proteasomal degradation of pVHL, resulting in the sustained activation of HIF‐2α. The α and β domains of pVHL and ubiquitin‐like domain of SHARPIN are required for the interaction. The knockdown of SHARPIN effectively inhibited acquired sorafenib resistance in ccRCC cell lines and tumor growth in xenograft models. In conclusion, our work reveals a novel posttranslational regulation of SHARPIN on pVHL, indicating that SHARPIN could be a potential target for ccRCC treatment.
Keywords: acquired sorafenib resistance, clear cell renal cell carcinoma, HIF‐2α, pVHL, SHARPIN
SHARPIN promotes the ubiquitination and proteasomal degradation of von Hippel‐Lindau protein (pVHL) through the interaction between the ubiquitin‐like domain of SHARPIN and the α and β domains of pVHL, resulting in the sustained activation of hypoxia‐induced factor‐2α. The knockdown of SHARPIN effectively inhibited acquired sorafenib resistance in clear cell renal cell carcinoma cell lines and tumor growth in xenograft models.
Abbreviations
- AO
acridine orange
- ccRCC
clear cell renal cell carcinoma
- CHX
cycloheximide
- coIP
coimmunoprecipitation
- DFS
disease‐free survival
- EB
ethidium bromide
- HIF‐2α
hypoxia‐inducible factor‐2α
- IHC
immunohistochemistry
- LUBAC
linear ubiquitin chain assembly complex
- NF‐κB
nuclear factor‐κB
- NZF
Npl4 zinc finger
- OE
overexpressed
- OS
overall survival
- PHD
prolyl hydroxylase domain‐containing protein
- pVHL
von Hippel‐Lindau protein
- qRT‐PCR
quantitative real‐time PCR
- RCC
renal cell carcinoma
- SHARPIN
SHANK‐associated RH domain interacting protein
- TCGA
The Cancer Genome Atlas
- TKI
tyrosine kinase inhibitor
- TTBS
Tween‐20‐TBS
- UBL
ubiquitin‐like
- VBC‐CR
VHL‐Elongin B/C‐Cul‐2‐Rbx1
1. INTRODUCTION
Renal cell carcinoma, originating from the renal tubular epithelial cells, is the second most lethal urinary cancer.1 Among all subtypes of RCC, clear cell type is the most common, accounting for approximately 85%‐90%.2 Although most of the incidentally detected masses are benign and low‐grade, approximately 17% of all renal cancers are diagnosed with a distant metastasis.3 Once metastasis occurs, the prognosis of ccRCC will become poor, with a median survival of only approximately 13 months and a 5‐year survival rate of less than 10%.4 In recent years, multiple drugs such as TKIs, mTOR inhibitors, and the anti‐vascular endothelial growth factor mAb, have improved the survival of patients, but advanced RCC is still regarded as a difficult problem due to its poor response to chemoradiotherapy2 and its inevitable drug resistance.5 Thus, it is necessary to further explore the mechanisms of ccRCC progression and to seek new therapeutic targets.
Hypoxia‐related pathways are associated with the formation and progression of ccRCC. In approximately 60%‐80% of ccRCC, the loss‐of‐function of VHL occurs, resulting in the sustained activation of HIF signaling, which controls hypoxia‐induced tumor growth and development by regulating the related gene expression.6 VHL is a tumor suppressor gene encoding a gene product of 213 amino acids, pVHL, which contributes to HIF‐α degradation.7 In normoxia, HIF‐α is hydroxylated by a PHD, which is recognized by pVHL and then finally ubiquitinated and degraded by the proteasome. However, in hypoxia, HIF‐α escapes from degradation because of the inactivation of PHD, allowing it to enter into the nucleus to act as a transcription factor by dimerizing with constitutively expressed HIF‐β.8 Compared to HIF‐1α, which is deleted in the early stages of most ccRCC,9 HIF‐2α seems to play a more significant oncogenic role.10 Inhibiting HIF‐2α revealed good inhibitory effects in some cell lines and in human ccRCC xenografts, and the relative drugs targeting HIF‐2α has been in clinical trials and are showing the obvious anti‐tumor effects. 11, 12, 13
SHARPIN is a member of LUBAC.14 SHARPIN is well known for its role in inflammation and immune response.15, 16 It participates in the linear ubiquitination of NF‐κB essential modulator and the subsequent activation of NF‐κB signaling,17 which could explain the phenotype of chronic proliferative dermatitis in SHARPIN‐deficient mice.18 Recently, the effects of SHARPIN in tumors have attracted increased attention. SHARPIN is highly expressed in several cancers, such as breast cancer,19 prostate cancer,20 and melanoma,21 and plays an active role in tumor progression. It is reported that SHARPIN is also upregulated in ccRCC,22 but how it regulates tumor development and drug sensitivity in ccRCC remains to be investigated.
In this study, we investigated the role of SHARPIN in ccRCC. Moreover, the relationship between SHARPIN and the pVHL/HIF axis and the underlying mechanisms were explored. We also tried to uncover the effects of SHARPIN on TKI resistance, with sorafenib as an example, with a view to providing new clues for advanced ccRCC treatment.
2. MATERIALS AND METHODS
2.1. Bioinformatics method
The expression of SHARPIN in 533 ccRCC patient samples and 72 normal tissue samples from TCGA was evaluated using the online analysis tool UALCAN.23 Survival prediction was undertaken using the online database GEPIA.24 The optimal cut‐off values were calculated by X‐tile. 25
2.2. Clinical sample collection
Tumor and adjacent tissue specimens were obtained from 75 patients with ccRCC from Shandong Provincial Hospital Affiliated to Shandong First Medical University between 2018 and 2019. Then samples were fixed in 4% formalin for IHC. None of these cases had received any tumor‐related treatment before the surgery, and all diagnoses were confirmed by two independent pathologists. This study was approved by the Ethics Committee of Shandong Provincial Hospital Affiliated to Shandong First Medical University and informed consent was obtained from every patient in this study.
2.3. Cell culture and reagents
Caki‐1, ACHN, 769‐P, and 293T cells were purchased from the cell bank of the Chinese Academy of Sciences. All cells were cultured in RPMI‐1640 medium supplemented with 10% FBS and 1% penicillin/streptomycin and were incubated at 37°C with 5% CO2, except Caki‐1 cells, which were cultured in McCoy’s 5A medium. For hypoxic treatment, the cells were cultured in the incubator with 94% N2, 5% CO2, and 1% O2 at a constant temperature of 37°C. All cell reagents were obtained from HyClone. To generate the sorafenib‐resistant Caki‐1 (Caki‐1‐R) and sorafenib‐resistant ACHN (ACHN‐R) cell lines, the cells were treated with sorafenib according to a previous report.26
2.4. RNA interference and plasmid construction
The commercial SHARPIN shRNA lentivirus vector, VHL shRNA lentivirus vector, and negative control lentivirus shRNA vector were constructed by GeneChem, and the sequences are listed as follows: shSHARPIN#1, CCGGCTGTCCTTCCTGCACCTTCATCTCGAGATGAAGGTGCAGGAAGGACAGTTTTTG; shSHARPIN#2, CCGGGTGTTCTCAGAGCTCGGTTTCCTCGAGGAAACCGAGCTCTGAGAACACTTTTTG; and shVHL, CCGGTATCACACTGCCAGTGTATACCTCGAGGTATACACTGGCAGTGTGATATTTTTG.
Wild‐type VHL cDNA and its deletion variants, which encode for WT pVHL and truncated versions Δacid domain (lacking amino acids 14‐53), Δβ domain (lacking amino acids 100‐155), and Δα domain (lacking amino acids 157‐166), were tagged by Flag tags and cloned into pcDNA 3.1 vectors (Invitrogen). Similarly, SHARPIN cDNA and its two deletion variants that encode for truncation proteins ΔUBL (lacking amino acids 219‐288) and ΔNZF (lacking amino acids 348‐377) had a specific epitope tag added and were cloned into pcDNA3.1. The pcDNA3.1 empty vector was regarded as a control. All constructs were verified by standard DNA sequencing (data not shown).
2.5. Transfection
As previously described,27 we transfected lenti‐SHARPIN shRNA or lenti‐Control shRNA into three ccRCC cell lines (Caki‐1, ACHN, and 769‐P). The transfection efficiency was monitored with a fluorescence microscope (Nikon Ti‐S) 72 hours later. Western blot and qRT‐PCR were used to detect SHARPIN expression (Figure S1). Similarly, we transfected the corresponding constructed pcDNA3.1 vector into 293T cells using Lipofectamine 3000 reagent (Invitrogen) according to the manufacturer’s instructions.
2.6. Western blot analysis and coIP
The coIP was carried out as previously described.28 Specific Abs suitable for coIP were used, including anti‐pVHL (sc‐17780; Santa Cruz Biotechnology), anti‐HA (3724; Cell Signaling Technology), and anti‐Flag (8146; Cell Signaling Technology). After the Ab‐protein complex was precipitated by protein A agarose, the beads were washed and then boiled in SDS‐containing buffer solution. The supernatant was then used for western blot analyses.
The proteins were extracted as previously described.29 The samples were subjected to SDS‐PAGE then transferred onto PVDF membranes, followed by blocking with 5% skimmed milk powder. After washing with TTBS three times, the membranes were incubated with the corresponding primary Ab overnight at 4°C, including anti‐SHARPIN (1:1000, 14626‐1‐AP; Proteintech), anti‐HIF‐2α (1:1000, ab243861; Abcam), anti‐ubiquitin (1:1000, ab7254; Abcam), anti‐pVHL (1:500, sc‐17780; Santa Cruz Biotechnology), anti‐HA (1:1000, 3724; Cell Signaling Technology), anti‐Flag (1:1000, 8146; Cell Signaling Technology). and anti‐β‐tubulin (1:1000, 2128; Cell Signaling Technology). The membranes were washed with TTBS again, then the membranes were incubated with the secondary Ab. Enhanced chemiluminescence was used to visualize the detected proteins.
2.7. Quantitative real‐time PCR
The qRT‐PCR was carried out according to a previous description.30 GAPDH served as the internal control, and the primer sequences are listed as follows: SHARPIN forward, TGTTCTCAGAGCTCGGTTT; SHARPIN reverse, AAGTTCCCCGTCCATCTT; GAPDH forward, GAGTCAACGGATTTGGTCGT; GAPDH reverse, TTGATTTTGGAGGGATCTCG.
2.8. Immunohistochemistry assay
The tumor tissues from patients and xenografts were formalin‐fixed and paraffin‐embedded to produce the histological sections. A PV‐9000 kit was purchased from the Zhongshan Golden Bridge Biotechnology Co. for the IHC. All slides were baked for 3 hours at a constant temperature of 60°C, followed by dewaxing in xylene and rehydrating through a graded alcohol bath. After retrieval by citric acid buffer (pH 6.0), the tissue samples were treated with 3% hydrogen peroxide to block the endogenous peroxidase activity, then incubated with a rabbit polyclonal anti‐SHARPIN (1:200, 14626‐1‐AP; Proteintech) or anti‐HIF‐2α (1:200, ab243861; Abcam) Ab overnight at 4°C, followed by incubation with HRP‐conjugated secondary Ab. The stained sections were reviewed and scored by a pathologist who had no prior knowledge of the patients, and the score (0‐9) was defined as the product of the percentage of positive cells (0, positive staining in 0% of the tumor cells; 1, positive staining in less than 25% of the tumor cells; 2, positive staining in 25%‐50% of the tumor cells; 3, positive staining in 51%‐75% of the tumor cells; 4, positive staining in more than 75% of the tumor cells) and the staining intensity (0, not detectable; 1, weak; 2, moderate; and 3, strong), as described previously.31 Zero was regarded as negative, 1‐4 was regarded as weakly positive, 5‐8 was regarded as moderately positive, and 9‐12 was regarded as strongly positive.
2.9. Cell proliferation assay
The cells were inoculated into 96‐well plates at a density of 3000 cells per well and then placed in an incubator at 37°C with 5% CO2 for 24 hours. Different doses of sorafenib were added, followed by incubation for another 68 hours. Twenty microliters of 0.5% MTT was added to each well, followed by continued incubation for 4 hours. The supernatant was then removed and 150 µL DMSO was added to dissolve the MTT crystals. Finally, the absorbance at 490 nm was assessed, and the IC50 value was calculated.
2.10. Apoptosis assay
To investigate apoptosis, the cells were stained with an AO/EB solution (AO, 100 μg/mL; EB, 100 μg/mL) for 10 minutes then were immediately viewed under a fluorescence microscope as previously reported.32 All experiments were repeated at least three times.
2.11. Tumor growth assay in animal models
All animal experiments were approved by the Animal Ethics Committee of Shandong Provincial Hospital Affiliated to Shandong First Medical University, and were in compliance with the NIH Guide for the Care and Use of Laboratory Animals. Sixteen 2‐week‐old male BALB/c nude mice (Vital River) with similar physiological states were randomly divided into two equal groups. Control or SHARPIN‐knockdown Caki‐1 cells (5.0 × 10⁶) were inoculated subcutaneously into the dorsal flank of the mice, and the body weight and tumor volume of the mice were measured every second day. The tumor volume (V) was calculated as follows: V = length × width2 × (π/6). All mice were killed 2 weeks after inoculation, the tumor tissues were resected and weighed, and IHC staining was carried out to verify the expression of SHARPIN.
2.12. Statistical analysis
GraphPad Prism 8.0 (GraphPad Software) was used to analyze the statistics, and all data are presented as mean ± SD. The quantitative statistics between two groups were analyzed using a two‐tailed Student’s t test. The OS and DFS were evaluated by the log‐rank test. A linear correlation analysis was adopted for the correlation between SHARPIN and HIF‐2α. A level of P < .05 was considered statistically significant.
3. RESULTS
3.1. Overexpressed SHARPIN is positively associated with HIF‐2α in patients with ccRCC
To better understand SHARPIN’s role in ccRCC, its expression in tumor tissues and noncancerous tissues was analyzed using TCGA RNA sequencing data from the online database UALCAN. We observed that SHARPIN was more highly expressed in tumor samples than in normal samples (Figure 1A). Furthermore, the Kaplan‐Meier survival curves were generated by the GEPIA database to assess the prognosis based on SHARPIN expression. As can be seen, a low SHARPIN expression indicated better OS and DFS (Figure 1B,C).
FIGURE 1.
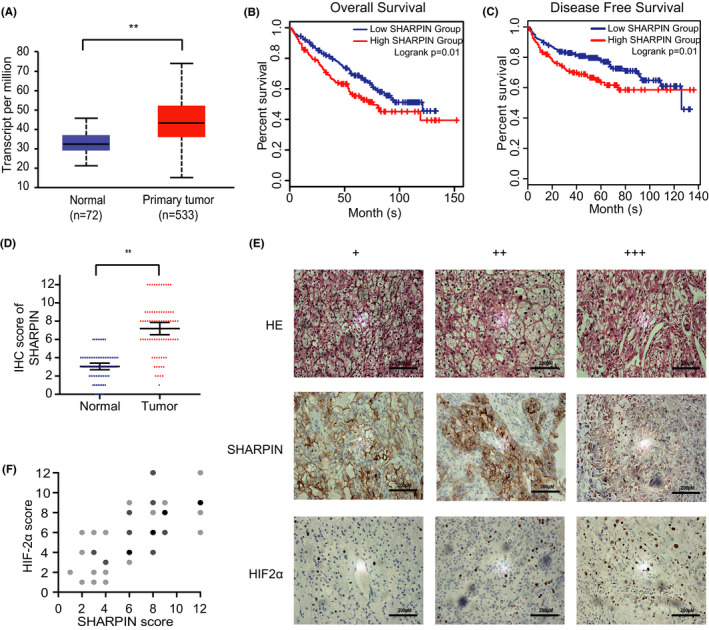
Overexpressed SHARPIN is positively associated with hypoxia‐inducible factor‐2α (HIF‐2α) in patients with clear cell renal cell carcinoma (ccRCC). A, SHARPIN mRNA expression in patients with ccRCC from the UALCAN database. P = 1.62E−12; **P < .01. B, C, Kaplan‐Meier plots of overall survival (B) and disease‐free survival (C) in patients with low or high SHARPIN transcripts per million based on the GEPIA database. The optimal cut‐off value of 65% was calculated by X‐tile. D, Levels of SHARPIN in tumor and adjacent normal tissues in patients with ccRCC admitted to hospital between 2018 and 2019 were semiquantitatively analyzed by immunohistochemistry (IHC). n = 75; Student's t test. **P < .01. E, Expression of SHARPIN (middle row) and HIF‐2α (bottom row) in tumor samples was detected by IHC. HE, hematoxylin. +, weakly positive. ++, moderately positive. +++, strongly positive. Scale bars, 200 μm. F, Positive correlation between SHARPIN and HIF‐2α staining. Darker dots represent more samples with overlapped scores. n = 75. Pearson’s correlation test; r = .6598; P < .01
Furthermore, we collected tumor tissue specimens and adjacent noncancerous tissue specimens from 75 patients in the hospital to verify the bioinformatic analysis. The clinical parameters of patients are shown on Table 1. Semiquantitative IHC analysis was carried out to test the protein expression of SHARPIN. Consistently, there was a higher expression of SHARPIN in tumor tissues than in paracarcinoma tissues (Figure 1D). The expression of HIF‐2α was also acquired by the semiquantitative analysis (Figure 1E), and the results showed the moderate correlation between SHARPIN and HIF‐2α (Figure 1F).
TABLE 1.
Clinical parameters of 75 patients with clear cell renal cell carcinoma
| Clinical parameter | Number of cases |
|---|---|
| Gender | |
| Male | 52 |
| Female | 23 |
| Age (y) | |
| ≤60 | 14 |
| >60 | 61 |
| Tumor size (cm) | |
| ≤4 | 33 |
| >4 | 42 |
| Histological grade | |
| I, II | 62 |
| III, IV | 13 |
| TNM grade | |
| I, II | 65 |
| III, IV | 10 |
3.2. SHARPIN inhibits degradation of HIF‐2α
We constructed the SHARPIN shRNA lentivirus vectors and infected Caki‐1, ACHN, and 769‐P cells with the SHARPIN shRNA or control shRNA lentiviruses. Subsequently, the HIF‐2α protein content was assessed by western blotting in the three cell lines under low or normal oxygen conditions. We found that HIF‐2α expression significantly decreased in shSHARPIN‐transfected Caki‐1 and ACHN cells, both under normoxia and hypoxia (Figure 2A,B). However, in 769‐P cells, the HIF‐2α expression difference caused by SHARPIN knockdown was only observed under hypoxia (Figure 2C). As the homologue of HIF‐2α, HIF‐1α was also detected and the results were similar. We focused on HIF‐2α due to its clear carcinogenesis.12
FIGURE 2.
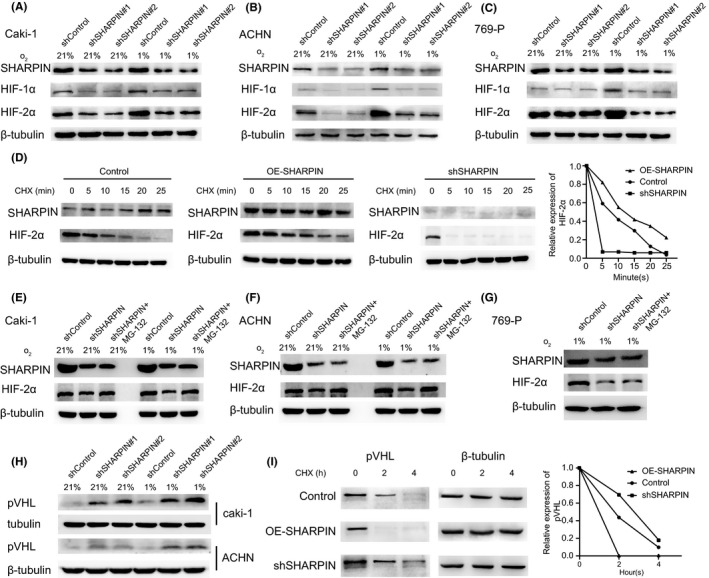
SHARPIN inhibits the degradation of hypoxia‐inducible factor‐2α (HIF‐2α) and von Hippel‐Lindau protein (pVHL) in clear cell renal cell carcinoma. A‐C, SHARPIN shRNA or control shRNA was transfected into (A) Caki‐1, (B) ACHN, and (C) 769‐P cells and western blot analysis was used to evaluate the protein level of HIF‐1α and HIF‐2α both in normoxia and hypoxia. D, Left panel: HIF‐2α expression in overexpressed SHARPIN (OE‐SHARPIN), control, and shSHARPIN groups at the indicated times after treatment with 0.1 mg/mL cycloheximide (CHX). Right panel: quantification of HIF‐2α protein relative to β‐tubulin. E‐G, HIF‐2α expression change in (E) Caki‐1, (F) ACHN, and (G) 769‐P cells after MG‐132 was added. 769‐P cells were detected only in hypoxia. H, Protein level of pVHL in shSHARPIN‐transfected or shControl‐transfected Caki‐1 and ACHN cells. I, Left panel: pVHL degradation in the OE‐SHARPIN, control, and shSHARPIN groups at indicated times. Right panel: quantification of pVHL protein relative to β‐tubulin. All experiments were repeated three times with independent samples
Protein degradation experiments were carried out. According to a previous report,33 Caki‐1 cells were transfected with WT SHARPIN cDNA plasmid vector, the empty control plasmid vector, or SHARPIN shRNA lentivirus vectors. Cells were cultured in hypoxia to maximize HIF expression and then switched to normoxia (21% O2) and treated with CHX (SC0353; Beyotime) to inhibit the new protein synthesis. The protein content of HIF‐2α in the OE‐SHARPIN, control, and shSHARPIN groups was detected at 0, 5, 10, 15, 20, and 25 minutes after CHX was added. As Figure 2D shows, HIF‐2α in the OE‐SHARPIN group degraded slower than in the control group at the same time point, and HIF‐2α in the shSHARPIN group degraded faster than the control group. Then we treated shSHARPIN‐transfected cells with MG‐132 and found the downregulation of HIF‐2α by SHARPIN silencing was blocked in Caki‐1 and ACHN cells both in normoxia and hypoxia (Figure 2E,F), suggesting that SHARPIN regulated the proteasome‐mediated degradation of HIF‐2α. In contrast, in 769‐P cells, HIF‐2α expression was not influenced in hypoxia (Figure 2G).
3.3. SHARPIN interferes with HIF‐2α by ubiquitinating and degrading pVHL
The pVHL‐mediated ubiquitination and subsequent proteasomal degradation is regarded as an important way for HIF‐2α to maintain stability. Considering that Caki‐1 and ACHN cells express pVHL but 769‐P cells do not,34 and that pVHL participates in the degradation of HIF‐2α,35 we focused on whether SHARPIN works through pVHL. We tested the level of pVHL in Caki‐1 and ACHN cells when SHARPIN was downregulated, and found it increased (Figure 2H). Moreover, pVHL degraded more quickly in OE‐SHARPIN‐transfected Caki‐1 cells than the control group, whereas the opposite was evident in the shSHARPIN group (Figure 2I). There was more pVHL protein in the shSHARPIN‐transfected Caki‐1 cells than in the shControl‐transfected Caki‐1 cells (Figure 3A), and the coIP showed that there was a significantly decreased ubiquitination level of pVHL in the shSHARPIN‐transfected Caki‐1 cells (Figure 3B), illustrating that SHARPIN accelerates the ubiquitination and degradation of pVHL.
FIGURE 3.
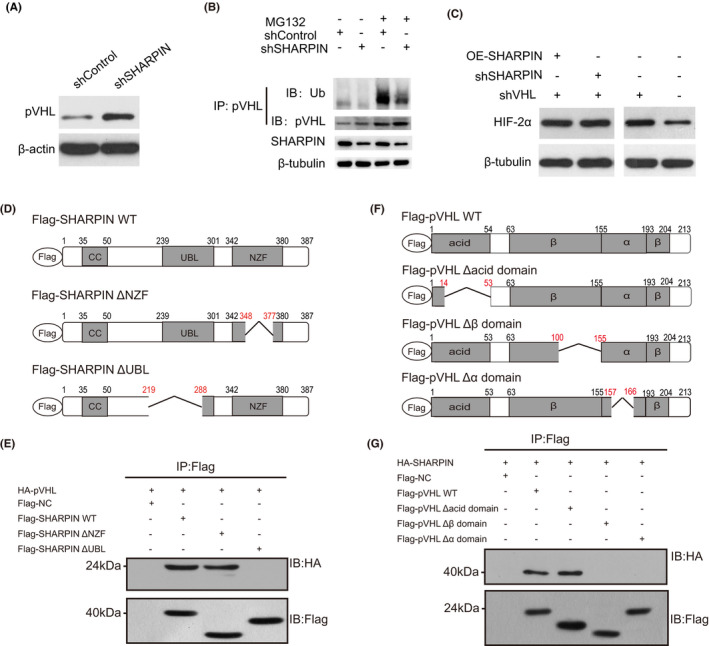
SHARPIN influences hypoxia‐inducible factor‐2α (HIF‐2α) in a von Hippel‐Lindau protein (pVHL)‐dependent manner. A, Protein levels of pVHL in shSHARPIN‐transfected and shControl‐transfected Caki‐1 cells. B, Ubiquitination (Ub) levels of pVHL in shSHARPIN‐transfected and shControl‐transfected Caki‐1 cells was examined with or without treatment with 10 µmol/L MG132 for 4 h. C, Expression of HIF‐2α in Caki‐1, shVHL‐transfected Caki‐1, shSHARPIN/shVHL‐cotransfected Caki‐1, and overexpressed (OE)‐SHARPIN/shVHL‐cotransfected Caki‐1 cells was detected. D, Schematic diagram of several variants of SHARPIN fused to Flag tags. E, Full‐length pVHL was fused with an HA tag and then was overexpressed in 293T cells together with a Flag‐fused SHARPIN WT or truncated variant. Immunoprecipitation (IP) was carried out with an anti‐Flag Ab and western blotting was carried out with an anti‐HA Ab. F, Schematic diagram of several variants of pVHL fused to Flag tags. G, Full‐length SHARPIN was fused with an HA tag and overexpressed in 293T cells together with a Flag‐fused pVHL WT or deletion variant. CoIP was carried out with an anti‐Flag Ab, followed by immunoblotting (IB) with an anti‐HA Ab. All experiments were repeated three times with independent samples. NZF, Npl4 zinc finger; UBL, ubiquitin‐like
We examined HIF‐2α expression in Caki‐1 cells, shVHL‐transfected Caki‐1 cells, shSHARPIN/shVHL‐cotransfected Caki‐1 cells and OE‐SHARPIN/shVHL‐cotransfected Caki‐1 cells. The results showed that HIF‐2α obviously increased when pVHL was knocked down, which was not altered by the upregulation or downregulation of SHARPIN (Figure 3C), suggesting that SHARPIN affects HIF‐2α in a pVHL‐dependent way rather than by direct regulation.
3.4. Ubiquitin‐like domain of SHARPIN and α and β domains of pVHL are required for interaction
To determine the regions that are required for the interaction between SHARPIN and pVHL, several variants were generated. The UBL domain mediating the interactions with other proteins36 and NZF domain that recognizes and binds ubiquitin37 are two important domains of SHARPIN. Thus, we constructed SHARPIN ΔUBL, which includes a deletion of residues 219‐288 that interrupts the UBL domain of SHARPIN, and ΔNZF, which includes a deletion of residues 348‐377 that interrupts the NZF domain. Both SHARPIN variants and WT SHARPIN were fused with a Flag tag (Figure 3D), and WT pVHL was fused with an HA tag. Coimmunoprecipitation was used to evaluate the physical interaction, and we found all but SHARPIN ΔUBL bound to the HA‐tagged pVHL (Figure 3E), suggesting that the UBL domain is indispensable for SHARPIN to bind to pVHL.
Similarly, several pVHL truncations, including the Δacid domain lacking amino acids 14‐53, the Δβ domain lacking amino acids 100‐155, and the Δα domain lacking amino acids 157‐166, were established and fused with Flag tags (Figure 3F), and WT SHARPIN was fused with an HA tag. As the results showed (Figure 3G), neither the Δα domain nor the Δβ domain could be precipitated with the anti‐HA Ab, suggesting that the α and β domains cooperatively contribute to interacting with SHARPIN. In short, these findings confirmed that the UBL domain of SHARPIN and α and β domains of pVHL are required for the interaction.
3.5. Knockdown of SHARPIN inhibits acquired sorafenib resistance
Tyrosine kinase inhibitor drug resistance is a common phenomenon in the progression of renal cancer. Here, we constructed drug‐resistant cell lines with sorafenib as an example. Sorafenib‐resistant ccRCC cell lines Caki‐1‐R and ACHN‐R were generated by incubating these cells with sorafenib (8 μmol/L) for 10 generations, which showed a higher viability than the parental cells when treated with different doses of sorafenib (Figure 4A,B). The IC50 values were then calculated and, as expected, the Caki‐1‐R and ACHN‐R cells had higher IC50 values (Figure 4C). We then treated these cells with different doses of sorafenib and found that cells transfected with shSHARPIN showed a lower cell viability (Figure 4D) and lower IC50 values (Figure 4F) in both the parental cells and the sorafenib‐resistant cells. A similar result was also observed in ACHN cells (Figure 4E,F). We used AO/EB fluorescent staining to assess apoptosis in the cells. The shSHARPIN‐transfected Caki‐1 cells showed a higher apoptosis rate than the shControl‐transfected cells in both the parental and sorafenib‐resistant cells (Figure 4G). Then we detected the protein levels of different cell lines, and found that the protein content of SHARPIN and HIF‐2α in sorafenib‐resistant cells was higher, but the expression of pVHL was decreased (Figure 4H). In short, the knockdown of SHARPIN partially restored the sensitivity of drug‐resistant cells to sorafenib, suggesting that the inhibition of SHARPIN might become a good choice for overcoming acquired sorafenib resistance.
FIGURE 4.
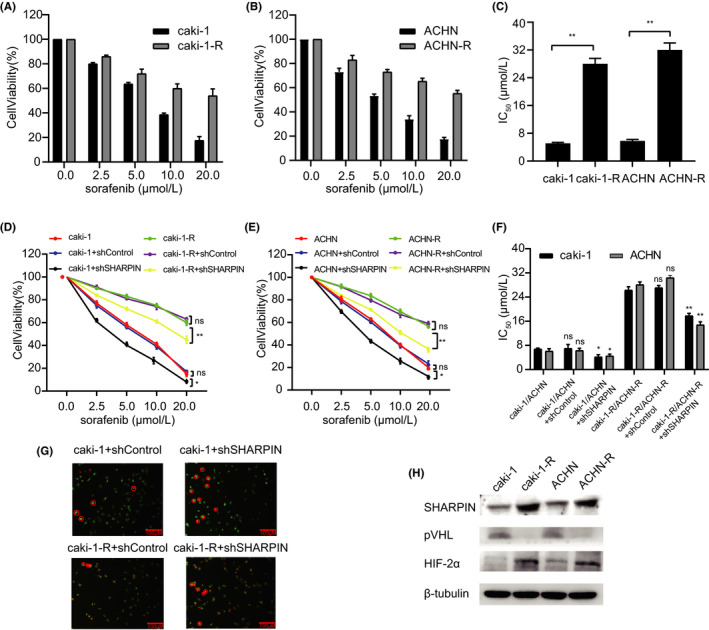
Knockdown of SHARPIN inhibits acquired sorafenib resistance. A, B, Viability of the parental (A) Caki‐1 and (B) ACHN cells and their corresponding sorafenib‐resistant (Caki‐1‐R and ACHN‐R) cells was examined after treatment with different doses of sorafenib. Two‐way ANOVA, P < .01. C, Higher IC50 values were observed in the sorafenib‐resistant cells. D, Cell viability curves of Caki‐1, shControl‐transfected Caki‐1, shSHARPIN‐transfected Caki‐1, Caki‐1‐R, shControl‐transfected Caki‐1‐R, and shSHARPIN‐transfected Caki‐1‐R cells after treatment with different doses of sorafenib. E, Cell viability curves of ACHN, shControl‐transfected ACHN, shSHARPIN‐transfected ACHN, ACHN‐R, shControl‐transfected ACHN‐R, and shSHARPIN‐transfected ACHN‐R cells after treatment with different doses of sorafenib. F, Lower IC50 values were observed in cells transfected with shSHARPIN than in cells transfected with shControl in both the parental and sorafenib‐resistant cells. G, Acridine orange/ethidium bromide fluorescent staining was used to assess apoptosis in shControl‐transfected Caki‐1, shSHARPIN‐transfected Caki‐1, shControl‐transfected Caki‐1‐R, and shSHARPIN‐transfected Caki‐1‐R cells. Red circles indicate apoptotic cells. Scale bars, 200 μM. G, Protein levels of SHARPIN, pVHL, and HIF‐2α were detected in parental and drug‐resistant cells. ns, not significant. *P < .05; **P < .01
3.6. Silencing of SHARPIN inhibits tumor growth in xenografted mice
A xenograft tumor model was established by subcutaneously injecting the shControl‐transfected or shSHARPIN‐transfected Caki‐1 cells. The tumor volume was measured every 2 days from day 14 to day 28 of the xenograft experiment. A representative photograph is shown in Figure 5A. The tumor volume derived from the shSHARPIN‐transfected Caki‐1 cells was smaller than that derived from the shControl‐transfected Caki‐1 cells (Figure 5B). In addition, no distinct body weight difference or toxic events were observed between the two groups (Figure 5C). The xenografts were excised and weighed on day 28 of the experiment, and we found that the tumor weight of the mice in the shSHARPIN group was significantly smaller compared to the control group (Figure 5D). Immunohistochemistry was then carried out to examine the expression of SHARPIN in the xenografts. The results showed that SHARPIN had a higher expression in the control xenografts, which verified the effectiveness of the xenograft model (Figure 5E).
FIGURE 5.
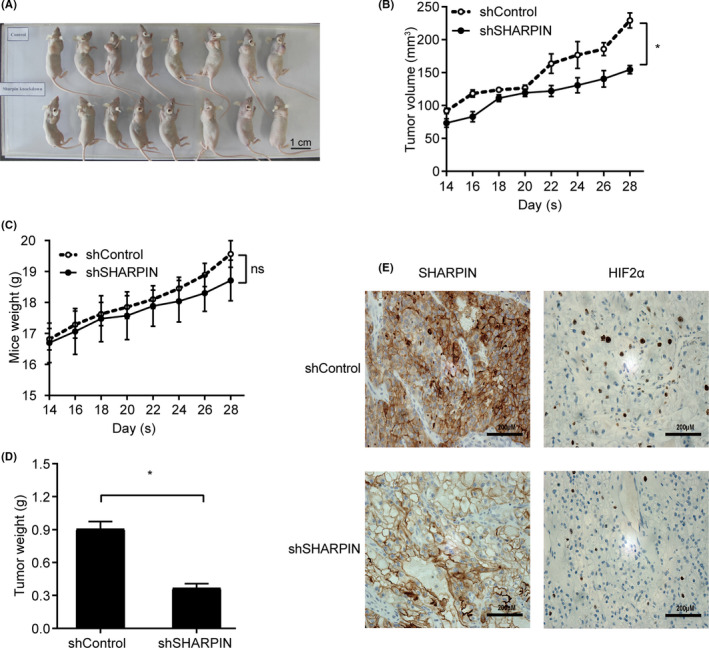
Silencing of SHARPIN inhibits clear cell renal cell carcinoma cell growth in xenograft tumors. shSHARPIN‐transfected or shControl‐transfected Caki‐1 cells were implanted into nude mice. A, Represent photograph of xenografts before removal. Scale bars, 1 cm. B, Growth curves of subcutaneous xenograft tumors in two groups. Tumor volume was measured every 2 days starting from the second week. Data are expressed as mean ± SD. n = 8. Two‐way ANOVA; *P < .05. C, Mice in the two groups were weighed every second day from day 14. Data are expressed as mean ± SD. n = 8. Two‐way ANOVA; ns, not significant. D, All mice were killed 1 month after the xenograft experiment. Xenografts of the two groups were resected and weighed. Data are expressed as mean ± SD. n = 8. Student’s t test; *P < .05. E, Expression of SHARPIN and hypoxia‐inducible factor‐2α (HIF‐2α) in xenografts of the two groups was examined by immunohistochemistry. Scale bars, 200 μM
4. DISCUSSION
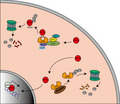
In this study, we determined the mechanisms of SHARPIN in ccRCC. We observed that SHARPIN had a higher expression in tumor specimens compared to matched normal tissues and negatively correlated with the patients’ OS. Further study verified that SHARPIN stabilized HIF‐2α by facilitating the ubiquitination and degradation of pVHL (Figure 6). The knockdown of SHARPIN effectively inhibited acquired sorafenib resistance, as well as xenograft growth.
FIGURE 6.
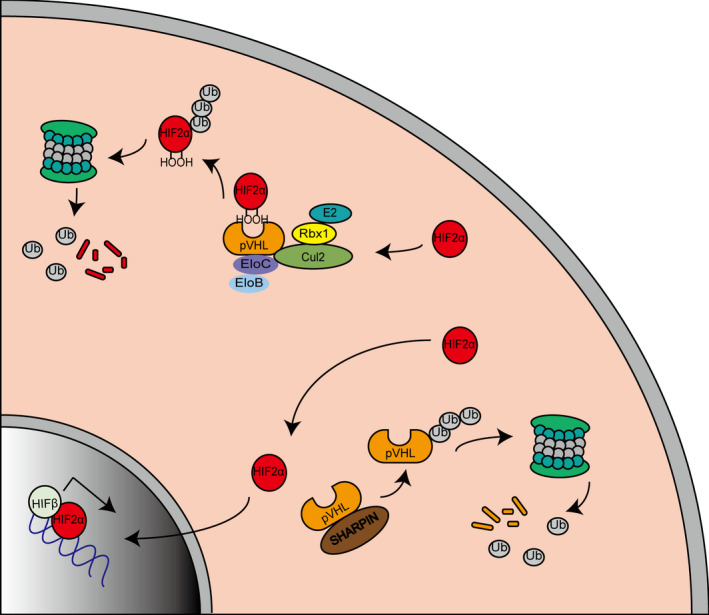
Schematic model of clear cell renal cell carcinoma cells. Hypoxia‐inducible factor‐2α (HIF‐2α) is ubiquitinated and degraded by the von Hippel‐Lindau protein (pVHL)‐mediated VHL‐Elongin B/C‐Cul‐2‐Rbx1 (VBC‐CR) complex in normoxic conditions (top left). The highly expressed SHARPIN promotes pVHL polyubiquitination and proteasomal degradation, thereby protecting HIF‐2α from degradation and promoting HIF‐2α entering the nucleus to exert its effects (bottom right)
SHARPIN is involved in multiple signaling pathways in a ubiquitin‐dependent or ubiquitin‐independent way. It regulates PTEN, p53, and estrogen receptor α stability by polyubiquitination or monoubiquitination modifications.38, 39, 40, 41 In addition, SHARPIN suppresses the recruitment of Talin and Kindlin to β1‐integrin, converting β1‐integrin from an active state to an inactive state, which is not related to ubiquitination.42 In this study, we first linked SHARPIN with the pVHL/HIF signaling pathway and determined pVHL as another substrate of SHARPIN.
Somatic mutations or epigenetic alterations result in pVHL dysfunction in most cases of ccRCC. Some pVHL inactivation mechanisms have been put forward previously,43 and some E3 ligases, such as WSB144 and Smurf1,45 have been found to regulate pVHL stability through the ubiquitin‐proteasome system. However, how these proteins bind to pVHL is unclear. In our research, SHARPIN was recognized as a new epigenetic regulator to facilitate pVHL ubiquitination, and the UBL domain of SHARPIN and the α and β domains of pVHL are required for the interaction, implying the importance of both α and β domains encoded by exon 2 and 3 for the normal tumor suppressor function of pVHL, which is consistent with mutational hotspots displayed by a tumor‐derived inactivation mutation analysis of VHL.46 According to Schoenfeld et al,47 amino acids 155‐197, belonging to the α domain, are vital for pVHL to bind to Elongin B and Elongin C, making pVHL resistant to ubiquitination‐mediated proteasomal degradation. Here, our research found that the amino acids 100‐166 of pVHL are necessary for interaction with SHARPIN, which partially overlaps with the binding region of pVHL with Elongin B/C, suggesting that SHARPIN could work by disrupting the interaction between pVHL and Elongin B/C.
Sorafenib is the first TKI recognized for treating advanced RCC effectively and had been approved as a first‐line therapy. Although single‐agent use of sorafenib brings a survival benefit,5 the long‐term hypoxic environment caused by sorafenib induces a cellular response switch from a HIF‐1α‐dependent pathway to a HIF‐2α‐dependent pathway, leading to more aggressiveness and the acquired sorafenib resistance of tumors.48 In our study, we discovered that the knockdown of SHARPIN effectively attenuates acquired sorafenib resistance, which could be because HIF‐2α is reduced by the inhibition of SHARPIN. The present studies show that HIF‐2α is a new target to treat advanced ccRCC. The HIF‐2 antagonist PT238511 and MK‐6482 (previously known as PT2977)49 has been synthesized to disrupt HIF‐2α/HIF‐β heterodimerization by occupying the ligand‐binding pocket of HIF‐2α and to inhibit the HIF‐2α target gene expression. And the latter has lower drug exposure variability and higher activity. The phase I/II studies (NCT02974738 and NCT03401788) verify the good tolerability and safety of MK‐6482. Based on the phase II study, MK‐6482 shows a long‐lasting response in patients with VHL‐associated ccRCC, with a confirmed objective response rate of 36.1%. Compared with TKI, the HIF‐2 antagonist has a greater activity and is still active in sunitinib‐progressing tumors.13 The combined use of HIF2α siRNA and sorafenib has a better efficacy than when these agents are used separately at the cytological level.50 Thus, inhibiting SHARPIN, upstream of HIF‐2α, might be another good choice for overcoming TKI resistance.
There are still some limitations in our research. First, we verified that SHARPIN promotes pVHL ubiquitination and degradation, but whether SHARPIN acts alone or through LUBAC is not clear. Second, a phenomenon that cannot be ignored is that, in pVHL‐null 769‐P cells, HIF‐2α is affected by the SHARPIN knockdown only under hypoxic conditions. This suggested that SHARPIN might also influence the HIF‐2α level in a pVHL‐independent way in hypoxia, and thus SHARPIN’s role in ccRCC could be more complex than we think. How SHARPIN works in pVHL‐null ccRCC cells will be our next focus.
To summarize, in this study, we identified SHARPIN’s predictive ability on the prognosis of patients and its action mechanisms in ccRCC. SHARPIN stabilizes HIF‐2α by promoting pVHL ubiquitination and degradation, which is a new epigenetic inactivation mechanism for pVHL. The fact that knockdown of SHARPIN prohibits sorafenib‐resistant ccRCC cell growth also puts forward a novel molecular target for treatment in ccRCC.
CONFLICT OF INTEREST
The authors have no conflict of interest.
Supporting information
Fig S1
ACKNOWLEDGMENT
This work was supported by the National Natural Science Foundation of China (grant number 81602227).
Yin R, Liu S. SHARPIN regulates the development of clear cell renal cell carcinoma by promoting von Hippel‐Lindau protein ubiquitination and degradation. Cancer Sci. 2021;112:4100–4111. 10.1111/cas.15096
Funding information
National Natural Science Foundation of China, Grant/Award Number: 81602227.
REFERENCES
- 1.Siegel RL, Miller KD, Jemal A. Cancer statistics, 2016. CA Cancer J Clin. 2016;66:7‐30. [DOI] [PubMed] [Google Scholar]
- 2.Hsieh JJ, Purdue MP, Signoretti S, et al. Renal cell carcinoma. Nat Rev Dis Primers. 2017;3:17009. [DOI] [PMC free article] [PubMed] [Google Scholar]
- 3.Capitanio U, Montorsi F. Renal cancer. Lancet. 2016;387:894‐906. [DOI] [PubMed] [Google Scholar]
- 4.Padala SA, Kallam A. Cancer, Clear Cell Renal Carcinoma. StatPearls; 2020. [PubMed] [Google Scholar]
- 5.Ye DW, Zhang HL. Critical appraisal of sorafenib in the treatment of Chinese patients with renal cell carcinoma. Onco Targets Ther. 2014;7:925‐935. [DOI] [PMC free article] [PubMed] [Google Scholar]
- 6.Schodel J, Grampp S, Maher ER, et al. Hypoxia, Hypoxia‐inducible Transcription Factors, and Renal Cancer. Eur Urol. 2016;69:646‐657. [DOI] [PMC free article] [PubMed] [Google Scholar]
- 7.Gossage L, Eisen T, Maher ER. VHL, the story of a tumour suppressor gene. Nat Rev Cancer. 2015;15:55‐64. [DOI] [PubMed] [Google Scholar]
- 8.Lee JW, Bae SH, Jeong JW, Kim SH, Kim KW. Hypoxia‐inducible factor (HIF‐1)alpha: its protein stability and biological functions. Exp Mol Med. 2004;36:1‐12. [DOI] [PubMed] [Google Scholar]
- 9.Shen C, Beroukhim R, Schumacher SE, et al. Genetic and Functional Studies Implicate HIF1 as a 14q Kidney Cancer Suppressor Gene. Cancer Discov. 2011;1:222‐235. [DOI] [PMC free article] [PubMed] [Google Scholar]
- 10.Murugesan T, Rajajeyabalachandran G, Kumar S, Nagaraju S, Jegatheesan SK. Targeting HIF‐2alpha as therapy for advanced cancers. Drug Discov Today. 2018;23:1444‐1451. [DOI] [PubMed] [Google Scholar]
- 11.Courtney KD, Ma Y, Diaz de Leon A, et al. HIF‐2 Complex Dissociation, Target Inhibition, and Acquired Resistance with PT2385, a First‐in‐Class HIF‐2 Inhibitor, in Patients with Clear Cell Renal Cell Carcinoma. Clin Cancer Res. 2020;26:793‐803. [DOI] [PMC free article] [PubMed] [Google Scholar]
- 12.Martinez‐Saez O, Gajate Borau P, Alonso‐Gordoa T, Molina‐Cerrillo J, Grande E. Targeting HIF‐2 alpha in clear cell renal cell carcinoma: A promising therapeutic strategy. Crit Rev Oncol Hematol. 2017;111:117‐123. [DOI] [PubMed] [Google Scholar]
- 13.Chen W, Hill H, Christie A, et al. Targeting renal cell carcinoma with a HIF‐2 antagonist. Nature. 2016;539:112‐117. [DOI] [PMC free article] [PubMed] [Google Scholar]
- 14.Rittinger K, Ikeda F. Linear ubiquitin chains: enzymes, mechanisms and biology. Open Biol. 2017;7(4):170026. [DOI] [PMC free article] [PubMed] [Google Scholar]
- 15.Wang Z, Potter CS, Sundberg JP, Hogenesch H. SHARPIN is a key regulator of immune and inflammatory responses. J Cell Mol Med. 2012;16:2271‐2279. [DOI] [PMC free article] [PubMed] [Google Scholar]
- 16.Park Y, Jin HS, Lopez J, et al. SHARPIN controls regulatory T cells by negatively modulating the T cell antigen receptor complex. Nat Immunol. 2016;17:286‐296. [DOI] [PMC free article] [PubMed] [Google Scholar]
- 17.Ikeda F, Deribe YL, Skanland SS, et al. SHARPIN forms a linear ubiquitin ligase complex regulating NF‐kappaB activity and apoptosis. Nature. 2011;471:637‐641. [DOI] [PMC free article] [PubMed] [Google Scholar]
- 18.Seymour RE, Hasham MG, Cox GA, et al. Spontaneous mutations in the mouse Sharpin gene result in multiorgan inflammation, immune system dysregulation and dermatitis. Genes Immun. 2007;8:416‐421. [DOI] [PubMed] [Google Scholar]
- 19.Tian Z, Tang J, Yang Q, Li X, Zhu J, Wu G. Atypical ubiquitin‐binding protein SHARPIN promotes breast cancer progression. Biomed Pharmacother. 2019;119:109414. [DOI] [PubMed] [Google Scholar]
- 20.Zhang Y, Huang H, Zhou H, et al. Activation of nuclear factor kappaB pathway and downstream targets survivin and livin by SHARPIN contributes to the progression and metastasis of prostate cancer. Cancer. 2014;120:3208‐3218. [DOI] [PubMed] [Google Scholar]
- 21.Tamiya H, Kim H, Klymenko O, et al. SHARPIN‐mediated regulation of protein arginine methyltransferase 5 controls melanoma growth. J Clin Invest. 2018;128:517‐530. [DOI] [PMC free article] [PubMed] [Google Scholar]
- 22.Jung J, Kim JM, Park B, et al. Newly identified tumor‐associated role of human Sharpin. Mol Cell Biochem. 2010;340:161‐167. [DOI] [PubMed] [Google Scholar]
- 23.Chandrashekar DS, Bashel B, Balasubramanya SAH, et al. UALCAN: A Portal for Facilitating Tumor Subgroup Gene Expression and Survival Analyses. Neoplasia. 2017;19:649‐658. [DOI] [PMC free article] [PubMed] [Google Scholar]
- 24.Tang Z, Li C, Kang B, Gao G, Li C, Zhang Z. GEPIA: a web server for cancer and normal gene expression profiling and interactive analyses. Nucleic Acids Res. 2017;45:W98‐W102. [DOI] [PMC free article] [PubMed] [Google Scholar]
- 25.Camp RL, Dolled‐Filhart M, Rimm DL. X‐tile: a new bio‐informatics tool for biomarker assessment and outcome‐based cut‐point optimization. Clin Cancer Res. 2004;10:7252‐7259. [DOI] [PubMed] [Google Scholar]
- 26.Liu S, Gao M, Wang X, et al. Ubenimex attenuates acquired sorafenib resistance in renal cell carcinoma by inhibiting Akt signaling in a lipophagy associated mechanism. Oncotarget. 2016;7:79141‐79153. [DOI] [PMC free article] [PubMed] [Google Scholar]
- 27.Hu G, Fang W, Liu N, Li C. Effects of mir‐128a on the invasion and proliferation of glioma U251 cells. Oncol Lett. 2019;17:891‐896. [DOI] [PMC free article] [PubMed] [Google Scholar]
- 28.Kasirer‐Friede A, Tjahjono W, Eto K, Shattil SJ. SHARPIN at the nexus of integrin, immune, and inflammatory signaling in human platelets. Proc Natl Acad Sci U S A. 2019;116:4983‐4988. [DOI] [PMC free article] [PubMed] [Google Scholar]
- 29.Liu S, Liu X, Wu F, et al. HADHA overexpression disrupts lipid metabolism and inhibits tumor growth in clear cell renal cell carcinoma. Exp Cell Res. 2019;384:111558. [DOI] [PubMed] [Google Scholar]
- 30.Chen T, Lei S, Zeng Z, et al. Linc00261 inhibits metastasis and the WNT signaling pathway of pancreatic cancer by regulating a miR‐552‐5p/FOXO3 axis. Oncol Rep. 2020;43:930‐942. [DOI] [PMC free article] [PubMed] [Google Scholar]
- 31.Feng J, Luo J, Wang H, et al. High expression of heat shock protein 10 (Hsp10) is associated with poor prognosis in oral squamous cell carcinoma. Int J Clin Exp Pathol. 2017;10:7784‐7791. [PMC free article] [PubMed] [Google Scholar]
- 32.Wihadmadyatami H, Karnati S, Hening P, et al. Ethanolic extract Ocimum sanctum Linn. induces an apoptosis in human lung adenocarcinoma (A549) cells. Heliyon. 2019;5:e02772. [DOI] [PMC free article] [PubMed] [Google Scholar]
- 33.Hanna C, Hubchak SC, Liang X, et al. Hypoxia‐inducible factor‐2alpha and TGF‐beta signaling interact to promote normoxic glomerular fibrogenesis. Am J Physiol Renal Physiol. 2013;305:F1323‐1331. [DOI] [PMC free article] [PubMed] [Google Scholar]
- 34.Chen G, Zhou J, Chen J, et al. VHL regulates NEK1 via both HIF‐2alpha pathway and ubiquitin‐proteasome pathway in renal cancer cell. Biochem Biophys Res Commun. 2019;509:797‐802. [DOI] [PubMed] [Google Scholar]
- 35.Higashimura Y, Kitakaze T, Harada N, Inui H, Nakano Y, Yamaji R. pVHL‐mediated degradation of HIF‐2alpha regulates estrogen receptor alpha expression in normoxic breast cancer cells. FEBS Lett. 2016;590:2690‐2699. [DOI] [PubMed] [Google Scholar]
- 36.Liu J, Wang Y, Gong Y, et al. Structural Insights into SHARPIN‐Mediated Activation of HOIP for the Linear Ubiquitin Chain Assembly. Cell Rep. 2017;21:27‐36. [DOI] [PubMed] [Google Scholar]
- 37.Alam SL, Sun J, Payne M, et al. Ubiquitin interactions of NZF zinc fingers. EMBO J. 2004;23:1411‐1421. [DOI] [PMC free article] [PubMed] [Google Scholar]
- 38.De Melo J, Wu V, He L, Yan J, Tang D. SIPL1 enhances the proliferation, attachment, and migration of CHO cells by inhibiting PTEN function. Int J Mol Med. 2014;34:835‐841. [DOI] [PubMed] [Google Scholar]
- 39.De Melo J, Lin X, He L, Wei F, Major P, Tang D. SIPL1‐facilitated PTEN ubiquitination contributes to its association with PTEN. Cell Signal. 2014;26:2749‐2756. [DOI] [PubMed] [Google Scholar]
- 40.Yang H, Yu S, Wang W, et al. SHARPIN Facilitates p53 Degradation in Breast Cancer Cells. Neoplasia. 2017;19:84‐92. [DOI] [PMC free article] [PubMed] [Google Scholar]
- 41.Zhuang T, Yu S, Zhang L, et al. SHARPIN stabilizes estrogen receptor alpha and promotes breast cancer cell proliferation. Oncotarget. 2017;8:77137‐77151. [DOI] [PMC free article] [PubMed] [Google Scholar]
- 42.Rantala JK, Pouwels J, Pellinen T, et al. SHARPIN is an endogenous inhibitor of beta1‐integrin activation. Nat Cell Biol. 2011;13:1315‐1324. [DOI] [PMC free article] [PubMed] [Google Scholar]
- 43.Shen C, Kaelin WG Jr. The VHL/HIF axis in clear cell renal carcinoma. Semin Cancer Biol. 2013;23:18‐25. [DOI] [PMC free article] [PubMed] [Google Scholar]
- 44.Kim JJ, Lee SB, Jang J, et al. WSB1 promotes tumor metastasis by inducing pVHL degradation. Genes Dev. 2015;29:2244‐2257. [DOI] [PMC free article] [PubMed] [Google Scholar]
- 45.Zhang C, Peng Z, Zhu M, et al. USP9X destabilizes pVHL and promotes cell proliferation. Oncotarget. 2016;7:60519‐60534. [DOI] [PMC free article] [PubMed] [Google Scholar]
- 46.Arjumand W, Sultana S. Role of VHL gene mutation in human renal cell carcinoma. Tumour Biol. 2012;33:9‐16. [DOI] [PubMed] [Google Scholar]
- 47.Schoenfeld AR, Davidowitz EJ, Burk RD. Elongin BC complex prevents degradation of von Hippel‐Lindau tumor suppressor gene products. Proc Natl Acad Sci U S A. 2000;97:8507‐8512. [DOI] [PMC free article] [PubMed] [Google Scholar]
- 48.Méndez‐Blanco C, Fondevila F, García‐Palomo A, González‐Gallego J, Mauriz JL. Sorafenib resistance in hepatocarcinoma: role of hypoxia‐inducible factors. Exp Mol Med. 2018;50(10):1‐9. [DOI] [PMC free article] [PubMed] [Google Scholar]
- 49.Xu R, Wang K, Rizzi JP, et al. 3‐[(1S,2S,3R)‐2,3‐Difluoro‐1‐hydroxy‐7‐methylsulfonylindan‐4‐yl]oxy‐5‐fluorobenzo nitrile (PT2977), a Hypoxia‐Inducible Factor 2alpha (HIF‐2alpha) Inhibitor for the Treatment of Clear Cell Renal Cell Carcinoma. J Med Chem. 2019;62:6876‐6893. [DOI] [PubMed] [Google Scholar]
- 50.Zhao D, Zhai B, He C, et al. Upregulation of HIF‐2alpha induced by sorafenib contributes to the resistance by activating the TGF‐alpha/EGFR pathway in hepatocellular carcinoma cells. Cell Signal. 2014;26:1030‐1039. [DOI] [PubMed] [Google Scholar]
Associated Data
This section collects any data citations, data availability statements, or supplementary materials included in this article.
Supplementary Materials
Fig S1