

Abstract
Submucosal invasion and lymph node metastasis are important issues affecting treatment options for early colorectal cancer (CRC). In this study, we aimed to unravel the molecular mechanism underlying the invasiveness of early CRCs. We performed RNA‐sequencing (RNA‐seq) with poorly differentiated components (PORs) and their normal counterparts isolated from T1 CRC tissues and detected significant upregulation of serum amyloid A1 (SAA1) in PORs. Immunohistochemical analysis revealed that SAA1 was specifically expressed in PORs at the invasive front of T1b CRCs. Upregulation of SAA1 in CRC cells promoted cell migration and invasion. Coculture experiments using CRC cell lines and THP‐1 cells suggested that interleukin 1β (IL‐1β) produced by macrophages induces SAA1 expression in CRC cells. Induction of SAA1 and promotion of CRC cell migration and invasion by macrophages were inhibited by blocking IL‐1β. These findings were supported by immunohistochemical analysis of primary T1 CRCs showing accumulation of M1‐like/M2‐like macrophages at SAA1‐positive invasive front regions. Moreover, SAA1 produced by CRC cells stimulated upregulation of matrix metalloproteinase‐9 in macrophages. Our data suggest that tumor‐associated macrophages at the invasive front of early CRCs promote cancer cell migration and invasion through induction of SAA1 and that SAA1 may be a predictive biomarker and a useful therapeutic target.
Keywords: colorectal cancer, serum amyloid A1, submucosal invasion, tumor microenvironment, tumor‐associated macrophage
We identified that serum amyloid A1 (SAA1) is upregulated in the poorly differentiated regions at the invasive front of T1 stage colorectal cancer (CRC). We found that tumor‐associated macrophages accumulated at the invasive front, where they stimulated SAA1 upregulation in CRC cells via interleukin 1β and promoted CRC cell migration and invasion. We also show that SAA1 secreted by CRC cells stimulates matrix metalloproteinase‐9 upregulation in macrophages at the invasive front.

1. INTRODUCTION
Colorectal cancer (CRC) is a leading cause of cancer death worldwide, and endoscopic resection of premalignant lesions or early CRCs can reduce mortality from CRC. Recent development of endoscopic therapy enables us to resect CRCs showing submucosal invasion (T1 CRC), though many T1 CRCs require additional intestinal resection with lymph node dissection due to possible lymph node metastasis (LNM).1, 2, 3 Development of accurate predictive markers for metastasis would thus be highly useful when making treatment decisions regarding T1 CRCs.
Several studies have reported histological factors predictive of LNM. These include depth of submucosal invasion ≥1000 μm (T1b), positive lymphovascular invasion, tumor budding grade 2/3 and the presence of poorly differentiated components (PORs). According to the Japanese Society for Cancer of the Colon and Rectum (JSCCR) guidelines 2019, intestinal resection with lymph node dissection is recommended for T1 CRCs with any of those risk factors.3 However, the incidence of LNM in T1b CRCs without other risk factors is only 1.3%, suggesting that additional surgery after endoscopic therapy may be overtreatment for the majority of these tumors.3 Thus, the accuracy of the current LNM prediction system using pathological examination remains unsatisfactory.
We suggest that a fuller understanding of the molecular mechanisms underlying submucosal invasion and metastasis would lead to the discovery of novel biomarkers and therapeutic targets in CRC. It is well documented that CRCs arise through accumulation of genetic and epigenetic alterations, including mutations of oncogenes and tumor suppressor genes.4, 5 It is also generally accepted that CRCs can exhibit either of two genetic instabilities, chromosomal instability or microsatellite instability, which are acquired during progression from premalignant tumors to CRC.6, 7, 8, 9 Moreover, comprehensive transcriptomic analyses revealed that molecular subtypes of CRCs are strongly associated with clinical outcome,10, 11 and more recent studies demonstrated that key regulators of intestinal tissue differentiation are aberrantly expressed in poorly differentiated CRCs.12, 13 However, most of those studies were performed on advanced tumors, and the molecular features associated with the malignant behavior of T1 CRCs have not been fully elucidated.
In the present study, we aimed to unravel the molecular mechanism underlying the invasiveness of early CRCs with PORs. To that end, we focused on PORs in T1b CRC, which is an important risk factor for LNM. We found that serum amyloid A1 (SAA1) is specifically upregulated at the invasive front of T1b CRCs. We also show that tumor‐associated macrophages (TAMs) may promote CRC cell migration and invasion through upregulation of SAA1 in CRC cells.
2. MATERIALS AND METHODS
2.1. Tissue samples
Primary T1 CRCs with PORs were collected from Japanese patients (n = 2) who underwent surgical resection at Teine‐Keijinkai Hospital and were used for RNA‐sequencing (RNA‐seq) analysis. PORs were defined as described previously.14 PORs and adjacent normal components were isolated using laser capture microdissection, after which total RNA was extracted. In addition, a total of 97 Tis (carcinoma in situ) or T1 CRCs were collected from Japanese patients at Teine‐Keijinkai Hospital and Sapporo Medical University Hospital between 2013 and 2019. Tumors were treated with endoscopic mucosal resection, endoscopic submucosal dissection, or surgical resection, after which histological analyses were carried out. The lesions were examined by a pathologist (AT) and diagnosed based on World Health Organization criteria and JSCCR guidelines.3, 15 T1 tumors were divided into two groups based on the depth of invasion: T1a (invasion depth <1000 μm) and T1b (≥1000 μm). Informed consent was obtained from all patients. Approval of this study was obtained from the Intuitional Review boards of Sapporo Medical University and Teine‐Keijinkai Hospital.
2.2. RNA‐seq analysis
Total RNA was extracted using an RNeasy Mini kit (Qiagen), after which the quality of the RNA samples was assessed using an Agilent 2100 Bioanalyzer (Agilent Technologies) with an Agilent RNA6000 nanokit (Agilent Technologies). RNA‐seq was performed using a TruSeq RNA Access Library Prep Kit (Illumina) and HiSeq 2500 (Illumina) according to the manufacturer's standard protocols. The RNA‐seq data were then analyzed using Strand NGS software (Agilent Technologies).
2.3. Immunohistochemistry and clinicopathological analysis
Immunohistochemistry was performed as described previously.16 A rabbit anti‐human SAA1 monoclonal antibody (1:1000 dilution, ab19802; Abcam), a mouse anti‐CD80 monoclonal antibody (1:100 dilution, MAB140; R&D Systems), a mouse anti‐CD163 monoclonal antibody (1:200 dilution, NCL‐L‐CD163; Leica Biosystems), a mouse anti‐CD68 monoclonal antibody (1:100 dilution, sc‐20060; Santa Cruz Biotechnology), a goat anti‐interleukin 1β (IL‐1β) polyclonal antibody (1:25 dilution, AF‐201‐NA; R&D Systems), and a rabbit anti‐matrix metalloproteinase‐9 (MMP‐9) monoclonal antibody (1:2000 dilution, ab76003; Abcam) were used. Stained slides were scanned using a NanoZoomer 2.0HT (Hamamatsu Photonics), and virtual slides were observed using NDP.view2 software (Hamamatsu Photonics). The range of the invasive front was defined as the area within 700 µm from tumor cells located at the invasive front. When the invasive front contained subcomponents with different histological grades, pictures were taken of three random areas in the respective subcomponents. In addition, for quantitative analysis of macrophage markers, pictures were taken of three random areas at the invasive front and the centers of the tumors. Areas positive for the macrophage markers were measured using ImageJ software (NIH) after performing hematoxylin‐diaminobenzidine (DAB) separation, as described.17, 18 A method of double staining immunohistochemistry is described in Methods S1.
2.4. Quantitative reverse‐transcription PCR (qRT‐PCR)
Single‐stranded cDNA was prepared using a PrimeScript RT Reagent Kit with gDNA Eraser Perfect Real Time (Takara Bio Inc). qRT‐PCR was performed using SYBR Select Master Mix (Thermo Fisher Scientific) with a 7500 Fast Real‐Time PCR System (Thermo Fisher Scientific). β‐actin (ACTB) was used as an endogenous control. Primer sequences are listed in Table S1.
2.5. Cell culture and preparation of conditioned medium (CM)
CRC cell lines (Caco2, HCT116, RKO, SW48, SW480, SW620, and T84) were obtained and cultured as described previously.19 Cancer‐associated fibroblasts (CAFs) derived from human CRC tissue were purchased from Vitro Biopharma and cultured in Dulbecco's modified Eagle's medium (DMEM) supplemented with 20% fetal bovine serum (FBS) and 1% antibiotic‐antimycotic (Thermo Fisher Scientific). To test the effect of IL‐1β on SAA1 expression, CRC cells were treated with 10 ng/mL recombinant human IL‐1β (PeproTech) for up to 48 hours. The THP‐1 human acute monocytic leukemia cell line was purchased from KAC Co. and cultured in RPMI‐1640 supplemented with 10% FBS and 1% antibiotic‐antimycotic. Macrophages were prepared as described previously.20 Briefly, to induce macrophages, THP‐1 cells (2 × 10⁵ cells in six‐well plates) were treated for 24 hours with 50 nmol/L phorbol 12‐myristate 13‐acetate (PMA; Sigma‐Aldrich). To induce TAM‐like cells, THP‐1‐derived macrophages were indirectly cocultured with CRC cells (1 × 10⁵ cells in upper chamber) for 48 hours. To obtain CM from macrophages, cells were incubated in serum‐free medium for 24 hours, after which collected CM was filtered through a 0.2‐μm filter. To test the effect of SAA1 on MMP‐9 expression, macrophages were treated for 24 hours with 500 ng/mL recombinant human Apo‐SAA (PeproTech).
2.6. siRNA and expression vectors
For SAA1 knockdown, CRC cells (3 × 10⁵ cells in six‐well plates) were transfected with 30 pmol of Silencer Select Pre‐designed siRNA (siSAA1‐1, s230673; SAA1 siSAA1‐2, s230674; Thermo Fisher Scientific) or Silencer Select Negative Control No. 1 siRNA (Thermo Fisher Scientific) using Lipofectamine RNAiMAX (Thermo Fisher Scientific). A full‐length SAA1 cDNA was amplified by PCR using cDNA derived from SW480 cells and was cloned into pLenti6/V5‐DEST. A lentiviral expression vector (pLenti6‐SAA1) was then constructed using a ViraPower Lentiviral Expression System (Thermo Fisher Scientific) as described.21 Primer sequences are listed in Table S1.
2.7. Cell viability assays
Cells were transfected with siRNAs or infected with a lentiviral vector as described above and seeded into 96‐well plates (5 × 10³ cells per well). Cell viability assays were carried out using a Cell Counting kit‐8 (Dojindo) according to the manufacturer's instructions.
2.8. Cell migration and invasion assays
Cells were transfected with siRNAs or infected with a lentiviral vector, after which transwell migration and invasion assays were performed as described.19 Cells (1 × 10⁵ to 5 × 10⁴ cells) in serum‐free medium were seeded into the upper chamber. Culture medium with 10% FBS, CM, or 1 × 10⁵ macrophages was added to the lower well. To test the effect of IL‐1β, recombinant human IL‐1β (10 ng/mL; PeproTech) was added to the upper chambers and lower wells. For neutralization of IL‐1β, a goat anti‐IL‐1β polyclonal antibody (500 ng/mL, AF‐201‐NA; R&D Systems) or a normal goat IgG control (500 ng/mL, AB‐108‐C; R&D Systems) was added to the upper chambers and lower wells.
2.9. Three‐dimensional culture
Three‐dimensional (3D) culture was performed as described previously.22 Briefly, a mixture of 2.5 × 10⁵ CAFs and 1 mL of type I collagen gel were placed in 12‐well plates (Cellmatrix type I‐A, Nitta Gelatin Inc) and incubated for 30 minutes. CRC cells (3 × 10⁵ cells) were then seeded onto the gel and cultured in DMEM supplemented with 20% FBS. On day 7, the gels were transferred to six‐well plates. On day 21, the gels were fixed with 10% formaldehyde and stained with hematoxylin/eosin. Areas of invasion were measured using ImageJ software (NIH) in five randomly selected fields per gel.
2.10. Enzyme‐linked immunosorbent assays
CRC cells were treated for 48 hours with or without recombinant human IL‐1β (10 ng/mL, PeproTech), after which SAA1 levels in culture supernatants were determined using a Human SAA ELISA kit (Abcam). Medium conditioned by macrophages was prepared as described above. Levels of IL‐1β and MMP‐9 in the CM were analyzed using a Human IL‐1 beta/IL‐1F2 Quantikine ELISA kit (R&D Systems) and a Human MMP‐9 Quantikine ELISA kit (R&D Systems) according to the manufacturer's instructions.
2.11. Statistical analysis
Fisher's exact test or chi‐squared test was used for analysis of categorical data. Quantitative variables were analyzed using Student's t‐tests or ANOVA with post hoc Tukey's tests. Values of P < .05 (two sided) were considered statistically significant. Statistical analyses were carried out using R ver. 3.3.0 (The R Foundation for Statistical Computing).
3. RESULTS
3.1. SAA1 is upregulated in PORs at the invasive front of T1 CRCs
To identify genes associated with invasiveness and metastasis of early CRCs, we isolated PORs from two T1b CRC tissue samples and from corresponding normal colorectal tissues (Figure 1A). RNA‐seq analysis revealed a series of genes that were upregulated in PORs as compared with normal tissues (Figure 1B; Table S2). Among these genes, we noted striking upregulation of SAA1. We therefore examined expression of SAA1 in a series of Tis (carcinoma in situ) and T1 CRCs (training set, n = 45). Immunohistochemistry revealed that SAA1 expression was not associated with age, gender, tumor location, or tumor size (Table 1). However, SAA1 was frequently expressed at the invasive front of T1b CRCs, whereas its expression was negative in all Tis tumors tested (Table 1; Figure 1C). We also found that SAA1 is significantly associated with tumor depth, lymphatic invasion, higher budding grades, and the presence of PORs at the invasive front of T1 CRCs (Table 1). We next examined SAA1 expression in an independent validation set which consists of T1a and T1b CRCs (n = 52). Because the validation set did not contain Tis CRCs, SAA1 did not correlate with tumor depth or lymphatic invasion (Table 2). Nonetheless, we observed the positive correlation between SAA1 staining and the presence of POR at the invasive front (Table 2). Because CRCs often exhibit multiple histological grades within the same tumors, we carefully examined SAA1 expression in 93 areas with different histological grades among the validation set tumors (Figures 1C and S1). As summarized in Figure 1D, SAA1 was strongly associated with more advanced grades.
FIGURE 1.

Identification of serum amyloid A1 (SAA1) upregulation in poorly differentiated components (PORs) of T1 colorectal cancers (CRCs). A, A histological view of a representative T1 CRC with POR. Regions isolated using laser capture microdissection are indicated by red and blue circles. B, A volcano plot of RNA‐seq analysis. Genes upregulated in PORs are indicated in red. C, Hematoxylin and eosin (H&E) staining and immunostaining of SAA1 in representative T1 CRC tissues with the indicated differentiation grades. Magnified views of the boxed areas are shown below. Note that the normal tissue shown in the figure is adjacent to a tumor, and the right upper area in the low‐power view contains SAA1‐positive CRC cells. D, Proportions of SAA1‐positive areas in T1 CRCs with the indicated grades
TABLE 1.
SAA1 expression and clinicopathological features of early CRCs in the training set
| SAA1‐positive | SAA1‐negative | P | |
|---|---|---|---|
| n = 10 | n = 35 | ||
| Age (mean ± SD) | 65.1 ± 11.5 | 66.6 ± 12.1 | NS |
| Gender (n, %) | |||
| M | 6 (60) | 23 (66) | NS |
| F | 4 (40) | 12 (34) | |
| Location (n, %) | |||
| Right | 4 (40) | 11 (31) | NS |
| Left | 6 (60) | 24 (69) | |
| Size (mean ± SD) | 19.0 ± 5.6 | 17.9 ± 10.6 | NS |
| Depth (n, %) | |||
| Tis | 0 (0) | 14 (40) | .03 |
| T1a | 1 (10) | 4 (11) | |
| T1b | 9 (90) | 17 (49) | |
| Lymphatic invasion (n, %) | |||
| − | 4 (40) | 29 (83) | .01 |
| + | 6 (60) | 6 (17) | |
| Venous invasion (n, %) | |||
| − | 7 (70) | 31 (89) | NS |
| + | 3 (30) | 4 (11) | |
| Budding grade (n, %) | |||
| 1 | 3 (30) | 30 (86) | .001 |
| 2 or 3 | 7 (70) | 5 (14) | |
| POR at invasive front (n, %) | |||
| − | 0 (0) | 33 (94) | <.001 |
| + | 10 (100) | 2 (6) | |
| N (n, %) | |||
| − | 5 (50) | 26 (74) | NS |
| + | 4 (40) | 3 (9) | |
| ND | 1 (10) | 6 (17) | |
Abbreviations: CRC, colorectal cancer; POR, poorly differentiated component; SAA1, serum amyloid A1.
TABLE 2.
SAA1 expression and clinicopathological features of T1 CRCs in the validation set
| SAA1‐positive | SAA1‐negative | P | |
|---|---|---|---|
| n = 34 | n = 18 | ||
| Age (mean ± SD) | 63.0 ± 14.0 | 66.4 ± 10.3 | NS |
| Gender (n, %) | |||
| M | 17 (50) | 12 (67) | NS |
| F | 17 (50) | 6 (33) | |
| Location (n, %) | |||
| Right | 7 (21) | 3 (17) | NS |
| Left | 27 (79) | 15 (83) | |
| Size (mean ± SD) | 18.1 ± 11.4 | 22.8 ± 19.3 | NS |
| Depth (n, %) | |||
| T1a | 4 (12) | 5 (28) | NS |
| T1b | 30 (88) | 13 (72) | |
| Lymphatic invasion (n, %) | |||
| − | 27 (79) | 14 (78) | NS |
| + | 7 (21) | 4 (22) | |
| Venous invasion (n, %) | |||
| − | 30 (88) | 14 (78) | NS |
| + | 4 (12) | 4 (22) | |
| Budding grade (n, %) | |||
| 1 | 23 (68) | 15 (83) | NS |
| 2 or 3 | 11 (32) | 3 (17) | |
| POR at invasive front (n, %) | |||
| − | 12 (35) | 15 (83) | <.01 |
| + | 22 (65) | 3 (17) | |
| N (n, %) | |||
| − | 31 (91) | 18 (100) | NS |
| + | 3 (9) | 0 (0) | |
Abbreviations: CRC, colorectal cancer; POR, poorly differentiated component; SAA1, serum amyloid A1.
3.2. SAA1 promotes migration and invasion by CRC cells
We next analyzed the function of SAA1 in CRC cells. Real‐time qRT‐PCR analysis revealed that SAA1 is expressed at various levels in CRC cell lines, among which SW480 showed the highest expression (Figure 2A). We therefore transfected SW480 cells with siRNAs targeting SAA1 (siSAA1‐1 and ‐2) and were able to successfully deplete SAA1 mRNA (Figure 2B). Subsequent cell viability assays indicated that SAA1 knockdown did not affect CRC cell proliferation (Figure 2C). By contrast, depletion of SAA1 strongly suppressed migration and invasion by CRC cells (Figure 2D,E). To confirm these results, we infected HCT116 cells with a lentiviral expression vector and established HCT116 cells stably expressing SAA1 (Figure 2F). Consistent with the knockdown experiments, ectopic expression of SAA1 did not affect CRC cell proliferation, but it significantly promoted migration and invasion (Figure 2G‐I). The ability of ectopic SAA1 expression to enhance the invasiveness of HCT116 cells was then further confirmed by evaluation of 3D collagen gel cocultures (Figure 2J).
FIGURE 2.

Serum amyloid A1 (SAA1) promotes migration and invasion by colorectal cancer (CRC) cells. A, qRT‐PCR analysis of SAA1 in CRC cell lines. Shown are means of three replications; error bars represent standard errors of the mean (SEMs). B, qRT‐PCR analysis of SAA1 in SW480 cells transfected with a control siRNA (siCtrl) or siRNAs targeting SAA1. Total RNA was extracted 48 h after transfection. Shown are means of three replications; error bars represent SEMs. C, Proliferation of SW480 cells transfected with the indicated siRNAs. Results are means of eight replications; error bars represent SEMs. Results of migration (D) and invasion (E) assays using SW480 cells transfected with the indicated siRNAs. Lower wells contain culture medium supplemented with 10% FBS. Representative results are shown on the left; summarized results are on the right. Results are means of three replications; error bars represent SEMs. F, qRT‐PCR analysis of SAA1 in HCT116 cells infected with the indicated lentiviral vector. Results are means of three replications; error bars represent SEMs. G, Proliferation of HCT116 cells infected with indicated vector. Results are means of eight replications; error bars represent SEMs. Migration (H) and invasion (I) assays using HCT116 cells infected with the indicated vector. Lower wells contain culture medium with 10% FBS. Representative results are shown on the left; summarized results are on the right. Results are means of three replications; error bars represent SEMs. J, Collagen gel invasion assays using HCT116 cells infected with the indicated vector. Results are means of three replications; error bars represent SEMs. *P < .05, **P < .01
3.3. IL‐1β induces SAA1 expression and promotes CRC cell migration and invasion
Earlier studies showed that IL‐1β induces SAA1 expression in hepatocytes and cancer cells.23, 24 When we treated HCT116 cells with recombinant human IL‐1β, we detected time‐dependent upregulation of SAA1 expression over the course of 48 hours (Figure 3A), and ELISAs revealed elevated levels of secreted SAA1 in culture medium conditioned by HCT116 cells treated with IL‐1β (Figure 3B). Treatment with IL‐1β also promoted migration and invasion by CRC cells (Figure 3C). Notably, SAA1 knockdown in IL‐1β–treated CRC cells (Figure S2) significantly diminished their migration and invasion, suggesting that IL‐1β activates CRC cell migration and invasion through upregulation of SAA1 (Figure 3D).
FIGURE 3.

IL‐1β produced by macrophages promotes migration and invasion by colorectal cancer (CRC) cells through upregulation of serum amyloid A1 (SAA1). A, qRT‐PCR analysis of SAA1 in HCT116 cells treated with recombinant human IL‐1β for the indicated periods. Shown are means of three replications; error bars represent SEMs. B, ELISA results showing SAA1 levels in culture supernatants from HCT116 cells treated with or without recombinant human IL‐1β. Shown are means of three replications; error bars represent SEMs. C, Results of migration (left) and invasion (right) assays using HCT116 cells treated with IL‐1β. Lower wells contain culture medium supplemented with 10% FBS. Representative results are shown on the left; summarized results are on the right. Results are means of three replications; error bars represent SEMs. D, Results of migration (left) and invasion (right) assays using HCT116 cells transfected with the indicated siRNAs and treated with IL‐1β. Shown are means of three replications; error bars represent SEMs. E, Workflow of coculture experiments using THP‐1–derived macrophages (MΦ) and CRC cells. F, qRT‐PCR analysis of CD80, CD163, and IL1B in THP‐1 cells; macrophages; and macrophages cocultured with the indicated CRC cell lines. Shown are means of three replications; error bars represent SEMs. G, ELISA results showing levels of IL‐1β in medium conditioned by the indicated cells. Shown are means of three replications; error bars represent SEMs. H, qRT‐PCR analysis of SAA1 in CRC cells cocultured with macrophages. *P < .05, **P < .01
3.4. IL‐1β produced by macrophages induces SAA1 expression in CRC cells
The results summarized above suggest that IL‐1β produced by cancer stromal cells may induce upregulation of SAA1 in CRC cells. To test that hypothesis, we first cocultured CRC cell lines with CAFs derived from primary CRC. However, coculture with CAFs did not lead to upregulated SAA1 expression in CRC cells (Figure S3). Next tested were macrophages, which we obtained by treating THP‐1 human monocytic leukemia cells with PMA.20 Upregulation of a pan‐macrophage marker, CD68, in the PMA‐treated THP1 cells was confirmed by qRT‐PCR (Figure S4). Macrophages were then cocultured for 48 hours with CRC cell lines in a transwell system, after which expression of the M1‐like and M2‐like macrophage markers CD80 and CD163 was assessed (Figure 3E). We found that CD163 was upregulated in all macrophages tested, which suggests they were differentiated into M2‐like cells (Figure 3F). In addition, CD80 was upregulated in macrophages cocultured with HCT116, SW48, RKO, or T84 cells, suggesting they were differentiated into a mixed M1‐like/M2‐like phenotype (Figure 3F). Notably, expression of IL1B was significantly upregulated in the mixed CD80+/CD163+ cells (Figure 3F), and ELISAs confirmed increased secretion of IL‐1β into the culture medium of CD80+/CD163+ cells (Figure 3G). Subsequent analysis of SAA1 expression in CRC cell lines cocultured with macrophages showed that with increased IL‐1β expression in macrophages, there were corresponding increases in SAA1 expression in HCT116, SW48, RKO, and T84 cells (Figure 3H). We further confirmed the production of IL‐1β by macrophages in the invasive front of primary T1 CRCs by performing double staining of CD68 and IL‐1β (Figure S5).
3.5. M1‐like and M2‐like macrophages are located in the invasive front of T1 CRCs
To confirm the above findings, we examined expression of CD80 and CD163 in primary T1 CRC specimens. Among the 52 tumors in the validation set, immunohistochemical results with sufficient signals were obtained from 47 tumors. CD163+ cells were detected throughout the tumor tissues tested, but the density of CD163+ cells was highest at the invasive fronts (Figure 4A, right). By contrast, CD80+ cells were predominantly observed at the invasive front as well as in the adjacent normal colonic mucosa (Figure 4A, left). Double staining of CD80 and CD68 confirmed that CD80+ cells in the invasive front are macrophages (Figure S6). Quantitative measurement of the areas positive for the two markers within the invasive front and intratumoral regions revealed that the invasive front regions contained larger areas positive for both markers than did intratumoral regions, suggesting that both CD80+ and CD163+ macrophages preferentially locate within the invasive front of T1 CRCs (Figure 4B,C). In addition, the CD80/CD163 ratio was greater at the invasive front (Figure 4C). When CRCs were divided into SAA1‐positive and ‐negative tumors, a difference between the invasive fronts and intratumoral regions was detected only for SAA1‐positive tumors (Figure 4D). Dividing the invasive fronts of the 47 tumors into 80 areas based on their histological grades revealed that both CD80 and CD163 positivity correlated significantly with POR (Figure 4E). When the 80 areas were divided into two groups based on SAA1 expression, accumulation of CD80+ and CD163+ cells and CD80/CD163 ratios were greater in SAA1‐positve areas (Figure 4F). Collectively, these results indicate that the presence of M1‐like/M2‐like TAMs and SAA1 expression strongly correlate with PORs at the invasive front of T1 CRCs.
FIGURE 4.

M1‐like and M2‐like macrophages are localized at the invasive front of T1 colorectal cancers (CRCs). A, Immunostaining of CD80 and CD163 in representative T1 CRC tissues. Areas positive for the indicated markers are shown below. B, Immunostaining of serum amyloid A1 (SAA1), CD80, and CD163 in representative T1 CRC tissues. Magnified views of the tumor center (blue box) and invasive front (red box) are shown below. Areas positive for the indicated markers are shown on the right. Magnified views of the boxed area (green and yellow) are shown at the bottom. C, Summarized results of CD80+ and CD163+ areas and the CD80/CD163 ratio within intratumoral (IT) regions and at the invasive front (IF). D, Summarized results for CD80 and CD163 within IT and IF regions with or without SAA1 expression. E, Summarized results for CD80 and CD163 within subregions of the invasive front of tumors with the indicated differentiation grades. F, Summarized results for CD80 and CD163 within subregions of the invasive front with or without SAA1 expression. Error bars represent SEMs. *P < .05, **P < .01
3.6. M1‐like/M2‐like macrophages promote CRC cell migration and invasion via induction of SAA1
We next assessed the functional significance of M1‐like/M2‐like macrophages to CRC cells. After collecting medium conditioned by macrophages cocultured with different CRC cell lines, as illustrated in Figure 5A, we treated HCT116 cells with the CM and assessed its effects on cell migration and invasion. We found that medium conditioned by macrophages cocultured with SW48 or RKO cells promoted significant migration and invasion by HCT116 cells, while CM from cocultures of macrophages and SW620 or Caco2 cells had limited effects (Figures 5B, S7, and S8). These results suggest that the mixture of M1‐like/M2‐like macrophages enhance the migration and invasiveness of CRC cells. To determine whether the tumor‐promoting effects on cancer cells were mediated by SAA1, we transfected HCT116 cells with siSAA1‐1 and ‐2 or control siRNA (siCtrl) and assessed their migration and invasiveness in transwell assays (Figure 5C). Without siRNA transfection, macrophages in the lower wells promoted significant migration and invasion by CRC cells (Figures 5D and S9A). On the other hand, SAA1 knockdown in CRC cells diminished their migration and invasion, suggesting that the effects of macrophages were mediated, at least in part, through induction of SAA1 in CRC cells (Figures 5E,F and S9B).
FIGURE 5.

M1‐like/M2‐like macrophages promote colorectal cancer (CRC) cell migration and invasion though upregulation of serum amyloid A1 (SAA1). A, Workflow of experiments using conditioned medium (CM) from macrophages (MΦ) cocultured with CRC cells. B, Summarized results of migration (left) and invasion (right) assays using HCT116 cells treated with CM from the indicated macrophages. Lower wells contain CM from macrophages. Results are means of three replications; error bars represent SEMs. C, Workflow of experiments using HCT116 cells with or without SAA1 knockdown. D, Results of migration (left) and invasion (right) assays using untransfected HCT116 cells cocultured with or without macrophages. Lower wells contain culture medium plus 10% FBS with or without macrophages. E, qRT‐PCR analysis of SAA1 in HCT116 cells transfected with the indicated siRNAs and cocultured with macrophages. F, Results of migration (left) and invasion (right) assays using HCT116 cells transfected with the indicated siRNAs and cocultured with macrophages. Lower wells contain culture medium with 10% FBS and macrophages. Shown are means of three replications; error bars represent SEMs. G, Schematic representation of the experiments. H, qRT‐PCR analysis of SAA1 in HCT116 cells treated for the indicated time periods with control IgG or an anti‐IL‐1β antibody. I, Results of migration (left) and invasion (right) assays using HCT116 cells with the indicated treatments. Lower wells contain culture medium with 10% FBS. Representative results are shown on the left; summarized results are on the right. Results are means of three replications; error bars represent SEMs. *P < .05, **P < .01
To evaluate the effect of IL‐1β, we performed transwell assays in the presence of an anti‐IL‐1β antibody or a control IgG (Figure 5G). Treatment with the anti‐IL‐1β antibody for 24 or 48 hours strongly suppressed SAA1 expression in HCT116 cells (Figure 5H). The anti‐IL‐1β antibody also significantly inhibited migration and invasion by CRC cells (Figure 5I). This suggests IL‐1β produced by macrophages upregulates SAA1 in CRC cells, thereby promoting CRC cell migration and invasion.
3.7. SAA1 secreted by CRC cells induces MMP‐9 upregulation in macrophages
An earlier study reported that in THP‐1 cells, SAA1 stimulates MMP‐9 upregulation at the transcriptional and translational levels via nuclear factor‐κB (NF‐κB) signaling.25 We therefore assessed expression of MMP‐9 in macrophages cocultured with CRC cells. As shown in Figure 6A, MMP‐9 expression was higher in macrophages cocultured with HCT116, SW48, RKO, or T84 cells than in those cocultured with SW620 or Caco2 cells or in macrophages cultured alone. These results are consistent with the levels of IL‐1β in macrophages and levels of SAA1 in CRC cells (Figure 3F‐H). Upregulation of secreted MMP‐9 in the culture medium of macrophages was confirmed by ELISAs (Figure 6B). We also confirmed that recombinant human SAA1 also significantly upregulated MMP‐9 expression in macrophages (Figure 6C), while SAA1 knockdown in CRC cells or treatment with an anti‐IL‐1β antibody suppressed the MMP‐9 upregulation (Figure 6D,E). Immunohistochemical analysis of MMP‐9 in representative T1 CRCs, with or without SAA1 expression (n = 4), showed that MMP‐9 is expressed by macrophages and neutrophils at the invasive front of SAA1‐positive CRCs (Figures 6F and S10). These results suggest that SAA1 secreted by CRC cells induces MMP‐9 upregulation in macrophages (Figure 6G).
FIGURE 6.
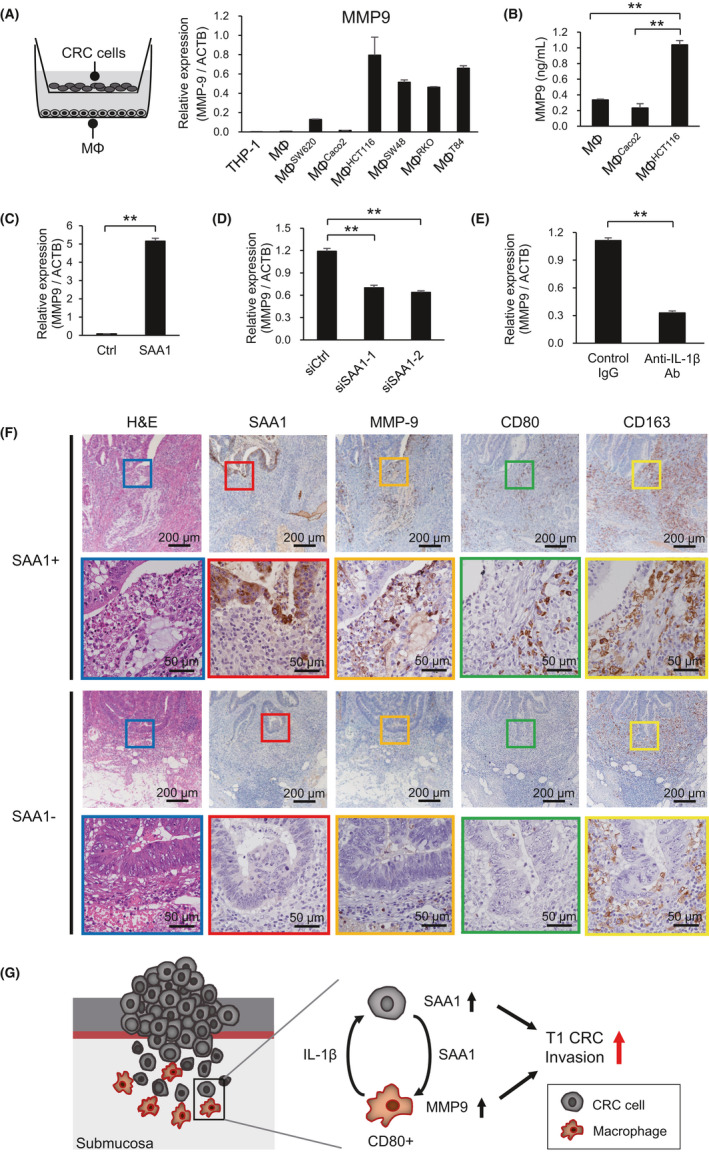
Serum amyloid A1 (SAA1) secreted by colorectal cancer (CRC) cells induces MMP‐9 upregulation in macrophages. A, qRT‐PCR analysis of MMP‐9 expression in THP‐1 cells, macrophages, and macrophages cocultured with the indicated CRC cell lines. Shown are means of three replications; error bars represent SEMs. B, ELISA results showing levels of MMP‐9 in medium conditioned by the indicated cells. Shown are means of three replications; error bars represent SEMs. C, qRT‐PCR analysis showing induction of MMP‐9 in macrophages treated with or without recombinant human SAA1 (500 ng/mL). D, qRT‐PCR analysis of MMP‐9 expression in macrophages cocultured with HCT116 transfected with the indicated siRNAs. E, qRT‐PCR analysis of MMP‐9 expression in macrophages cocultured for 48 h with HCT116 in the presence of control IgG or an anti‐IL‐β antibody. F, H&E staining and immunostaining of the indicated proteins at the invasive fronts of representative T1 CRCs with or without SAA1 expression. Magnified views of the boxed areas are shown below. G, Hypothesized mechanism of the interaction between CRC cells and macrophages at the invasive front of T1 CRCs. **P < .01
4. DISCUSSION
In the present study, we found that SAA1 is predominantly upregulated at the invasive front of T1b CRCs. SAA1 expression is significantly associated with poor differentiation of tumor cells, and functional analyses showed that SAA1 promotes migration and invasion by CRC cells. SAA1 is a member of a family of acute‐phase proteins whose expression is elevated in the blood during inflammation.26 It is therefore considered to be an ideal marker of acute and chronic inflammatory diseases. Elevated serum SAA1 levels are also reported in patients with various types of cancer, including CRC.26, 27, 28 In addition to liver, SAA1 is synthesized in tumors of nonhepatic origin, and earlier studies showed that a subset of CRC cell lines express SAA1 mRNA.26, 29, 30 Another group reported that SAA1 expression is barely detectable in normal colonic mucosa, but it gradually increases with the progression of colonic tumorigenesis.31 Although the biological function of SAA1 in CRC remained unclear for a long time, a recent study revealed that SAA1 is involved in cancer metastasis. Hansen et al32 reported that SAA1 transcription is activated by a metastasis‐inducing protein, S100A4, via Toll‐like receptor 4/NF‐κB signaling in human breast and CRC cell lines, and that SAA1 stimulates cancer cell migration and invasion. Taken together with those results, our findings strongly suggest that elevated SAA1 expression at the invasive front of early CRC contributes to submucosal invasion. Notably, SAA1 expression correlated with the presence of POR at the invasive front in both training and validation set. As earlier studies have shown that POR is significantly associated with LNM in early CRC, our results suggest that POR and SAA1 expression are strong indicators of the malignant progression of early CRC.3, 33
SAA1 is produced by hepatocytes in response to inflammatory cytokines, including IL‐1β, IL‐6, and TNF‐α.23 In addition, a recent study showed that IL‐1β induces SAA1 expression in triple negative breast cancer.24 Consistent with those observations, we found that SAA1 is induced by IL‐1β in CRC cells. IL‐1β is tightly associated with colon inflammation, colon carcinogenesis, and invasiveness of colon cancer.34 IL‐1β reportedly promotes colon cancer invasiveness through multiple mechanisms, including upregulation of ZEB1 and activation of stromal COX‐2 signaling.35, 36 In addition, our study is the first to demonstrate that IL‐1β mediates migration and invasion by CRC cells through induction of SAA1.
Within the tumor microenvironment, TAMs are important sources of IL‐1β, and earlier studies have shown that M2‐like macrophages produce IL‐1β.37, 38, 39 We therefore used the THP‐1 cell line, a commonly used model of human monocytes.40 The biological behavior of PMA‐stimulated THP‐1 cells resembles that of monocyte‐derived macrophages with respect to phagocytic capacity, surface markers, and cytokine expression.41 It is well documented that macrophages are classified into two phenotypes: the classically activated (M1‐like or proinflammatory) type, which is a component of host defense and antitumor immunity, and the alternatively activated (M2‐like or anti‐inflammatory) type, which promotes tumorigenesis by releasing cytokines, growth factors, proteolytic enzymes, and angiogenetic factors.37, 42 A large number of studies have shown that TAMs resemble M2‐like macrophages, though recent studies showed that medium conditioned by CRC cell lines induces differentiation of THP‐1 cells into a mixed M1‐like/M2‐like phenotype.43, 44 Our coculture experiments revealed that four of six CRC cell lines induced differentiation of THP‐1–derived macrophages into the mixed M1‐like/M2‐like (CD80+/CD163+) phenotype. Moreover, these mixed M1‐like/M2‐like macrophages expressed higher levels of IL‐1β and exerted greater effects to induce SAA1 than CD80−/CD163+ macrophages, which suggests M1‐like macrophages may play a dominant role to upregulate SAA1 in CRC cells. We confirmed these findings by profiling macrophages in primary T1 CRCs and found that both CD80+ and CD163+ macrophages were predominantly localized at the SAA1‐positive invasive front regions.
The clinical implications of TAMs in CRCs have been investigated in a number of studies, often yielding conflicting results. For instance, earlier studies reported that tumor‐infiltrating macrophages were associated with better prognoses in CRC patients.45, 46 In addition, higher densities of macrophages at the tumor front were reportedly associated with improved survival and less recurrence or metastasis, which suggests they play a protective role.47, 48, 49 Edin et al50 also reported that increased infiltration by M1‐like macrophages at the tumor front was associated with a better prognosis in CRC and that the effect was stage dependent. By contrast, other studies showed that higher numbers of tumor‐infiltrating macrophages were associated with more aggressive behavior and poorer outcomes in CRC.51, 52 Algars et al52 showed that a high number of peritumoral macrophages correlate positively with survival, while intratumoral M2‐like macrophages were associated with a poorer prognosis, and that macrophage type and location are important factors determining the clinical behavior of CRCs. Recently, Pinto et al18 used CD68, CD80, and CD163 as macrophage markers to profile TAMs in a series of 150 CRC tumors. They found that CD80+ cells were preferentially located in the adjacent normal mucosa and at the invasive front of T1 CRCs, which is consistent with our present results. CD163+ cells were more prevalent in advanced stage tumors, and lower CD80/CD163 ratios were associated with decreased survival among patients with stage III tumors.18 Taken together, these observations are generally in agreement with the earlier suggestion that macrophages involved in cancer‐initiating inflammatory responses are immune activated, but once tumors are established, macrophages are educated to become protumoral.53 By contrast, the results of the present study suggest that M1‐like macrophages play a protumoral role at the invasive front of early CRCs.
Several studies have demonstrated that a type IV collagenase/gelatinase MMP‐9 is upregulated in stromal cells, including macrophages and neutrophils, at the invasive front of CRCs, which suggests their possible involvement in cancer invasion.54, 55, 56 In addition, Lee et al showed that SAA1 stimulates MMP‐9 expression in THP‐1 cells via a chemoattractant receptor, formyl peptide receptor like 1 (FPRL1), which suggests SAA1 plays a role in the modulation of inflammatory and immune responses.25 Our study is the first to demonstrate that MMP‐9 expression in CRC stromal cells is, at least in part, induced by SAA1 produced by cancer cells. Our findings also suggest that the interaction between cancer cells and TAMs at the tumor edge of early CRCs promotes invasion.
There are several limitations in this study. Although our results suggest that SAA1 may be a prognostic biomarker for early CRCs, further study will be required to clarify its clinical usefulness. The association between SAA1 expression and the clinical outcomes of CRC patients should be also clarified. In addition, the molecular mechanism by which SAA1 promotes cancer cell migration and invasion is not fully understood. Although we observed a strong association between poorer histological grade and SAA1 expression, its underlying mechanism remains unknown. Further studies using a larger number of clinical samples and animal models are warranted.
In summary, we found that SAA1 is upregulated at the invasive front of poorly differentiated T1 CRCs. Our data suggest that TAMs promote aggressive behavior by CRC cells through upregulation of SAA1 via IL‐1β signaling. SAA1 may be a predictive biomarker of LNM in T1b CRCs, and the crosstalk between TAMs and CRC cells via an IL‐1β–SAA1 axis may be an effective therapeutic target.
DISCLOSURE
All authors declare no conflict of interest.
Supporting information
Fig S1‐S10
Table S1‐S2
Supinfo S1
ACKNOWLEDGMENTS
We thank Ms. Mutsumi Toyota and Tomo Hatahira for technical assistance and Dr. William F. Goldman for editing the manuscript. This study was supported in part by Grants‐in‐Aid for Young Investigators from the Japan Society for Promotion of Science (JSPS KAKENHI 20K17057, G. Sudo; 20K08335, T. Kubo), Grants‐in‐Aid for Scientific Research (C) from the Japan Society for Promotion of Science (JSPS KAKENHI 18K07949, E. Yamamoto; 19K08398, H. Aoki), and the Sapporo Jikeikai Tomoiki Foundation (E. Yamamoto).
Sudo G, Aoki H, Yamamoto E, et al. Activated macrophages promote invasion by early colorectal cancer via an interleukin 1β‐serum amyloid A1 axis. Cancer Sci. 2021;112:4151–4165. 10.1111/cas.15080
Gota Sudo, Hironori Aoki, and Eiichiro Yamamoto contributed equally to this work.
Funding information
Sapporo Jikeikai Tomoiki Foundation (Grant/Award Number: '2020'); Japan Society for Promotion of Science (Grant/Award Number: 'JSPS KAKENHI 18K07949', 'JSPS KAKENHI 19K08398', 'JSPS KAKENHI 20K08335', 'JSPS KAKENHI 20K17057').
REFERENCES
- 1.Tanaka S, Kashida H, Saito Y, et al. JGES guidelines for colorectal endoscopic submucosal dissection/endoscopic mucosal resection. Dig Endosc. 2015;27:417‐434. [DOI] [PubMed] [Google Scholar]
- 2.Miyachi H, Kudo S‐E, Ichimasa K, et al. Management of T1 colorectal cancers after endoscopic treatment based on the risk stratification of lymph node metastasis. J Gastroenterol Hepatol. 2016;31:1126‐1132. [DOI] [PubMed] [Google Scholar]
- 3.Hashiguchi Y, Muro K, Saito Y, et al. Japanese Society for Cancer of the Colon and Rectum (JSCCR) guidelines 2019 for the treatment of colorectal cancer. Int J Clin Oncol. 2020;25:1‐42. [DOI] [PMC free article] [PubMed] [Google Scholar]
- 4.Vogelstein B, Fearon ER, Hamilton SR, et al. Genetic alterations during colorectal‐tumor development. N Engl J Med. 1988;319:525‐532. [DOI] [PubMed] [Google Scholar]
- 5.Cancer Genome Atlas N . Comprehensive molecular characterization of human colon and rectal cancer. Nature. 2012;487:330‐337. [DOI] [PMC free article] [PubMed] [Google Scholar]
- 6.Kimura T, Yamamoto E, Yamano H‐O, et al. A novel pit pattern identifies the precursor of colorectal cancer derived from sessile serrated adenoma. Am J Gastroenterol. 2012;107:460‐469. [DOI] [PubMed] [Google Scholar]
- 7.Yamamoto E, Suzuki H, Yamano H‐O, et al. Molecular dissection of premalignant colorectal lesions reveals early onset of the CpG island methylator phenotype. Am J Pathol. 2012;181:1847‐1861. [DOI] [PubMed] [Google Scholar]
- 8.Nowak MA, Komarova NL, Sengupta A, et al. The role of chromosomal instability in tumor initiation. Proc Natl Acad Sci USA. 2002;99:16226‐16231. [DOI] [PMC free article] [PubMed] [Google Scholar]
- 9.Markowitz SD, Bertagnolli MM. Molecular origins of cancer: Molecular basis of colorectal cancer. N Engl J Med. 2009;361:2449‐2460. [DOI] [PMC free article] [PubMed] [Google Scholar]
- 10.De Sousa E Melo F, Wang X, Jansen M, et al. Poor‐prognosis colon cancer is defined by a molecularly distinct subtype and develops from serrated precursor lesions. Nat Med. 2013;19:614‐618. [DOI] [PubMed] [Google Scholar]
- 11.Guinney J, Dienstmann R, Wang X, et al. The consensus molecular subtypes of colorectal cancer. Nat Med. 2015;21:1350‐1356. [DOI] [PMC free article] [PubMed] [Google Scholar]
- 12.Shen L, Qu X, Li H, et al. NDRG2 facilitates colorectal cancer differentiation through the regulation of Skp2‐p21/p27 axis. Oncogene. 2018;37:1759‐1774. [DOI] [PMC free article] [PubMed] [Google Scholar]
- 13.Lee LYW, Woolley C, Starkey T, et al. Serum‐ and glucocorticoid‐induced kinase Sgk1 directly promotes the differentiation of colorectal cancer cells and restrains metastasis. Clin Cancer Res. 2019;25:629‐640. [DOI] [PMC free article] [PubMed] [Google Scholar]
- 14.Ueno H, Hashiguchi Y, Kajiwara Y, et al. Proposed objective criteria for "grade 3" in early invasive colorectal cancer. Am J Clin Pathol. 2010;134:312‐322. [DOI] [PubMed] [Google Scholar]
- 15.Bosman FT, World Health Organization , International Agency for Research on Cancer . WHO Classification of Tumours of the Digestive System, 4th edn. International Agency for Research on Cancer; 2010:417. [Google Scholar]
- 16.Keira Y, Takasawa A, Murata M, et al. An immunohistochemical marker panel including claudin‐18, maspin, and p53 improves diagnostic accuracy of bile duct neoplasms in surgical and presurgical biopsy specimens. Virchows Arch. 2015;466:265‐277. [DOI] [PubMed] [Google Scholar]
- 17.Väyrynen JP, Vornanen JO, Sajanti S, Böhm JP, Tuomisto A, Mäkinen MJ. An improved image analysis method for cell counting lends credibility to the prognostic significance of T cells in colorectal cancer. Virchows Arch. 2012;460:455‐465. [DOI] [PubMed] [Google Scholar]
- 18.Pinto ML, Rios E, Durães C, et al. The two faces of tumor‐associated macrophages and their clinical significance in colorectal cancer. Front Immunol. 2019;10:1875. [DOI] [PMC free article] [PubMed] [Google Scholar]
- 19.Aoki H, Yamamoto E, Takasawa A, et al. Epigenetic silencing of SMOC1 in traditional serrated adenoma and colorectal cancer. Oncotarget. 2018;9:4707‐4721. [DOI] [PMC free article] [PubMed] [Google Scholar]
- 20.Niu Z, Shi Q, Zhang W, et al. Caspase‐1 cleaves PPARγ for potentiating the pro‐tumor action of TAMs. Nat Commun. 2017;8:766. [DOI] [PMC free article] [PubMed] [Google Scholar]
- 21.Yorozu A, Yamamoto E, Niinuma T, et al. Upregulation of adipocyte enhancer‐binding protein 1 in endothelial cells promotes tumor angiogenesis in colorectal cancer. Cancer Sci. 2020;111:1631‐1644. [DOI] [PMC free article] [PubMed] [Google Scholar]
- 22.Ikebe D, Wang B, Suzuki H, Kato M. Suppression of keratinocyte stratification by a dominant negative JunB mutant without blocking cell proliferation. Genes Cells. 2007;12:197‐207. [DOI] [PubMed] [Google Scholar]
- 23.De Buck M, Gouwy M, Wang JM, et al. The cytokine‐serum amyloid A‐chemokine network. Cytokine Growth Factor Rev. 2016;30:55‐69. [DOI] [PMC free article] [PubMed] [Google Scholar]
- 24.Ignacio RMC, Gibbs CR, Kim S, Lee ES, Adunyah SE, Son DS. Serum amyloid A predisposes inflammatory tumor microenvironment in triple negative breast cancer. Oncotarget. 2019;10:511‐526. [DOI] [PMC free article] [PubMed] [Google Scholar]
- 25.Lee HY, Kim M‐K, Park KS, et al. Serum amyloid A stimulates matrix‐metalloproteinase‐9 upregulation via formyl peptide receptor like‐1‐mediated signaling in human monocytic cells. Biochem Biophys Res Commun. 2005;330:989‐998. [DOI] [PubMed] [Google Scholar]
- 26.Malle E, Sodin‐Semrl S, Kovacevic A. Serum amyloid A: an acute‐phase protein involved in tumour pathogenesis. Cell Mol Life Sci. 2009;66:9‐26. [DOI] [PMC free article] [PubMed] [Google Scholar]
- 27.Glojnarić I, Casl MT, Simić D, Lukac J. Serum amyloid A protein (SAA) in colorectal carcinoma. Clin Chem Lab Med. 2001;39:129‐133. [DOI] [PubMed] [Google Scholar]
- 28.Toriola AT, Cheng T‐Y, Neuhouser ML, et al. Biomarkers of inflammation are associated with colorectal cancer risk in women but are not suitable as early detection markers. Int J Cancer. 2013;132:2648‐2658. [DOI] [PMC free article] [PubMed] [Google Scholar]
- 29.Polyak K, Xia Y, Zweier JL, Kinzler KW, Vogelstein B. A model for p53‐induced apoptosis. Nature. 1997;389:300‐305. [DOI] [PubMed] [Google Scholar]
- 30.Parle‐McDermott A, McWilliam P, Tighe O, Dunican D, Croke DT. Serial analysis of gene expression identifies putative metastasis‐associated transcripts in colon tumour cell lines. Br J Cancer. 2000;83:725‐728. [DOI] [PMC free article] [PubMed] [Google Scholar]
- 31.Gutfeld O, Prus D, Ackerman Z, et al. Expression of serum amyloid A, in normal, dysplastic, and neoplastic human colonic mucosa: implication for a role in colonic tumorigenesis. J Histochem Cytochem. 2006;54:63‐73. [DOI] [PubMed] [Google Scholar]
- 32.Hansen MT, Forst B, Cremers N, et al. A link between inflammation and metastasis: serum amyloid A1 and A3 induce metastasis, and are targets of metastasis‐inducing S100A4. Oncogene. 2015;34:424‐435. [DOI] [PubMed] [Google Scholar]
- 33.Ueno H, Hase K, Hashiguchi Y, et al. Novel risk factors for lymph node metastasis in early invasive colorectal cancer: a multi‐institution pathology review. J Gastroenterol. 2014;49:1314‐1323. [DOI] [PubMed] [Google Scholar]
- 34.Voronov E, Apte RN. IL‐1 in colon inflammation, colon carcinogenesis and invasiveness of colon cancer. Cancer Microenviron. 2015;8:187‐200. [DOI] [PMC free article] [PubMed] [Google Scholar]
- 35.Li Y, Wang L, Pappan L, Galliher‐Beckley A, Shi J. IL‐1β promotes stemness and invasiveness of colon cancer cells through Zeb1 activation. Mol Cancer. 2012;11:87. [DOI] [PMC free article] [PubMed] [Google Scholar]
- 36.Zhu Y, Zhu M, Lance P. IL1β‐mediated Stromal COX‐2 signaling mediates proliferation and invasiveness of colonic epithelial cancer cells. Exp Cell Res. 2012;318:2520‐2530. [DOI] [PubMed] [Google Scholar]
- 37.Mantovani A, Sica A. Macrophages, innate immunity and cancer: balance, tolerance, and diversity. Curr Opin Immunol. 2010;22:231‐237. [DOI] [PubMed] [Google Scholar]
- 38.Arima K, Komohara Y, Bu L, et al. Downregulation of 15‐hydroxyprostaglandin dehydrogenase by interleukin‐1β from activated macrophages leads to poor prognosis in pancreatic cancer. Cancer Sci. 2018;109:462‐470. [DOI] [PMC free article] [PubMed] [Google Scholar]
- 39.Hide T, Komohara Y, Miyasato Y, et al. Oligodendrocyte progenitor cells and macrophages/microglia produce glioma stem cell niches at the tumor border. EBioMedicine. 2018;30:94‐104. [DOI] [PMC free article] [PubMed] [Google Scholar]
- 40.Chanput W, Mes JJ, Wichers HJ. THP‐1 cell line: an in vitro cell model for immune modulation approach. Int Immunopharmacol. 2014;23:37‐45. [DOI] [PubMed] [Google Scholar]
- 41.Daigneault M, Preston JA, Marriott HM, Whyte MK, Dockrell DH. The identification of markers of macrophage differentiation in PMA‐stimulated THP‐1 cells and monocyte‐derived macrophages. PLoS One. 2010;5:e8668. [DOI] [PMC free article] [PubMed] [Google Scholar]
- 42.Qian BZ, Pollard JW. Macrophage diversity enhances tumor progression and metastasis. Cell. 2010;141:39‐51. [DOI] [PMC free article] [PubMed] [Google Scholar]
- 43.Wu T‐H, Li Y‐Y, Wu T‐L, et al. Culture supernatants of different colon cancer cell lines induce specific phenotype switching and functional alteration of THP‐1 cells. Cell Immunol. 2014;290:107‐115. [DOI] [PubMed] [Google Scholar]
- 44.Sawa‐Wejksza K, Dudek A, Lemieszek M, Kaławaj K, Kandefer‐Szerszeń M. Colon cancer‐derived conditioned medium induces differentiation of THP‐1 monocytes into a mixed population of M1/M2 cells. Tumour Biol. 2018;40:1010428318797880. [DOI] [PubMed] [Google Scholar]
- 45.Nagorsen D, Voigt S, Berg E, Stein H, Thiel E, Loddenkemper C. Tumor‐infiltrating macrophages and dendritic cells in human colorectal cancer: relation to local regulatory T cells, systemic T‐cell response against tumor‐associated antigens and survival. J Transl Med. 2007;5:62. [DOI] [PMC free article] [PubMed] [Google Scholar]
- 46.Zhang Q‐W, Liu L, Gong C‐Y, et al. Prognostic significance of tumor‐associated macrophages in solid tumor: a meta‐analysis of the literature. PLoS One. 2012;7:e50946. [DOI] [PMC free article] [PubMed] [Google Scholar]
- 47.Nakayama Y, Nagashima N, Minagawa N, et al. Relationships between tumor‐associated macrophages and clinicopathological factors in patients with colorectal cancer. Anticancer Res. 2002;22:4291‐4296. [PubMed] [Google Scholar]
- 48.Forssell J, Oberg A, Henriksson ML, Stenling R, Jung A, Palmqvist R. High macrophage infiltration along the tumor front correlates with improved survival in colon cancer. Clin Cancer Res. 2007;13:1472‐1479. [DOI] [PubMed] [Google Scholar]
- 49.Zhou Q, Peng R‐Q, Wu X‐J, et al. The density of macrophages in the invasive front is inversely correlated to liver metastasis in colon cancer. J Transl Med. 2010;8:13. [DOI] [PMC free article] [PubMed] [Google Scholar]
- 50.Edin S, Wikberg ML, Dahlin AM, et al. The distribution of macrophages with a M1 or M2 phenotype in relation to prognosis and the molecular characteristics of colorectal cancer. PLoS One. 2012;7:e47045. [DOI] [PMC free article] [PubMed] [Google Scholar]
- 51.Kang JC, Chen JS, Lee CH, Chang JJ, Shieh YS. Intratumoral macrophage counts correlate with tumor progression in colorectal cancer. J Surg Oncol. 2010;102:242‐248. [DOI] [PubMed] [Google Scholar]
- 52.Ålgars A, Irjala H, Vaittinen S, et al. Type and location of tumor‐infiltrating macrophages and lymphatic vessels predict survival of colorectal cancer patients. Int J Cancer. 2012;131:864‐873. [DOI] [PubMed] [Google Scholar]
- 53.Noy R, Pollard JW. Tumor‐associated macrophages: from mechanisms to therapy. Immunity. 2014;41:49‐61. [DOI] [PMC free article] [PubMed] [Google Scholar]
- 54.Zeng ZS, Guillem JG. Colocalisation of matrix metalloproteinase‐9‐mRNA and protein in human colorectal cancer stromal cells. Br J Cancer. 1996;74:1161‐1167. [DOI] [PMC free article] [PubMed] [Google Scholar]
- 55.Nielsen BS, Timshel S, Kjeldsen L, et al. 92 kDa type IV collagenase (MMP‐9) is expressed in neutrophils and macrophages but not in malignant epithelial cells in human colon cancer. Int J Cancer. 1996;65:57‐62. [DOI] [PubMed] [Google Scholar]
- 56.Illemann M, Bird N, Majeed A, et al. MMP‐9 is differentially expressed in primary human colorectal adenocarcinomas and their metastases. Mol Cancer Res. 2006;4:293‐302. [DOI] [PubMed] [Google Scholar]
Associated Data
This section collects any data citations, data availability statements, or supplementary materials included in this article.
Supplementary Materials
Fig S1‐S10
Table S1‐S2
Supinfo S1