

Abstract
Mitosis is a prognostic factor for cutaneous melanoma (CM), but accurate mitosis detection in CM tissues is difficult. Therefore, the 8th Edition of the American Joint Committee on Cancer staging system has removed the mitotic rate as a category criterion of the tumor T‐category, based on the evidence that the mitotic rate was not an independent prognostic factor for melanoma survival. As single‐nucleotide polymorphisms (SNPs) have been shown to be potential predictors for cutaneous melanoma‐specific survival (CMSS), we investigated the potential prognostic value of SNPs in mitosis‐related pathway genes in CMSS by analyzing their associations with outcomes of 850 CM patients from The University of Texas MD Anderson Cancer Center in a discovery dataset and validated the findings in another dataset of 409 CM patients from the Harvard University Nurses’ Health Study and Health Professionals Follow‐up Study. In both datasets, we identified two SNPs (SDCCAG8 rs10803138 G>A and MAGI2 rs3807694 C>T) as independent prognostic factors for CMSS, with adjusted allelic hazards ratios of 1.49 (95% confidence interval = 1.17‐1.90, P = .001) and 1.45 (1.13‐1.86, P = .003), respectively. Furthermore, their combined unfavorable alleles also predicted a poor survival in both discovery and validation datasets in a dose‐response manner (P trend = .0006 and .0001, respectively). Additional functional analysis revealed that both SDCCAG8 rs10803138 A and MAGI2 rs3807694 T alleles were associated with elevated mRNA expression levels in normal tissues. Therefore, these findings suggest that SDCCAG8 rs10803138 G>A and MAGI2 rs3807694 C>T are independent prognostic biomarkers for CMSS, possibly by regulating the mRNA expression of the corresponding genes involved in mitosis.
Keywords: cutaneous melanoma, mitosis, single‐nucleotide polymorphism, survival
Mitosis is a prognostic factor for cutaneous melanoma (CM), but accurate mitosis detection in CM tissues is difficult. Therefore, the 8th Edition of the American Joint Committee on Cancer staging system has removed the mitotic rate as a category criterion of the tumor T‐category, based on the evidence that the mitotic rate was not an independent prognostic factor for melanoma survival. Since single‐nucleotide polymorphisms (SNPs) have been shown to be potential predictors for cutaneous melanoma‐specific survival (CMSS), we investigated the potential prognostic value of SNPs in mitosis‐related pathway genes in CMSS by analyzing their associations with outcomes of CM patients from The University of Texas MD Anderson Cancer Center in a discovery dataset and validated the findings in another dataset of CM patients from the Harvard University Nurses’ Health Study and Health Professionals Follow‐up Study. In both datasets, we identified two SNPs (SDCCAG8 rs10803138 G>A and MAGI2 rs3807694 C>T) as independent prognostic factors for CMSS.

1. INTRODUCTION
Cutaneous melanoma (CM) is a highly aggressive skin cancer with an estimated 106 110 new cases and 7180 deaths in 2021 in the United States.1 As CM‐specific survival (CMSS) varies greatly despite currently available therapies,2 the identification of accurate prognostic factors for CMSS could aid in tailoring clinical treatment decisions for different subgroups of CM patients.
Mitosis has long been considered a key marker of cell growth, and an elevated mitotic rate in CM tumor tissue generally suggests that the tumor is highly aggressive with a worse prognosis.3 Previous studies showed the benefits of mitosis assessment on survival and management of CM patients4, 5, 6, 7; however, the mitotic rate was hand‐calculated under the microscope by physicians and pathologists, introducing some level of uncertainty8; furthermore, an accurate detection of mitosis in thin, small CM tissue samples has been proven difficult.9 Therefore, although the previous melanoma staging manual of the American Joint Committee on Cancer (AJCC) endorsed the mitotic rate, thickness, and ulceration as prominent adverse prognostic factors for CMSS, the latest edition has removed the mitotic rate as a criterion for staging, because the mitotic rate was not an independent predictor for CMSS,10 but rather the thin tumor tissues with a mitotic rate of ≥1 mitosis per mm2 had a better prognosis than thicker tumor tissues (without mitotic figures) in CM subgroup analyses.10, 11 Therefore, identifying additional accurate indicators of mitoses to be used in predicting CMSS may enrich the melanoma staging system, improve prognostic estimates for CM, and provide a better guide for CM patient treatment.
Previous studies demonstrated that single‐nucleotide polymorphisms (SNPs) were associated with both tumor development and patient survival,12, 13 implying the possibility of specific genetic variants as prognostic factors for CMSS. In fact, some specific SNPs may affect the functions of target pathogenic molecules of melanoma, consequently affecting melanoma disease course and outcomes.14, 15, 16 Although several genome‐wide association studies (GWASs) have identified some susceptibility loci for CM,17, 18, 19 few SNPs have been reported to be associated with CMSS at the GWAS level, because those GWAS studies focused strictly on SNPs with the most‐significant P‐values, using a highly stringent correction for the multiple testing, without any recourse to the underlying molecular mechanisms, therefore limiting the opportunities for further functional analysis and prognostic estimate of clinical outcomes.20, 21 However, a hypothesis‐driven post‐GWAS strategy has some advantages by using available genotyping data from previously published GWAS datasets in identifying functional genetic variants in targeted biological pathway genes and clarify their associations with CMSS at a pathway level.22 Therefore, to better understand the prognostic value of mitosis for CMSS, we hypothesize that genetic variants of mitosis‐related pathway genes are associated with CMSS, and we tested this hypothesis by using publicly available CM GWAS datasets.
2. MATERIALS AND METHODS
2.1. Study populations
The discovery dataset comprised genotyping and survival data on 858 patients derived from The University of Texas MD Anderson Cancer Center (MDACC) CM GWAS study (dbGaP accession #: phs000187.v1.p1). All patients were recruited from a hospital‐based case‐control study of non‐Hispanic White CM patients. In contrast, the replication dataset used genotyping and survival data on an additional 409 participants from CM GWAS datasets in the Harvard University Nurses’ Health Study (NHS) and Health Professionals Follow‐up Study (HPFS), in which incident CM cases among Whites were collected during the follow‐up over 14 years. Definition of the participants and methods of data collection for both discovery and validation datasets have been published in detail elsewhere.18, 23 All the participants provided a written‐informed consent under a protocol approved by the Institutional Review Boards of MDACC, Brigham and Women's Hospital, and Harvard TH Chan School of Public Health, and those of participating registries as required.
2.2. Gene selection
Based on Molecular Signatures Database of the Gene Set Enrichment Analysis (GSEA) website (http://software.broadinstitute.org/gsea/msigdb/search.jsp), we comprehensively identified 226 mitosis‐related pathway genes located only on the autosomes (Table S1). As females have two copies of the X chromosome and there are no recognized statistical analytic methods established for sex‐specific analysis, we did not include genes on the X chromosome in the final analysis.
2.3. SNP genotyping
Details involving genomic DNA extracting and genotyping data obtaining from the MDACC, NHS, and HPFS datasets are presented in Document S1.
2.4. Statistical methods
We first assessed associations between all available SNPs in mitosis‐related pathway genes and CMSS in a single‐locus Cox proportional hazards regression analysis. Then, we performed multivariate Cox proportional hazards regression analyses with adjustment for available covariates in the MDACC dataset (including age, sex, Breslow thickness, mitotic rate, distant/regional metastasis and ulceration); however, in the replication (NHS/HPFS) dataset, the only available covariates for adjustment were age and sex. We used the less stringent Bayesian False Discovery Probability (BFDP) for multiple testing correction, because the vast majority of the SNPs under investigation is in high linkage disequilibrium (LD) and we intended to identify the functional SNPs with such a relaxed correction method. We subsequently evaluated cumulative effects of identified SNPs via Kaplan‐Meier (KM) survival curves, also showing the associations between CM survival probability and combined alleles. The receiver operating characteristic (ROC) curve and time‐dependent area under the curve (AUC) were calculated to predict the effects of both clinical and genetic variables on CMSS. To evaluate the genotype‐phenotype correlation between genotypes of identified SNPs and mRNA expression levels of their genes, we performed expression quantitative trait loci (eQTL) analyses using the data from the genotype‐tissue expression (GTEx) project and 1000 Genomes project. Finally, we assessed the association between the mRNA expression levels and CM survival using KM analysis (https://www.proteinatlas.org) with data from The Cancer Genome Atlas (TCGA) database. Other details are presented in Document S1.
3. RESULTS
3.1. Baseline characteristics of study populations
Baseline characteristics of CM patients from MDACC, NHS, and HPFS datasets are described in Table S2. MDACC CM patients were between 17 and 94 y of age (mean 52.4 ± 14.4 y) at diagnosis, of whom 57.8% were men, and 82.6% had a stage I/II disease; the median follow‐up time was 81.1 mo, and 11.1% died from CM. NHS/HPFS CM patients were between 34 and 87 y of age (mean 61.1 ± 10.8 y) at diagnosis, of whom 33.7% were men; the median follow‐up time was 179.0 mo, and the mortality rate was 11.5%. There was no evidence of associations between principal components and CM survival in MDACC, NHS, or HPFS datasets; therefore, there was no need for further adjustment.
3.2. Associations between SNPs in mitosis‐related pathway genes and CMSS in MDACC and NHS/HPFS datasets
Overall flowchart of the present study is shown in Figure 1. We first assessed the associations between all 25 631 acquired (4361 genotyped and 21 270 imputed) SNPs in 226 mitosis‐related pathway genes with CMSS in the MDACC dataset, and we found that 947 SNPs were associated with CMSS (P < .05) in an additive model after multiple test correction (BFDP < 0.8). In validation using the NHS/HPFS dataset, only 42 SNPs remained notably significant. These 42 SNPs are located in four genes, ie, 37 SNPs in SDCCAG8, two SNPs in CCND3, 2 SNPs in DSCC1, and one SNP in MAGI2 (Table S3).
FIGURE 1.
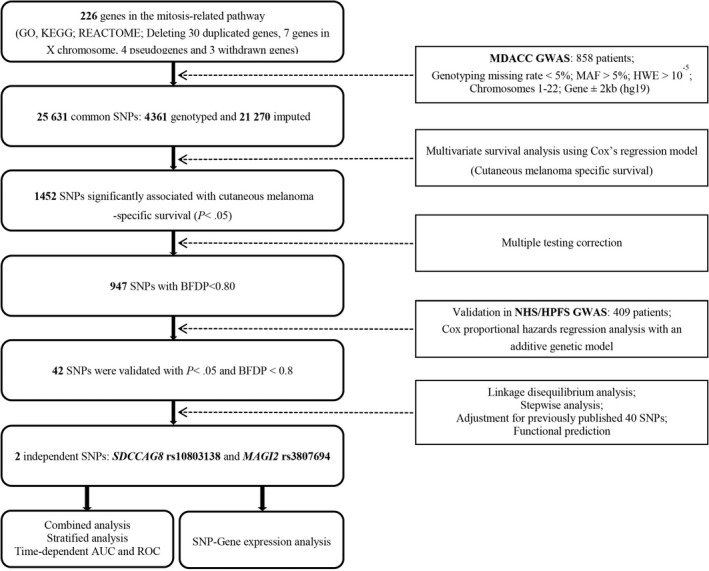
Flowchart of the study. AUC, area under the curve; BFDP, Bayesian false‐discovery probability; GWAS, genome‐wide association study; HWE, Hardy‐Weinberg equilibrium; MAF, minor allele frequency; MDACC, The University of Texas MD Anderson Cancer Center; NHS/HPFS, the Nurses’ Health Study/Health Professionals Follow‐up Study; ROC, receiver operating characteristic; SNP, single‐nucleotide polymorphism
3.3. Two independent SNPs predict CMSS
To identify independent SNPs associated with CMSS, we first performed stepwise multivariate Cox regression analyses and then LD analysis to assess the effects of 42 validated SNPs on CMSS in the MDACC dataset (but not in the NHS/HPFS dataset not containing the same clinical covariates as the MDACC dataset). Four SNPs (rs10803138, rs9394852, rs3807694 and rs62526623) in four genes (SDCCAG8, CCND3, MAGI2 and DSCC1) remained significantly associated with CMSS (P < .05) in the presence of clinical covariates. After we expanded this prediction model with adjustment for an additional 40 previously reported SNPs in the MDACC GWAS dataset, we found that two SNPs (SDCCAG8 rs10803138 G>A and MAGI2 rs3807694 C>T) remained independently and significantly associated with CMSS (P = .010 and .016, respectively) (Table 1). The meta‐analysis of these two independent SNPs in each dataset is shown in Table 2 without heterogeneity across datasets.
TABLE 1.
Two independent SNPs identified by multivariate Cox proportional hazards regression analysis among the selected variables with adjustment for previously published survival‐associated SNPs in the MDACC melanoma GWAS dataset
| Variablesa | Categoryb | Frequency | HR (95% CI)a | P a | HR (95% CI)c | P c |
|---|---|---|---|---|---|---|
| Age | ≤50/>50 | 371/487 | 1.02 (1.00‐1.04) | .032 | 1.04 (1.02‐1.06) | < .001 |
| Sex | Female/male | 362/496 | 1.70 (1.06‐2.73) | .029 | 1.19 (0.71‐2.00) | .505 |
| Regional/distant metastasis | No/yes | 709/149 | 4.28 (2.76‐6.63) | < .001 | 14.67 (7.87‐27.34) | < .001 |
| Breslow thickness (mm) | ≤1/>1 | 347/511 | 1.18 (1.12‐1.24) | <.001 | 1.23 (1.14‐1.33) | < .001 |
| Ulceration | No/yes | 681/155 | 2.49 (1.61‐3.86) | < .001 | 3.47 (2.02‐5.78) | < .001 |
| Mitotic rate (mm2) | ≤1/>1 | 275/583 | 2.49 (1.20‐5.15) | .014 | 2.43 (1.07‐5.54) | .035 |
| SDCCAG8 rs10803138 G>A | GG/GA/AA | 504/300/54 | 1.39 (1.02‐1.90) | .036 | 1.70 (1.13‐2.54) | .010 |
| MAGI2 rs3807694 C>T | CC/CT/TT | 325/404/129 | 1.38 (1.02‐1.86) | .038 | 1.59 (1.09‐2.32) | .016 |
Abbreviations: CI, confidence interval; HR, hazards ratio; MDACC, The University of Texas MD Anderson Cancer Center; SNP, single‐nucleotide polymorphism.
Stepwise analysis included age, sex, regional/distant metastasis, Breslow thickness, ulceration, mitotic rate and 42 validated SNPs.
The “category/” was used as the reference.
Forty published SNPs were used for post‐stepwise adjustment: rs1175649, rs1124379, rs10916352, rs6707820, rs6750552, rs6785564, rs2306574, rs11551405, rs1718404, rs12512631, rs788935, rs32579, rs3734398, rs7826362, rs10090371, rs7850212, rs3851552, rs10882807, rs61873997, rs35748949, rs11018104, rs7944031, rs11037684, rs508485, rs7933369, rs11225163, rs1990330, rs7953425, rs2342924, rs10846684, rs206118, rs10492396, rs3752447, rs2596191, rs782917, rs17204952, rs62068372, rs72635537, rs7253062, rs3918251.
TABLE 2.
Meta‐analysis of the two independent SNPs in mitosis‐related pathway genes identified from two previously published melanoma GWAS datasets
| SNP | Allelea | Gene | Discovery‐MDACC (n = 858) | Validation NHS/HPFS (n = 409) | Combined‐meta‐analysis (n = 1267) | |||||||||
|---|---|---|---|---|---|---|---|---|---|---|---|---|---|---|
| EAF | HR (95% CI)b | P b | BFDPc | EAF | HR (95% CI)d | P d | BFDPc | P het | I b | HR (95% CI)e | P e | |||
| rs10803138f | G>A | SDCCAG8 | 0.24 | 1.45 (1.07‐1.98) | .017 | 0.725 | 0.26 | 1.57 (1.04‐2.38) | .033 | 0.779 | .760 | 0 | 1.49 (1.17‐1.90) | .001 |
| rs3807694g | C>T | MAGI2 | 0.39 | 1.39 (1.03‐1.87) | .032 | 0.792 | 0.40 | 1.58 (1.04‐2.41) | .031 | 0.779 | .630 | 0 | 1.45 (1.13‐1.86) | .003 |
Abbreviations: BFDP, Bayesian false‐discovery probability; CI, confidence interval; EAF, effect allele frequency; GWAS, genome‐wide association study; HR, hazards ratio; MDACC, The University of Texas MD Anderson Cancer Center; NHS/HPFS, the Nurses’ Health Study/Health Professionals Follow‐up Study; P het, P value for heterogeneity by Cochrane's Q test; SNP, single‐nucleotide polymorphism.
Reference allele>effect allele.
Adjusted for age, sex, Breslow thickness, distant/regional metastasis, ulceration, and mitotic rate in an additive genetic model.
BFDP was used for multiple test correction with detected a highest HR of 2.0 and a prior probability of .1.
Adjusted for age and sex in an additive genetic model.
Meta‐analysis in a fix‐effects model.
Imputed SNP in the MDACC GWAS dataset.
Genotyped SNP in the MDACC GWAS dataset.
Furthermore, as shown in Table 3, we noticed that SDCCAG8 rs10803138 A and MAGI2 rs3807694 T alleles were both identified as prognostic risk alleles for CMSS in the MDACC dataset (P trend = .017 and .032, respectively) with similar results in the NHS/HPFS dataset (P trend = .033 and .032, respectively) and the combined MDACC and NHS/HPFS dataset (P trend = .018 and .008, respectively) (Table 3). All of the identified SNPs in the present study are depicted in a Manhattan plot (Figure S1), and regional association plots for the two SNPs are displayed in Figure S2.
TABLE 3.
Associations between the two identified independent SNPs in mitosis‐related pathway genes and CMSS of patients in the MDACC dataset, the NHS/HPFS dataset, and the combined dataset
| Genotype | MDACC (n = 858) | NHS/HPFS (n = 409) | MDACC + NHS/HPFS (n = 1267) | |||||||||
|---|---|---|---|---|---|---|---|---|---|---|---|---|
| Frequency | Multivariate analysisa | Frequency | Multivariate analysisb | Frequency | Multivariate analysisc | |||||||
| All | Death (%) | HR (95% CI) | P | All | Death (%) | HR (95% CI) | P | All | Death (%) | HR (95% CI) | P | |
| SDCCAG8 rs10803138 G>A | ||||||||||||
| GG | 504 | 51 (10.12) | 1.00 | 225 | 21 (9.33) | 1.00 | 729 | 72 (9.88) | 1.00 | |||
| GA | 300 | 36 (12.00) | 1.67 (1.07‐2.60) | .024 | 153 | 20 (13.07) | 1.42 (0.77‐2.62) | .269 | 453 | 56 (12.36) | 1.29 (0.91‐1.83) | .155 |
| AA | 54 | 8 (14.81) | 1.81 (0.85‐3.85) | .126 | 31 | 7 (22.58) | 2.65 (1.13‐6.25) | .026 | 85 | 15 (17.65) | 1.92 (1.10‐3.35) | .022 |
| Trend test | .017 | .033 | .018 | |||||||||
| MAGI2 rs3807694 C>T | ||||||||||||
| CC | 325 | 27 (8.31) | 1.00 | 140 | 13 (9.29) | 1.00 | 465 | 40 (8.60) | 1.00 | |||
| CT | 404 | 50 (12.38) | 1.43 (0.88‐2.33) | .147 | 208 | 23 (11.06) | 1.29 (0.65‐2.55) | .466 | 612 | 73 (11.93) | 1.37 (0.93‐2.01) | .113 |
| TT | 129 | 18 (13.95) | 1.92 (1.04‐3.52) | .036 | 61 | 12 (19.67) | 2.53 (1.14‐5.60) | .022 | 190 | 30 (15.79) | 1.91 (1.19‐3.06) | .008 |
| Trend test | .032 | .032 | .008 | |||||||||
| Number of combined risk allelesd | ||||||||||||
| 0 | 187 | 16 (8.56) | 1.00 | 74 | 4 (5.41) | 1.00 | 261 | 20 (7.66) | 1.00 | |||
| 1 | 366 | 33 (9.02) | 1.21 (0.64‐2.27) | .559 | 161 | 14 (8.70) | 1.56 (0.51‐4.73) | .436 | 527 | 47 (8.92) | 1.19 (0.71‐2.02) | .507 |
| 2 | 225 | 34 (15.11) | 2.23 (1.19‐4.18) | .013 | 141 | 24 (17.02) | 3.37 (1.17‐9.72) | .025 | 366 | 58 (15.85) | 2.13 (1.28‐3.53) | .004 |
| 3‐4 | 80 | 12 (15.00) | 2.78 (1.27‐6.09) | .011 | 33 | 6 (18.18) | 4.10 (1.16‐14.57) | .029 | 113 | 18 (15.93) | 2.25 (1.19‐4.26) | .013 |
| Trend test | <.001 | .002 | <.001 | |||||||||
| 0‐1 | 553 | 49 (8.86) | 1.00 | 235 | 18 (7.66) | 1.00 | 788 | 67 (8.50) | 1.00 | |||
| 2‐4 | 305 | 46 (15.08) | 2.07 (1.37‐3.13) | <.001 | 174 | 30 (17.24) | 2.53 (1.40‐4.54) | .002 | 479 | 76 (15.87) | 1.91 (1.36‐2.65) | <.001 |
Abbreviations: CI, confidence interval; CMSS, cutaneous melanoma‐specific survival; HR, hazards ratio; MDACC, The University of Texas MD Anderson Cancer Center; NHS/HPFS, the Nurses’ Health Study/Health Professionals Follow‐up Study; SNP, single‐nucleotide polymorphism.
Adjusted for age, sex, Breslow thickness, distant/regional metastasis, ulceration, and mitotic rate in Cox models in MDACC study.
Adjusted for age and sex in Harvard study.
Adjusted for age and sex in the combined dataset of the MDACC and Harvard studies.
Risk alleles include SDCCAG8 rs10803138 A allele and MAGI2 rs3807694 T allele.
3.4. Combined risk alleles of the two independent CMSS‐associated SNPs
To investigate the joint effect of the two independent SNPs on CMSS, we combined their risk alleles (ie, SDCCAG8 rs10803138 A and MAGI2 rs3807694 T alleles) into a genetic score; because the combination of genotypes from two SNPs led to a loss of power due to a small number of events in each category at the individual level, using a genetic risk score with summing up the number of risk alleles had a better discriminatory value at the patient population level, which reflects population risk of the patients who would have one (heterozygous) of the two different alleles (homozygous). Patients in each dataset were categorized into four groups (ie, 0, 1, 2, and 3‐4) based on the number of risk alleles (NRAs), and the trend tests in each dataset all revealed a significant risk‐allele dose‐response effect on survival. Specifically, an increased NRAs was associated with a worse survival in the MDACC dataset (P trend < .001), the NHS/HPFS dataset (P trend = .002) and combined MDACC and NHS/HPFS dataset (P trend < .001) after adjustment for available covariates (Table 3).
Furthermore, we dichotomized all CM patients into two groups: 0‐1 or 2‐4 NRAs. As shown in Table 3, compared with 0‐1 NRAs group, the 2‐4 NRAs group had a significantly worse CMSS in the MDACC dataset (HR = 2.07; 95% CI = 1.37‐3.13, P < .001), in the NHS/HPFS dataset (HR = 2.53; 95% CI = 1.40‐4.54, P = .002), and the combined MDACC and NHS/HPFS dataset (HR = 1.91; 95% CI = 1.36‐2.65, P < .001). In addition, we also used KM survival curves to display the associations between NRAs and CMSS (Figure 2A‐C).
FIGURE 2.

Two independent SNPs in mitosis‐related pathway genes predict cutaneous melanoma survival and eQTL analysis for them. Kaplan‐Meier survival curves of combined risk alleles of SDCCAG8 rs10803138 and MAGI2 rs3807694 on CMSS: dichotomized 0‐1 risk‐allele group and 2‐4 risk alleles group in the MDACC dataset (A), the NHS/HPFS dataset (B) and combined MDACC and NHS/HPFS dataset (C). The time‐dependent AUC estimation based on clinical variables plus risk alleles in combined MDACC and NHS/HPFS dataset (D). The 5‐y CMSS prediction by ROC curve based on clinical variables plus risk alleles in combined MDACC and NHS/HPFS dataset (E). The correlation of rs10803138 genotypes and SDCCAG8 mRNA expression in an additive model from the 1000 Genomes Project (F). The correlation of rs10803138 and SDCCAG8 mRNA expression in skin tissues and whole blood samples from the GTEx (G). Correlation of rs3807694 and MAGI2 mRNA expression levels in skin tissues from the GTEx (H). AUC, area under the curve; CMSS, cutaneous melanoma‐specific survival; eQTL, expression quantitative trait loci; GTEx, Genotype‐Tissue Expression project; HPFS, the Health Professionals Follow‐up Study; MDACC, The University of Texas MD Anderson Cancer Center; NHS, the Nurses’ Health Study; ROC, receiver operating characteristic; SNP, single‐nucleotide polymorphism
3.5. Stratified analysis for the effect of NRAs on CMSS
To assess whether the effects of NRAs on CMSS were modified by other clinical covariates, we performed stratified analysis in both MDACC and NHS/HPFS datasets. Compared with CM patients with 0‐1 NRAs, survival was significantly poorer among CM patients with 2‐4 NRAs, except for the subgroup aged≤50 and having Breslow thickness≤1 mm in the MDACC dataset and the subgroup of men aged ≤50 in the NHS/HPFS dataset. The statistics showed no interactions among the subgroups of each covariate (Table S4). In particular, we noticed that no interactions between the NRAs and mitosis rate.
3.6. ROC curves and time‐dependent AUC of the two independent SNPs for CMSS prediction
To further evaluate predictive value of the two independent SNPs, we constructed time‐dependent AUC and ROC curves for CM patients in the presence of available clinical covariates. In the MDACC dataset, although the time‐dependent AUC in the model with clinical variables increased from 85.74% to 86.83% when risk alleles were added, the predictive performance of 5‐y CMSS ROC curves was not significantly improved (P = .108) (Figure S3A,B). However, the prediction performance of 5‐y CMSS ROC curves were dramatically improved after the risk alleles were added to the model for stages I CM only; and the time‐dependent AUC significantly increased from 86.83% to 92.73% with clinical variables as classifiers (P = .023) (Figure S3C,D). In the NHS/HPFS dataset, the predictive performance of 5‐y CMSS ROC curves in the model with demographic covariables (ie, age and sex) was also dramatically improved by adding the risk alleles (P = 5.68 × 10⁻⁵), and the time‐dependent AUC increased from 54.05% to 78.76% (Figure S3E,F). Finally, in the combined MDACC and NHS/HPFS dataset, the predictive performance of 5‐y CMSS ROC curves in the model with demographic variables (ie, age and sex) was also significantly improved by adding the risk alleles (P = .024), and time‐dependent AUC increased from 63.60% to 68.21% (Figure 2D,E). We also evaluated 10‐y CMSS ROC curves in the MDACC dataset, but the predictive performance of 10‐y CMSS ROC curves was not significantly improved (data not presented).
3.7. Functional predictions of the two independent SNPs
To identify biological functions of the two independent SNPs associated with CMSS, we explored SNP‐related genomics data using online bioinformatics tools (HaploReg, https://pubs.broadinstitute.org/mammals/haploreg/haploreg.php). We noticed that the SDCCAG8 rs10803138 G>A change may disturb protein motifs; similarly, other identified significant SNPs showing a high LD (r 2 ≥ .8) with rs10803138 in the present study may also be involved in regulating the expression of histone in specific regions, DNase expression, and protein binding. In addition, the MAGI2 rs3807694 C>T change was also predicted to disturb protein motifs (Table S3). By extracting data from the Encyclopedia of DNA Elements (ENCODE) project, we found that rs10803138 was probably located on the H3K4Me1 and H3K27Ac motifs, while rs3807694 was probably located on the H3K4Me1 motif (Figure S4). These findings strongly imply that the two independent SNPs may disturb their gene expression by transcriptional regulation.
3.8. Two independent SNPs regulate their corresponding mRNA expression
To further explore molecular mechanisms underlying the associations between the two independent SNPs and CMSS, we established correlations between risk alleles of the two independent SNPs and their corresponding mRNA expression levels by eQTL analysis. In RNA‐Seq data of lymphoblastoid cell lines from 373 European descendants (obtained from the 1000 Genomes Project), the rs10803138 A allele showed a significant correlation with increased expression levels of SDCCAG8 mRNA in all additive, dominant, and recessive models (P < .001, P = .007 and P = .002, respectively) (Figures 2F and S5A,B); however, there was no correlation between the rs3807694 T allele and expression levels of MAGI2 mRNA in any of the three genetic models (Figure S5C‐E). Additionally, we performed eQTL by extracting data from the GTEx Project. The results showed that the rs10803138 A allele was significantly associated with increased expression levels of SDCCAG8 mRNA in normal tissues from sun‐exposed lower leg skin (P = 3.9 × 10⁻³), unexposed suprapubic skin (P = 5.86 × 10⁻³) and whole blood (P = 1.74 × 10⁻⁷) (Figure 2G), all these were consistent with findings from the 1000 Genomes Project. However, the rs3807694 T allele was significantly correlated with higher expression levels of MAGI2 mRNA in normal tissues from sun‐exposed lower leg skin (P = 4.74 × 10⁻³) (Figure 2H) but not in normal tissues from unexposed suprapubic skin (P = .720) (Figure S5F).
Finally, we evaluated the mRNA expression levels of SDCCAG8 and MAGI2 in 104 primary CM tissues and 368 metastatic CM tissues available from TCGA database (data obtained from http://ualcan.path.uab.edu/index.html). As shown in Figure S6A,C, mRNA expression levels of SDCCAG8 and MAGI2 were both significantly higher in metastatic CM tissues (P = 4.73 × 10⁻⁷ and P = 4.62 × 10⁻⁴, respectively) than in primary CM tissues. Furthermore, we found that a higher expression level of SDCCAG8 mRNA was significantly associated with a worse CM survival, as shown by the KM survival curve (P = .024) (data obtained from The Human Protein Atlas, www.proteinatlas.org) (Figure S6B). However, the expression level of MAGI2 mRNA was not significantly associated with CM survival (P = .220) (data obtained from The Human Protein Atlas, www.proteinatlas.org) (Figure S6D).
4. DISCUSSION
In the present study, we explored the associations between 25 631 SNPs of 226 mitosis‐related pathway genes and CMSS using available genotyping and data of 1267 CM patients from two reported CM GWAS datasets. We identified two SNPs (SDCCAG8 rs10803138 G>A and MAGI2 rs3807694 C>T) that were independently associated with CMSS. In addition, we found that the SDCCAG8 rs10803138 A allele was significantly associated with an increased mRNA expression of the gene, while the MAGI2 rs3807694 T allele was significantly associated with a higher mRNA expression of the gene. Furthermore, our results revealed that the mRNA expression of SDCCAG8 and MAGI2 were both increased in CM metastatic tissues, and a higher expression level of SDCCAG8 mRNA was significantly associated with a poorer survival in CM patients.
The presence of mitoses, as well as tumor thickness and distant metastases, was considered a strong prognostic factor for CM.24, 25, 26 The seventh edition of AJCC recommended that the mitotic rate be used as a prognostic variable to stratify the T‐category in T1 melanoma.27 However, recent results on prognostic value of the mitotic rate have been controversial. In the AJCC updated edition, therefore, the mitotic rate was demonstrated not to be a valid independent prognostic variable in a multivariate analysis for predicting CMSS.10 This inconsistency may be due not only to the misuse of mitotic rate count as a cut‐off dichotomous variable, but it is also rooted in the difficulty of accurately measuring mitosis rate in CM tumor tissue.8, 28, 29, 30, 31 In the present study, we investigated the prognostic value of genetic surrogates for mitosis in CM by analyzing associations between SNPs in mitosis‐related pathway genes and CMSS, instead of using direct assessment for the mitosis rate in CM tissues. Although databases used in the present study included limited records of 1267 Caucasian CM patients, we identified two independent SNPs as independent prognostic determinants of CMSS in a multivariate analysis with adjustment for available multi‐clinical covariates as well as 40 previously published survival‐associated SNPs. As the two independent SNPs identified in the present study were determined to have no linkage to clinical covariates, these SNPs could form a new variable for determining prognosis/survival, if validated by other investigators. In addition, we have evaluated the correlation between the NRAs of two SNPs and mitotic rate in the MDACC dataset (data not presented). We found that both rs10803138 G>A and rs3807694 C>T were not correlated with the mitotic rate in the MDACC dataset (P = .085 and .376, respectively); therefore, these two SNPs may serve as a new prognostic biomarker for CMSS, but they may not be a surrogate of the mitosis rate in the MDACC dataset.
In the present study, we found that the predictive performances of 5‐y ROC curves and time‐dependent AUC were significantly improved by adding risk alleles of the two significant SNPs to the model using the combined MDACC and NHS/HPFS dataset; although clinical variables included only age and sex in the combined dataset, the two SNPs together showed a clear potential as a key predictor of 5‐y survival for CM. Furthermore, we noticed a sharp rise in predictive performance of 5‐y ROC curves and time‐dependent AUC after adding risk alleles of the two significant SNPs to the model for stage I CM patients from the MDACC dataset with clinical variables (age, sex, ulceration, thickness, mitosis rate, and stage) as other classifiers; in particular, this improvement in performance suggested that these two SNPs should be further tested in the future development of prognostic criteria applicable to stage I CM patients, once validated.
To date, however, no published results have linked SDCCAG8 or MAGI2 to CM patient survival. SDCCAG8, also known as serologically defined colon cancer antigen 8, has been identified as playing an important role in controlling centrosomal properties and recruitment function.32 Although few reports have investigated the roles of SDCCAG8 in CM, a recent study demonstrated that the downregulation of SDCCAG8 significantly suppressed the progression of head and neck squamous cell carcinoma.33 Additionally, other previous studies also linked variations in the expression of SDCCAG8 to the invasion of tumors, as well as to specific treatment options for cancer.34, 35 To the best of our knowledge, this is the first report of an association between SDCCAG8 and CM patient survival. In the present study, the results showed that rs10803138 G>A was also significantly associated with an increased SDCCAG8 mRNA expression in both lymphoblastoid cell lines and normal skin tissues. Furthermore, in metastatic CM tissues, SDCCAG8 mRNA accumulated conspicuously and was associated with a worse CM survival. Consistent with published studies on other cancers, these observations suggest that SDCCAG8 may play an oncogenic role in CM.
MAGI2, also called membrane‐associated guanylate kinase, WW and PDZ domain containing protein 2, belongs to the membrane‐associated guanylate kinase (MAGUK) family.36 While MAGI2 functions as a regular scaffold protein in assembling and anchoring cellular signaling complexes,37 the entire MAGUK family (including MAGI2) contains a pivotal domain necessary for mitotic spindle alignment along the cortical polarity axis.38 Evidence from previous studies has shown that MAGI2 was highly expressed in neurons and podocytes, normally associated with nephritic and neurologic disorders.39, 40 In the present study, we showed that rs3807694 C>T, as a risk factor for CMSS, was associated with an elevated MAGI2 mRNA expression in normal sun‐exposed skin tissues; in addition, compared with primary CM tissues, MAGI2 mRNA was expressed at significantly elevated levels in metastatic CM tissues. These findings strongly support a potential oncogenic role of MAGI2 in CM, a possible molecular mechanism underlying the observed association between MAGI2 rs3807694 and a poor survival in CM patients. Interestingly, some reports have shown that MAGI2 functions as a tumor suppressor gene in a range of malignant tumors,41, 42, 43 but not in melanoma as evidenced in the present study. Therefore, the exact molecular mechanisms implicated in an association between MAGI2 expression levels and CM survival require additional in‐depth mechanistic studies.
Despite the above‐mentioned significant observations, several limitations in the present study should be noted. CM patients whose data were used in the present study were recruited from Caucasian populations; therefore, further validation in different ethnic CM patient cohorts should be conducted. Additionally, compared with the MDACC discovery dataset, the NHS/HPFS validation dataset had fewer participants with fewer variables for further analysis, which could reduce statistical power in validating the effects of tagSNPs. Furthermore, some clinical covariates of the study populations were not available in the NHS/HPFS dataset, limiting the validation of the findings; however, the consistent risk associations across different datasets after stratified analysis suggested that our results might not be seriously biased by the absence of clinical covariates in the validation population. Given the potential prognostic role of the two SNPs in mitosis‐related pathway genes in CMSS, these SNPs may serve either as a new prognostic biomarker for CM patients or as a clinical decision‐making indicator for their caregivers, once these findings are validated by additional large studies.
DISCLOSURE
The authors have no conflict of interest.
Supporting information
Supplementary Material
ACKNOWLEDGMENTS
The authors would like to thank Bingrong Zhou, Wei Dai, and Sen Yang for their technical assistance and all participants and staff members of the Nurses' Health Study and Health Professionals Follow‐up Study for their valuable contributions as well as the following state cancer registries for their support: AL, AZ, AR, CA, CO, CT, DE, FL, GA, ID, IL, IN, IA, KY, LA, ME, MD, MA, MI, NE, NH, NJ, NY, NC, ND, OH, OK, OR, PA, RI, SC, TN, TX, VA, WA, WY. We also thank the Johns Hopkins University Center for Inherited Disease Research for conducting high‐throughput genotyping for our study. The results published here are fully or partly based upon data from TCGA pilot project established by the NCI and NHGRI. Information about TCGA and the investigators and institutions that constitute TCGA research network can be found at “http://cancergenome.nih.gov”. We also thank all of the investigators and funding agencies that enabled the deposition of data in dbGaP that we used in this study (dbGaP Study Accession: phs000187.v1.p1).
He Y, Liu H, Luo S, et al. Genetic variants of SDCCAG8 and MAGI2 in mitosis‐related pathway genes are independent predictors of cutaneous melanoma‐specific survival. Cancer Sci. 2021;112:4355–4364. 10.1111/cas.15102
REFERENCES
- 1.Siegel RL, Miller KD, Fuchs HE, Jemal A. Cancer statistics, 2021. CA Cancer J Clin. 2021;71(1):7‐33. [DOI] [PubMed] [Google Scholar]
- 2.Fecher LA, Cummings SD, Keefe MJ, Alani RM. Toward a molecular classification of melanoma. J Clin Oncol. 2007;25:1606‐1620. [DOI] [PubMed] [Google Scholar]
- 3.Dominguez‐Brauer C, Thu K, Mason J, et al. Targeting mitosis in cancer: emerging strategies. Mol Cell. 2015;60:524‐536. [DOI] [PubMed] [Google Scholar]
- 4.Oliveira Filho RS, Jorge MC, Oliveira DA, et al. The importance of mitosis as a factor for predicting sentinel lymph node biopsy for thin melanoma. An Bras Dermatol. 2011;86:S107‐S109. [DOI] [PubMed] [Google Scholar]
- 5.Francken AB, Shaw HM, Thompson JF, et al. The prognostic importance of tumor mitotic rate confirmed in 1317 patients with primary cutaneous melanoma and long follow‐up. Ann Surg Oncol. 2004;11:426‐433. [DOI] [PubMed] [Google Scholar]
- 6.Parrillas V, Martínez‐Muñoz L, Holgado BL, et al. Suppressor of cytokine signaling 1 blocks mitosis in human melanoma cells. Cell Mol Life Sci. 2013;70:545‐558. [DOI] [PMC free article] [PubMed] [Google Scholar]
- 7.Mandala M, Galli F, Cattaneo L, et al. Mitotic rate correlates with sentinel lymph node status and outcome in cutaneous melanoma greater than 1 millimeter in thickness: a multi‐institutional study of 1524 cases. J Am Acad Dermatol. 2017;76:264‐273 e262. [DOI] [PubMed] [Google Scholar]
- 8.Vollmer RT. A probabilistic analysis of mitotic counts in melanoma. Am J Clin Pathol. 2014;141:213‐218. [DOI] [PubMed] [Google Scholar]
- 9.Helm TN. Mitotic figures and the evolving staging of melanoma. J Cutan Pathol. 2017;44:358‐359. [DOI] [PubMed] [Google Scholar]
- 10.Gershenwald JE, Scolyer RA, Hess KR, et al. Melanoma staging: evidence‐based changes in the American Joint Committee on Cancer eighth edition cancer staging manual. CA Cancer J Clin. 2017;67(6):472‐492. [DOI] [PMC free article] [PubMed] [Google Scholar]
- 11.Kirkland EB, Zitelli JA. Mitotic rate for thin melanomas: should a single mitotic figure warrant a sentinel lymph node biopsy? Dermatol Surg. 2014;40:937‐945. [DOI] [PubMed] [Google Scholar]
- 12.Van den Broeck T, Joniau S, Clinckemalie L, et al. The role of single nucleotide polymorphisms in predicting prostate cancer risk and therapeutic decision making. Biomed Res Int. 2014;2014:627510. [DOI] [PMC free article] [PubMed] [Google Scholar]
- 13.Zienolddiny S, Skaug V. Single nucleotide polymorphisms as susceptibility, prognostic, and therapeutic markers of nonsmall cell lung cancer. Lung Cancer. 2012;3:1‐14. [DOI] [PMC free article] [PubMed] [Google Scholar]
- 14.Glatthaar H, Katto J, Vogt T, Mahlknecht U. Estrogen receptor alpha (ESR1) single‐nucleotide polymorphisms (SNPs) affect malignant melanoma susceptibility and disease course. Genet Epigenetics. 2016;8:1‐6. [DOI] [PMC free article] [PubMed] [Google Scholar]
- 15.Figl A, Scherer D, Nagore E, et al. Single nucleotide polymorphisms in DNA repair genes XRCC1 and APEX1 in progression and survival of primary cutaneous melanoma patients. Mutat Res. 2009;661:78‐84. [DOI] [PubMed] [Google Scholar]
- 16.Onken MD, Worley LA, Person E, et al. Loss of heterozygosity of chromosome 3 detected with single nucleotide polymorphisms is superior to monosomy 3 for predicting metastasis in uveal melanoma. Clin Cancer Res. 2007;13:2923‐2927. [DOI] [PubMed] [Google Scholar]
- 17.Barrett JH, Iles MM, Harland M, et al. Genome‐wide association study identifies three new melanoma susceptibility loci. Nat Genet. 2011;43:1108‐1113. [DOI] [PMC free article] [PubMed] [Google Scholar]
- 18.Amos CI, Wang L‐E, Lee JE, et al. Genome‐wide association study identifies novel loci predisposing to cutaneous melanoma. Hum Mol Genet. 2011;20:5012‐5023. [DOI] [PMC free article] [PubMed] [Google Scholar]
- 19.Bishop DT, Demenais F, Iles MM, et al. Genome‐wide association study identifies three loci associated with melanoma risk. Nat Genet. 2009;41:920‐925. [DOI] [PMC free article] [PubMed] [Google Scholar]
- 20.Fridley BL, Biernacka JM. Gene set analysis of SNP data: benefits, challenges, and future directions. Eur J Hum Genet. 2011;19:837‐843. [DOI] [PMC free article] [PubMed] [Google Scholar]
- 21.Witte JS. Genome‐wide association studies and beyond. Annu Rev Public Health. 2010;31(1):9‐20. [DOI] [PMC free article] [PubMed] [Google Scholar]
- 22.Gallagher MD, Chen‐Plotkin AS. The post‐GWAS era: from association to function. Am J Hum Genet. 2018;102:717‐730. [DOI] [PMC free article] [PubMed] [Google Scholar]
- 23.Song F, Qureshi AA, Zhan J, et al. Exonuclease 1 (EXO1) gene variation and melanoma risk. DNA Repair. 2012;11:304‐309. [DOI] [PMC free article] [PubMed] [Google Scholar]
- 24.Maurichi A, Miceli R, Camerini T, et al. Prediction of survival in patients with thin melanoma: results from a multi‐institution study. J Clin Oncol. 2014;32:2479‐2485. [DOI] [PubMed] [Google Scholar]
- 25.Murali R, Moncrieff MD, Hong J, et al. The prognostic value of tumor mitotic rate and other clinicopathologic factors in patients with locoregional recurrences of melanoma. Ann Surg Oncol. 2010;17:2992‐2999. [DOI] [PubMed] [Google Scholar]
- 26.Piñero‐Madrona A, Ruiz‐Merino G, Cerezuela Fuentes P, et al. Mitotic rate as an important prognostic factor in cutaneous malignant melanoma. Clin Transl Oncol. 2019;21(10):1348‐1356. [DOI] [PubMed] [Google Scholar]
- 27.Edge SB, Compton CC. The American Joint Committee on Cancer: the 7th Edition of the AJCC cancer staging manual and the future of TNM. Ann Surg Oncol. 2010;17(6):1471‐1474. [DOI] [PubMed] [Google Scholar]
- 28.Larson AR, Rothschild B, Walls AC, et al. Impact of the 2009 AJCC staging guidelines for melanoma on the number of mitotic figures reported by dermatopathologists at one institution. J Cutan Pathol. 2015;42:536‐541. [DOI] [PubMed] [Google Scholar]
- 29.Thompson JF, Soong S‐J, Balch CM, et al. Prognostic significance of mitotic rate in localized primary cutaneous melanoma: an analysis of patients in the multi‐institutional American Joint Committee on Cancer melanoma staging database. J Clin Oncol. 2011;29:2199‐2205. [DOI] [PMC free article] [PubMed] [Google Scholar]
- 30.Laks S, Meyers MO, Deal AM, et al. Tumor mitotic rate and association with recurrence in sentinel lymph node negative stage II melanoma patients. Am Surgeon. 2017;83:972‐978. [PubMed] [Google Scholar]
- 31.Schimming TT, Grabellus F, Roner M, et al. pHH3 immunostaining improves interobserver agreement of mitotic index in thin melanomas. Am J Dermatopathol. 2012;34:266‐269. [DOI] [PubMed] [Google Scholar]
- 32.Airik R, Slaats GG, Guo Z, et al. Renal‐retinal ciliopathy gene Sdccag8 regulates DNA damage response signaling. J Am Soc Nephrol. 2014;25:2573‐2583. [DOI] [PMC free article] [PubMed] [Google Scholar]
- 33.Huang J, Ji EH, Zhao X, et al. Sox11 promotes head and neck cancer progression via the regulation of SDCCAG8. J Exp Clin Cancer Res. 2019;38:138. [DOI] [PMC free article] [PubMed] [Google Scholar]
- 34.Liu Y, Geng YI, Li K, et al. Comparative proteomic analysis of the function and network mechanisms of MASPIN in human lung cells. Exp Ther Med. 2012;3:470‐474. [DOI] [PMC free article] [PubMed] [Google Scholar]
- 35.Rajkumar T, Vijayalakshmi N, Sabitha K, et al. A 7 gene expression score predicts for radiation response in cancer cervix. BMC Cancer. 2009;9:365. [DOI] [PMC free article] [PubMed] [Google Scholar]
- 36.Funke L, Dakoji S, Bredt DS. Membrane‐associated guanylate kinases regulate adhesion and plasticity at cell junctions. Annu Rev Biochem. 2005;74:219‐245. [DOI] [PubMed] [Google Scholar]
- 37.Balbas MD, Burgess MR, Murali R, et al. MAGI‐2 scaffold protein is critical for kidney barrier function. Proc Natl Acad Sci USA. 2014;111:14876‐14881. [DOI] [PMC free article] [PubMed] [Google Scholar]
- 38.Newman RA, Prehoda KE. Intramolecular interactions between the SRC homology 3 and guanylate kinase domains of discs large regulate its function in asymmetric cell division. J Biol Chem. 2009;284:12924‐12932. [DOI] [PMC free article] [PubMed] [Google Scholar]
- 39.Bierzynska A, Soderquest K, Dean P, et al. MAGI2 mutations cause congenital nephrotic syndrome. J Am Soc Nephrol. 2017;28:1614‐1621. [DOI] [PMC free article] [PubMed] [Google Scholar]
- 40.Peterson JF, Thakur P, Peffer A, et al. Seizure disorder in a patient with a 5.09 Mb 7q11.23‐q21.11 microdeletion including the MAGI2 gene. J Assoc Genet Technol. 2014;40:16‐21. [PubMed] [Google Scholar]
- 41.David SN, Arnold Egloff SA, Goyal R, et al. MAGI2 is an independent predictor of biochemical recurrence in prostate cancer. Prostate. 2018;78:616‐622. [DOI] [PubMed] [Google Scholar]
- 42.Kitamura K, Seike M, Okano T, et al. MiR‐134/487b/655 cluster regulates TGF‐beta‐induced epithelial‐mesenchymal transition and drug resistance to gefitinib by targeting MAGI2 in lung adenocarcinoma cells. Mol Cancer Ther. 2014;13:444‐453. [DOI] [PubMed] [Google Scholar]
- 43.Li X, Li Z, Li NA, et al. MAGI2 enhances the sensitivity of BEL‐7404 human hepatocellular carcinoma cells to staurosporine‐induced apoptosis by increasing PTEN stability. Int J Mol Med. 2013;32:439‐447. [DOI] [PubMed] [Google Scholar]
Associated Data
This section collects any data citations, data availability statements, or supplementary materials included in this article.
Supplementary Materials
Supplementary Material