Abstract
Characteristically, cancer cells metabolize glucose through aerobic glycolysis, known as the Warburg effect. Accumulating evidence suggest that during cancer formation, microRNAs (miRNAs) could regulate such metabolic reprogramming. In the present study, miR‐9‐1 was identified as significantly hypermethylated in nasopharyngeal carcinoma (NPC) cell lines and clinical tissues. Ectopic expression of miR‐9‐1 inhibited NPC cell growth and glycolytic metabolism, including reduced glycolysis, by reducing lactate production, glucose uptake, cellular glucose‐6‐phosphate levels, and ATP generation in vitro and tumor proliferation in vivo. HK2 (encoding hexokinase 2) was identified as a direct target of miR‐9‐1 using luciferase reporter assays and Western blotting. In NPC cells, hypermethylation regulates miR‐9‐1 expression and inhibits HK2 translation by directly targeting its 3' untranslated region. MiR‐9‐1 overexpression markedly reduced HK2 protein levels. Restoration of HK2 expression attenuated the inhibitory effect of miR‐9‐1 on NPC cell proliferation and glycolysis. Fluorescence in situ hybridization results indicated that miR‐9‐1 expression was an independent prognostic factor in NPC. Our findings revealed the role of the miR‐9‐1/HK2 axis in the metabolic reprogramming of NPC, providing a potential therapeutic strategy for NPC.
Keywords: glycolysis metabolism, HK2, methylation, microRNA‐9‐1, nasopharyngeal carcinoma
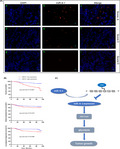
The miR‐9‐1 promoter is hypermethylated in nasopharyngeal carcinoma (NPC), thus decreasing its expression. Reduced miR‐9‐1 expression increases HK2 levels, thus increasing glycolysis. FISH score analysis showed that miR‐9‐1 is an independent prognostic factor in NPC.
1. INTRODUCTION
Nasopharyngeal carcinoma (NPC) is one of the most common types of malignancies in Southeast Asia and southern China.1 Despite significant advances in the screening and medical management of NPC, the prognosis for patients with locally advanced recurrence remains bleak.2 Accordingly, there is an urgent need to determine the mechanism of NPC progression and identify new therapeutic targets for patients with NPC.
Cancer cells alter their cellular metabolism by metabolic reprogramming to adapt to the high energy demand under rapid growth conditions.3 Aerobic glycolysis is a classical metabolic adaptation, which is referred to as the “Warburg effect,” with high glycolysis even in the presence of sufficient oxygen.4, 5 Numerous cancer types, including NPC, use this metabolic pathway to meet their energy demands during progression.6 However, little is known about the mechanisms of regulating metabolism at the post‐transcriptional level in NPC, such as the effects of microRNAs (miRNAs).
MiRNAs are endogenous small single‐stranded noncoding RNAs that repress gene expression by binding to a target mRNA in the 3'‐untranslated region (3'‐UTR).7 Accumulating evidence indicates that aberrant regulation (such as CpG island hypermethylation in miRNA coding regions) of miRNAs play critical roles in the metabolic processes of cancer cells.8, 9 In NPC, miR‐31 and miR‐34c have been shown to affect the growth metabolism of cancer cells because of hypermethylation of their promoter regions, leading to tumor proliferation,10 growth, and metastasis.11 Based on our previous genome‐wide methylation microarray study (GSE52068),12 we discovered that the coding region of miR‐9‐1, a member of the miR‐9 family, was significantly hypermethylated in NPC tissues. A recent study by Pinweha et al predicted miRNAs that regulate the expression of metabolic enzymes through bioinformatic analyses,13 and among these miRNAs, miR‐9‐1 was postulated to have a binding site on the 3'‐UTR of HK2 (encoding hexokinase 2). HK2 acts as the initial and rate‐limiting enzyme,14, 15 which is mainly involved in aerobic glycolysis, is highly expressed in some tumors,16, 17, 18 and promotes tumor growth by maintaining a high rate of glycolysis in fast‐growing tumors. However, to date, little is known about the downstream target genes and metabolism‐related functional mechanisms of miR‐9‐1 in NPC.
In the present study, we aimed to explore the mechanism of miR‐9‐1 in NPC cell proliferation and tumor progression, and to determine whether it regulates NPC glycolytic metabolism by targeting HK2, thus leading to tumor development. Furthermore, the relationship between the miR‐9‐1 expression levels and clinical features of patients with NPC was analyzed.
2. MATERIALS AND METHODS
2.1. Clinical specimens and cell culture
In the present study, 156 formalin‐fixed, paraffin embedded (FFPE) NPC tissue samples were obtained from the Wuzhou Red Cross Hospital (Wuzhou, China), and 11 normal nasopharyngeal tissue samples and 16 NPC tissue samples were obtained from the Affiliated Hospital of Guilin Medical College (Guilin, China). All patients were diagnosed pathologically with NPC and were restaged according to the eighth American Joint Committee on Cancer (AJCC) TNM staging system.19 The institutional ethical review committees of two hospitals approved this study, and informed consent was signed by all patients.
NPC cell lines, including CNE1, CNE2, SUNE1, HNE1, HONE1, 5‐8F, 6‐10B, S18, and S26, and the immortalized nasopharyngeal epithelial cell line NP69, were obtained from Sun Yat‐sen University Cancer Centre. All NPC cell lines were cultured in Roswell Park Memorial Institute (RPMI) 1640 medium (Gibco) supplemented with 5% fetal bovine serum (FBS; Gibco) at 37℃ in an atmosphere with 5% CO2. The NP69 cell line was cultured in Keratinocyte/serum‐free medium (Invitrogen).
2.2. Mimics, lentiviral vectors, and transfection
HNE1 and SUNE1 cells were seeded in a 6‐well plate. MiR‐9‐1 mimics, inhibitor, and the miRNA negative control were purchased from the RiboBio company. Vector pSin‐EF2‐puro was used to construct the miR‐9‐1 overexpression lentivector, and the lentiviral miRNA empty vectors were used as control, which were sequenced by RiboBio. Plasmid pEnter (Vigene Bioscience) was used as the basis for HK2 overexpression. All transfection operations were performed using Lipofectamine 2000 (Invitrogen) according to the manufacturer's specifications.
2.3. 5‐Aza‐2’‐deoxycytidine (DAC) treatment
NPC or NP69 cells (2.5 × 10⁵) were seeded on 60 mm culture dishes. After 24 hours, the cells were treated (every 24 hours, three times in total) with or without demethylation using DAC (10 μmol/L, sigma A3656). These cells were then collected and used to extract DNA and RNA.
2.4. MiRNA extraction and quantitative real‐time PCR
Total RNA was extracted by lysing cells in the TRIzol reagent (Invitrogen) according to the supplier's instructions. The RNA concentration and quality were determined by spectrophotometry using a NanoDrop™ 2000 (Thermo Scientific). cDNAs were synthesized by reverse transcription using a PrimeScript RT‐PCR Kit (Takara) according to the manufacturer's instructions. Quantitative real‐time PCR (qPCR) was performed using a Quantitect SYBR green PCR Master mix (Qiagen) with 1 μL of cDNA in a 10‐μL reaction. The cycling conditions comprised 10 minutes at 95℃; followed by 45 cycles of 30 seconds at 95℃ for denaturation, 1 minute at 60℃ for annealing, and 15 seconds at 72℃ for extension. After extension, a melting curve was accomplished with denaturing for 5 seconds at 95℃ and then continuous fluorescence measurement at 0.1℃ per second from 70 to 95℃. The primers used were as follows: HK2, 5'‐CCGGGAAAGCAACTGTTTGAG‐3' (forward) and 5'‐AAGCGACCGGTGTTG AGAAG‐3' (reverse); MTHFD2, 5'‐CTCCTTGT TCAGTTGCCTCTTCC‐3' (forward) and 5'‐CTGATCCAAACACATTCGTCCTAC‐3' (reverse); MTHFD1L, 5'‐ CGCA CACCTGAATGTCAACTCC‐3' (forward) and 5'‐ CGTGGATGTCTCCAGTCAAG TG‐3' (reverse); and GAPDH, 5'‐CCATGAGAAGTATGACAACAGC‐3' (forward) and 5'‐ATGGACTGTGGTCATGAGTC‐3' (reverse). Primers for miR‐9‐1 and U6 were designed and synthesized by RiboBio. GAPDH were the internal control of HK2, MTHFD2, and MTHFD1L, and U6 was the internal control of miR‐9‐1. Relative expression values were calculated using the 2ΔΔCt method. All the samples were analyzed in triplicate.
2.5. Methylation‐specific PCR(MSP)
Genomic DNA from NPC cell lines and clinical tissue samples was extracted by the phenol‐chloroform method. According to the EZ DNA Methylation‐Direct™ Kit (Zymo Research Corporation) protocol, 1 × 10⁵ cells were sequentially treated with proteinase K, CT Conversion Reagent solution (converting unmethylated cytosine residues to uracil), and MDesulphonation Buffer. The bisulfite‐modified DNA was finally eluted with 10 μL of M‐Elution Buffer. DNA concentrations were evaluated by absorbance at 260 nm using a UV spectrophotometer (Bio‐Rad Inc). The 20‐μL mixture prepared for each reaction included 750 ng of sodium bisulfite–treated DNA, 10×MSP PCR buffer, 2.5 mmol/L deoxyribonucleotide triphosphates (dNTPs), and 1 U Polymerase (Roche). MSP DNA amplification was performed under the following condition: 5 minutes at 95℃ for initial denaturation; 35 cycles consisting of 30 seconds at 95° for denaturation, 60 seconds at 60℃ for annealing, and 30 seconds at 72℃; and 5 minutes at 72℃ for final extension. PCR reactions used human GAPDH as an internal control. MSP products were analyzed using a 2% agarose gel electrophoresis and visualized using a chemiluminescence imaging system (Bio‐Rad). Primer sequences for methylated DNA were 5'‐TTTTAGAGAAGGGTAGTGGAGATTC‐3' (forward) and 5'‐GCTAATCCCAAATAAAAAAAACG‐3' (reverse). Primer sequences for unmethylated DNA were 5'‐TTTTAGAGAAGGGTAGTGGAGAT TT‐3' (forward) and 5'‐CCACTAATCCCAAATAAAAAAAACA‐3' (reverse).
2.6. Methylation analysis by Sequenom MassARRAY
Genomic DNA was extracted from NPC cells using a QIAamp DNA Blood Mini Kit (BioTeKe Corporation). The Sequenom MassARRAY platform (Agena Bioscience) was applied to examine the promoter methylation level of miR‐9‐1 quantitatively. The genomic DNA was converted with bisulfite using the EpiTect Bisulfite kit (BioTeKe Corporation) according to the manufacturer's instructions. PCR was performed using the following cycle conditions: 4 minutes at 94℃, followed by 45 cycles of 20 seconds at 94℃ for denaturation, 30 seconds at 56℃ for annealing, and 60 seconds at 72℃ for extension. The PCR products were tagged with a T7 promoter sequence, and then transcribed in vitro to a single‐stranded RNA copy, and processed by base‐specific (U‐specific) cleavage. The generated small RNA fragments and cleavage products were detected using time‐of‐flight mass spectrometry. The methylation ratios were outputted using the EpiTyper software (Agena Bioscience). The primers were designed using sequenom® EpiDesigner program (Agena Bioscience). Primer sequences were: 5'‐ AGGAAGAGAGGATTTTTTAGAGAAGGGTAGTGGAGA (forward) and 5'‐ AAAAACCAATAAATCACATACTCACCTCGGAAGAGGGATATCACTCAGCATAATGAC (reverse).
2.7. Luciferase reporter assay
The binding of miR‐9‐1 to HK2 mRNA in HNE1 and SUNE1 cells was verified using a luciferase reporter assay. The putative miR‐9‐1 complementary site in the 3′‐UTR of HK2 mRNA or its mutant sequence was cloned into the p‐MIR‐reporter vector (Ambion). For the luciferase reporter assay, HNE1 and SUNE1 cells were seeded in 96‐well plates and then cotransfected with p‐MIR‐reporter vectors with miR‐9‐1 mimics or control using Lipofectamine 2000 (Invitrogen). At 48 hours after transfection, the relative luciferase activity was detected using a dual luciferase reporter assay system (Promega).
2.8. 3‐(4,5‐dimethylthiazol‐2‐yl)‐2,5‐diphenyltetrazolium bromide (MTT) assay
Cell suspension at the density of 1 × 10⁴ cells/ml was inoculated into 96‐well plates, and each well was added with 100 μL cell suspension. Subsequently, we supplemented 5 mg/mL MTT solution (20 μL) for 4‐hour culture, and 150 mL dimethyl sulfoxide was afterwards added before 10 minutes vibration. After shaking for 10 minutes at room temperature, absorbance values were measured at 490 nm.
2.9. Colony formation assay
Cells were plated at a density of 400 cells per well in 6‐well plates after transfection and then cultured for 10 days at 37℃ in an atmosphere of 5% CO2. Formed colonies were washed with phosphate‐buffered saline (PBS) three times, fixed with methanol for 24 hours, and stained with hematoxylin for 5 minutes. Thereafter, the plates were washed and air dried. Colonies containing more than 50 cells were counted, and surviving fractions were calculated under a microscope.
2.10. Western blotting analysis
Western blot analysis was performed according to standard procedures20 using a primary antibody and secondary antibody (Cell Signaling Technology); an α‐tubulin antibody (Cell Signaling Technology) was used as a loading control. Signals were detected using an enhanced chemiluminescence substrate kit (Abcam).
2.11. Detection of glucose uptake, lactate generation, cellular ATP level, and G6P levels
The cell medium was collected after treatment with miR‐9‐1. The intracellular glucose uptake, lactate generation, cellular ATP level, and G6P level were assessed using a glucose assay kit, a D‐lactate colorimetric assay kit, an ATP colorimetric/fluorometric assay kit, and a glucose‐6‐phosphate assay kit, respectively (all Sigma‐Aldrich Corporation), according to the manufacturer's instructions.
2.12. Xenograft studies
Sixteen male Balb/c nude mice at 4 to 6 weeks old were purchased from Guangdong Experimental Animal Center and divided randomly into two groups. SUNE1 cells (1 × 10⁶) expressing miR‐9‐1 or its control were injected subcutaneously into either side of the nude mice (n = 8 per group). The mice were euthanized at 28 days after administration of miR‐9‐1 or vector control. Tumors were dissected, fixed, and imaged using a high‐definition digital camera. The tumor volume (mm3) was calculated using caliper measurements with the formula (3.14 × width2 × length)/6. All animals received care in accordance with institutional policies on the care and use of laboratory animals and with the approval of the ethics committee of Sun Yat‐sen University Cancer Center.
2.13. MiRNA fluorescence in situ hybridization (FISH)
FISH was performed using 3 μm sections of FFPE NPC tissue with a fluorescein‐tagged locked nucleic acid (LNA) oligonucleotide probe complementary to the entire has‐miR‐9‐1 sequence, the 5' end of which was labeled with digoxygenin (DIG). During the LNA‐FISH procedure, the paraffin sections were dewaxed, fixed with fresh 4% paraformaldehyde, acetylated, and prehybridized.21 This was followed by a 1‐hour hybridization step at 48 ℃ using a 5′‐DIG–labeled LNA oligonucleotide probe for has‐miR‐9‐1‐5p (5′‐TCATACAGCTAGATAACCAAAGA‐3′) (Exiqon) complementary to miR‐9‐1. The signal was detected by incubation with horseradish peroxidase (HRP)‐conjugated anti‐DIG antibodies (1:300; #6212; Abcam). The signal was then amplified using Alexa Fluor 555 TM Tyramide Reagent (Thermo Fisher Scientific). Nuclei were stained with 4,6‐diamino‐2‐phenylindole (DAPI; Solarbio). For imaging and processing, a fluorescence inversion microscope system equipped with DIG and DAPI filters (Nikon) and the Image‐Pro Plus software (Media Cybernetics) were used, respectively. Semiquantitative assessment of the miR‐9‐1 fluorescence intensity for each specimen was obtained using the ImageJ software (NIH). The “LNA‐FISH score” was based on the staining intensity as 0 (negative), 1 (weak), or 2 (strong), and the percentage area of positive cells as 0 (0%), 1 (interspersed or 0% to 10%), 2 (focal or 10% to 50%), or 3 (diffuse or >50%). An “LNA‐FISH score” was generated as the result of the product between the intensity score (0‐2) and area score (0‐3), similar to that described previously.22 We selected five horizons in a slice randomly, calculated their scores, and then averaged them. High miR‐9‐1 expression in cells was defined as an averaged score >3.
2.14. Statistical analysis
Student's t‐test was used for comparisons between groups. One‐way analysis of variance (ANOVA) for multiple comparisons was used to detect differences among the various treatments. Fisher's exact and the χ2 test were used to analyze the association between the baseline characteristics and patients’ outcomes. Kaplan‐Meier analyses were used for survival analysis. The Cox regression model was used to estimate univariate and multivariate hazard ratios (HRs) to predict poor prognosis. We reported the HRs with 95% confidence interval (CI) and two‐sided P‐values. P <.05 was considered statistically significant. All data from three separate experiments are presented as the mean ± SD.
3. RESULT
3.1. The miR‐9‐1 promoter is hypermethylated and miR‐9‐1 expression is downregulated in NPC cells lines and tissues
Hypermethylation of miR‐9‐1 occurs mainly in the promoter region (Figure 1A). First, we performed quantitative real‐time reverse transcription PCR (qRT‐PCR) to compare the expression of miR‐9‐1 between the immortalized nasopharyngeal epithelial cell line NP69 and NPC cell lines, as well as in normal nasopharyngeal tissues and NPC tissue. The expression of miR‐9‐1 was significantly lower in NPC cells than in the normal nasopharynx cells (P < .0001 by Student's t‐test) (Figure 1B) and lower in NPC tissues than in normal nasopharyngeal tissue (P = .0124 by Student's t‐test) (Figure 1C). Subsequently, to further investigate the relationship between DNA methylation level and miR‐9‐1 expression in NPC cells, we used the Sequenom MassARRAY platform to measure DNA methylation patterns in normal tissues, NPC tissues, NP69 cell lines, and NPC cell lines (Figure 1C). The results showed that the miR‐9‐1 promoter region was relatively hypermethylated in NPC cell lines and NPC tissues, and hypomethylated in NP69 cells. After all cell lines were treated with the demethylation agent DAC, the expression level of miR‐9‐1 was restored in all NPC cell lines (Figure 1D‐F), and the expression recovery of SUNE1 and HNE1 cell lines was the most significant (P < .0001 by Student's t‐test). These results showed that the miR‐9‐1 promoter was significantly hypermethylated in NPC cell lines and NPC tissues, which likely accounted for its low expression in these tissues and cells.
FIGURE 1.
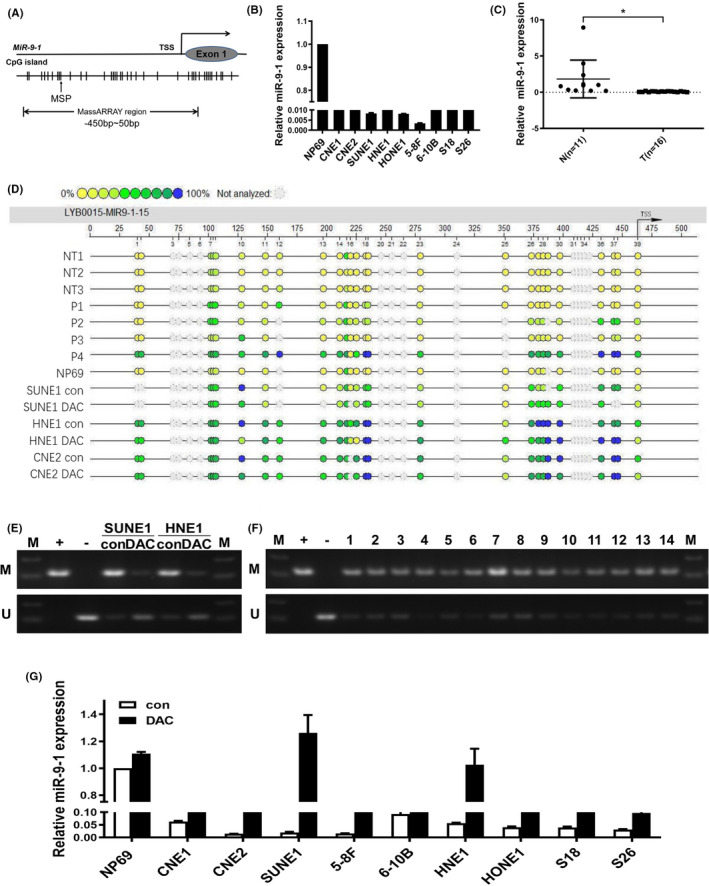
MiR‐9‐1 is downregulated by promoter methylation in nasopharyngeal carcinoma (NPC). A, CpG islands in miR‐9‐1. The transcription start site (TSS) is indicated by a curved arrow. The regions analyzed by methylation‐specific PCR (MSP) and MassARRAY are shown. B, Relative miR‐9‐1 expression in normal nasopharyngeal NP69 cells and NPC cell lines. Glyceraldehyde‐3‐phosphate dehydrogenase (GAPDH) was used as the endogenous control. C, Relative miR‐9‐1 expression in 11 normal nasopharyngeal tissues (N) and 16 NPC tissues (T). U6 was used as the endogenous control. *P < .05. D, Quantitative MassARRAY methylation analysis of miR‐9‐1 in normal tissues (NT), NPC tissue (P), NP69 cell lines, NPC cell lines. E, F, MSP analysis of miR‐9‐1 promoter methylation in NPC cell lines and tissue specimens. M, methylated; U, unmethylated; L, marker; 1‐14, NPC tissue specimen numbers. G, Demethylation treatment with 5‐Aza‐2’‐deoxycytidine (DAC) restored the expression of miR‐9‐1 in NPC cell lines
3.2. MiR‐9‐1 suppressed cell growth in NPC cells
To ascertain the antitumor role of miR‐9‐1 in NPC cells in vitro, we performed MTT and colony formation assays. The cell viability was assessed by MTT assay, which showed that NPC cell viability was markedly decreased when NPC cells were transfected with miR‐9‐1 for 72 hours, compared with the control group, implying that miR‐9‐1 acts as a suppressive miRNA in NPC cells (Figure 2A,B). Colony formation assays (Figure 2C) showed inhibited growth of NPC cells overexpressing miR‐9‐1, which was consistent with the results of the MTT assays. Taken together, these results indicated that miR‐9‐1 inhibited cancer cell growth.
FIGURE 2.
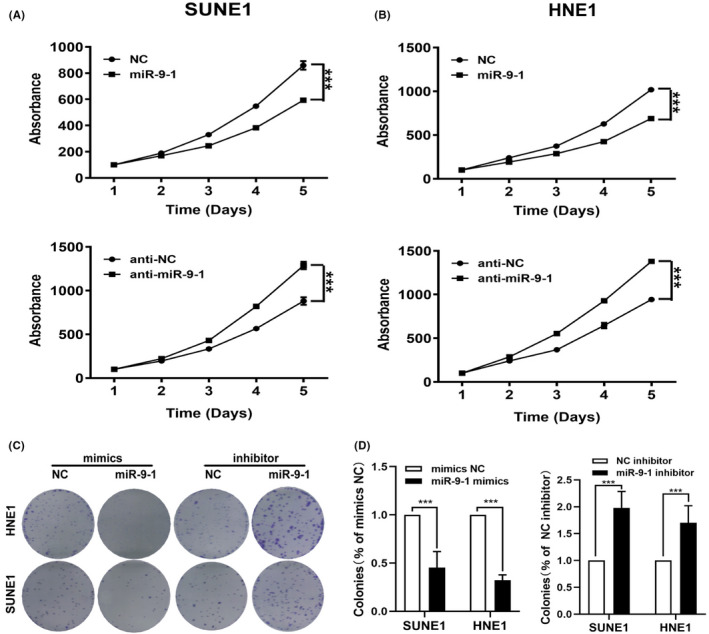
MiR‐9‐1 inhibits the tumor cell growth of nasopharyngeal carcinoma (NPC) in vitro. The proliferation of the cells was detected using 3‐(4,5‐dimethylthiazol‐2‐yl)‐2,5‐diphenyltetrazolium bromide (MTT) assays and colony formation assays. MTT assays in SUNE1 (A) and HNE1 (B) cells overexpressing or silenced for miR‐9‐1. C, Colony formation assays in SUNE1 and HNE1 cells transfected with miR‐9‐1 mimics or the miR‐9‐1 inhibitor compared with the negative control group. miR‐9‐1 suppresses tumor cell growth in vitro. ***P < .001 compared with the negative control
3.3. MiR‐9‐1 suppresses glycolysis in NPC cells
Glycolysis involves the conversion of glucose to pyruvate and the production of two adenosine triphosphate (ATP) molecules from each glucose molecule. Cancer cells consume glucose and produce lactate even in the presence of oxygen.
Next, we investigated whether miR‐9‐1 influences glycolysis in NPC cells by detected related indicators of glycolysis metabolism in NPC cells treated with miR‐9‐1. After transfection with miR‐9‐1 mimics for 24 hours, SUNE1 (Figure 3A) and HNE1 (Figure 3B) cells showed significantly decreased glycose uptake, lactate production, ATP levels, and cellular G6P levels compared with those in the control cells. These results supported the hypothesis that the effects of miR‐9‐1 lead to inhibited glycolytic metabolism in NPC cells.
FIGURE 3.
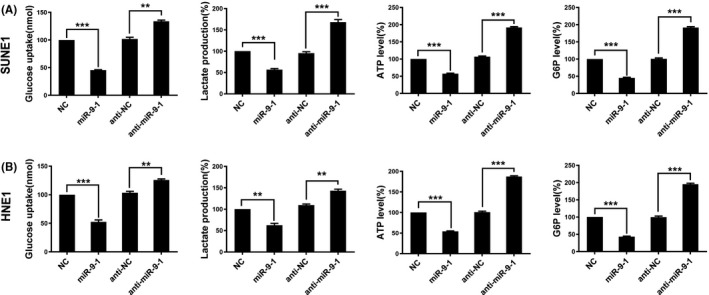
MiR‐9‐1 inhibits glycolysis in nasopharyngeal carcinoma (NPC) cells. SUNE1 cells (A) and HNE1 cells (B) were transfected with negative control, miR‐9‐1 mimics, anti‐control, and anti‐miR‐9‐1. Glucose uptake, the production of lactate, ATP, and G6P were determined. **P < .01, ***P < .001
3.4. HK2 mRNA is a direct target of miR‐9‐1 in NPC
To characterize the molecular mechanisms underlying the inhibitory effect of miR‐9‐1 on the growth of NPC cells, the downstream targets of miR‐9‐1 were predicted using the TargetScan (www.targetscan.org/vert_71/) and miRDB databases (http://mirdb.org/). Target sites for the binding of miR‐9‐1 were found in the 3'‐UTRs of HK2, MTHFD2 (encoding methylenetetrahydrofolate dehydrogenase (NADP+dependent) 2), and MTHFD1L (encoding methylenetetrahydrofolate dehydrogenase (NADP+dependent) 1 like).13 Preliminary screening by qRT‐PCR showed relatively high and significant expression of HK2 in NPC cells (Figure 4A). Western blotting results also confirmed high levels of HK2 in NPC cell lines (Figure 4B). Therefore, we selected HK2 for further study. Next, to determine whether the negative regulatory effects of miR‐9‐1 on HK2 mRNA levels were caused by its direct binding to HK2, we transfected HNE1 and SUNE1 cells with the wild‐type HK2 3'‐UTR or mutated HK2 3'‐UTR luciferase reporters and miR‐9‐1. miR‐9‐1 reduced the activity from the wild‐type HK2 3'‐UTR reporter but not from the luciferase reporter in which the binding sites for miR‐9‐1 were mutated (Figure 4C). As expected, miR‐9‐1 mimics reduced the HK level in NPC cells, which could be reversed by HK2 re‐expression in the miR‐9‐1–transfected cells (Figure 4D). Similar results were shown in MTT and colony formation assays (Figure 4E,F). We then detected related indicators of glycolysis metabolism in miR‐9‐1–transfected cells with HK2 re‐expression, which showed that the glycose uptake, lactate production, ATP levels, and cellular G6P levels increased (Figure S1). These enhancement effects were eliminated after treatment with miR‐9‐1 mimics for 24 hours. Taken together, these results suggested that miR‐9‐1 targets HK2, which inhibits glycolytic metabolism in NPC cells.
FIGURE 4.
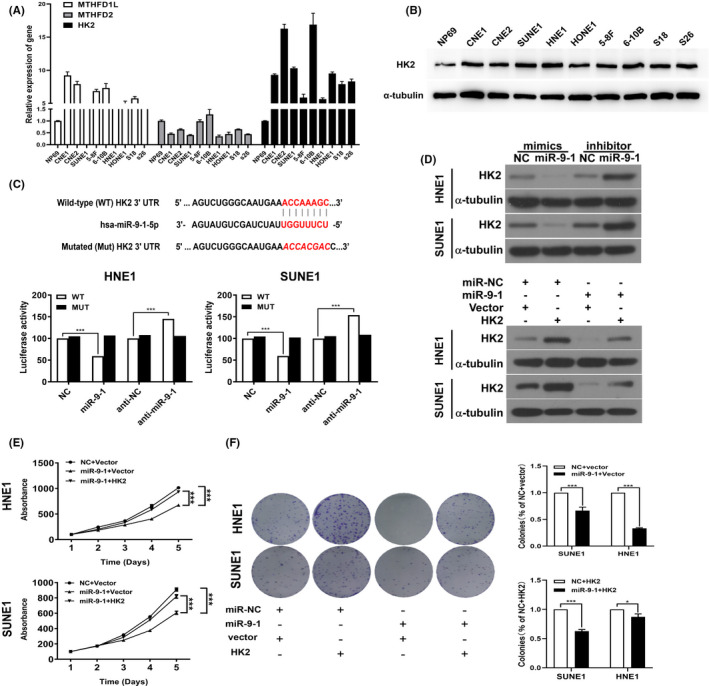
MiR‐9‐1 targets HK2 and negatively modulates glycolysis metabolism in nasopharyngeal carcinoma (NPC) cells. A, The relative expression of HK2 (hexokinase 2), MTHFD2 (encoding methylenetetrahydrofolate dehydrogenase [NADP+dependent] 2), and MTHFD1L (encoding methylenetetrahydrofolate dehydrogenase [NADP+dependent] 1 like) in NPC cell lines. B, The protein abundance of HK2 in normal nasopharyngeal NP69 cells and NPC cell lines was detected using Western blotting. C, MicroRNA (miRNA) luciferase reporter assays of SUNE1 and HNE1 cells transfected with a wild‐type or mutated HK2 reporter plus negative control (NC), miR‐9‐1 mimics, anti‐NC, or anti‐miR‐9‐1, respectively. D, Western blotting analysis indicated that HK2 levels were decreased in SUNE1 and HNE1 cells transfected with miR‐9‐1 mimics, but increased in those transfected with the miR‐9‐1 inhibitor; α‐tubulin was used as the loading control. E, 3‐(4,5‐dimethylthiazol‐2‐yl)‐2,5‐diphenyltetrazolium bromide (MTT) assays in SUNE1 and HNE1 cells transfected with miR‐9‐1 mimics plus empty vector or miR‐9‐1 mimics plus the HK2 expression vector, compared with the negative control group. F, Transfection of miR‐9‐1 mimics inhibited the plate clone formation capabilities in SUNE1 and HNE1 cells; HK2 could reverse the ability of colony formation. **P < .01, ***P < .001
3.5. MiR‐9‐1 inhibits the tumor growth of NPC in vivo
Next, we used xenograft models to further verify the role of miR‐9‐1 in retarding NPC cell growth in vivo. Nude mice were injected subcutaneously with HNE1 cells transfected with the vector‐control or miR‐9‐1. At 28 days post injection of cells, nude mice were euthanized to compare the tumor burden between the control group and the miR‐9‐1 group. As shown in Figure 5A‐D, the tumors with miR‐9‐1 overexpression grew slower than those resulting from cells transfected with the empty control vector. These data suggested that miR‐9‐1 suppresses tumor growth in vivo.
FIGURE 5.
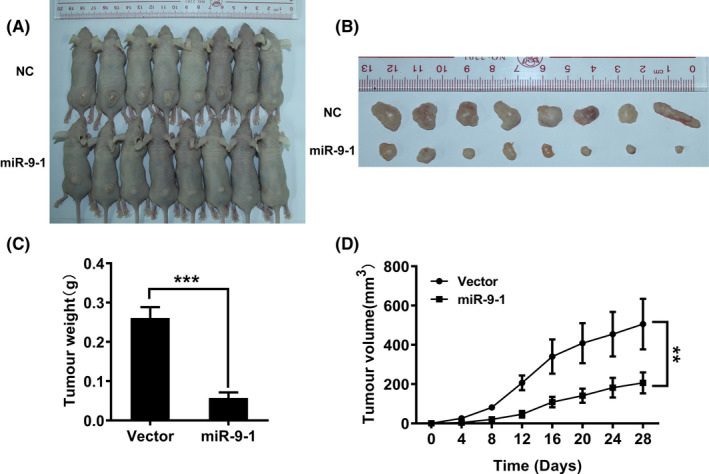
SUNE1 cells stably infected with lentiviruses carrying the indicated constructs were injected into nude mice as indicated. A, B, Photographs of tumors derived from mice inoculated with SUNE1‐miR‐9‐1‐NC (negative control) and SUNE1 cells stably infected with miR‐9‐1 lentivirus (n = 8 per group). The volume of xenografts of mice treated with intratumoral injection of miR‐9‐1 were substantially smaller than those of the control mice; growth curves for tumor weight (C) and volumes (D) are shown (n = 8 per group). **P < .01, compared with the negative control
3.6. Relationship between the miR‐9‐1 expression level and clinicopathological characteristics and prognosis of patients with NPC
MiRNA‐FISH score analysis was performed in NPC paraffin sections (Figure 6A). MiR‐9‐1 expression levels (0‐2: low expression; 3‐6: high expression) in NPC tissues were determined according to the available scoring rules.22 As shown in Table 1, the expression levels of miR‐9‐1 correlated significantly with sex, T stage, and TNM stage (χ2 test, P = .002, 0.010, and 0.020, respectively). However, the miR‐9‐1 expression level was not associated significantly with age, N stage, tobacco smoking, alcohol drinking, and distant metastasis (χ2 test, P = .589, 0.336, 0.742, 0.366, and 0.317, respectively).
FIGURE 6.
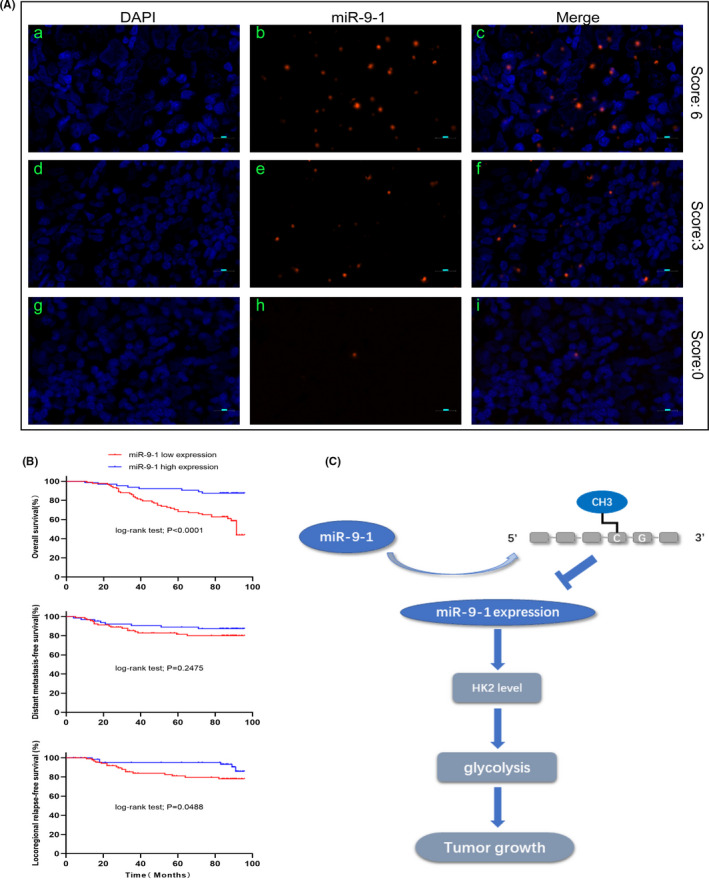
Localization of miR‐9‐1 expression in nasopharyngeal carcinoma (NPC) tissue by fluorescence in situ hybridization and correlation with prognosis in patients with NPC. A, The probe for miR‐9‐1 was locked nucleic acid (LNA) modified and labeled with digoxigenin at the 5' end. (a‐c) Strong expression of miR‐9‐1 in NPC. (d‐f) Moderate expression of miR‐9‐1 in NPC. (g‐i) Weak expression of miR‐9‐1 in NPC. Red, miR‐9‐1; Blue, 4′,6‐diamidino‐2‐phenylindole (DAPI) nuclear staining. Scale bars are 10 µm. Original magnification 200×. B, Kaplan‐Meier analysis comparing overall survival, distant metastasis–free survival, and locoregional relapse–free survival between the miR‐9‐1–high‐ and miR‐9‐1–low‐expression groups. Patients with low miR‐9‐1 expression had shorter overall survival and locoregional relapse–free survival. C, Proposed model for miR‐9‐1 modulation of hexokinase 2 (HK2) expression as well as glycolysis‐related tumor growth
TABLE 1.
Correlation of the expression of miRNA‐9‐1 with major clinicopathological parameters
| Characteristic | miRNA‐9‐1 expression level (FISH score)a | P‐value | |
|---|---|---|---|
| Low (n = 92) | High (n = 64) | ||
| Age, y | |||
| <60 | 73 (79.3%) | 53 (82.8%) | .589 |
| ≥60 | 19 (20.7%) | 11 (17.2%) | |
| Sex | |||
| Female | 18 (19.7%) | 27 (42.2%) | .002 |
| Male | 74 (80.3%) | 37 (57.8%) | |
| Tobacco smoking | |||
| Nonsmokers | 55 (59.8%) | 36 (56.3%) | .742 |
| Smokers | 37 (40.2%) | 28 (43.7%) | |
| Alcohol drinking | |||
| Nondrinkers | 69 (75%) | 43 (68.3%) | .366 |
| Drinkers | 23 (25%) | 21 (31.7%) | |
| TNM stage | |||
| II | 5 (5.4%) | 5 (7.8%) | .020 |
| III | 36 (39.1%) | 38 (59.4%) | |
| IV | 51 (55.5%) | 21 (32.8%) | |
| T stage | |||
| T1 | 13 (14.1%) | 9 (14.1%) | .010 |
| T2 | 12 (13.1%) | 19 (29.7%) | |
| T3 | 19 (20.7%) | 18 (28.1%) | |
| T4 | 48 (52.1%) | 18 (28.1%) | |
| N stage | |||
| N0 | 4 (4.3%) | 0 (0%) | .336 |
| N1 | 9 (9.8%) | 9 (14.1%) | |
| N2 | 69 (75%) | 48 (75%) | |
| N3 | 10 (10.9%) | 7 (10.9%) | |
| Distant metastasis | |||
| M0 | 75 (81.5%) | 56 (87.5%) | .317 |
| M1 | 17 (18.1%) | 8 (12.5%) | |
Abbreviations: miRNA, microRNA; TNM, tumor‐node‐metastasis.
Fluorescence in situ hybridization (FISH) score 0‐2 was defined as low expression, and 3‐6 was defined as high expression.
Kaplan‐Meier survival curves suggested that patients in the miR‐9‐1–low‐expression group (n = 92) had a shorter overall survival (OS) and locoregional relapse–free survival (LRRFS) than those in the miR‐9‐1–high‐expression group (n = 64) (log‐rank test, P < .0001, P < .0488, Figure 6B,D) according to miRNA‐FISH score results. However, there was no significant differential trend for distant metastasis–free survival (DMFS) (log‐rank test, P = .2475, Figure 6C). Furthermore, multivariate Cox regression analysis also confirmed that miR‐9‐1 expression status (HR=0.315, 95% CI: 0.140‐0.711, P = .005) was associated significantly with patient OS (Table S1).
4. DISCUSSION
In the present study, we found that miR‐9‐1 was hypermethylated in NPC cell lines and clinical tissues and showed relatively low expression in NPC cell lines. Ectopic expression of miR‐9‐1 inhibited the growth and glycolytic metabolism of NPC cells in vitro and tumor proliferation in vivo. Subsequently, HK2 was identified as a direct target and functional mediator of miR‐9‐1’s effects. Clinically, the FISH score results indicated that miR‐9‐1 was an independent prognostic factor in patients with NPC. Thus, these results suggested that hypermethylation of miR‐9‐1 plays an important role in the development of NPC.
To further unravel the mechanism of miR‐9‐1 in the progression of NPC, we explored the biological function of miR‐9‐1 through functional assays. Ectopic expression of miR‐9‐1 significantly inhibited the in vitro activity, glycolytic metabolism, and proliferative capacity of NPC cells and suppressed the growth of xenograft tumors in vivo. This was consistent with the results observed in breast, prostate, and non–small cell lung cancers.23, 24, 25 Moreover, methylation‐associated miR‐9 downregulation ameliorated its tumor suppressive potential in the progression of oral and oropharyngeal squamous cell carcinoma26 and gastric cancer.27 These are consistent with our findings. Furthermore, miR‐9‐5p has also been reported to play the opposite role in different types of cancer.28 In cervical cancer, the differential expression of miR‐9‐5p in two tissue types (squamous cell carcinoma and adenocarcinoma) suggested a dual function of miR‐9‐5p in the same cancer type.29 Previously, it was reported that miR‐9 regulates cancer progression and metastasis in NPC by targeting CXCR4.30 However, even within the same tumor, miRNAs perform different functions due to the diversity of downstream targets. Thus, the downstream regulatory network of miRNAs is complex and tissue specific. Our current findings suggest that miR‐9‐1 may inhibit the growth of NPC cells by suppressing glycolytic metabolism and that hypermethylation of the miR‐9‐1 promoter region disrupts its inhibitory effect, leading to cancer cell growth and tumor proliferation. Taken together with previous studies,30 our results suggest that miR‐9‐1 has an antitumor effect in NPC.
MiRNAs have been revealed as important regulators of cancer progression and metabolic reprogramming, in which they regulate gene expression negatively and are widely involved in regulating cell proliferation, differentiation, apoptosis, migration, and transformation.31, 32 Aerobic glycolysis is a hallmark of cancer.3 Song et al revealed that FOXC2 promoted glycolysis in the progression of NPC by activating YAP signaling,33 and Su et al revealed that JMJD2A regulates aerobic glycolysis in NPC by modulating LDHA expression.34 The abnormal glycolysis in NPC cells was associated with poor prognosis in patients with NPC.35, 36 Nevertheless, few studies have been reported on the effects of miRNAs on the glycolytic metabolism of NPC. In the present study, bioinformatic analysis and experimental validation confirmed that the mRNA encoding the glycolytic rate–limiting enzyme HK2 is a key cellular target of miR‐9‐1 in NPC. We discovered that HK2 expression promoted cell proliferation and glycolytic metabolism in cultured NPC cells. Moreover, reintroduction of HK2 rescued the inhibited glycolytic metabolism mediated by miR‐9‐1 in NPC cells. Similarly, overexpression of HK2 has been observed in some cancers and was associated with increased glucose metabolism and poor outcome.37, 38 As such, HK2 is considered a key factor in the Warburg effect and has been proposed as a target for the treatment of cancer.39, 40 Recently, studies also have shown that several miRNAs, including miR‐143, miR‐199a‐5p, miR‐145,41, 42, 43 and the newly identified miR‐532‐3p,44 are HK2 suppressors. Therefore, our data are consistent with the view that increased glycolysis contributes to the maintenance of the malignant phenotype of cancer cells, and suggests that miR‐9‐1 exerts an inhibitory effect on NPC, primarily or partially through inhibition of glycolysis. However, the specific molecular mechanisms by which miR‐9‐1 regulates HK2 expression require further investigation.
In summary, our findings revealed that miR‐9‐1 is a tumor suppressor miRNA, the coding region of which is aberrantly hypermethylated in NPC. Moreover, the FISH score results indicated miR‐9‐1 is an independent prognostic factor in NPC. These results confirmed that the miR‐9‐1/HK2 axis is a novel regulatory mechanism for the Warburg effect in NPC (Figure 6E), which correlates with prognosis and is thus worthy of further study to develop novel treatment strategies for NPC.
Supporting information
Supplementary Material
Xu Q‐L, Luo Z, Zhang B, et al. Methylation‐associated silencing of miR‐9‐1 promotes nasopharyngeal carcinoma progression and glycolysis via HK2. Cancer Sci. 2021;112:4127–4138. 10.1111/cas.15103
Xu, Luo, and Zhang contributed equally to this work.
Funding information
Chinese Society of Clinical Oncology (Grant/Award Number: 'Y‐Young2020‐0520'); Key Program of the Guangxi Natural Science Foundation of China (Grant/Award Number: '2018JJD140054'); National Natural Science Foundation of China (Grant/Award Number: '81560443', '81760546'); General Program of Guangxi Natural Science Foundation of China (Grant / Award Number: '2018GXNSFAA138100').
REFERENCES
- 1.Yu MC, Yuan JM. Epidemiology of nasopharyngeal carcinoma. Semin Cancer Biol. 2002;12:421‐429. [DOI] [PubMed] [Google Scholar]
- 2.Kam MK, Teo PM, Chau RM, et al. Treatment of nasopharyngeal carcinoma with intensity‐modulated radiotherapy: the Hong Kong experience. Int J Radiat Oncol Biol Phys. 2004;60:1440‐1450. [DOI] [PubMed] [Google Scholar]
- 3.Locasale JW, Vander Heiden MG, Cantley LC. Rewiring of glycolysis in cancer cell metabolism. Cell Cycle. 2010;9:4253. [DOI] [PubMed] [Google Scholar]
- 4.Hanahan D, Weinberg RA. Hallmarks of cancer: the next generation. Cell. 2011;144:646‐674. [DOI] [PubMed] [Google Scholar]
- 5.Vander Heiden MG, Cantley LC, Thompson CB. Understanding the Warburg effect: the metabolic requirements of cell proliferation. Science. 2009;324:1029‐1033. [DOI] [PMC free article] [PubMed] [Google Scholar]
- 6.Sung WW, Chen PR, Liao MH, Lee JW. Enhanced aerobic glycolysis of nasopharyngeal carcinoma cells by Epstein‐Barr virus latent membrane protein 1. Exp Cell Res. 2017;359:94‐100. [DOI] [PubMed] [Google Scholar]
- 7.Wang QX, Zhu YQ, Zhang H, Xiao J. Altered MiRNA expression in gastric cancer: a systematic review and meta‐analysis. Cell Physiol Biochem. 2015;35:933‐944. [DOI] [PubMed] [Google Scholar]
- 8.Calin GA, Croce CM. MicroRNA signatures in human cancers. Nat Rev Cancer. 2006;6:857‐866. [DOI] [PubMed] [Google Scholar]
- 9.Rottiers V, Naar AM. MicroRNAs in metabolism and metabolic disorders. Nat Rev Mol Cell Biol. 2012;13:239‐250. [DOI] [PMC free article] [PubMed] [Google Scholar]
- 10.Cheung CC, Chung GT, Lun SW, et al. miR‐31 is consistently inactivated in EBV‐associated nasopharyngeal carcinoma and contributes to its tumorigenesis. Mol Cancer. 2014;13:184. [DOI] [PMC free article] [PubMed] [Google Scholar]
- 11.Li YQ, Ren XY, He QM, et al. MiR‐34c suppresses tumor growth and metastasis in nasopharyngeal carcinoma by targeting MET. Cell Death Dis. 2015;6:e1618. [DOI] [PMC free article] [PubMed] [Google Scholar]
- 12.Jiang W, Liu N, Chen XZ, et al. Genome‐wide identification of a methylation gene panel as a prognostic biomarker in nasopharyngeal carcinoma. Mol Cancer Ther. 2015;14:2864‐2873. [DOI] [PubMed] [Google Scholar]
- 13.Pinweha P, Rattanapornsompong K, Charoensawan V, Jitrapakdee S. MicroRNAs and oncogenic transcriptional regulatory networks controlling metabolic reprogramming in cancers. Comput Struct Biotechnol J. 2016;14:223‐233. [DOI] [PMC free article] [PubMed] [Google Scholar]
- 14.Lis P, Dylag M, Niedzwiecka K, et al. The HK2 Dependent "Warburg Effect" and mitochondrial oxidative phosphorylation in cancer: targets for effective therapy with 3‐bromopyruvate. Molecules. 2016;21:1730. [DOI] [PMC free article] [PubMed] [Google Scholar]
- 15.Zhong JT, Zhou SH. Warburg effect, hexokinase‐II, and radioresistance of laryngeal carcinoma. Oncotarget. 2017;8:14133‐14146. [DOI] [PMC free article] [PubMed] [Google Scholar]
- 16.Wei L, Zhou Y, Dai Q, et al. Oroxylin A induces dissociation of hexokinase II from the mitochondria and inhibits glycolysis by SIRT3‐mediated deacetylation of cyclophilin D in breast carcinoma. Cell Death Dis. 2013;4:e601. [DOI] [PMC free article] [PubMed] [Google Scholar]
- 17.Xi F, Ye J. Inhibition of lung carcinoma A549 cell growth by knockdown of hexokinase 2 in situ and in vivo. Oncol Res. 2016;23:53‐59. [DOI] [PMC free article] [PubMed] [Google Scholar]
- 18.Zhang Z, Huang S, Wang H, et al. High expression of hexokinase domain containing 1 is associated with poor prognosis and aggressive phenotype in hepatocarcinoma. Biochem Biophys Res Commun. 2016;474:673‐679. [DOI] [PubMed] [Google Scholar]
- 19.Amin MB, Greene FL, Edge SB, et al. The Eighth Edition AJCC Cancer Staging Manual: Continuing to build a bridge from a population‐based to a more "personalized" approach to cancer staging. CA Cancer J Clin. 2017;67:93‐99. [DOI] [PubMed] [Google Scholar]
- 20.Jiang W, Li YQ, Liu N, et al. 5‐Azacytidine enhances the radiosensitivity of CNE2 and SUNE1 cells in vitro and in vivo possibly by altering DNA methylation. PLoS One. 2014;9:e93273. [DOI] [PMC free article] [PubMed] [Google Scholar]
- 21.Shi Z, Johnson JJ, Stack MS. Fluorescence in situ hybridization for MicroRNA detection in archived oral cancer tissues. J Oncol. 2012;2012:903581. [DOI] [PMC free article] [PubMed] [Google Scholar]
- 22.Habbe N, Koorstra JB, Mendell JT, et al. MicroRNA miR‐155 is a biomarker of early pancreatic neoplasia. Cancer Biol Ther. 2009;8:340‐346. [DOI] [PMC free article] [PubMed] [Google Scholar]
- 23.Ma L, Young J, Prabhala H, et al. miR‐9, a MYC/MYCN‐activated microRNA, regulates E‐cadherin and cancer metastasis. Nat Cell Biol. 2010;12:247‐256. [DOI] [PMC free article] [PubMed] [Google Scholar]
- 24.Xu T, Liu X, Han L, Shen H, Liu L, Shu Y. Up‐regulation of miR‐9 expression as a poor prognostic biomarker in patients with non‐small cell lung cancer. Clin Transl Oncol. 2014;16:469‐475. [DOI] [PubMed] [Google Scholar]
- 25.Seashols‐Williams SJ, Budd W, Clark GC, et al. miR‐9 acts as an OncomiR in prostate cancer through multiple pathways that drive tumour progression and metastasis. PLoS One. 2016;11:e0159601. [DOI] [PMC free article] [PubMed] [Google Scholar]
- 26.Minor J, Wang X, Zhang F, et al. Methylation of microRNA‐9 is a specific and sensitive biomarker for oral and oropharyngeal squamous cell carcinomas. Oral Oncol. 2012;48:73‐78. [DOI] [PMC free article] [PubMed] [Google Scholar]
- 27.Tsai KW, Liao YL, Wu CW, et al. Aberrant hypermethylation of miR‐9 genes in gastric cancer. Epigenetics. 2011;6:1189‐1197. [DOI] [PMC free article] [PubMed] [Google Scholar]
- 28.Nowek K, Wiemer EAC, Jongen‐Lavrencic M. The versatile nature of miR‐9/9(*) in human cancer. Oncotarget. 2018;9:20838‐20854. [DOI] [PMC free article] [PubMed] [Google Scholar]
- 29.Babion I, Jaspers A, van Splunter AP, van der Hoorn IAE, Wilting SM, Steenbergen RDM. miR‐9‐5p exerts a dual role in cervical cancer and targets transcription factor TWIST1. Cells. 2019;9:15. [DOI] [PMC free article] [PubMed] [Google Scholar]
- 30.Lu J, Luo H, Liu X, et al. miR‐9 targets CXCR4 and functions as a potential tumor suppressor in nasopharyngeal carcinoma. Carcinogenesis. 2014;35:554‐563. [DOI] [PubMed] [Google Scholar]
- 31.Cai Y, Yu X, Hu S, Yu J. A brief review on the mechanisms of miRNA regulation. Genom Proteom Bioinform. 2009;7:147‐154. [DOI] [PMC free article] [PubMed] [Google Scholar]
- 32.Gambari R, Brognara E, Spandidos DA, Fabbri E. Targeting oncomiRNAs and mimicking tumor suppressor miRNAs: Nuew trends in the development of miRNA therapeutic strategies in oncology. [Review] Int J Oncol. 2016;49:5‐32. [DOI] [PMC free article] [PubMed] [Google Scholar]
- 33.Song L, Tang H, Liao W, et al. FOXC2 positively regulates YAP signaling and promotes the glycolysis of nasopharyngeal carcinoma. Exp Cell Res. 2017;357:17‐24. [DOI] [PubMed] [Google Scholar]
- 34.Su Y, Yu QH, Wang XY, et al. JMJD2A promotes the Warburg effect and nasopharyngeal carcinoma progression by transactivating LDHA expression. BMC Cancer. 2017;17:477. [DOI] [PMC free article] [PubMed] [Google Scholar]
- 35.Xie P, Yue JB, Fu Z, Feng R, Yu JM. Prognostic value of 18F‐FDG PET/CT before and after radiotherapy for locally advanced nasopharyngeal carcinoma. Ann Oncol. 2010;21:1078‐1082. [DOI] [PubMed] [Google Scholar]
- 36.Chan SC, Chang JT, Wang HM, et al. Prediction for distant failure in patients with stage M0 nasopharyngeal carcinoma: the role of standardized uptake value. Oral Oncol. 2009;45:52‐58. [DOI] [PubMed] [Google Scholar]
- 37.Suh DH, Kim MA, Kim H, et al. Association of overexpression of hexokinase II with chemoresistance in epithelial ovarian cancer. Clin Exp Med. 2014;14:345‐353. [DOI] [PubMed] [Google Scholar]
- 38.Ma Y, Yu C, Mohamed EM, et al. A causal link from ALK to hexokinase II overexpression and hyperactive glycolysis in EML4‐ALK‐positive lung cancer. Oncogene. 2016;35:6132‐6142. [DOI] [PMC free article] [PubMed] [Google Scholar]
- 39.Patra KC, Wang Q, Bhaskar PT, et al. Hexokinase 2 is required for tumor initiation and maintenance and its systemic deletion is therapeutic in mouse models of cancer. Cancer Cell. 2013;24:213‐228. [DOI] [PMC free article] [PubMed] [Google Scholar]
- 40.Mathupala SP, Ko YH, Pedersen PL. Hexokinase‐2 bound to mitochondria: cancer's stygian link to the "Warburg Effect" and a pivotal target for effective therapy. Semin Cancer Biol. 2009;19:17‐24. [DOI] [PMC free article] [PubMed] [Google Scholar]
- 41.Guo W, Qiu Z, Wang Z, et al. MiR‐199a‐5p is negatively associated with malignancies and regulates glycolysis and lactate production by targeting hexokinase 2 in liver cancer. Hepatology. 2015;62:1132‐1144. [DOI] [PubMed] [Google Scholar]
- 42.Peschiaroli A, Giacobbe A, Formosa A, et al. miR‐143 regulates hexokinase 2 expression in cancer cells. Oncogene. 2013;32:797‐802. [DOI] [PubMed] [Google Scholar]
- 43.Yoshino H, Enokida H, Itesako T, et al. Tumor‐suppressive microRNA‐143/145 cluster targets hexokinase‐2 in renal cell carcinoma. Cancer Sci. 2013;104:1567‐1574. [DOI] [PMC free article] [PubMed] [Google Scholar]
- 44.Zhou Y, Zheng X, Lu J, Chen W, Li X, Zhao L. Ginsenoside 20(S)‐Rg3 inhibits the warburg effect via modulating DNMT3A/ MiR‐532‐3p/HK2 pathway in ovarian cancer cells. Cell Physiol Biochem. 2018;45:2548‐2559. [DOI] [PubMed] [Google Scholar]
Associated Data
This section collects any data citations, data availability statements, or supplementary materials included in this article.
Supplementary Materials
Supplementary Material


