

Abstract
Non-invasive detection of microvascular alterations in deep tissues in vivo provides critical information for clinical diagnosis and evaluation of a broad-spectrum of pathologies. Recently, the emergence of super-resolution ultrasound localization microscopy (ULM) offers new possibilities for clinical imaging of microvasculature at capillary level. Currently, the clinical utility of ULM on clinical ultrasound scanners is hindered by the technical limitations, such as long data acquisition time, high microbubbles (MBs) concentration, and compromised tracking performance associated with low imaging frame-rate. Here we present a robust in-human ULM on a high frame-rate (HFR) clinical ultrasound scanner to achieve super-resolution microvessel imaging using a short acquisition time (< 10s). Ultrasound MB data were acquired from different human tissues, including a healthy liver and a diseased liver with acute-on-chronic liver failure, a kidney, a pancreatic tumor, and a breast mass using an HFR clinical scanner. By leveraging the HFR and advanced processing techniques including sub-pixel motion registration, MB signal separation, and Kalman filter-based tracking, MBs can be robustly localized and tracked for ULM under the circumstances of relatively high MB concentration associated with standard clinical MB administration and limited data acquisition time in humans. Subtle morphological and hemodynamic information in microvasculature were shown based on data acquired with single breath-hold and free-hand scanning. Compared with contrast-enhanced power Doppler generated based on the same MB dataset, ULM showed a 5.7-fold resolution improvement in a vessel based on a linear transducer, and provided a wide-range blood flow speed measurement that is Doppler angle-independent. Microvasculatures with complex hemodynamics can be well-differentiated at super-resolution in both normal and pathological tissues. This preliminary study implemented the ultrafast in-human ULM in various human tissues based on a clinical scanner that supports HFR imaging, indicating the potentials of the technique for various clinical applications. However, rigorous validation of the technique in imaging human microvasculature (especially for those tiny vessel structure), preferably with a gold standard, is still required.
Introduction
Microvasculature plays a critical role in blood supply for effective oxygen and nutrient delivery and metabolic demand of the tissue. Abnormal alterations of microvasculature are linked to a broad spectrum of diseases, such as arteriolosclerosis, diabetes, diabetes, chronic kidney diseases, hepatic fibrosis and cirrhosis, inflammatory bowel disease, and cancer (1–5). For example, diabetes is known to be related to various long-term microvascular complications, such as retinopathy and nephropathy, which lead to structural and functional vascular changes, eventually resulting in organ damage (2). The complications may have emerged in the level of small vessels long before they manifest as a symptom in the level of organs. Pathological angiogenesis, a hallmark of cancer, is another characteristic disease state that is associated with unbalanced development of microvasculature (e.g., chaotic, tortuous, and disordered small vessels that cause impaired blood flow) (1, 3). As such, early detection and characterization of the pathological changes of the microvasculature are of significant clinical value for disease prevention, intervention, and treatment. Despite the significance of microvasculature detection, there is no viable clinical tool that provides non-invasive and sufficient resolution for in vivo assessment of human tissue microvasculature (e.g., < 100 μm) at a clinically relevant depth (several centimeters to > 10 centimeters) (6, 7). Ex vivo histopathology remains the only clinical tool and gold standard for evaluating the state of health for tissue microvasculature. Current clinical modalities for vasculature imaging such as magnetic resonance imaging (MRI) and computed tomography (CT) can assess tissue perfusion or vascular structure with high sensitivity and deep penetration, but the spatial resolution is limited to the level of submillimeter or millimeter (> 100 μm) (8). Doppler ultrasound is another widely available modality for blood flow imaging. However, conventional ultrasound Doppler is only sensitive to fast flow (for example, > 1 cm/s) in relatively large vessels, and is challenging for imaging microvessels (6). Contrast-enhanced ultrasound (CEUS), which is routinely used in clinical practice for tissue perfusion imaging, allows a much higher sensitivity to flow in small vessels (from capillaries to tens of micrometers) by leveraging the microbubbles (MBs) that pass through the capillaries as an ultrasound contrast agent (9). However, CEUS is still not capable of resolving microvessels because it is confined by the same resolution limit as conventional ultrasound, which is approximately equal to the wavelength of ultrasound (e.g., from 100 um at 15 MHz to 1000 um at 1.5 MHz).
Recently, the invention of super-resolution ultrasound localization microscopy (ULM) achieved a substantial improvement of ultrasound spatial resolution in imaging microvasculature (6, 7, 10). Instead of using the diffraction-limited contrast microbubble (MB) signal for imaging as in contrast-enhanced ultrasound (CEUS), ULM uses the location of the spatially isolated MBs for imaging. ULM has demonstrated an approximately ten-fold improvement in spatial resolution while preserving the imaging penetration of conventional ultrasound (6, 7, 10). In addition, movement of individual MBs can be tracked to provide an accurate measurement of a wide range of blood flow speed that is Doppler angle-independent. Owing to the significant clinical potential, ULM has rapidly gained traction in the research field with focus on the technical development, optimization, and demonstration (11–30), which includes various phantom validation studies (17, 19, 31–35) and a wide range of preclinical in vivo studies in different tissues (e.g., brain, tumor, kidney, ear, skeletal muscle, lymph node) of various animal models including mouse (11, 12, 14), rat (10, 13, 15, 30, 36–38), rabbit (18, 22, 26), and chicken embryo (16, 39).
As an emerging technology, most of the ULM implementations to date are still limited to research ultrasound scanners with high frame-rate (HFR) imaging capability. There are pilot in-human studies in imaging breast tumors (11, 40), lower limb (41), and prostate cancer (42) using conventional clinical scanners that typically operated at low imaging frame-rates (around 10 to 15 Hz). It is commonly challenging to accurately localize and track fast moving MBs with a low frame-rates, which may compromise the performance of the ULM. Although MB dilution is commonly used to mitigate the issue, it is not a standard clinical procedure for MB administration. To tackle this challenge, Ackermann and Schmitz first proposed a more robust Markov Chain Monte Carlo Data Association (MCMCDA) algorithm based on probabilistic optimization considering a linear motion model realized with a Kalman filter, to improve MB tracking performance at low frame rate and complicate in vivo flow conditions (24). This method was successfully applied to image in-human breast tumor microvasculature, providing reliable multiparametric quantification of tumors (11, 40). Another challenge with conventional ULM is the long data acquisition time, which requires the same imaging plane to be continuously imaged for dozens of seconds and even several minutes (11, 40–42). In practice this is very challenging for free-hand scanning, especially for organs like kidney and liver where tissue motion from patient breathing is significant and difficult to manage. While patient breath-holds mitigate the issue of tissue motion, it is infeasible to suspend voluntary respiration over the entirety of ULM data acquisition.
Targeting these limitations of ULM, we recently developed an MB signal separation method combined with a Kalman filter-based tracking algorithm to facilitate accurate localization and tracking of MBs without the need of MB dilution. Our methods also significantly shorten ULM data acquisition time to only several seconds (39, 43). In this paper, we take advantage of a clinical scanner with the capability of HFR imaging (e.g., > 500 Hz) and implement these algorithms to realize robust in-human ULM with a short acquisition time (< 10 s). We applied the MB signal separation method on the clinical HFR ultrasound system to enable accurate localization and tracking of MBs using standard clinical MB administrations without MB dilution(39). We further improved microvessel delineation by implementing the Kalman filter-based tracking algorithm on the clinical HFR system (43). We showed in-human ULM using data acquired from a single breath-hold and free-hand scanning. The technique was tested in various in vivo human tissues including healthy and diseased livers, kidney, and pancreatic and breast tumors. The results indicated a 57.5 μm spatial resolution and an imaging penetration depth of several centimeters using a linear array transducer (3.6 MHz). With the trend of more and more clinical ultrasound scanners supporting HFR imaging, our study indicated the feasibility of implementing ULM on these scanners and paved the way for future clinical translations of the ULM technology.
Methods
Study Protocol
The in vivo study was approved by the Institutional Review Board (IRB) of the Third Affiliated Hospital of Sun Yat-Sen University and the IRB of Mayo Clinic. Written informed consent was obtained from each patient. For each patient, a bolus of MB solution (SonoVue, Bracco, Milan, Italy) was injected through intravenous injection, followed by a 5 ml saline flushing. The dosage of MB was organ-specific, similar to that in clinical CEUS (see details in Table 1). Real-time CEUS was used to guide the image plane and monitor the MB signal right after the MB injection with free-hand scanning. Then the sonography switched the scanner to an ultrafast plane-wave imaging mode and manually started and stopped the data acquisition. Following the clinical CEUS practice, the mechanical index (MI) for the plane wave imaging was set to be around 0.2 (may be slightly varying case by case). The beamformed in-phase/quadrature (IQ) data were saved for ULM post-processing in MATLAB (MathWorks Inc., Natick, MA) offline. During the data acquisition, the patients were asked to hold the breath for a data acquisition time < 10 seconds. In this preliminary study, a total of 7 patients who were already scheduled for CEUS in the clinics per clinical evaluation purpose were recruited between December 6th, 2019 and January 8th, 2020. The clinical CEUS might be performed on different organs from the target tissues in the ULM study. Only one acquisition was conducted after bolus injection to save one dataset from each organ. Data from 3 patients were discarded (included one kidney data, one kidney tumor data, and one liver tumor data) due to the large out-of-plane breathing motion, insufficient number of MB detected and/or insufficient signal-to-noise ratio (SNR) to identify individual MBs. As a result, five datasets acquired from other 4 patients from different tissues, including a healthy liver, a diseased liver diagnosed as acute-on-chronic liver failure, a kidney, a pancreatic, and a breast tumor, were included (the pancreatic tumor and healthy liver datasets were from the same patient).
TABLE 1 I.
Ultrasound Imaging Settings for Specific Tissues and Phantom In This Study
| Frame-rate (Hz) | Data acquisition time (s) | Number of ultrasound frames | Bolus injection (ml) | |
|---|---|---|---|---|
| Healthy liver | 415 | 6.0 | 2487 | 2.4 |
| ACLF liver * | 490 | 8.7 | 4276 | 2.4 |
| Kidney | 250 | 9.7 | 2424 | 2.0 |
| Pancreatic tumor | 415 | 5.2 | 2144 | 2.0 |
| Breast tumor | 622 | 9.0 | 5575 | 3.0 |
| Flow phantom | 490 | 7.7 | 3780 | -- |
ACLF - acute-on-chronic liver failure.
A phantom experiment was conducted on a custom-made flow channel phantom (Gammex Inc., Middleton, WI, USA) with a 2-mm inner diameter flow channel to facilitate the validation of the ULM technique. A syringe pump (Model NE-1010, New Era Pump Systems Inc., Farmingdale, NY, USA) connected to the flow channel’s outlet was used to steadily pump diluted MB solution (1/2000 dilution of the original concentration) through the flow channel at a constant flow rate of 3.77 ml/min (corresponding to 20 mm/s average flow speed). The same ultrasound scanner, transducer and imaging settings as those used in in vivo study were utilized for the phantom imaging. During ultrasound data acquisition, tissue motion was manually applied by the hand-held probe to mimic the in vivo tissue motion. Ultrasound IQ data were acquired from the longitudinal plane of the flow channel.
Ultrasound Imaging Settings
An HFR clinical ultrasound scanner (Resona 7, Shenzhen Mindray Bio-Medical Electronics Co. Ltd., Shenzhen, China) and an L9–3U linear array transducer (6.0 MHz center frequency, bandwidth 9.8MHz – 1.8MHz) were used for both real-time CEUS and ULM data acquisition. For ULM data acquisition, a linear ultrafast imaging sequence was implemented using a 5-angle plane-wave compounding (−10° to 10°, 3.6 MHz frequency, 1.5 cycles of pulse length, fundamental imaging) with a compounded frame-rate of several hundred Hertz. The frame-rate depends on the image depth and the image field-of-view (FOV), and may vary from case to case (Table 1). A stack of several thousands of ultrasound frames (Table 1) were acquired for each tissue, and the number of frames was determined by the frame-rate and acquisition duration.
Ultrasound signal processing
A spatiotemporal singular-value-decomposition (SVD) based clutter filter was applied to the ultrasound data (Fig.1a) to extract moving MB signals (Fig. 1b, corresponding to the median-to-high-rank components) (44, 45). Specifically, to improve the efficiency of SVD calculation, the long ensemble ultrasound data (several thousands of frames, indicated in Table 1) were first split into several shorter ensembles of data (each contained several hundreds of frames), and SVD based clutter filtering was performed for each of the split data separately to extract MB signals. The cutoff for singular value thresholding was identified by finding the turning point on the singular value curve based on the decay rate of the curve (45, 46). The MB signals can be used to generate contrast-enhanced power Doppler images by accumulating the power of the MB signals along the temporal dimension. It should be noted that this power Doppler image is based on the contrast MB signals and thus different from the non-contrast conventional power Doppler image. The same MB data will be used for localization and tracking in ULM. In this study, a phase correlation-based sub-pixel motion estimation method was applied to estimate tissue motion in 2-D based on the IQ data (with MB signals removed by the SVD filter) (43, 47), which will be utilized in the following steps to register the MB signals for robust tissue motion correction. By separating the MB signals and tissue signals, the influence of the moving MB signals on the tissue motion estimation can be suppressed (48).
Figure 1.

(a) Stack of B-mode images indicating original spatiotemporal ultrasound data from a healthy human liver (t represents slow time). (b) B-mode images of the MB signal extract from (a) with tissue clutter filtering. Centroids of MBs were localized and indicated by the red asterisks obtained from the cross-correlation with a predefined point-spread-function (PSF) of the system. (c) Accumulation of the MB centroid positions over time to generate an MB density map. (d) The estimated lateral tissue motion curve with respect to the first ultrasound frame before and after motion registration. (e) the microvessel density map obtained from accumulating MB positions with MB pairing, tracking, Kalman filtering, but without motion correction. (f) The microvessel density map with motion correction. Here, the example images in (c)(e)(f) were generated with 829 frames of MB data, corresponding to a data acquisition time of 2.0 s. The microvessel density images are displayed as the square root of the original accumulation intensity to compress the dynamic range for better visualization.
MB localization and tracking for ULM
An MB signal separation method was applied to break down the original MB data into several subsets of low MB concentration data based on MB flowing speeds and directions (39). With MB separation, the spatially overlapping MBs that are otherwise discarded in the conventional ULM processing may now be utilized for robust localization and tracking separately in each subset, to improve the efficiency and accuracy of MB event detection for the limited acquisition time (39). For each subset, tissue motion was removed based on the above motion estimation. The motion-corrected MB signals were equalized by a noise profile and then spatially interpolated to an axial-lateral pixel resolution of 57.5 μm using a 2-D spline interpolation. An intensity thresholding was applied to remove the noisy background. A 2-D normalized cross-correlation between interpolated MB data and a predefined point-spread function (PSF) was calculated, followed by thresholding to remove pixels with a correlation coefficient < 0.6. MB centroids were localized as the regional peaks of the cross-correlation map (Fig. 1b). A bipartite graph-based pairing algorithm was applied to track the movement of individual MBs over frames. Only those MBs consistently tracked over ten compounded ultrasound frames were preserved as confident MB events for generating microvessel images. Each MB trace was smoothed and the gaps in between MB positions on each MB trace were inpainted to further improve the microvessel delineation using a Kalman-filter-based algorithm (43). An MB movement direction and acceleration constraint were used to further remove noisy MB traces (43), before the accumulation of the MB traces from all the subsets to generate the final microvessel images (39).
Results
Robust ULM with Ultrafast imaging
The accumulation of MB positions from all the subsets generates an MB density image that depicts the vessel morphology (Fig. 1c, without motion registration). In this study, the microvessel density images are displayed as the square root of the original accumulation intensity to compress the dynamic range for better visualization. The Kalman filter-based algorithm was applied to smooth and inpaint the MB traces (43), further improving ULM image quality (Fig. 1e). Fig. 1d shows an example of a lateral motion curve (blue line). Even with breath-holding, tissue motion was still present (200 μm – 400 μm), which resulted in deteriorated microvessel imaging (Fig. 1e). Here a robust phase correlation-based motion correction method based on ultrafast ultrasound imaging was used to remove the tissue motion. The residual tissue motion was reduced to < 15 μm (red line, Fig. 1d), which falls well below the pixel size of the ULM image (57.5 μm × 57.5 μm). The motion-corrected microvessel image is depicted in Fig. 1f, showing an improved resolution.
ULM of Flow Channel Phantom
The ULM density and velocity images of the flow channel are shown in Fig. 2a and 2b, respectively, indicating a fully populated vessel lumen reconstructed based on a 7.7 s of ultrasound data (490 Hz frame-rate, Table 1). To better visualize the image, a sub-region of the flow channel (indicated by the dashed white rectangle) was magnified and shown in the bottom right of Fig. 2a and 2b. The manually induced tissue motion of the phantom is similar to the level of in vivo tissue motion shown in Fig. 1d. Improved resolution can be observed in the cross-sectional profile of the channel measured on the ULM density image compared with that measured on the contrast-enhanced power Doppler image, as shown in Fig. 2d. A well-developed parabolic-like flow speed profile can also be derived (Fig. 2e), which is expected for the flow in a straight channel.
Figure 2.

(a) Super-resolution ULM density image of the flow channel. A subregion of the flow channel indicated by the dashed white rectangle was magnified and shown in the bottom right of the image for better visualization. (b) Super-resolution ULM velocity image of the flow channel, with colormap indicating the magnitude of the velocity. The same subregion indicated by the dashed white rectangle was magnified and shown. (c) The estimated lateral tissue motion of the phantom tissue manually induced by the hand-held probe. (d) The averaged cross-sectional profile of the flow channel measured from the ULM density image and the corresponding contrast-enhanced power Doppler (PD) image. (e) The averaged cross-sectional profile of the flow speed measured from the ULM velocity image.
ULM of Healthy and Diseased Human Liver Microvasculature
The ULM images of a healthy liver with a FOV of 58 mm × 44 mm (depth × width) derived from 6.0 s of data (415.3 Hz frame-rate) are shown in Fig. 3. Fig. 3b shows the zoomed-in region depicting the detailed microvessel structures with a wide range of vessel diameters (millimeters to tens of micrometers). To further highlight the ULM resolution, a smaller region (indicated by the rectangle in Fig. 3b) was magnified (Fig. 3c), and compared with the contrast-enhanced power Doppler image generated using the same HFR dataset as those used for ULM (Fig. 3d, see Sub. Fig. 1a for a larger FOV image). There are some discontinuities of the vessel profile inside the relatively large vessel indicated by the arrow in Fig. 3c, which may be associated with the limited number of MB tracks detected in a short acquisition time. Vessel profile along the dashed line in Fig. 3c indicates a vessel width of 153 μm (full-width at half maximum, FWHM), showing about a 5.7-fold improvement of spatial resolution compared with the contrast-enhanced power Doppler image (869 μm, Fig. 3e) for the current imaging settings. Two branching vessels at the bifurcation with a width of 158 μm and 105 μm (575 μm distance), as indicated in Fig. 3e (right side), can be clearly resolved, but were inseparable in the power Doppler. Fig. 3f shows the bi-directional microvessel density image, similar to Fig. 3b but with red color indicates the upward flow and blue color represents the downward flow. Reasonable gradients of flow speeds from larger vessels to smaller vessels can be observed, as evidenced in the velocity magnitude image in Fig. 3g (see the bi-directional version of the microvessel velocity image in Sub. Fig.1c). A wide range of flow speeds (from about 1 mm/s to about 60 mm/s) can be measured as indicated by the distribution of the velocity magnitude (Fig. 3h).
Figure 3.
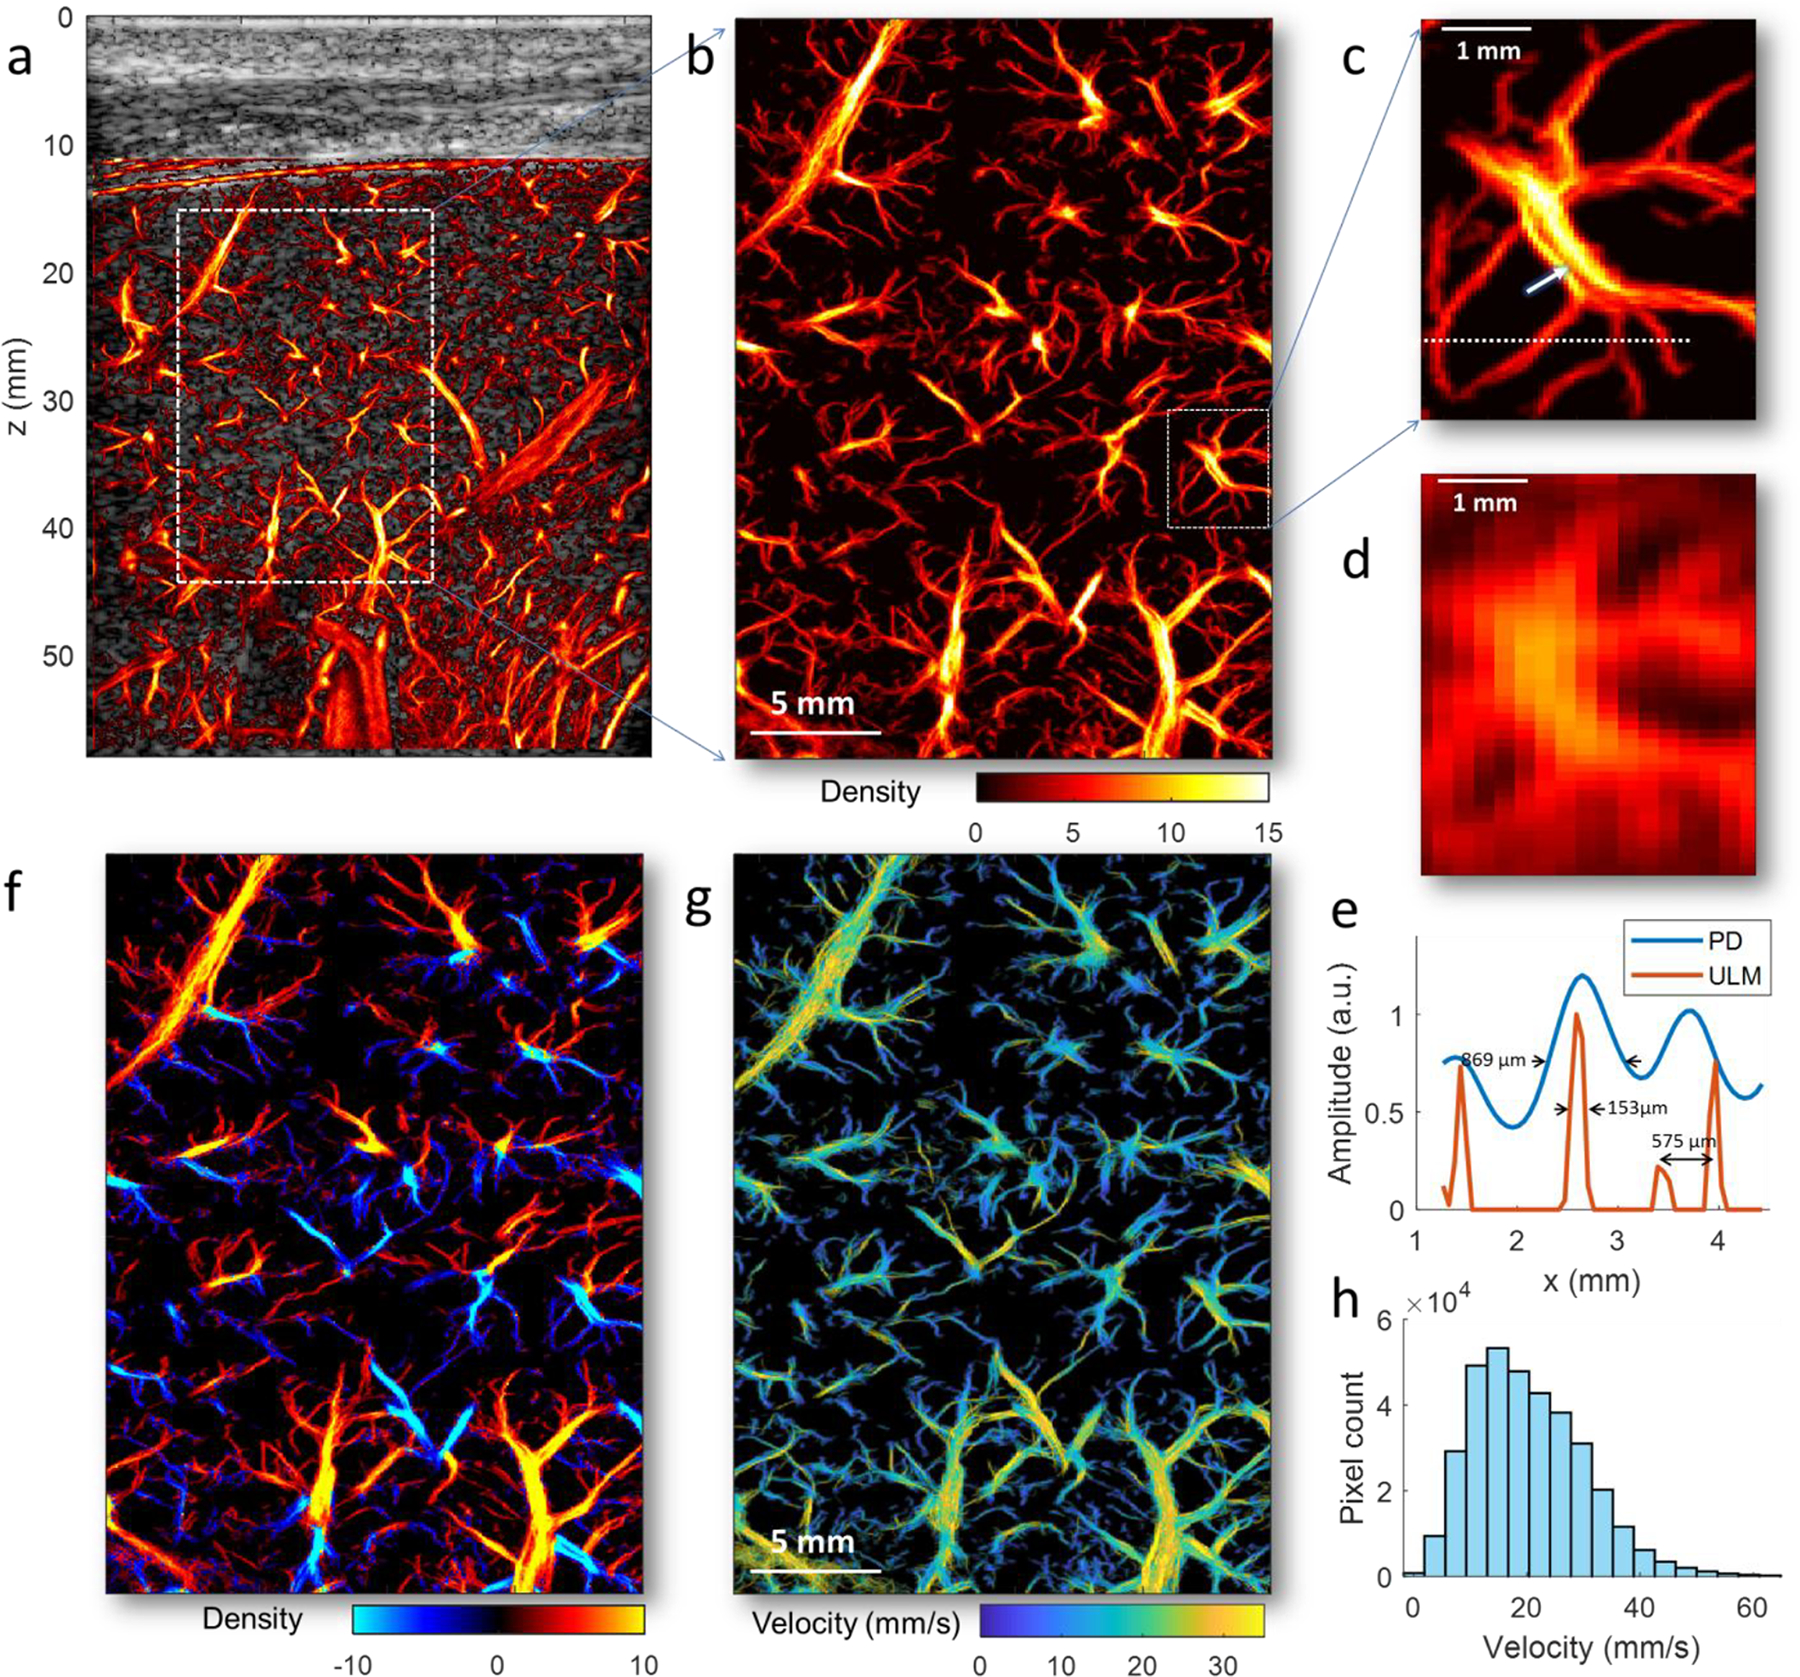
(a) Full FOV super-resolution ULM microvessel image of the healthy human liver overlaid on the B-mode image from a 70-year-old patient with no significant liver diseases. (b) The zoomed-in local region as indicated by the white rectangle in (a). (c) The magnified region indicated by the white rectangle in (b) highlighting a small branch of vessels. (d) The contrast-enhanced power Doppler image of the same branch of vessels in (c), which is obtained by accumulating the power of the MB signal over time. (e) Plots of a vessel profile along the white dashed line indicated in (c) using ULM (red curve)and power Doppler (blue curve). (f) Bi-directional super-resolution microvessel density image, similar to Fig. 3b but with red color indicates the upward flow and blue color represents the downward flow. (g) Super-resolution ULM microvessel velocity image of the healthy human liver, with color bar indicating the magnitude of the velocity. The direction of the blood flow can be found in Sup. Fig. 1. (h) The histogram of the blood flow speed distribution.
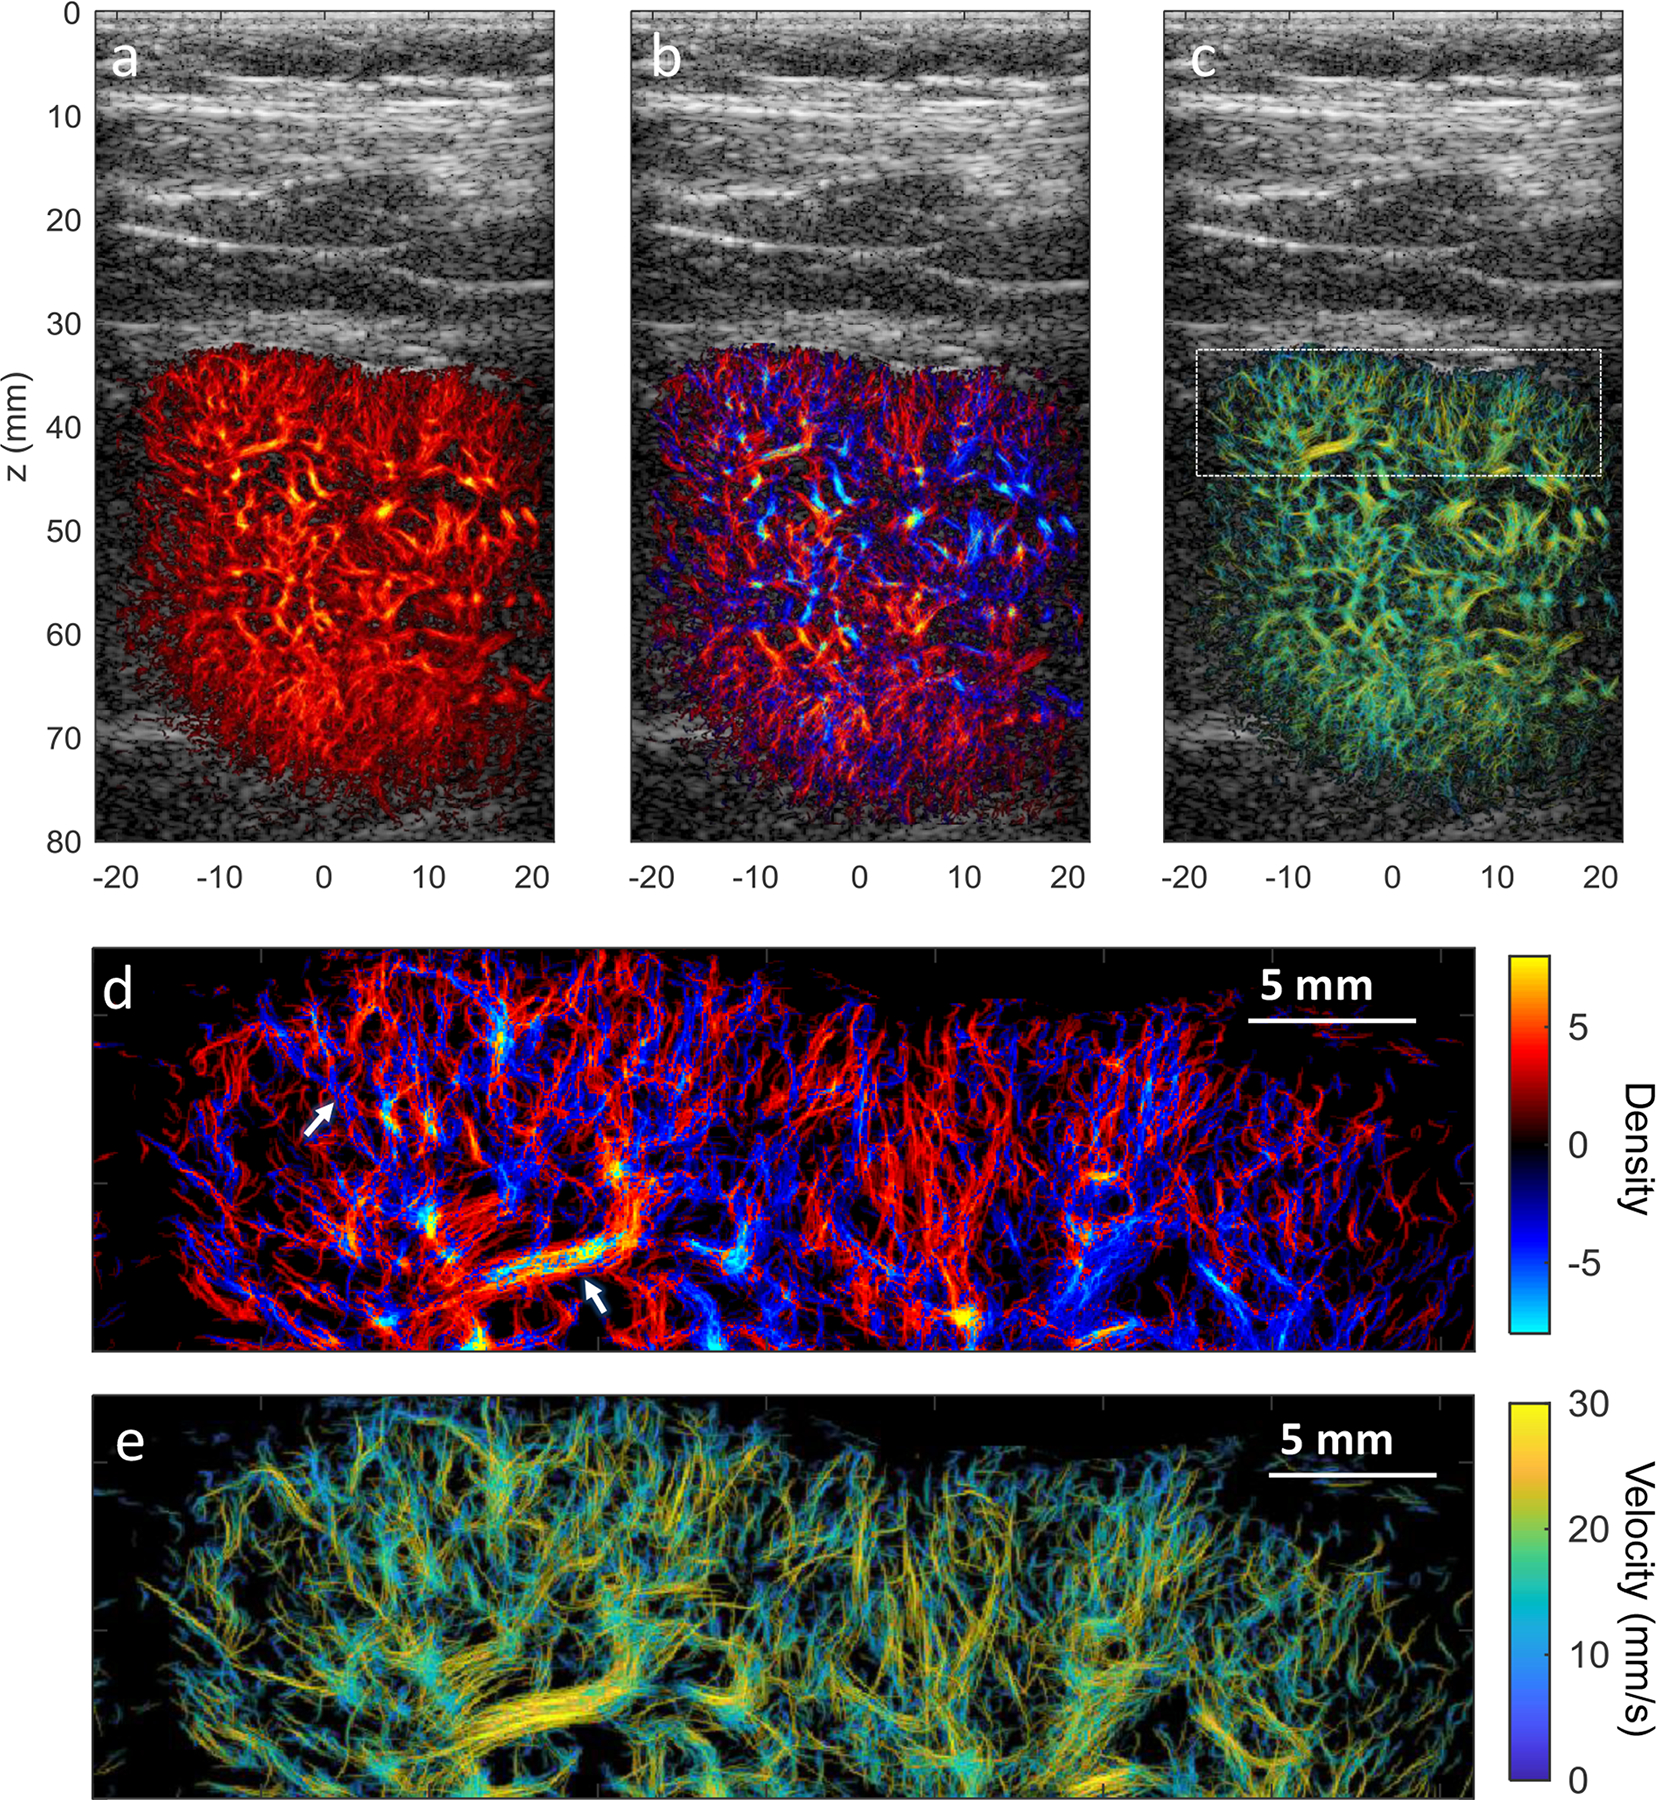
The ULM images of a diseased liver from a patient diagnosed with acute-on-chronic liver failure are shown in Fig. 4. The images were generated based on a data length of 8.7s at 490 Hz frame-rate. Analogue to the ULM images of the healthy liver shown in Fig. 3, detailed vasculature and flow dynamic information are revealed with improved resolution compared with the convention Power Doppler image (Fig. 4 and Sup. Fig. 2). A magnified region (indicated by the dashed white rectangle in Fig. 4b) of the power Doppler and ULM images are shown in Fig. 4e–4g, better depicting the resolution improvement and fine vasculature in local liver tissue. In the diseased liver, the ULM images (Fig. 4) visually show a distinct pattern of the vascular structure compared with those shown in the healthy liver (Fig. 3). Instead of the more organized and hierarchical vascular structures shown in the healthy liver, the diseased liver vessels seem to be more distorted with higher tortuosity and tapering in the main branches. The white arrows in Fig. 4b denote some of the tortuous and tapering vessels. This observation is more clearly revealed in the zoom-in region shown in Figs. 4f–4g, which may be related to the pathological change of liver tissue as a result of liver failure.
Figure 4.

(a) Full FOV super-resolution ULM microvessel density image of human liver overlaid on the B-mode image from a 38-year-old patient with acute-on-chronic liver failure. (b) The zoomed-in region as indicated by the white rectangle in (a). (c) Corresponding bi-directional microvessel density image, similar to Fig. 4b but with red color indicates the upward flow and blue color represents the downward flow. (d) Corresponding super-resolution microvessel velocity image, with colormap indicating the magnitude of the velocity. The direction of the blood flow can be found in Sup. Fig. 2. (e) Zoom-in region (indicated by the white rectangle in Fig. 4b) of the contrast-enhanced power Doppler image (see Sup. Fig. 2 for full FOV power Doppler). (f) Corresponding zoom-in region of the super-resolution microvessel density image. (g) Corresponding zoom-in region of the super-resolution microvessel velocity image. Some of the distorted vessels with tortuosity and/or tapering in the main branches are denoted by white arrows.
ULM of Healthy Human Kidney
The cortex of the human kidney represents a complex flow pattern with high perfusion, dense microvascular structure. A B-mode image of the kidney was shown in Sup. Fig.3a, indicating the orientation of the image plane. MB separation was able to separate MBs with opposite flow directions in cortical arteries and veins, thus yielding a higher number of high-fidelity MB traces for successful ULM with a short acquisition time (9.7 s of data with 250.4 Hz frame-rate), as shown in Fig. 5. The super-resolution microvessel density, bi-directional density and velocity magnitude images are shown in Fig. 5a–5c, respectively. Well-defined microvessel structure can be resolved, showing clear vessel boundaries in the cortex region, which are difficult to discern in the power Doppler image (Sup. Fig. 3b). Fig. 5d and 5e show the magnified region of the bi-directional density and velocity magnitude images at the upper cortex of the kidney, showing the details of the dense microvasculature and complex hemodynamics. In the bi-directional density image (Fig. 5d), a pixel is either assigned to red or blue colors even though there may be several vessels with opposite flow directions passing through the same pixel, which can lead to the ‘aliasing-like’ artifact indicated by the arrows in Fig. 5d. This can also easily appear in the horizontal vessel where flow direction is close to zero (or 180°) and pixels are hard split into red and blue colors based on the sign of the flow direction. Flow directions and the neighboring arteries and veins with opposite flows can be well-differentiated (Fig. 5d, and Sup. Fig. 3c–3d).
Figure 5.
(a) Super-resolution microvessel density image of a human kidney overlap on the ultrasound B-mode image. (b) corresponding bi-directional microvessel density image, similar to Fig. 5a, but with red color indicates the upward flow and blue color represents the downward flow. Neighboring cortical arteries and veins with opposite flow directions can be well-differentiated at high spatial resolution. (c) Corresponding super-resolution microvessel velocity image of the human kidney, with colormap indicating the magnitude of the velocity. The direction of the blood flow can be found in Sup. Fig. 3(b). (d) Zoom-in region of the bi-directional super-resolution microvessel density image and (c) Zoom-in region of super-resolution microvessel velocity image indicated by the white rectangle in (c) showing dense microvasculature and complex hemodynamics in the renal cortex.
ULM of In-human Pancreatic Tumor and Breast Tumor
We tested the ULM in a human pancreatic tumor with a depth down to 60 mm, and a shallow breast tumor down to 15 mm (Figs. 6–7). The pancreatic tumor data was acquired from a 70-year-old patient with an acquisition time of 5.2 s (frame-rate 415.3 Hz). This tumor had a large size with a dimension of about 164 mm × 65 mm × 66 mm with an anterior lesion boundary at a depth of around 10 mm, as assessed from the clinical ultrasound and CT scan. The acquired ultrasound data can only cover a portion of the lesion, as indicated in Fig. 6. The B-mode ultrasound indicates a mixed cystic solid mass with a dimension of 50 mm × 50 mm in the image FOV (with the boundary of the tumor was indicated by white arrows in Fig. 6a). ULM showed both the morphological and hemodynamic characteristics with a high spatial resolution (Fig. 6b– 6d). Figs. 6e–6f shows the magnified region of the power Doppler, ULM density, and velocity magnitude images at a deeper region (40 to 55 mm), respectively, revealing substantially improved resolution by the ULM. Feeding and draining vessels with opposite flow directions can be well-differentiated in the bi-directional density image (Fig. 6c, indicated by white and yellow arrows, respectively) or in the flow direction image and bi-directional velocity image (Sup. Fig. 4b and 4c).
Figure 6.

(a) B-mode image of a pancreatic tumor from a 70-year-old patient, with white arrows roughly indicating the boundary of the lesion. (b) Super-resolution microvessel density image of the human pancreatic tumor. (c) Corresponding bi-directional microvessel density image, similar to Fig. 6b but with red color indicates the upward flow and blue color represents the downward flow. (d) Corresponding super-resolution microvessel velocity image, with colormap indicating the magnitude of the velocity. The direction of the blood flow can be found in Sup. Fig. 4b. (e) Zoom-in region (indicated by the white rectangle in Fig. 6b) of the contrast-enhanced power Doppler image. (f) Corresponding zoom-in region of the super-resolution microvessel density image. (g) Corresponding zoom-in region of the super-resolution microvessel velocity image.
Figure 7.

(a) B-mode image of a breast tumor diagnosed as ductal carcinoma in situ from a 49-year-old patient after neoadjuvant chemotherapies, with white arrows roughly indicating the boundary of the lesion. (b) Corresponding super-resolution microvessel density image of the human breast tumor. (c) Corresponding bi-directional microvessel density image, similar to Fig. 7b but with red color indicates the upward flow and blue color represents the downward flow. (d) Corresponding super-resolution microvessel velocity image, with colormap indicating the magnitude of the velocity. (e) Zoom-in region (indicated by the white rectangle in Fig. 7b) of the contrast-enhanced power Doppler image. (f) Corresponding zoom-in region of the super-resolution microvessel density image. (g) Corresponding zoom-in region of the super-resolution microvessel velocity image.
The B-mode ultrasound of the breast tumor is shown in Fig. 7a, with white arrows indicating the boundary of the lesion. The data was acquired from a ductal carcinoma in situ (DCIS) diagnosed with histopathology on a 49-year-old patient who had been treated with neoadjuvant chemotherapies (9.0 seconds of data, frame-rate at 622 Hz). Similarly, substantial improvement in resolution was observed for ULM (Figs. 7b–7d) over the power Doppler (Sup. Fig. 5a). Local regions of power Doppler, ULM density and velocity magnitude images are shown in Figs. 7e–7g, respectively, for detailed visualization.
Discussion
Conventional ULM requires a long data acquisition time (dozens of seconds to minutes) to accumulate a sufficient amount of isolated MB signals for full delineation of the microvasculature. With the combination of HFR ultrasound imaging and advanced post-processing techniques (MB separation, Kalman-filter tracking, and sub-pixel motion registration) presented in this paper, robust ULM can be accomplished in vivo in humans using standard clinical procedure of MB administration and short data acquisition with a single breath-hold (< 10s), and free-hand scanning. In this preliminary study, we showed the feasibility of implementing fast and robust ULM on a clinical ultrasound scanner that is capable of HFR imaging. We also performed ULM imaging in various human tissues in vivo. The results showed well-defined morphological and functional features in the microvasculature in both healthy (liver, kidney) and pathological tissues (acute-on-chronic liver failure, pancreatic and breast tumors). Given that more and more clinical ultrasound scanners support the HFR imaging, there is a great potential for the methods presented in this paper to be widely distributed to enhance the clinical accessibility of ULM.
Contrast-enhanced power Doppler image derived from the same dataset used for ULM processing was utilized as a benchmark for resolution comparison in this study. In liver vessels with clear vascular branches at a depth of around 35 mm, we showed an about 5.7-fold resolution improvement of ULM compared with the contrast-enhanced power Doppler image. It should be noted that this improvement evaluation was based on one single vessel (Fig. 3c–3e), which has a vessel width of 153 μm (FWHM) measured in ULM and 869 μm measured in power Doppler image, and does not represent the highest resolution that can be achieved by either ULM or power Doppler image. In fact, contrast-enhanced power Doppler image, similar to the conventional ultrasound, can potentially achieve an axial resolution of approximately half-wavelength to one-wavelength, which is about 214 μm to 428 μm for the 3.6 MHz center frequency. This spatial resolution by conventional ultrasound image can be increased by using a higher ultrasound frequency, but still limited by ultrasound diffraction. Furthermore, a lateral profile was used to measure the vessel width here (Fig. 3e, 869 μm), which represented the measurement associated with the lateral resolution of the imaging. The lateral resolutions of both the contrast-enhanced power Doppler and ULM (related to the position error of localization) are affected by factors like timing resolution of the system, center frequency, transmitting and receiving aperture size, imaging depth, speed of sound, etc. (10), and expected to be worse than the ultrasound resolution in the axial direction. Nevertheless, by using the same data set under the same imaging settings, the ULM is shown to be capable of imaging vasculature with several-fold resolution improvement in vivo.
In this study, the super-resolved microvessel images were reconstructed at a 57.5 μm axial/lateral pixel resolution. This spatial resolution can be further improved by using a smaller pixel size down to about 1/20 to 1/10 of the acoustic wavelength (that is, 21 μm to 43 μm for a 3.6 MHz imaging frequency). However, a much longer acquisition time will be required to fully populate the microvasculature at such fine resolutions (6, 49–51). The required acquisition time for imaging capillary flows has been thoroughly evaluated by Christensen-Jeffries et al (50), Hingot et al (49), and Lowerison et al (51) that an extremely long time (e.g., tens of minutes) would be necessary for the capillary networks to be fully filled by MBs. Therefore, it is a physiological limitation of the technique that it would not be possible to image the capillary networks at the level of micrometers in less than 10 s used in this study. While increasing the MB concentration can speed up capillary perfusion of MBs, it also increases the challenge to obtain isolated MB signals for ULM imaging with elevated MB concentration even with the MB separation technique. Therefore, this is a tradeoff between the resolution of microvessel imaging and clinically practical condition of data acquisition time. As such, the inability to resolve full capillary bed remains a limitation for in-human ULM. Furthermore, the accuracy of motion registration will also limit the capability of imaging capillaries in human in vivo even a long acquisition is applied, especially for the liver or kidney, where tissue motion is significant and inevitable. However, for clinical applications such as liver and kidney the velocities in the images are mainly in the range of tens of millimeters per second, which are flows 10–20 times faster than that in the capillary networks. This level of vessels is supposed to be filled by MB much faster (may be tens of times faster) than capillaries with the slower flow. Based on our results in this study, it is possible to image vessels smaller than 100 μm using several seconds of data acquisition and using clinically relevant MB concentrations. Except for the practical condition for clinical scanning, the clinical needs for the imaging resolution of in-human ULM may also need to be considered. Whether the capability of resolving vessels at the level of arterioles and venules is adequate for clinical assessment of microvascular pathologies remains to be investigated.
Except for morphology imaging of the microvasculature, another advantage of ULM is the capability of providing 2-D flow velocity estimation that is Doppler angle-independent by tacking the individual MB movement. However, it typically requires a much longer acquisition time (e.g., 4 times longer) to reconstruct well-developed velocity profiles inside the vessels than the time required for reconstructing a microvessel density image (49). For each MB track, instantaneous MB moving velocity can be accurately measured, and the final velocity image is generated by averaging all velocity estimates of individual MBs passing through the same pixel. The instantaneous moving speed of different detected MBs pass through the same vessel or pixel can be very different due to the hemodynamic change associated with the cardiac phase, and the poor elevation resolution of ultrasound imaging. It may only need at least one MB to reconstruct a pixel of a vessel for the morphology image. However, to accurately estimate the velocity profiles, multiple MBs passing through the same pixel will be necessary for a stable averaged velocity estimate. Therefore, even morphology image can be very well-reconstructed, the number of MBs detected may not be sufficient to provide smooth velocity estimation in some of the microvessels, which is an inherent limitation of the ULM based on short acquisition times. As a consequence, there are some discontinuities and variations of velocity profiles observed in the velocity images in this study. There are possibilities that different velocities appear in one single vessel, or a relatively larger vessel shows a slower flow than its tiny branches. This issue of undersampling of velocity profiles would be potentially improved with more MB detections using a longer acquisition time. Nevertheless, the flow direction is less related to the cardiac phase and can be accurately estimated even there are only a few MBs passing through one pixel, which will provide added information combined with the morphology image, such as the bi-directional density image depicting both flow direction information and morphological information of the microvasculature.
A clinical relevant penetration depths were demonstrated for ULM in this study for various tissue imaging. However, since a linear array transducer was used, the optimal imaging performance was found mainly in depth less than about 5 cm. For some applications such as imaging deeper abdominal tissues (> 5 cm), a curved array or phased array transducer operating at lower frequencies can be deployed. As a pilot study, only a linear array transducer was used here to demonstrate in-human ULM, and the same ultrasound frequency (3.6 MHz) was used here for all of the organs from the shallowing breast tissue to the deeper kidney tissue for the purpose of concept proofing. However, the methods presented in this study can be conveniently translated to other transducers at different frequencies optimized for different applications.
One limitation of the study is that there was no ground truth for validating the microvasculature imaged by ULM. We have previously validated the ULM technique in a chick embryo model where optical imaging of the microvasculature can be obtained as a reference standard in vivo (39). However, it is challenging to have a gold standard for in-human studies due to the difficulty of obtaining human microvasculature with similar or higher resolution at the same imaging plane. To compensate for this limitation of validation, we included a flow channel phantom experiment, in which tissue motion was manually induced to mimic the in vivo tissue motion. With the presence of this tissue motion, there was no significant artificial vasculature observed in the background outside the flow channel lumen that resembled the hierarchical structure of physical vascular in vivo. However, a channel flow phantom with a diameter of 2 mm does not represent the microvessels with complex structures and hemodynamics in human in vivo, which constitutes a limitation of the current study. Even though in-human imaging is more complex than phantom imaging, the artifacts induced by motion, residual tissue signal, or random false MB tracks are assumed to be distinct from the hierarchical pattern of human vasculature. Furthermore, the vascular structures shown in the ULM images are morphologically consistent with the vessel structure shown in the corresponding power Doppler image, partially supporting the fidelity of vessel structure in ULM. Nevertheless, we were able to obtain physiologically reasonable microvascular images with a well-defined vessel network in two livers from two patients, which is consistent with those human liver vascular architecture reported in the literature obtained by vascular corrosion casting and micro-CT ex vivo (52). More interestingly, distinct vascular structure patterns were shown in the ULM images between a healthy liver and a diseased liver with acute-on-chronic liver failure. For instance, instead of clearly defined branching shown in healthy liver, distorted vessels with higher tortuosity and tapering in the main branches are more commonly observed in the diseased liver, which may be a strong indication of pathological changes of liver tissue associated with liver failure. It should be noted that these differences may be partly confounded by different 2D image planes for different patients. Since only one image plane was scanned for each patient in the current study, it is difficult to evaluate the inter-plane variance. However, microvessels are assumed to be distributed everywhere in the liver tissue, and thus the image of those microvessels (e.g., small vessel < 100 μm) may be less dependent on the imaging plane selection than that of the bigger vessels. More patients will be required with repeated scanning at different image planes to comprehensively evaluate the inter-plane difference in the future studies. To better demonstrate the usefulness of the super-resolution imaging in liver diseases or other vasculature-related pathologies, semi-quantitative or quantitative evaluation in a larger population will be required to elaborate the rich physio-pathological information indicated in the ULM images, which is left for future investigation. Nevertheless, we believe the ULM techniques have a great potential to bring a new role in the disease diagnosis, assessment, and monitoring in the future.
It is observed that in the ULM density image, the big vessel lumen may be less bright than the median size or even smaller size vessels, as indicated in Fig. 3a. This is because in the big vessel where the MB concentration is extremely high, the MB isolation and tracking is still challenging even with the MB separation technique. Consequently, a relatively lower number of MBs may be successfully detected and tracked, leading to a relatively darker appearance in the big vessel lumen. Another limitation is that the ULM requires a certain period of acquisition time (< 10 s in this study) to collect data of a sufficient number of MBs filling in the vasculature, which prohibits it from being a real-time imaging modality. Moreover, post-processing of a large amount of ULM data associated with long acquisition time, including SVD clutter filtering, MB localization, pairing, and tracking, is still time-consuming, which, however, has the possibility to be speeded up via parallel processing using high power GPU. In addition, two-dimensional (2-D) ULM suffers from inaccurate blood flow velocity estimation even with a very long acquisition time due to the tracking of 3-D MB movements using a 2-D imaging plane. The 2-D ultrasound image casts a slice thickness in the elevational direction (perpendicular to the 2-D image plane), which renders traces of MBs that are moving in-and-out-of-plane. Thus, 3-D ULM is necessary to accurately measure blood flow speed in all three dimensions. Additionally, the inability of out-of-plane motion correction is another inherent limitation of the 2-D imaging modality. To alleviate this issue, the patients were asked to hold the breath during data acquisition, and the image plane was carefully adjusted to minimize the out-of-plane tissue motions. However, to fully tackle this problem, a 3-D imaging with the capability of motion estimation in all spatial dimensions will be required.
In conclusion, we implemented an in-human ultrasound localization microscopy (ULM) imaging based on an HFR clinical ultrasound scanner, and showed high-definition morphological and functional imaging of microvasculature at super-resolution. By leveraging the high imaging speed and advanced post-processing algorithms, in-human ULM can be accomplished using data acquired from a single breath-hold (< 10 s) and free-hand scanning. The ULM imaging was tested in various in vivo human tissues including healthy and diseased liver, kidney, and pancreatic and breast tumors, showing the in-human feasibility of the technique. However, there is no ground truth for in-human microvasculature in the current study, necessitating more rigorous validations in the future.
Supplementary Material
Funding:
The study was partially supported by the National Institute of Diabetes and Digestive and Kidney Diseases under R01DK120559, the National Cancer Institute under R00CA214523, and the National Institute of Neurological Disorders and Stroke under R01NS111039. The content is solely the responsibility of the authors and does not necessarily represent the official views of the National Institutes of Health.
Abbreviations:
- ULM
ultrasound localization microscopy
- MB
microbubble
- CEUS
contrast-enhanced ultrasound
- HFR
high frame-rate
Footnotes
Competing Interests: The authors declare no competing interests.
References
- 1.Hanahan D, Weinberg RA. Hallmarks of Cancer: The Next Generation. Cell 2011;144(5):646–674. doi: 10.1016/j.cell.2011.02.013 [DOI] [PubMed] [Google Scholar]
- 2.Cade WT. Diabetes-Related Microvascular and Macrovascular Diseases in the Physical Therapy Setting. Phys Ther 2008;88(11):1322–1335. doi: 10.2522/ptj.20080008 [DOI] [PMC free article] [PubMed] [Google Scholar]
- 3.Goel S, Duda DG, Xu L, Munn LL, Boucher Y, Fukumura D, Jain RK. Normalization Of The Vasculature For Treatment Of Cancer And Other Diseases. Physiol Rev 2011;91(3):1071–1121. doi: 10.1152/physrev.00038.2010 [DOI] [PMC free article] [PubMed] [Google Scholar]
- 4.Greenberg SM. Research on stroke: Small vessels, big problems. N Engl J Med 2006;354(14):1451–1453. doi: 10.1056/NEJMp068043 [DOI] [PubMed] [Google Scholar]
- 5.Ooi QL, Tow F, Deva R, Alias MA, Kawasaki R, Wong TY, Mohamad N, Colville D, Hutchinson A, Savige J. The Microvasculature in Chronic Kidney Disease. Clin J Am Soc Nephrol 2011;6(8):1872–1878. doi: 10.2215/cjn.10291110 [DOI] [PMC free article] [PubMed] [Google Scholar]
- 6.Christensen-Jeffries K, Couture O, Dayton PA, Eldar YC, Hynynen K, Kiessling F, O’Reilly M, Pinton IGF, Schmitz G, Tang MX, Tanter M, Van Sloun RJG. Super-Resolution Ultrasound Imaging. Ultrasound Med Biol 2020;46(4):865–891. doi: 10.1016/j.ultrasmedbio.2019.11.013 [DOI] [PMC free article] [PubMed] [Google Scholar]
- 7.Couture O, Hingot V, Heiles B, Muleki-Seya P, Tanter M. Ultrasound Localization Microscopy and Super-Resolution: A State of the Art. IEEE Trans Ultrason Ferroelectr Freq Control 2018;65(8):1304–1320. doi: 10.1109/tuffc.2018.2850811 [DOI] [PubMed] [Google Scholar]
- 8.Lin E, Alessio A. What are the basic concepts of temporal, contrast, and spatial resolution in cardiac CT? J Cardiovasc Comput Tomogr 2009;3(6):403–408. doi: 10.1016/j.jcct.2009.07.003 [DOI] [PMC free article] [PubMed] [Google Scholar]
- 9.Forsberg F, Kuruvilla B, Pascua MB, Chaudhari MH, Merton DA, Palazzo JP, Goldberg BB. Comparing Contrast-Enhanced Color Flow Imaging and Pathological Measures of Breast Lesion Vascularity. Ultrasound in Medicine & Biology 2008;34(9):1365–1372. doi: 10.1016/j.ultrasmedbio.2008.02.010 [DOI] [PMC free article] [PubMed] [Google Scholar]
- 10.Errico C, Pierre J, Pezet S, Desailly Y, Lenkei Z, Couture O, Tanter M. Ultrafast ultrasound localization microscopy for deep super-resolution vascular imaging. Nature 2015;527(7579):499.-+. doi: 10.1038/nature16066 [DOI] [PubMed] [Google Scholar]
- 11.Opacic T, Dencks S, Theek B, Piepenbrock M, Ackermann D, Rix A, Lammers T, Stickeler E, Delorme S, Schmitz G, Kiessling F. Motion model ultrasound localization microscopy for preclinical and clinical multiparametric tumor characterization. Nat Commun 2018;9:13. doi: 10.1038/s41467-018-03973-8 [DOI] [PMC free article] [PubMed] [Google Scholar]
- 12.Christensen-Jeffries K, Browning RJ, Tang MX, Dunsby C, Eckersley RJ. In Vivo Acoustic Super-Resolution and Super-Resolved Velocity Mapping Using Microbubbles. IEEE Trans Med Imaging 2015;34(2):433–440. doi: 10.1109/tmi.2014.2359650 [DOI] [PubMed] [Google Scholar]
- 13.Foiret J, Zhang H, Ilovitsh T, Mahakian L, Tam S, Ferrara KW. Ultrasound localization microscopy to image and assess microvasculature in a rat kidney. Sci Rep 2017;7:12. doi: 10.1038/s41598-017-13676-7 [DOI] [PMC free article] [PubMed] [Google Scholar]
- 14.Ghosh D, Peng J, Brown K, Sirsi S, Mineo C, Shaul PW, Hoyt K. Super-Resolution Ultrasound Imaging of Skeletal Muscle Microvascular Dysfunction in an Animal Model of Type 2 Diabetes. J Ultrasound Med 2019;38(10):2589–2599. doi: 10.1002/jum.14956 [DOI] [PMC free article] [PubMed] [Google Scholar]
- 15.Lin FL, Shelton SE, Espindola D, Rojas JD, Pinton G, Dayton PA. 3-D Ultrasound Localization Microscopy for Identifying Microvascular Morphology Features of Tumor Angiogenesis at a Resolution Beyond the Diffraction Limit of Conventional Ultrasound. Theranostics 2017;7(1):196–204. doi: 10.7150/thno.16899 [DOI] [PMC free article] [PubMed] [Google Scholar]
- 16.Lowerison MR, Huang C, Lucien F, Chen S, Song P. Ultrasound localization microscopy of renal tumor xenografts in chicken embryo is correlated to hypoxia. Sci Rep 2020;10(1):2478. doi: 10.1038/s41598-020-59338-z [DOI] [PMC free article] [PubMed] [Google Scholar]
- 17.O’Reilly MA, Hynynen K. A super-resolution ultrasound method for brain vascular mapping. Med Phys 2013;40(11):7. doi: 10.1118/1.4823762 [DOI] [PMC free article] [PubMed] [Google Scholar]
- 18.Song PF, Trzasko JD, Manduca A, Huang RQ, Kadirvel R, Kallmes DF, Chen SG. Improved Super-Resolution Ultrasound Microvessel Imaging With Spatiotemporal Nonlocal Means Filtering and Bipartite Graph-Based Microbubble Tracking. IEEE Trans Ultrason Ferroelectr Freq Control 2018;65(2):149–167. doi: 10.1109/tuffc.2017.2778941 [DOI] [PMC free article] [PubMed] [Google Scholar]
- 19.Viessmann OM, Eckersley RJ, Christensen-Jeffries K, Tang MX, Dunsby C. Acoustic super-resolution with ultrasound and microbubbles. Phys Med Biol 2013;58(18):6447–6458. doi: 10.1088/0031-9155/58/18/6447 [DOI] [PubMed] [Google Scholar]
- 20.Zhang G, Harput S, Hu HY, Christensen-Jeffries K, Zhu JQ, Brown J, Leow CH, Eckersley RJ, Dunsby C, Tang MX. Fast Acoustic Wave Sparsely Activated Localization Microscopy: Ultrasound Super-Resolution Using Plane-Wave Activation of Nanodroplets. IEEE Trans Ultrason Ferroelectr Freq Control 2019;66(6):1039–1046. doi: 10.1109/tuffc.2019.2906496 [DOI] [PubMed] [Google Scholar]
- 21.Zhang G, Harput S, Lin ST, Christensen-Jeffries K, Leow CH, Brown J, Dunsby C, Eckersley RJ, Tang MX. Acoustic wave sparsely activated localization microscopy (AWSALM): Super-resolution ultrasound imaging using acoustic activation and deactivation of nanodroplets. Appl Phys Lett 2018;113(1):5. doi: 10.1063/1.5029874 [DOI] [Google Scholar]
- 22.Zhu JQ, Rowland EM, Harput S, Riemer K, Leow CH, Clark B, Cox K, Lim A, Christensen-Jeffries K, Zhang G, Brown J, Dunsby C, Eckersley RJ, Weinberg PD, Tang MX. 3D Super-Resolution US Imaging of Rabbit Lymph Node Vasculature in Vivo by Using Microbubbles. Radiology 2019;291(3):642–650. doi: 10.1148/radiol.2019182593 [DOI] [PubMed] [Google Scholar]
- 23.Bar-Zion A, Solomon O, Tremblay-Darveau C, Adam D, Eldar YC. SUSHI: Sparsity-Based Ultrasound Super-Resolution Hemodynamic Imaging. IEEE Transactions on Ultrasonics, Ferroelectrics, and Frequency Control 2018;65(12):2365–2380. doi: 10.1109/TUFFC.2018.2873380 [DOI] [PubMed] [Google Scholar]
- 24.Ackermann D, Schmitz G. Detection and Tracking of Multiple Microbubbles in Ultrasound B-Mode Images. IEEE Trans Ultrason Ferroelectr Freq Control 2016;63(1):72–82. doi: 10.1109/tuffc.2015.2500266 [DOI] [PubMed] [Google Scholar]
- 25.Bar-Zion A, Solomon O, Tremblay-Darveau C, Adam D, Eldar YC. SUSHI: Sparsity-Based Ultrasound Super-Resolution Hemodynamic Imaging. IEEE Trans Ultrason Ferroelectr Freq Control 2018;65(12):2365–2380. doi: 10.1109/tuffc.2018.2873380 [DOI] [PubMed] [Google Scholar]
- 26.Yu J, Lavery L, Kim K. Super-resolution ultrasound imaging method for microvasculature in vivo with a high temporal accuracy. Sci Rep 2018;8:11. doi: 10.1038/s41598-018-32235-2 [DOI] [PMC free article] [PubMed] [Google Scholar]
- 27.Zhang JB, Li N, Dong FH, Liang SY, Wang D, An J, Long YF, Wang YX, Luo YK, Zhang J. Ultrasound Microvascular Imaging Based on Super-Resolution Radial Fluctuations. J Ultrasound Med:10. doi: 10.1002/jum.15238 [DOI] [PubMed] [Google Scholar]
- 28.Lin FL, Tsuruta JK, Rojas JD, Dayton PA. Optimizing Sensitivity Of Ultrasound Contrast-Enhanced Super-Resolution Imaging By Tailoring Size Distribution Of Microbubble Contrast Agent. Ultrasound Med Biol 2017;43(10):2488–2493. doi: 10.1016/j.ultrasmedbio.2017.05.014 [DOI] [PMC free article] [PubMed] [Google Scholar]
- 29.Lok U, Huang C, Tang S, Gong P, Lucien F, Kim Y, Song P, Chen S. Three-dimensional Super-Resolution Ultrasound Microvessel Imaging with Bipartite Graph-based Microbubble Tracking using a Verasonics 256-channel Ultrasound System. 2019 IEEE International Ultrasonics Symposium (IUS) 2019; p. 1111–1113. [Google Scholar]
- 30.Kierski TM, Espíndola D, Newsome IG, Cherin E, Yin J, Foster FS, Démoré CEM, Pinton GF, Dayton PA. Superharmonic Ultrasound for Motion-Independent Localization Microscopy: Applications to Microvascular Imaging From Low to High Flow Rates. IEEE Transactions on Ultrasonics, Ferroelectrics, and Frequency Control 2020;67(5):957–967. doi: 10.1109/TUFFC.2020.2965767 [DOI] [PMC free article] [PubMed] [Google Scholar]
- 31.Desailly Y, Couture O, Fink M, Tanter M. Sono-activated ultrasound localization microscopy. Appl Phys Lett 2013;103(17):4. doi: 10.1063/1.4826597 [DOI] [Google Scholar]
- 32.Christensen-Jeffries K, Brown J, Aljabar P, Tang M, Dunsby C, Eckersley RJ. 3-D In Vitro Acoustic Super-Resolution and Super-Resolved Velocity Mapping Using Microbubbles. IEEE Transactions on Ultrasonics, Ferroelectrics, and Frequency Control 2017;64(10):1478–1486. doi: 10.1109/TUFFC.2017.2731664 [DOI] [PubMed] [Google Scholar]
- 33.Harput S, Tortoli P, Eckersley RJ, Dunsby C, Tang MX, Christensen-Jeffries K, Ramalli A, Brown J, Zhu JQ, Zhang G, Leow CH, Toulemonde M, Boni E. 3-D Super-Resolution Ultrasound Imaging With a 2-D Sparse Array. IEEE Trans Ultrason Ferroelectr Freq Control 2020;67(2):269–277. doi: 10.1109/tuffc.2019.2943646 [DOI] [PMC free article] [PubMed] [Google Scholar]
- 34.Heiles B, Correia M, Hingot V, Pernot M, Provost J, Tanter M, Couture O. Ultrafast 3D Ultrasound Localization Microscopy Using a 32 ×32 Matrix Array. IEEE Trans Med Imaging 2019;38(9):2005–2015. doi: 10.1109/TMI.2018.2890358 [DOI] [PubMed] [Google Scholar]
- 35.Jensen JA, Ommen ML, Øygard SH, Schou M, Sams T, Stuart MB, Beers C, Thomsen EV, Larsen NB, Tomov BG. Three-Dimensional Super-Resolution Imaging Using a Row–Column Array. IEEE Transactions on Ultrasonics, Ferroelectrics, and Frequency Control 2020;67(3):538–546. doi: 10.1109/TUFFC.2019.2948563 [DOI] [PubMed] [Google Scholar]
- 36.Sloun Rv, Solomon O, Bruce M, Khaing ZZ, Wijkstra H, Eldar YC, Mischi M. Super-resolution Ultrasound Localization Microscopy through Deep Learning. ArXiv 2018;abs/1804.07661. [DOI] [PubMed] [Google Scholar]
- 37.Liu X, Zhou T, Lu M, Yang Y, He Q, Luo J. Deep Learning for Ultrasound Localization Microscopy. IEEE Trans Med Imaging 2020:1–1. doi: 10.1109/TMI.2020.2986781 [DOI] [PubMed] [Google Scholar]
- 38.Yang Y, He Q, Zhang H, Qiu L, Qian L, Lee F, Liu Z, Luo J. Assessment of Diabetic Kidney Disease Using Ultrasound Localization Microscopy: An in Vivo Feasibility Study in Rats. 2018 IEEE International Ultrasonics Symposium (IUS) 2018; p. 1–4. [Google Scholar]
- 39.Huang C, Lowerison MR, Trzasko JD, Manduca A, Bresler Y, Tang S, Gong P, Lok UW, Song P, Chen S. Short Acquisition Time Super-Resolution Ultrasound Microvessel Imaging via Microbubble Separation. Sci Rep 2020;10(1):6007. doi: 10.1038/s41598-020-62898-9 [DOI] [PMC free article] [PubMed] [Google Scholar]
- 40.Dencks S, Piepenbrock M, Opacic T, Krauspe B, Stickeler E, Kiessling F, Schmitz G. Clinical Pilot Application of Super-Resolution US Imaging in Breast Cancer. IEEE Trans Ultrason Ferroelectr Freq Control 2019;66(3):517–526. doi: 10.1109/tuffc.2018.2872067 [DOI] [PubMed] [Google Scholar]
- 41.Harput S, Christensen-Jeffries K, Brown J, Li Y, Williams KJ, Davies AH, Eckersley RJ, Dunsby C, Tang M. Two-Stage Motion Correction for Super-Resolution Ultrasound Imaging in Human Lower Limb. IEEE Transactions on Ultrasonics, Ferroelectrics, and Frequency Control 2018;65(5):803–814. doi: 10.1109/TUFFC.2018.2824846 [DOI] [PubMed] [Google Scholar]
- 42.Kanoulas E, Butler M, Rowley C, Voulgaridou V, Diamantis K, Duncan WC, McNeilly A, Averkiou M, Wijkstra H, Mischi M, Wilson RS, Lu WP, Sboros V. Super-Resolution Contrast-Enhanced Ultrasound Methodology for the Identification of In Vivo Vascular Dynamics in 2D. Invest Radiol 2019;54(8):500–516. doi: 10.1097/rli.0000000000000565 [DOI] [PMC free article] [PubMed] [Google Scholar]
- 43.Tang S, Song P, Trzasko JD, Lowerison M, Huang C, Gong P, Lok U, Manduca A, Chen S. Kalman Filter–Based Microbubble Tracking for Robust Super-Resolution Ultrasound Microvessel Imaging. IEEE Transactions on Ultrasonics, Ferroelectrics, and Frequency Control 2020:1–1. doi: 10.1109/TUFFC.2020.2984384 [DOI] [PMC free article] [PubMed] [Google Scholar]
- 44.Demene C, Deffieux T, Pernot M, Osmanski BF, Biran V, Gennisson JL, Sieu LA, Bergel A, Franqui S, Correas JM, Cohen I, Baud O, Tanter M. Spatiotemporal Clutter Filtering of Ultrafast Ultrasound Data Highly Increases Doppler and fUltrasound Sensitivity. IEEE Trans Med Imaging 2015;34(11):2271–2285. doi: 10.1109/tmi.2015.2428634 [DOI] [PubMed] [Google Scholar]
- 45.Huang C, Song P, Gong P, Trzasko JD, Manduca A, Chen S. Debiasing-Based Noise Suppression for Ultrafast Ultrasound Microvessel Imaging. IEEE Transactions on Ultrasonics, Ferroelectrics, and Frequency Control 2019;66(8):1281–1291. doi: 10.1109/TUFFC.2019.2918180 [DOI] [PMC free article] [PubMed] [Google Scholar]
- 46.Song PF, Manduca A, Trzasko JD, Chen SG. Ultrasound Small Vessel Imaging With Block-Wise Adaptive Local Clutter Filtering. IEEE Trans Med Imaging 2017;36(1):251–262. doi: 10.1109/tmi.2016.2605819 [DOI] [PubMed] [Google Scholar]
- 47.Foroosh H, Zerubia JB, Berthod M. Extension of phase correlation to subpixel registration. IEEE Transactions on Image Processing 2002;11(3):188–200. doi: 10.1109/83.988953 [DOI] [PubMed] [Google Scholar]
- 48.Hingot V, Errico C, Tanter M, Couture O. Subwavelength motion-correction for ultrafast ultrasound localization microscopy. Ultrasonics 2017;77:17–21. doi: 10.1016/j.ultras.2017.01.008 [DOI] [PubMed] [Google Scholar]
- 49.Hingot V, Errico C, Heiles B, Rahal L, Tanter M, Couture O. Microvascular flow dictates the compromise between spatial resolution and acquisition time in Ultrasound Localization Microscopy. Sci Rep 2019;9(1):2456. doi: 10.1038/s41598-018-38349-x [DOI] [PMC free article] [PubMed] [Google Scholar]
- 50.Christensen-Jeffries K, Brown J, Harput S, Zhang G, Zhu J, Tang M, Dunsby C, Eckersley RJ. Poisson Statistical Model of Ultrasound Super-Resolution Imaging Acquisition Time. IEEE Transactions on Ultrasonics, Ferroelectrics, and Frequency Control 2019;66(7):1246–1254. doi: 10.1109/TUFFC.2019.2916603 [DOI] [PMC free article] [PubMed] [Google Scholar]
- 51.Lowerison MR, Huang C, Kim Y, Lucien F, Chen S, Song P. In Vivo Confocal Imaging of Fluorescently Labelled Microbubbles: Implications for Ultrasound Localization Microscopy. IEEE Transactions on Ultrasonics, Ferroelectrics, and Frequency Control 2020:1–1. doi: 10.1109/TUFFC.2020.2988159 [DOI] [PMC free article] [PubMed] [Google Scholar]
- 52.Debbaut C, Segers P, Cornillie P, Casteleyn C, Dierick M, Laleman W, Monbaliu D. Analyzing the human liver vascular architecture by combining vascular corrosion casting and micro-CT scanning: a feasibility study. Journal of Anatomy 2014;224(4):509–517. doi: 10.1111/joa.12156 [DOI] [PMC free article] [PubMed] [Google Scholar]
Associated Data
This section collects any data citations, data availability statements, or supplementary materials included in this article.