

Abstract
Background.
While taxonomy segregates anxiety symptoms into diagnoses, patients typically present with multiple diagnoses; this poses major challenges, particularly for youth, where mixed presentation is particularly common. Anxiety comorbidity could reflect multivariate, cross-domain interactions insufficiently emphasized in current taxonomy. We utilize network analytic approaches that model these interactions by characterizing pediatric anxiety as involving distinct, inter-connected, symptom domains. Quantifying this network structure could inform views of pediatric anxiety that shape clinical practice and research.
Methods.
Participants were 4964 youths (ages 5–17 years) from seven international sites. Participants completed standard symptom inventory assessing severity along distinct domains that follow pediatric anxiety DSM categories. We first applied network analytic tools to quantify the anxiety domain network structure. We then examined whether variation in the network structure related to age (3-year longitudinal assessments) and sex, key moderators of pediatric anxiety expression.
Results.
The anxiety network featured a highly inter-connected structure; all domains correlated positively but to varying degrees. Anxiety patients and healthy youth differed in severity but demonstrated a comparable network structure. We noted specific sex differences in the network structure; longitudinal data indicated additional structural changes during childhood. Generalized-anxiety and panic symptoms consistently emerged as central domains.
Conclusions.
Pediatric anxiety manifests along multiple, inter-connected symptom domains. By quantifying cross-domain associations and related moderation effects, the current study might shape views on the diagnosis, treatment, and study of pediatric anxiety.
Keywords: Adolescent, anxiety, child, comorbidity, development, network, pediatric, symptoms
Introduction
While psychiatric taxonomy groups pediatric anxiety symptoms into distinct diagnostic entities (American Psychiatric Association, 2013), limited specificity in presentation, pathophysiology, and treatment response (Cummings, Caporino, & Kendall, 2014; Cuthbert & Insel, 2013; Kotov et al., 2017) suggests that pediatric anxiety may involve multiple, interacting symptom domains insufficiently emphasized in current nosology. In particular, a network-theory perspective would view anxiety as involving distinct but inter-connected symptom domains, which can be modeled using computational tools (Borsboom, 2017; Contreras, Nieto, Valiente, Espinosa, & Vazquez, 2019; Fried et al., 2017). The current report utilizes such tools in a large international sample to characterize the network structure of pediatric anxiety and examine moderation by anxiety severity, age, and sex.
Pediatric anxiety is prevalent, impairing, and associated with adverse outcomes (Beesdo, Knappe, & Pine, 2009; Greenberg et al., 1999; Kessler & Wang, 2008; Stein, Scott, de Jonge, & Kessler, 2017). Current nosology groups pediatric anxiety symptoms into distinct diagnoses, such as social anxiety, separation anxiety, and panic disorders. The distinction among these reflects unique clinical features and is supported by behavioral observations and factor analyses (American Psychiatric Association, 2013; Hale, Crocetti, Raaijmakers, & Meeus, 2011). Nevertheless, affected individuals typically present with symptoms from multiple domains†,1 (Cummings et al., 2014; Merikangas & Swanson, 2010); subsequently, these symptom domains appear to show limited specificity in outcome, familial aggregation, biology, and treatment response (Cuthbert & Insel, 2013; Hofmann & Hayes, 2019; Kotov et al., 2017). This complicates diagnosis, treatment, and clinical research, leading to calls for alternative classification schemes (Cuthbert & Insel, 2013; Kotov et al., 2017; Krueger, 1999; Rutter, 2011). This problem is particular significant in youth, where treatment studies, unlike in adults, typically target multiple disorders as a group (RUPP, 2001).
To reconcile conflict between views emphasizing distinctness with observed rates of comorbidity, pediatric anxiety may be conceptualized as manifesting within a multivariate network of inter-connected symptom domains (Borsboom & Cramer, 2013; Heeren, Bernstein, & McNally, 2018; Hofmann & Hayes, 2019). Thus, this view reconciles such conflict by retaining well-validated diagnostic categories while recognizing comorbidity as inherent to the expression of anxiety. Drawing from graph theory, computational network analytic tools could be used to evaluate this possibility (Borsboom, 2017; Borsboom & Cramer, 2013; Contreras et al., 2019; Fried et al., 2017; Hofmann, Curtiss, & McNally, 2016). Network analysis quantifies a network topology by estimating the magnitude of unique associations (edges) among symptom domains that assess distinct constructs (nodes). Emergent from this topology are also node centrality measures that index the connectivity, and thus importance, of each domain within the network. Finally, network tools provide statistical methods to compare topologies over time or between groups, allowing for the quantification of moderation effects on the network structure.
Network analysis could show pediatric anxiety to involve a structure that potentially informs clinical and research conceptualizations (Borsboom & Cramer, 2013; Heeren et al., 2018). The insights arise from the ability of network analysis to map links among specific clinical features and identify central features in the network. For example, if the topology of this network is revealed to be only sparsely-connected, this would provide support for an independent-domain perspective of anxiety (e.g. an individual is expected to be affected only by symptoms of one domain, such as social anxiety). Alternatively, uncovered associations among specific domains would indicate symptom manifestations that are more likely to occur together; this information could aid in diagnosing co-occurring disorders as well as guide future research on common pathophysiology, or it could identify domains with high network centrality as potential targets for process-specific treatment (Fried et al., 2017, 2018; Heeren et al., 2018; Hofmann & Hayes, 2019; Merikangas & Swanson, 2010; Weisz et al., 2012). Moreover, the effects of moderators on symptom expression could be quantified by identifying variations in the network structure. For example, age and sex differences (Beesdo et al., 2009; Van Oort, Greaves-Lord, Verhulst, Ormel, & Huizink, 2009) could impact network structures in ways that potentially inform evaluation, treatment, and research.
To date, a number of studies implement network analytic approaches to provide important insights into anxiety-related symptoms in youth (Contreras et al., 2019; Heeren et al., 2018; Jones, Mair, Riemann, Mugno, & McNally, 2018; McElroy, Fearon, Belsky, Fonagy, & Patalay, 2018; Rouquette et al., 2018). However, these studies only characterize links among individual questionnaire items and rely on parent-report alone; these features may reduce sensitivity, validity, and accuracy in assessing core aspects of internalizing symptoms such as anxiety (see online Supplement) (De Los Reyes & Kazdin, 2005; Epskamp, Borsboom, & Fried, 2018a; Fried & Cramer, 2017). Importantly, no study characterizes pediatric anxiety as a network of higher-level, validated symptom domains that correspond to established classification systems. Research on associations among these domains might prove particularly useful when trying to resolve a conflict between views of anxiety as arising from these unique, validated domains despite the presence of data suggesting extremely tight connections among these purportedly distinct domains (Keeton, Kolos, & Walkup, 2009).
This report examines the network structure of pediatric anxiety in a large youth sample (N = 4964; 5–17 years) aggregated from seven international sites. Participants were assessed using the child-reported Screen for Child Anxiety Related Emotional Disorders (SCARED), a standard measure featuring strong psychometric properties for assessing severity of distinct symptom domains that follow pediatric anxiety diagnostic categories (Birmaher et al., 1997, 1999; Hale et al., 2011), i.e. social anxiety, separation anxiety, generalized anxiety, and panic; additionally, school anxiety. The sample presented with a wide range of symptom severity (healthy, non-selected, high-risk, or clinically-anxious youth). We perform a set of analyses to characterize pediatric anxiety as a network of distinct but inter-connected domains and relate network variation to diagnostic status and key moderators. Specifically, we first quantify the network topology of pediatric anxiety, including identification of central symptom domains. Given typical co-occurrence of generalized, separation, and social anxiety (Keeton et al., 2009), we hypothesize that these domains would show high connectivity and centrality. Next, we test for variations in the network structure as a function of diagnostic status and sex (Beesdo et al., 2009; Costello, Egger, Copeland, Erkanli, & Angold, 2011), hypothesizing denser networks (greater overall connectivity) in patients and in females due to higher expected symptom severity (Beesdo et al., 2009; Fried et al., 2017; Keeton et al., 2009). Finally, we examine longitudinal changes in the network structure during childhood and adolescence among participants who provided data at two time-points, hypothesizing denser networks in later childhood as symptom severity is expected to increase (Beesdo et al., 2009; Van Oort et al., 2009). Together, this report utilizes network analytical approaches to characterize pediatric anxiety as a network of inter-connected domains and relate network variation to diagnostic status and key moderators.
Methods
Data were aggregated from seven independent, international research sites for the purpose of increasing generalizability of results by forming a large, mixed sample spanning a wide range of symptom presentation (Angold, Costello, & Erkanli, 1999). Several measures were consistent across sites, including the SCARED, age, and sex.
Participants
Data from 4964 participants aged 5–17 years (mean = 11.32 years, S.D. = 2.64; 49.1% females) were collected at the following sites: the National Institute of Mental Health (Bethesda, MD); Florida International University (Miami, FL); Yale University Child Study Center (New Haven, CT); The Pennsylvania State University (University Park, PA); High Risk Cohort Study for the Development of Childhood Psychiatric Disorders (HRC; Brazil); Universidade Federal do Rio Grande do Sul (Porto Alegre, Brazil), and the University of Amsterdam (Amsterdam, the Netherlands). See Table 1 for demographic and clinical characteristics by site. Overall, sampling included non-selected youth, at-risk youth, healthy-volunteers (HVs) (without any psychiatric diagnosis), and anxiety patients, ensuring a broad range of anxiety symptom severity. Sites differed significantly by age, sex, and symptom severity (see online Supplement); accordingly, analyses controlled for specific effects of sites (see below). A sub-sample provided data at two time-points (T1, T2); cross-sectional analyses used only T1 data; longitudinal analyses used T1 and T2 data. All participants satisfied these inclusion criteria: (1) have complete child-report SCARED data; (2) have age and sex data; and (3) be 5–17 years-of-age. See online Supplement for additional information for each site. At each site, the study was performed in compliance with the Code of Ethics of the World Medical Association, approved by the local Institutional Review Board. Prior to participation, informed consent, and assent were obtained from parents and youth, respectively.
Table 1.
Demographic and clinical characteristics of the seven samples contributing data
| Description/site | NIMH (n = 1089) | FIU (n = 222) | UFRGS (n = 72) | PSU (n = 209) | UvA (n = 673) | HRC (n = 2214) | Yale (n = 485) | Total (n = 4964) |
|---|---|---|---|---|---|---|---|---|
| Age [M (s.d.)] | 12.52 (2.60) | 10.25 (2.77) | 8.88 (1.62) | 10.87 (0.96) | 14.32 (1.18) | 10.21 (1.91) | 10.63 (3.13) | 11.32 (2.64) |
| Female [N (%)] | 550 (50.51) | 110 (49.55) | 38 (52.78) | 94 (44.98) | 398 (59.14) | 1006 (45.44) | 240 (49.69) | 2436 (49.07) |
| Anxiety disorder diagnosis [N (%)] | 455 (41.78) | 222 (100) | 72 (100) | – | – | – | 340 (70.10) | 1089 (21.9) |
| SCARED subscale score [M (s.d.)] | ||||||||
| GAD | 4.35 (3.82) | 6.54 (4.66) | 8.67 (4.48) | 4.11 (3.56) | 5.70 (4.23) | 6.24 (4.36) | 7.39 (4.99) | 5.82 (4.40) |
| SOC | 5.03 (3.63) | 7.11 (4.17) | 6.93 (3.49) | 4.36 (3.61) | 5.58 (3.61) | 5.84 (3.51) | 6.82 (3.83) | 5.73 (3.67) |
| SEP | 3.02 (3.21) | 6.86 (4.35) | 8.82 (4.66) | 3.89 (3.41) | 2.71 (2.48) | 6.58 (3.71) | 5.58 (3.98) | 5.11 (3.92) |
| PAN | 3.47 (3.73) | 6.27 (5.62) | 6.39 (4.66) | 3.18 (3.55) | 3.25 (3.50) | 4.47 (4.87) | 6.68 (5.25) | 4.35 (4.62) |
| SCH | 1.43 (1.66) | 2.20 (2.00) | 1.92 (1.90) | 1.08 (1.32) | 1.48 (1.49) | 1.47 (1.66) | 2.43 (2.13) | 1.58 (1.73) |
| Total score | 17.30 (12.53) | 28.98 (16.26) | 32.72 (12.33) | 16.63 (12.17) | 18.72 (12.00) | 24.59 (14.39) | 28.90 (15.43) | 22.59 (14.43) |
NIMH, National Institute of Mental Health (USA); FIU, Florida International University (USA); UFRGS, Universidade Federal do Rio Grande do Sul (Brazil); PSU, The Pennsylvania State University (USA); UvA, University of Amsterdam (the Netherlands); HRC, High Risk Cohort Study for the Development of Childhood Psychiatric Disorders (Brazil); Yale, Yale University Child Study Center (USA). SCARED, The Screen for Child Anxiety Related Emotional Disorders; GAD, generalized anxiety disorder symptoms; SOC, social anxiety disorder symptoms; SEP, separation anxiety disorder symptoms; PAN, panic disorder/somatic symptoms; SCH, school avoidance symptoms.
Anxiety symptoms and diagnosis
Anxiety symptoms
Anxiety symptoms were assessed using the SCARED, a child-report measure comprising 41 statements relating to recent anxiety symptoms (past 3 months) rated on a 3-point Likert scale (Birmaher et al., 1997, 1999). Multiple exploratory and confirmatory factor analysis studies (review and meta-analysis in Hale et al., 2011) consistently indicate item groupings corresponding to four symptom domains specified by DSM anxiety disorders (American Psychiatric Association, 2013). Specifically, items in the generalized anxiety disorder domain (GAD; nine items) primarily index worry-related cognitions; the separation anxiety disorder domain (SEP; eight items) groups items relating to fear of separation from significant others; the social anxiety disorder domain (SOC; seven items) groups items relating to fear of/in social settings; the panic disorder domain (PAN; 13 items) groups items that index physiological arousal; in addition, a fifth domain assesses school-related fears (SCH; four items). Most items are domain-specific. See online Supplement for item examples. The reliability and validity of these domains have been established through studies in clinical and community samples across different countries (Birmaher et al., 1997, 1999; Hale, Raaijmakers, Muris, van Hoof, & Meeus, 2008; Hale et al., 2011). The SCARED subscales therefore follow DSM taxonomy of pediatric anxiety disorders; subscale sum-scores provide dimensional symptom severity for these disorders.
To compare the relative magnitude of endorsed symptoms between domains, each subscale sum-score was divided by the number of subscale items, yielding proportioned scores. To account for site differences in age, sex, and symptom subscale scores, network analyses were conducted on residuals from linearregression analyses predicting subscale scores by dummy variables representing sites. For a sub-sample (n = 1988), both child- and parent-report SCARED data were available, enabling auxiliary analyses on reporter differences.
Anxiety diagnosis
In some sites (see online Supplement), participants were assessed for the presence of psychiatric disorders through gold-standard semi-structured interviews conducted by trained clinicians, forming the basis for the anxiety patient and HV (no disorder) sub-samples (see online Supplement).
Anxiety symptom network
Network theory provides a systems perspective of psychopathology that emerges from the interplay among its symptom constituents (Borsboom, 2017; Borsboom & Cramer, 2013). Operationally, it utilizes computational methods to estimate a symptom network topology: a mapping of all unique associations (edges) between variables such as symptoms or symptom domains (nodes) (Borsboom, 2017; Borsboom & Cramer, 2013; Fried et al., 2017). Here, we examined pediatric anxiety from a network perspective. That is, while psychiatric taxonomy classifies pediatric anxiety symptoms into distinct disorders, such distinct disorders might represent nodes existing within a network structure. Thus, instead of manifesting along single domains, pediatric anxiety symptoms may manifest through multiple symptom domains in a multivariate manner, such that the domains reflect distinct but covarying expressions of anxiety (e.g. fear responses in the form of cognitive worry or physiological arousal, in social or separation settings). This approach therefore retains established DSM categories, but allows them to covary. To test whether symptom domains are inter-related, we utilized network analytic tools to quantify a network structure. Accordingly, we used symptom domains as the constituents of the network, with SCARED subscale sum-scores, as opposed to individual items, as nodes and edges quantifying the unique covariation between these domains by means of partial correlations. In addition to addressing our question on associations among established diagnostic domains, using subscale scores (as opposed to individual items) has several key advantages in this context: it reduces estimation problems due to individual-item overlap and multicollinearity; it improves accuracy of estimated parameters; and it facilitates interpretation of findings (see online Supplement) (Epskamp et al., 2018a; Fried & Cramer, 2017). Furthermore, it allows for dimension reduction based on item groupings created and validated outside of this sample, thus diminishing potential ‘double-dipping’ issues.
Network topology
The R package qgraph was used to estimate edge-weights (unique associations between domain nodes) as regularized partial-correlations based on Gaussian Graphical Models (Epskamp, Cramer, Waldorp, Schmittmann, & Borsboom, 2012). Reported edge values (r) reflect regularized partial-correlation coefficients. The package NetworkComparisonTest (NCT) tested age and sex differences between networks, yielding two metrics of topology invariance: global structure (M statistic) assesses whether network structures differ, and global strength (S statistic) quantifies differences in overall network connectivity (Van Borkulo, 2016) (see online Supplement).
Node centrality
Graph theory computes measures of node centrality: latent factors indexing node connectivity within the network. Here, due to its superior psychometrics, we used node strength, defined as the sum of absolute edge-weights connecting a node to all other nodes (Epskamp et al., 2018a). This importantly complements severity scores by identifying core symptoms that may not necessarily show high severity but instead closely track with other domains (see online Supplement).
Analytic plan
All analyses characterize and compare sub-samples in terms of: (1) mean proportioned symptom domain scores; (2) associations among symptom domains, as estimated through network topology; and (3) symptom domain centrality within the network, as estimated through node strength. Differences in symptom domain scores were tested using linear mixed-effects with subject as a random-effect and site as a covariate to account for site differences. All network analyses were conducted on residual data controlling for effects of sites (see limitations section). Group and longitudinal differences in network topology were tested using the NCT. See online Supplement for all code and correlation matrices to facilitate reproducibility.
The anxiety symptom network in the full sample
We characterized associations among anxiety domains using the full dataset (N = 4964).
The anxiety symptom network in pathological anxiety
To test whether the presence v. absence of pathological anxiety manifested in distinct patterns of domain associations, we compared networks between the anxiety patient (n = 1089) and HV (n = 634) sub-samples.
The anxiety symptom network and sex
To test for sex differences in domain associations (Beesdo et al., 2009), we compared symptom networks between females (n = 2436) and males (n = 2528) using the full sample.
Changes in the anxiety symptom network with age
Finally, we tested longitudinal (within-subject) changes in symptom networks in a sub-sample of youths (n = 1664, HRC site) who provided data at two time-points approximately 3 years apart (T1, T2; online Supplementary Table S1). We focused on longitudinal changes during childhood and during adolescence, two critical developmental periods involving changes in anxiety symptoms (Beesdo et al., 2009; Van Oort et al., 2009). Accordingly, this sub-sample was divided into child cohort (participants aged 5.8–9.9 years at T1; n = 793) and adolescent cohort (participants aged 10.0–14.3 years at T1; n = 871).
Additional analyses
We compared anxiety networks between child- and parent-report data (Behrens, Swetlitz, Pine, & Pagliaccio, 2018) in a sub-sample that had data for both informants (n = 1988).
All hypotheses were two-sided and assumed a significance level of 0.05.
Results
The anxiety symptom network in the full sample
In the full sample, the SOC symptom domain demonstrated the highest mean proportioned severity score (Fig. 1, top), followed by GAD and SEP symptoms; panic/somatic (PAN) symptoms showed the lowest severity (see online Supplement). The anxiety symptom domain network (Fig. 1, center) was estimated with high accuracy (online Supplementary Fig. S1), and indicated positive unique associations among all domains, with variation in the strength of connections between domains. The strongest edges were GAD–PAN symptoms and GAD–SOC symptoms (partial-correlations: r = 0.39 and r = 0.31, respectively). This suggests that excessive worry relates particularly tightly to somatic symptoms and social distress; the SOC–PAN edge was estimated as weakest (r = 0.04; see online Supplementary Table S3 for partial-correlations). Finally, GAD and PAN symptoms demonstrated the highest connectivity within the network (Fig. 1, bottom), as indexed by node strength; SOC, SEP, and SCH symptoms demonstrated low strength (see online Supplement).
Fig. 1.

Anxiety symptom domains in the full sample (n = 4964). Top: mean domain severity score for the five anxiety symptom domains. Center: anxiety symptom network topology. All edges are positive; thicker edges represent stronger associations. Bottom: strength of each domain node in the anxiety network (Z-scored). GAD, generalized anxiety disorder symptoms; SEP, separation anxiety disorder symptoms; SOC, social anxiety disorder symptoms; PAN, panic disorder/somatic symptoms; SCH, school phobia symptoms.
Note: Symptom domain severity score was calculated as a subscale score divided by the number of subscale items. Error bars indicate one standard error of the mean.
To examine generalizability, network structure and centrality indices were also estimated separately within each site; analyses yielded similar cross-site network features, supporting generalizability, alongside site-specific features (see online Supplement). An additional supplemental analysis modeled domain factor-scores (based on confirmatory factor-analysis) rather than sum-scores. Factor- and sum-scores were highly correlated (0.91 < rs < 0.99), as were the network adjacency matrices estimated by them (r = 0.90), but some network differences were also observed (see online Supplement).
The anxiety symptom network in pathological anxiety
Anxiety patients endorsed significantly greater symptom severity relative to healthy participants across all domains (ps < 0.001; see online Supplement), but the samples featured a similar pattern of relative symptom domain severity (SOC > GAD > SEP > SCH > PAN; Fig. 2, top). The estimated networks of both samples (Fig. 2, center; accuracy metrics in online Supplementary Fig. S4) featured varying positive associations among all symptom domains. GAD–PAN and GAD–SOC were the strongest edges in the HV network (rs = 0.33); GAD–PAN was the strongest edge in the patient network (r = 0.42) (see online Supplementary Table S5). Despite significant group differences in symptom severity, the HV and patient network featured comparable global network structure, M =0.12, p = 0.14, and global strength (i.e. absolute sum of edges), S = 0.07, p = 0.15. Finally, networks in patients and healthy subjects featured high relative strength of GAD and PAN symptoms (Fig. 2, bottom; see online Supplement); in the healthy relative to the patient network, SEP symptoms showed higher relative strength and SCH showed relative lower strength.
Fig. 2.

Anxiety symptoms in (a) HVs (n = 634) and (b) anxiety patients (n = 1089). Top: mean domain score for the five anxiety symptom domains. Center: anxiety symptom network topology. All edges are positive; thicker edges represent stronger associations. Bottom: strength of each domain node in the anxiety network (Z-scored). GAD, generalized anxiety disorder symptoms; SEP, separation anxiety disorder symptoms; SOC, social anxiety disorder symptoms; PAN, panic disorder/somatic symptoms; SCH, school phobia symptoms.
Note: Symptom domain severity score was calculated as a subscale score divided by the number of subscale items. Error bars indicate one standard error of the mean.
The anxiety symptom network and sex
Mean symptom domain severity varied as a function of sex (domain × sex interaction), F(420 369) = 10.28, p < 0.0001. Follow-up analyses indicated that females endorsed higher severity than males on all domains, ps < 0.0001, but both groups exhibited relatively similar patterns of symptom domain severity (Fig. 3, top). In both estimated networks (Fig. 3, center; online Supplementary Fig. S5 for accuracy), symptom pairs were positively associated, with GAD–PAN being the strongest edge (females: r = 0.40, males: r = 0.38) (see online Supplementary Table S6). A significant sex difference in the global structure was noted, M = 0.09, p = 0.038; follow-up tests indicated that, among females, the GAD–SCH edge was significantly stronger, p = 0.005. Global strength did not differ between groups, S = 0.04, p = 0.13. In both samples, GAD and PAN symptoms featured high relative strength; SCH symptoms featured higher relative strength in the female relative to male network (Fig. 3, bottom).
Fig. 3.

Anxiety symptoms in the male and female samples. Data presented are for the full sample divided into: (a) males (n = 2522) and (b) females (n = 2470). Top: mean domain severity score for the five anxiety symptom domains. Center: anxiety symptom network topology. All edges are positive; thicker edges represent stronger regularized partial correlations. Bottom: strength of each node in the anxiety network (Z-scored). GAD, generalized anxiety disorder symptoms; SEP, separation anxiety disorder symptoms; SOC, social anxiety disorder symptoms; PAN, panic disorder/somatic symptoms; SCH, school phobia symptoms.
Note: Symptom domain severity score was calculated as a subscale score divided by the number of subscale items. Error bars indicate one standard error of the mean.
Changes in the anxiety symptom network with development
Longitudinal analyses in the child cohort indicated significant decreases with reassessment after 3 years for SOC, SEP, PAN, and SCH symptoms (Fig. 4a, top), ps < 0.001, but not in GAD levels, p = 0.51. Edge-weight matrices were significantly correlated over time, r = 0.82, p = 0.004, indicating acceptable reliability. Nevertheless, the network structure significantly changed over time in this cohort, M = .15, p = 0.019 (Fig. 4a, center; online Supplementary Figs. S6, S7 for accuracy). Follow-up tests indicated a significant decrease in GAD-PAN association over time, p < 0.001. Global network strength did not change, S = 0.04, p = 0.37. Finally, the centrality of GAD symptoms decreased with time, whereas the centrality of PAN symptoms increased (Fig. 4a, bottom).
Fig. 4.
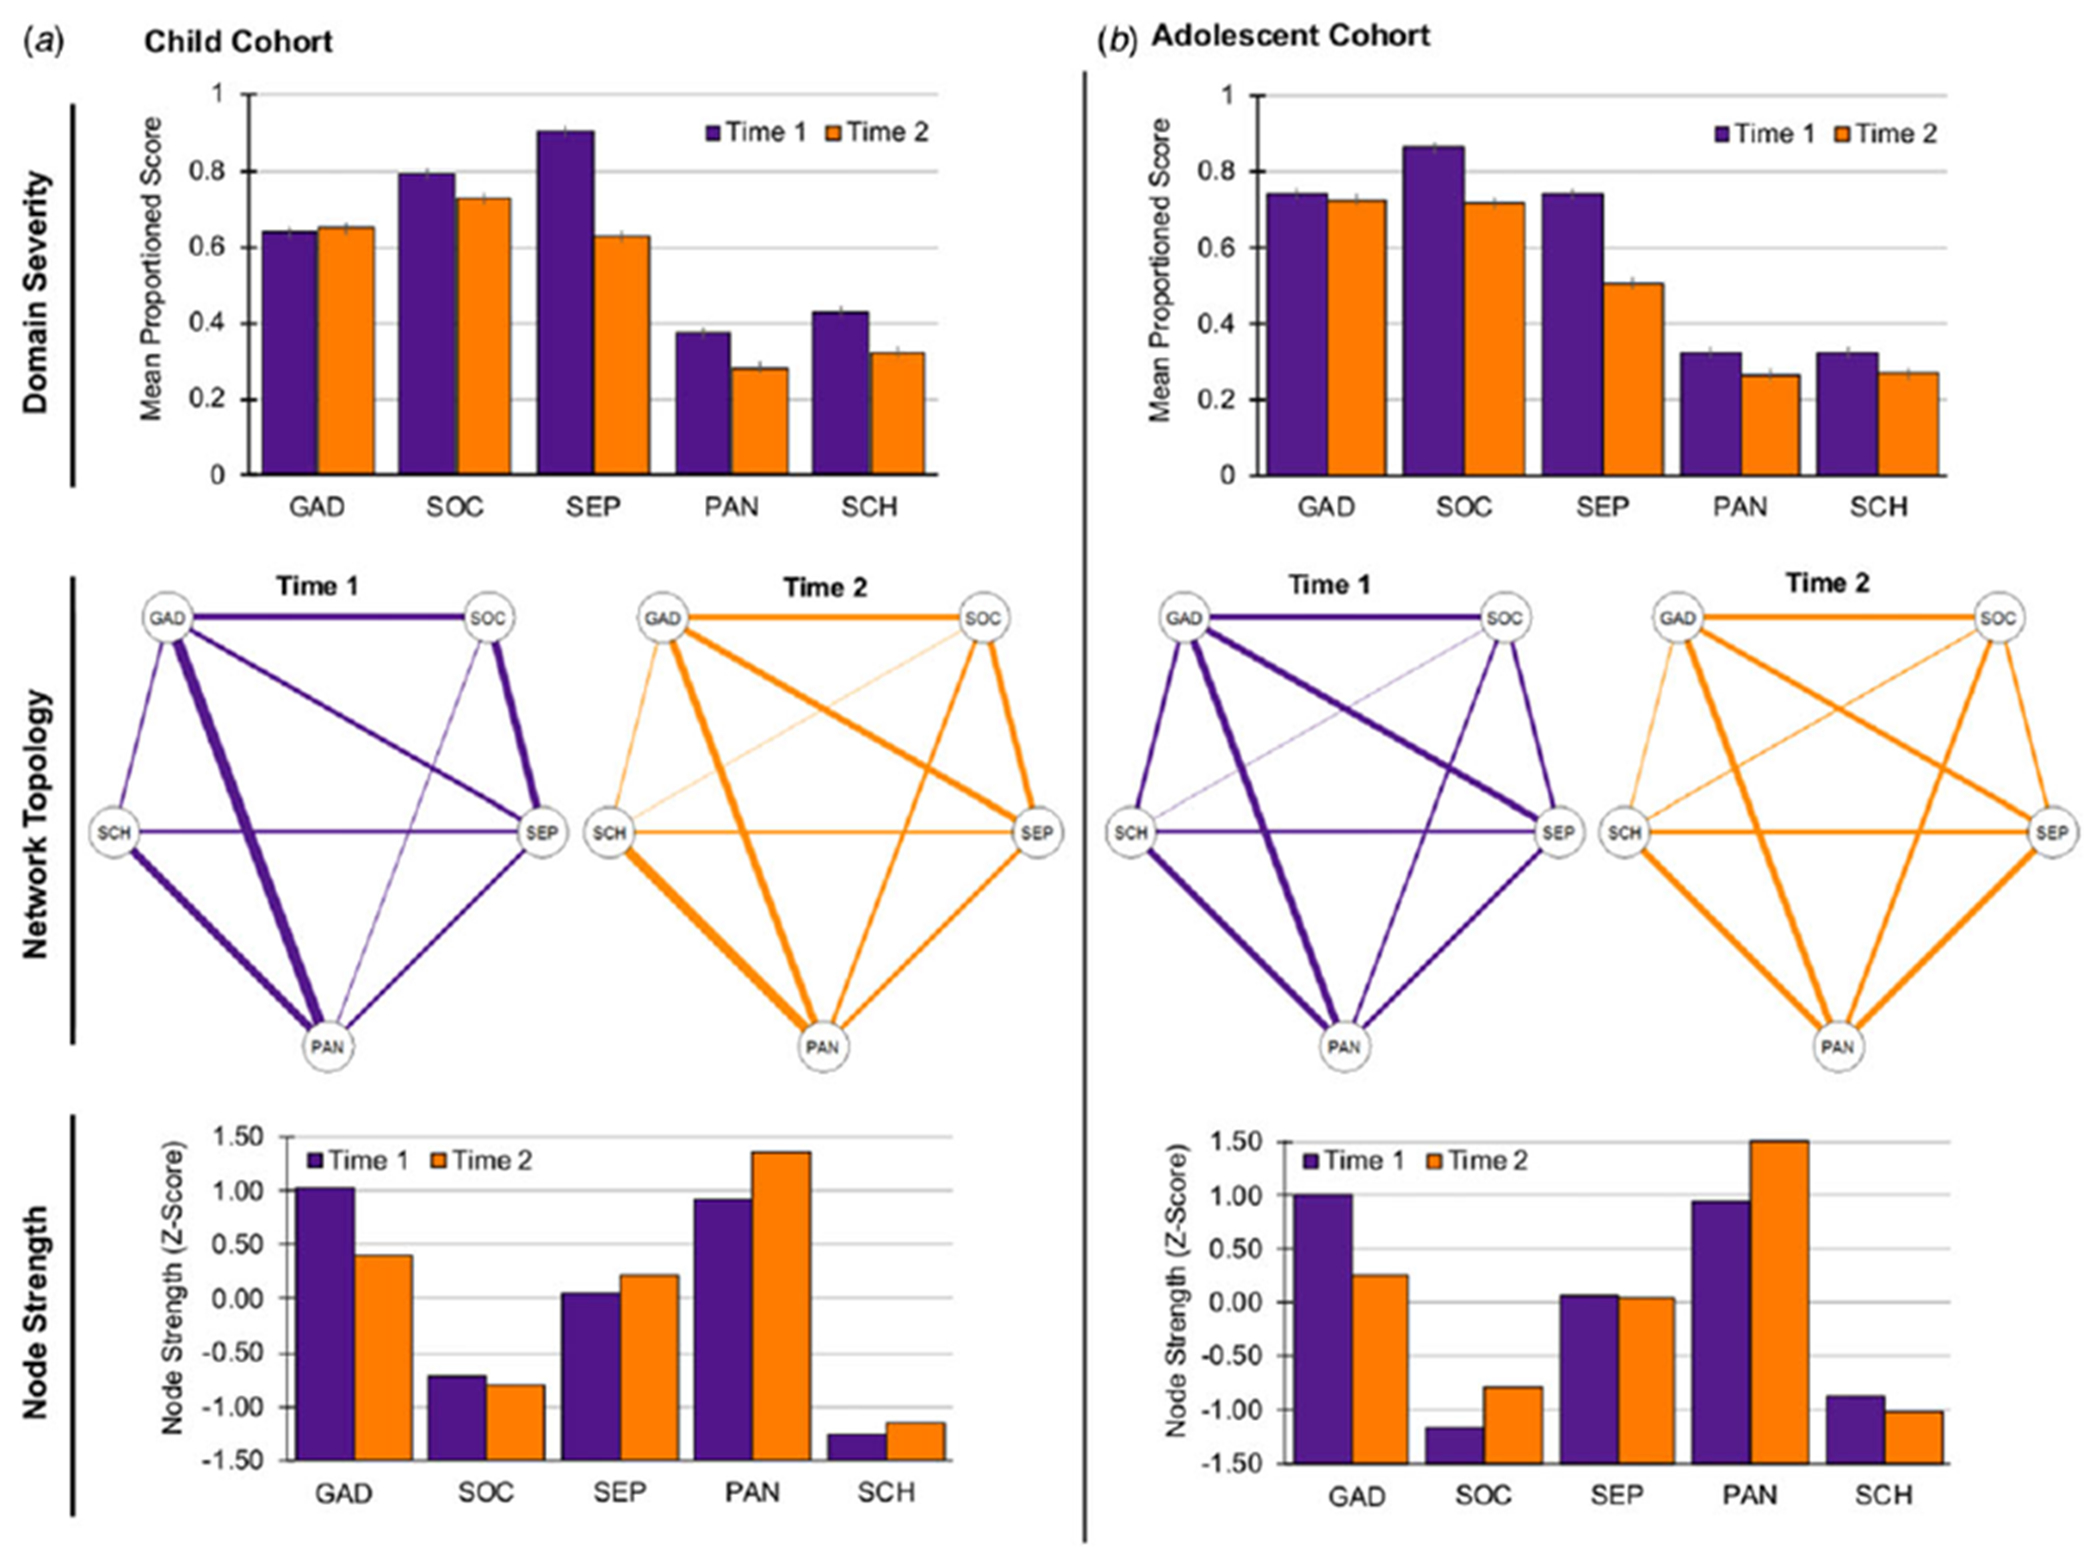
Longitudinal changes in anxiety symptoms (n = 1664). Data presented reflect longitudinal changes (from Time 1 to Time 2) in anxiety symptoms across two 3-year periods: (a) childhood (age 5.8–9.9 years at Time 1; n = 793), and (b) adolescence (age 10.0–14.3 years at Time 1; n = 871). Top: mean domain severity score for the five anxiety symptom domains. Center: anxiety symptom network topology. All edges are positive; thicker edges represent stronger associations. Bottom: strength of each domain node in the anxiety network (Z-scored). GAD, generalized anxiety disorder symptoms; SEP, separation anxiety disorder symptoms; SOC, social anxiety disorder symptoms; PAN, panic disorder/somatic symptoms; SCH, school phobia symptoms.
Note: Symptom domain severity score was calculated as a subscale score divided by the number of subscale items. Error bars indicate one standard error of the mean.
Longitudinal analyses in the adolescent cohort indicated significant decreases with reassessment in SOC, SEP, PAN, and SCH severity (Fig. 4b, top),ps < 0.001; GAD severity did not significantly change, p = 0.35. Edge-weight matrices were correlated over time, r = 0.79, p = 0.006, again, indicating acceptable reliability. Neither network structure nor strength (Fig. 4b, center) significantly changed across adolescence, ps > 0.27. Continuing the pattern observed in the child cohort, the centrality of GAD symptoms decreased with time, whereas PAN centrality increased (Fig. 4b, bottom). See online Supplementary Table S7 for all edge coefficients.
Additional analyses
Additional analyses examined reporter differences (child- v. parent-report in dyads) in anxiety symptom networks. The global network structure significantly differed as a function of the reporter; follow-up analyses indicated that children reported weaker GAD–SEP association, but stronger GAD–PAN and SOC–SEP associations. Furthermore, the child-report network highlighted the centrality of both GAD and PAN domains, whereas in the parent-report network, GAD symptoms featured higher centrality relative to all other domains. Complete details are provided in online Supplement.
Discussion
A network analytic approach reveals several novel insights into pediatric anxiety. First, anxiety symptom domains manifest an inter-connected network structure, with GAD and PAN symptoms constituting central nodes. Second, sex differences were noted in terms of both symptom severity and symptom network structure. Finally, longitudinal data find strong overall within-subject reliability in the anxiety symptom network structure with some notable changes during childhood for specific edges. Together, results suggest that pediatric anxiety manifests along multiple, inter-connected domains, and identify moderators of this network structure.
Network analysis quantified the unique associations among distinct pediatric anxiety symptom domains. SOC symptoms showed the greatest severity and correlated most strongly with worry-related (GAD) symptoms, and only weakly with PAN symptoms. Within the network, worry and panic/somatic symptoms tracked most closely together, as well as cumulatively with the other domains in the network (i.e. high centrality). Anxiety patients and healthy youth differed in symptom severity, but not in the magnitude or pattern of inter-domain associations, supporting a dimensional view of anxiety severity as discussed below.
Age and sex have been identified as important moderators of anxiety symptom presentation. Pediatric anxiety symptoms change as children age, although the reported nature of these changes may differ across studies (Beesdo et al., 2009; Costello, Copeland, & Angold, 2011; Hale et al., 2008; Van Oort et al., 2009). Our longitudinal data indicate that symptom networks show high within-subject stability across development. These data further demonstrate early developmental changes in the relations among anxiety domains. This change manifested most prominently as decreasing association between worry-related and panic/somatic symptoms, potentially reflecting maturation in ability to distinguish internal states of fear-evoked worry and physiological arousal, possibly due to maturation and developmental differentiation in neural circuitry supporting such functions (Nook, Sasse, Lambert, McLaughlin, & Somerville, 2017; Smidt & Suvak, 2015). Greater severity of symptoms among females relative to males echoes prior findings (Beesdo et al., 2009; Hale et al., 2011). Our findings extend such reports by showing that sex differences also manifest in a symptom network configuration, primarily in associations between worry and school- and social-related fears.
In addition to quantifying the magnitude of inter-domain associations, network analysis delineates several broader characteristics of pediatric anxiety. First, correlations among all symptom domains indicate that anxiety typically manifests along multiple symptom domains, consistent with homotypic comorbidity (Hammerness et al., 2008; Merikangas & Swanson, 2010; Wittchen, Lecrubier, Beesdo, & Nocon, 2003). A highly-connected network structure may point to a potential core perturbation. This perturbation may not necessarily constitute a diagnostic symptom in the network but still may manifest to varying degrees through constituents of the network (Caspi & Moffitt, 2018; Cramer, Waldorp, van der Maas, & Borsboom, 2010; McNally et al., 2015). For example, a tendency for exaggerated neural response to threat could influence fear responses to stressors in social, school, and separation settings. Biology (e.g. sex, age) and social context (e.g. parent/peer behavior) may influence networks in ways that generate individual differences in eventual symptom presentation (Lahey, Van Hulle, Singh, Waldman, & Rathouz, 2011; Lebowitz, Leckman, Silverman, & Feldman, 2016). Alternatively, symptoms might not arise from a single perturbation, but rather show dynamic causal interactions (Borsboom, 2017; Caspi & Moffitt, 2018); for example, greater social anxiety severity might lead to increased worry. Our findings highlight particularly strong putative inter-domain links; continued research using repeated measurements of symptoms over multiple time points could further elucidate the dynamics of this network (Epskamp et al., 2018b).
Of note, network structure did not differ between normative and pathological anxiety samples, extending reports of homotypic comorbidity. Such findings support a dimensional view of anxiety severity and inform the broader ongoing debate on the qualitative nature of psychopathology (Beesdo et al., 2009; Cuthbert & Insel, 2013; Hofmann et al., 2016; Kotov et al., 2017; Rutter, 2011). In particular, these findings are in line with efforts to generate classification systems based on dimensions of neurobiology and behavior (e.g. Research Domain Criteria; Cuthbert and Insel, 2013).
Network analysis consistently revealed the centrality of the GAD and PAN domains within the network. The GAD domain indexes general worry-related cognitions, while the PAN domain indexes acute, context-free arousal responses. In contrast, the SOC, SEP, and SCH domains may reflect specific contexts in which fear responses are evoked. High connectivity of GAD and PAN symptoms with other domains suggests that worry and somatic-arousal symptoms may ‘cut across’ specific domains, constituting the cognitive and physiological manifestations of anxiety in response to threat elicited in different specific contexts (e.g. social settings). Indeed, it has been suggested that worry and panic/somatic symptoms are common to all anxiety disorders (Barlow, 2002; Shear, Bjelland, Beesdo, Gloster, & Wittchen, 2007). For example, the expression of anxiety may vary as a function of threat proximity, ranging from anxious worry when a threat is distal and uncertain to panic symptoms that facilitate defensive responding when the threat is immediate (Craske, 1999; Fanselow, Lester, Bolles, & Beecher, 1988; Shear et al., 2007). Importantly, these inferences are uniquely provided through network analysis; domain severity scores do not reveal patterns of associations and connectivity between domains (e.g. compare high centrality vis-á-vis low severity of PAN symptoms).
Standard psychiatric nosology classifies pediatric anxiety symptoms into distinct domains; this distinction is supported by factor analyses (Hale et al., 2011). However, typical presentation of symptoms of multiple domains complicates diagnosis, treatment, and clinical research (Cummings et al., 2014; Cuthbert & Insel, 2013; Hofmann & Hayes, 2019; Kotov et al., 2017; Krueger, 1999; Rapee, Schniering, & Hudson, 2009). A network perspective offers a complementary perspective of pediatric anxiety. This perspective provides quantitative information which could address some of these challenges and potentially, through continued research, inform clinical care and study, while maintaining existing classification schemes.
For example, a diagnostic process should expect a multidimensional presentation of pediatric anxiety symptoms as indicated here; thus, knowledge about strongly-correlated domains could aid diagnosis by guiding clinicians towards anxiety subtypes that are more likely to co-occur. Moreover, the dimensional nature of domain associations could facilitate identification of at-risk youth presenting with sub-threshold symptoms (Angold, Costello, Farmer, Burns, & Erkanli, 1999; Beesdo et al., 2009). Additionally, group-level network characteristics (e.g. global connectivity) have been suggested to predict later clinical outcomes (Boschloo, Schoevers, van Borkulo, Borsboom, & Oldehinkel, 2016; van Borkulo et al., 2015); it remains to be investigated whether such effects translate to individual-level predictions (Fried et al., 2017). Treatment may likewise potentially benefit from information revealed by network analysis. A central symptom domain could be specifically targeted by an intervention, potentially affecting other domains; for a similar reason, such a domain could be recognized as a potential vulnerability for relapse (Bringmann et al., 2013; Fried et al., 2018; Fried, Epskamp, Nesse, Tuerlinckx, & Borsboom, 2016; Heeren et al., 2018; Hofmann et al., 2016; McNally et al., 2015; Robinaugh, Millner, & McNally, 2016; Rodebaugh et al., 2018). Along these lines, particularly strong domain associations (e.g. SOC–GAD) could reflect specific processes that significantly contribute to anxiety manifestation and which should therefore be targeted by interventions (Hofmann & Hayes, 2019; Hofmann et al., 2016; Weisz et al., 2012). Such process-specific treatments have been recently advocated (Hofmann & Hayes, 2019; Weisz et al., 2012). Finally, patterns of domain associations may inform research on shared v. unique pathophysiology underlying the expression of symptoms. For example, symptom domains showing stronger unique associations may show more closely-linked correlates than weakly-associated domains, and potentially inform on common pathophysiology.
Nevertheless, it is important to emphasize that potential clinical implications derived from our findings are currently limited due to the cross-sectional nature of most of our available data. Thus, while we identify the effects of potential clinical relevance, additional research is required to translate findings into clinical implications. In particular, longitudinal clinical research that follows patients across age, ideally using many data-collection time-points, could extend the current findings, and test whether insights into domain links and centrality provide clinical benefit, as well as identify causal dynamics among domains, potentially informing diagnosis and treatment (Fried et al., 2017). The advent of mobile technology facilitating collection of time-series symptom and behavioral data (Epskamp et al., 2018b), in combination with treatment trials, offers novel opportunities to test such clinical venues informed by network theory.
Several strengths of the study design should be noted. First, multi-site collaboration yielded a sample considerably larger and more heterogeneous than in previous work, thereby increasing statistical power and generalizability of findings. Second, longitudinal data allowed us to examine changes during key developmental periods. Third, anxiety networks were derived from symptom domain indices shown to: (1) be psychometrically robust across international samples (Hale et al., 2011) and (2) map onto DSM diagnostic criteria (Birmaher et al., 1997, 1999; Hale et al., 2011), thereby meaningfully linking current classification systems with data on continuous symptom dimensions. Important limitations and future research considerations should also be noted, relating primarily to challenges in combining multi-site data. First, multi-site data create a nested structure which optimally should be analyzed using multi-level analytic approaches. To the best of our knowledge, no such established approaches are available for network analysis; thus, we attempted to diminish site confounds by conducting analyses on data that regress out variance explained by sites. Developing multi-level analytic approaches would greatly benefit the field by directly addressing this need, particularly as multi-site collaborations are becoming more common. Second, sites studied different populations and used similar but not always identical inclusion/exclusion criteria; this may have led to additional heterogeneity. Third, comparing network models of healthy and anxious participants may potentially introduce Berkson’s bias; however, as diagnostic status was not derived from symptom data used in modeling, we expect this bias to be negligible. Finally, measurement across sites of additional, related psychopathology (e.g. depressive symptoms) would have enabled us to control for co-occurring psychopathology in analyses.
In conclusion, in the current report we use a network analytic approach in a large, heterogeneous sample to demonstrate that pediatric anxiety symptoms manifest along multiple, inter-connected domains. By quantifying the anxiety symptom network structure, this approach provides novel insights into normative and pathological pediatric anxiety across development and sex. These insights inform our clinical conceptualization of pediatric anxiety and can guide continuing efforts to improve diagnostic accuracy and treatment.
Supplementary Material
Acknowledgements.
We would like to thank Gisele Manfro, Leone de Voogd, Brigid Behrens, Caroline Swetlitz, Payton Jones, for their valuable contributions.
Financial support.
This research was supported (in part) by the NIMH Intramural Research Program (DSP; ZIAMH002781-15, NCT00018057), and NIH grants R01 MH094633 (KPE), R34 MH097931 (JWP), and UH2 MH101470 (JWP); the Netherlands Organisation for Health Research and Development, ZonMW (RWW, ES; grant number 200210010).
Footnotes
Supplementary material. The supplementary material for this article can be found at https://doi.org/10.1017/S0033291720000501.
Conflict of interest. None.
Ethical standards. The authors assert that all procedures contributing to this work comply with the ethical standards of the relevant national and institutional committees on human experimentation and with the Helsinki Declaration of 1975, as revised in 2008.
In the manuscript, we use the term ‘symptom domain’ to reflect a dimensional continuum indexing the severity of symptoms of a specific pediatric anxiety disorder. For example, we refer to ‘social anxiety’ as a dimensional domain featuring low to high severity of aggregated symptoms that together characterize social anxiety, rather than a categorical diagnosis.
The notes appear after the main text.
References
- American Psychiatric Association. (2013). Diagnostic and statistical manual of mental disorders (5th ed.). Arlington, VA: American Psychiatric Association. [Google Scholar]
- Angold A, Costello EJ, & Erkanli A (1999). Comorbidity. Journal of Child Psychology and Psychiatry, and Allied Disciplines, 40(1), 57–87. Retrieved from https://www.ncbi.nlm.nih.gov/pubmed/10102726. [PubMed] [Google Scholar]
- Angold A, Costello EJ, Farmer EMZ, Burns BJ, & Erkanli A (1999). Impaired but undiagnosed. Journal of the American Academy of Child and Adolescent Psychiatry, 38(2), 129–137. doi: 10.1097/00004583-199902000-00011. [DOI] [PubMed] [Google Scholar]
- Barlow DH (2002). Anxiety and its disorders: The nature and treatment of anxiety and panic. New York: The Guilford Press. [Google Scholar]
- Beesdo K, Knappe S, & Pine DS (2009). Anxiety and anxiety disorders in children and adolescents: Developmental issues and implications for DSM-V. Psychiatric Clinics of North America, 32(3), 483–524. doi: 10.1016/j.psc.2009.06.002. [DOI] [PMC free article] [PubMed] [Google Scholar]
- Behrens B, Swetlitz C, Pine DS, & Pagliaccio D (2018). The screen for child anxiety related emotional disorders (SCARED): Informant discrepancy, measurement invariance, and test-retest reliability. Child Psychiatry & Human Development, 50, 473–482. doi: 10.1007/s10578-018-0854-0. [DOI] [PMC free article] [PubMed] [Google Scholar]
- Birmaher B, Brent DA, Chiappetta L, Bridge J, Monga S, & Baugher M (1999). Psychometric properties of the Screen for Child Anxiety Related Emotional Disorders (SCARED): A replication study. Journal of the American Academy of Child and Adolescent Psychiatry, 38(10), 1230–1236. doi: 10.1097/00004583-199910000-00011. [DOI] [PubMed] [Google Scholar]
- Birmaher B, Khetarpal S, Brent D, Cully M, Balach L, Kaufman J, & Neer SM (1997). The screen for child anxiety related emotional disorders (SCARED): Scale construction and psychometric characteristics. Journal of the American Academy of Child and Adolescent Psychiatry, 36(4), 545–553. doi: 10.1097/00004583-199704000-00018. [DOI] [PubMed] [Google Scholar]
- Borsboom D (2017). A network theory of mental disorders. World Psychiatry, 16(1), 5–13. doi: 10.1002/wps.20375. [DOI] [PMC free article] [PubMed] [Google Scholar]
- Borsboom D, & Cramer AO (2013). Network analysis: An integrative approach to the structure of psychopathology. Annual Review of Clinical Psychology, 9, 91–121. doi: 10.1146/annurev-clinpsy-050212-185608. [DOI] [PubMed] [Google Scholar]
- Boschloo L, Schoevers RA, van Borkulo CD, Borsboom D, & Oldehinkel AJ (2016). The network structure of psychopathology in a community sample of preadolescents. Journal of Abnormal Psychology, 125(4), 599–606. doi: 10.1037/abn0000150. [DOI] [PubMed] [Google Scholar]
- Bringmann LF, Vissers N, Wichers M, Geschwind N, Kuppens P, Peeters F, … Tuerlinckx F (2013). A network approach to psychopathology: New insights into clinical longitudinal data. PLoS One, 8(4), e60188. doi: 10.1371/journal.pone.0060188. [DOI] [PMC free article] [PubMed] [Google Scholar]
- Caspi A, & Moffitt TE (2018). All for one and one for all: Mental disorders in one dimension. American Journal of Psychiatry, 175(9), 831–844. doi: 10.1176/appi.ajp.2018.17121383. [DOI] [PMC free article] [PubMed] [Google Scholar]
- Contreras A, Nieto I, Valiente C, Espinosa R, & Vazquez C (2019). The study of psychopathology from the network analysis perspective: A systematic review. Psychotherapy and Psychosomatics, 88(2), 71–83. doi: 10.1159/000497425. [DOI] [PubMed] [Google Scholar]
- Costello EJ, Copeland W, & Angold A (2011). Trends in psychopathology across the adolescent years: What changes when children become adolescents, and when adolescents become adults? Journal of Child Psychology and Psychiatry, 52(10), 1015–1025. doi: 10.1111/j.1469-7610.2011.02446.x. [DOI] [PMC free article] [PubMed] [Google Scholar]
- Costello EJ, Egger HL, Copeland W, Erkanli A, & Angold A (2011). The developmental epidemiology of anxiety disorders: Phenomenology, prevalence, and comorbidity. In Field AP & Silverman WK (Eds), Anxiety disorders in children and adolescents (pp. 56–75). Cambridge: Cambridge University Press. [Google Scholar]
- Cramer AOJ, Waldorp LJ, van der Maas HLJ, & Borsboom D (2010). Comorbidity: A network perspective. Behavioral and Brain Sciences, 33(2–3), 137. doi: 10.1017/S0140525x09991567. [DOI] [PubMed] [Google Scholar]
- Craske MG (1999). Anxiety disorders: Psychological approaches to theory and treatment. Boulder, CO: Westview Press. [Google Scholar]
- Cummings CM, Caporino NE, & Kendall PC (2014). Comorbidity of anxiety and depression in children and adolescents: 20 years after. Psychological Bulletin, 140(3), 816–845. doi: 10.1037/a0034733. [DOI] [PMC free article] [PubMed] [Google Scholar]
- Cuthbert BN, & Insel TR (2013). Toward the future of psychiatric diagnosis: The seven pillars of RDoC. BMC Medicine, 11, 126. doi: 10.1186/1741-7015-11-126. [DOI] [PMC free article] [PubMed] [Google Scholar]
- De Los Reyes A, & Kazdin AE (2005). Informant discrepancies in the assessment of childhood psychopathology: A critical review, theoretical framework, and recommendations for further study. Psychological Bulletin, 131(4), 483–509. doi: 10.1037/0033-2909.131.4.483. [DOI] [PubMed] [Google Scholar]
- Epskamp S, Borsboom D, & Fried EI (2018a). Estimating psychological networks and their accuracy: A tutorial paper. Behavior Research Methods, 50(1), 195–212. [DOI] [PMC free article] [PubMed] [Google Scholar]
- Epskamp S, Cramer AO, Waldorp LJ, Schmittmann VD, & Borsboom D (2012). Qgraph: Network visualizations of relationships in psychometric data. Journal of Statistical Software, 48(4), 1–18. [Google Scholar]
- Epskamp S, van Borkulo CD, van der Veen DC, Servaas MN, Isvoranu AM, Riese H, & Cramer AOJ (2018b). Personalized network modeling in psychopathology: The importance of contemporaneous and temporal connections. Clinical Psychological Science, 6(3), 416–427. doi: 10.1177/2167702617744325. [DOI] [PMC free article] [PubMed] [Google Scholar]
- Fanselow MS, Lester LS, Bolles RC, & Beecher MD (1988). A functional behavioristic approach to aversively motivated behavior: Predatory imminence as a determinant of the topography of defensive behavior. In Beecher RCBMD (Ed.), Evolution and learning (pp. 185–212). Hillsdale, NJ: Lawrence Erlbaum Associates, Inc. [Google Scholar]
- Fried EI, & Cramer AOJ (2017). Moving forward: Challenges and directions for psychopathological network theory and methodology. Perspectives on Psychological Science, 12(6), 999–1020. doi: 10.1177/1745691617705892. [DOI] [PubMed] [Google Scholar]
- Fried EI, Eidhof MB, Palic S, Costantini G, Huisman-van Dijk HM, Bockting CLH, … Karstoft KI (2018). Replicability and generalizability of posttraumatic stress disorder (PTSD) networks: A cross-cultural multisite study of PTSD symptoms in four trauma patient samples. Clinical Psychological Science, 6(3), 335–351. doi: 10.1177/2167702617745092. [DOI] [PMC free article] [PubMed] [Google Scholar]
- Fried EI, Epskamp S, Nesse RM, Tuerlinckx F, & Borsboom D (2016). What are ‘good’ depression symptoms? Comparing the centrality of DSM and non-DSM symptoms of depression in a network analysis. Journal of Affective Disorders, 189, 314–320. doi: 10.1016/j.jad.2015.09.005. [DOI] [PubMed] [Google Scholar]
- Fried EI, van Borkulo CD, Cramer AOJ, Boschloo L, Schoevers RA, & Borsboom D (2017). Mental disorders as networks of problems: A review of recent insights. Social Psychiatry and Psychiatric Epidemiology, 52(1), 1–10. doi: 10.1007/s00127-016-1319-z. [DOI] [PMC free article] [PubMed] [Google Scholar]
- Greenberg PE, Sisitsky T, Kessler RC, Finkelstein SN, Berndt ER, Davidson JRT, … Fyer AJ (1999). The economic burden of anxiety disorders in the 1990s. Journal of Clinical Psychiatry, 60(7), 427–435. Retrieved from <Go to ISI>://000081945200002. [DOI] [PubMed] [Google Scholar]
- Hale WW 3rd, Crocetti E, Raaijmakers QA, & Meeus WH (2011). A meta-analysis of the cross-cultural psychometric properties of the Screen for Child Anxiety Related Emotional Disorders (SCARED). Journal of Child Psychology and Psychiatry, 52(1), 80–90. doi: 10.1111/j.1469-7610.2010.02285.x. [DOI] [PubMed] [Google Scholar]
- Hale WW 3rd, Raaijmakers Q, Muris P, van Hoof A, & Meeus W (2008). Developmental trajectories of adolescent anxiety disorder symptoms: A 5-year prospective community study. Journal of the American Academy of Child and Adolescent Psychiatry, 47(5), 556–564. doi: 10.1097/CHI.0b013e3181676583. [DOI] [PubMed] [Google Scholar]
- Hammerness P, Harpold T, Petty C, Menard C, Zar-Kessler C, & Biederman J (2008). Characterizing non-OCD anxiety disorders in psychiatrically referred children and adolescents. Journal of Affective Disorders, 105(1–3), 213–219. doi: 10.1016/j.jad.2007.05.012. [DOI] [PubMed] [Google Scholar]
- Heeren A, Bernstein EE, & McNally RJ (2018). Deconstructing trait anxiety: A network perspective. Anxiety Stress and Coping, 31(3), 262–276. doi: 10.1080/10615806.2018.1439263. [DOI] [PubMed] [Google Scholar]
- Hofmann SG, Curtiss J, & McNally RJ (2016). A complex network perspective on clinical science. Perspectives on Psychological Science, 11(5), 597–605. doi: 10.1177/1745691616639283. [DOI] [PMC free article] [PubMed] [Google Scholar]
- Hofmann SG, & Hayes SC (2019). The future of intervention science: Process-based therapy. Clinical Psychological Science, 7(1), 37–50. doi: 10.1177/2167702618772296. [DOI] [PMC free article] [PubMed] [Google Scholar]
- Jones PJ, Mair P, Riemann BC, Mugno BL, & McNally RJ (2018). A network perspective on comorbid depression in adolescents with obsessive-compulsive disorder. Journal of Anxiety Disorders, 53, 1–8. doi: 10.1016/j.janxdis.2017.09.008. [DOI] [PubMed] [Google Scholar]
- Keeton CP, Kolos AC, & Walkup JT (2009). Pediatric generalized anxiety disorder: Epidemiology, diagnosis, and management. Pediatric Drugs, 11(3), 171–183. doi: 10.2165/00148581-200911030-00003. [DOI] [PubMed] [Google Scholar]
- Kessler RC, & Wang PS (2008). The descriptive epidemiology of commonly occurring mental disorders in the United States. Annual Review of Public Health, 29, 115–129. doi: 10.1146/annurev.publhealth.29.020907.090847. [DOI] [PubMed] [Google Scholar]
- Kotov R, Krueger RF, Watson D, Achenbach TM, Althoff RR, Bagby RM, … Zimmerman M (2017). The Hierarchical Taxonomy of Psychopathology (HiTOP): A dimensional alternative to traditional nosologies. Journal of Abnormal Psychology, 126(4), 454–477. doi: 10.1037/abn0000258. [DOI] [PubMed] [Google Scholar]
- Krueger RF (1999). The structure of common mental disorders. Archives of General Psychiatry, 56(10), 921–926. Retrieved from https://www.ncbi.nlm.nih.gov/pubmed/10530634. [DOI] [PubMed] [Google Scholar]
- Lahey BB, Van Hulle CA, Singh AL, Waldman ID, & Rathouz PJ (2011). Higher-order genetic and environmental structure of prevalent forms of child and adolescent psychopathology. Archives of General Psychiatry, 68(2), 181–189. doi: 10.1001/archgenpsychiatry.2010.192. [DOI] [PMC free article] [PubMed] [Google Scholar]
- Lebowitz ER, Leckman JF, Silverman WK, & Feldman R (2016). Cross-generational influences on childhood anxiety disorders: Pathways and mechanisms. Journal of Neural Transmission, 123(9), 1053–1067. doi: 10.1007/s00702-016-1565-y. [DOI] [PMC free article] [PubMed] [Google Scholar]
- McElroy E, Fearon P, Belsky J, Fonagy P, & Patalay P (2018). Networks of depression and anxiety symptoms across development. Journal of the American Academy of Child & Adolescent Psychiatry, 57(12), 964–973. doi: 10.1016/j.jaac.2018.05.027. [DOI] [PMC free article] [PubMed] [Google Scholar]
- McNally RJ, Robinaugh DJ, Wu GWY, Wang L, Deserno MK, & Borsboom D (2015). Mental disorders as causal systems: A network approach to posttraumatic stress disorder. Clinical Psychological Science, 3(6), 836–849. doi: 10.1177/2167702614553230. [DOI] [Google Scholar]
- Merikangas KR, & Swanson S (2010). Comorbidity in anxiety disorders. In Stein MB & Steckler T (Eds.), Behavioral neurobiology of anxiety and its treatment (pp. 37–59). Heidelberg; New York: Springer-Verlag Berlin Heidelberg. [Google Scholar]
- Nook EC, Sasse SF, Lambert HK, McLaughlin KA, & Somerville LH (2017). Increasing verbal knowledge mediates development of multidimensional emotion representations. Nature Human Behaviour, 1(12), 881–889. doi: 10.1038/s41562-017-0238-7. [DOI] [PMC free article] [PubMed] [Google Scholar]
- Rapee RM, Schniering CA, & Hudson JL (2009). Anxiety disorders during childhood and adolescence: Origins and treatment. Annual Review of Clinical Psychology, 5, 311–341. doi: 10.1146/annurev.clinpsy.032408.153628. [DOI] [PubMed] [Google Scholar]
- Robinaugh DJ, Millner AJ, & McNally RJ (2016). Identifying highly influential nodes in the complicated grief network. Journal of Abnormal Psychology, 125(6), 747–757. doi: 10.1037/abn0000181. [DOI] [PMC free article] [PubMed] [Google Scholar]
- Rodebaugh TL, Tonge NA, Piccirillo ML, Fried E, Horenstein A, Morrison AS, … Heimberg RG (2018). Does centrality in a cross-sectional network suggest intervention targets for social anxiety disorder? Journal of Consulting and Clinical Psychology, 86(10), 831–844. doi: 10.1037/ccp0000336. [DOI] [PMC free article] [PubMed] [Google Scholar]
- Rouquette A, Pingault JB, Fried EI, Orri M, Falissard B, Kossakowski JJ, … Borsboom D (2018). Emotional and behavioral symptom network structure in elementary school girls and association with anxiety disorders and depression in adolescence and early adulthood a network analysis. JAMA Psychiatry, 75(11), 1173–1181. doi: 10.1001/jamapsychiatry.2018.2119. [DOI] [PMC free article] [PubMed] [Google Scholar]
- RUPP. (2001). Fluvoxamine for the treatment of anxiety disorders in children and adolescents. The research unit on pediatric psychopharmacology anxiety study group. New England Journal of Medicine, 344(17), 1279–1285. doi: 10.1056/NEJM200104263441703. [DOI] [PubMed] [Google Scholar]
- Rutter M (2011). Research review: Child psychiatric diagnosis and classification: Concepts, findings, challenges and potential. Journal of Child Psychology and Psychiatry, 52(6), 647–660. doi: 10.1111/j.1469-7610.2011.02367.x. [DOI] [PubMed] [Google Scholar]
- Shear MK, Bjelland I, Beesdo K, Gloster AT, & Wittchen HU (2007). Supplementary dimensional assessment in anxiety disorders. International Journal of Methods in Psychiatric Research, 16(Suppl 1), S52–S64. doi: 10.1002/mpr.215. [DOI] [PMC free article] [PubMed] [Google Scholar]
- Smidt KE, & Suvak MK (2015). A brief, but nuanced, review of emotional granularity and emotion differentiation research. Current Opinion in Psychology, 3, 48–51. doi: 10.1016/j.copsyc.2015.02.007. [DOI] [Google Scholar]
- Stein DJ, Scott KM, de Jonge P, & Kessler RC (2017). Epidemiology of anxiety disorders: From surveys to nosology and back. Dialogues in Clinical Neuroscience, 19(2), 127–136. Retrieved from https://www.ncbi.nlm.nih.gov/pubmed/28867937. [DOI] [PMC free article] [PubMed] [Google Scholar]
- Van Borkulo CD (2016). NetworkComparisonTest. Retrieved from http://cran.r-project.org/web/packages/NetworkComparisonTest/NetworkComparisonTest.pdf.
- van Borkulo CD, Boschloo L, Borsboom D, Penninx BWJH, Waldorp LJ, & Schoevers RA (2015). Association of symptom network structure with the course of longitudinal depression. JAMA Psychiatry, 72(12), 1219–1226. doi: 10.1001/jamapsychiatry.2015.2079. [DOI] [PubMed] [Google Scholar]
- Van Oort FV, Greaves-Lord K, Verhulst FC, Ormel J, & Huizink AC (2009). The developmental course of anxiety symptoms during adolescence: The TRAILS study. Journal of Child Psychology and Psychiatry, 50(10), 1209–1217. doi: 10.1111/j.1469-7610.2009.02092.x. [DOI] [PubMed] [Google Scholar]
- Weisz JR, Chorpita BF, Palinkas LA, Schoenwald SK, Miranda J, Bearman SK, … Mental RNY (2012). Testing standard and modular designs for psychotherapy treating depression, anxiety, and conduct problems in youth. Archives of General Psychiatry, 69(3), 274–282. doi: 10.1001/archgenpsychiatry.2011.147. [DOI] [PubMed] [Google Scholar]
- Wittchen H-U, Lecrubier Y, Beesdo K, & Nocon A (2003). Relationships among anxiety disorders: Patterns and implications. In Nutt DJ & Ballenger JC (Eds.), Anxiety disorders (pp. 25–37). Oxford: Blackwell Science. [Google Scholar]
Associated Data
This section collects any data citations, data availability statements, or supplementary materials included in this article.