

Abstract
Background:
Physicians often receive lower payments for dual-eligible Medicare-Medicaid beneficiaries vs. non-dual Medicare beneficiaries because of state reimbursement caps. The Affordable Care Act (ACA) primary care fee bump temporarily eliminated this differential in 2013–2014.
Objective:
To examine how dual payment policy impacts primary care physicians’ (PCP) acceptance of duals.
Research Design:
We assessed differences in the likelihood that PCPs had dual caseloads of ≥10% or 20% in states with lower vs. full dual reimbursement using linear probability models adjusted for physician and area-level traits. Using a triple-difference approach, we examined changes in dual caseloads for PCPs vs. a control group of specialists in states with fee bumps vs. no change during years post-bump vs. pre-bump.
Subjects:
PCPs and specialists (cardiologists, orthopedic surgeons, general surgeons) that billed fee-for-service Medicare
Measures:
State dual payment policies and physicians’ dual caseloads as a percentage of their Medicare patients
Results:
In 2012, 81% of PCPs had dual caseloads of ≥10% and this was less likely among PCPs in states with lower vs. full dual reimbursement (e.g., difference=−4.52 percentage points (95% CI: −6.80 to −2.25)). The proportion of PCPs with dual caseloads of ≥10% or 20% decreased significantly between 2012–2017 and the fee bump was not consistently associated with increases in dual caseloads.
Conclusions:
Pre-ACA, PCPs’ participation in the dual program appeared to be lower in states with lower reimbursement for duals. Despite the ACA fee bump, dual caseloads declined over time, raising concerns of worsening access to care.
Keywords: Medicare payment, dual-eligibles, primary care
Introduction
Dual-eligible Medicare-Medicaid enrollees comprise about 20% of all Medicare enrollees, but account for over one-third of Medicare spending.1 Duals are among the most vulnerable beneficiaries in both programs; however, in many states, providers receive lower fees for treating duals vs. non-dual Medicare beneficiaries because of Medicaid reimbursement caps.
For duals, Medicare is the primary payer for outpatient and inpatient services, and prescription drugs. State Medicaid programs provide coverage for Medicare premiums, and depending on beneficiaries’ eligibility, may also cover Medicare cost-sharing and additional services not covered by Medicare. The wrap-around Medicaid coverage for Traditional Medicare’s cost-sharing is intended to reduce financial barriers to care for low-income beneficiaries. Many states, however, cap provider reimbursements at the lesser of Medicare or Medicaid fees; 38 states and D.C. had such policies in 2015.2 Since Medicaid fees are often substantially lower than Medicare, providers in these states typically receive no reimbursement for the 20% coinsurance portion of the Medicare fee. For example, in states with Medicaid-to-Medicare fees ratios less than 80% and lesser-of reimbursement policies, providers receive only 80% of the Medicare fee for the same service provided to dual vs. non-dual beneficiaries. There is wide variation in state Medicaid-to-Medicare fee ratios; the average in 2016 for primary care services was 66%.3
Although low fees have been cited as a major barrier to physician participation in Medicaid, there is less evidence on the impact of provider payment differentials on duals.4–7 A study following the Balanced Budget Act of 1997, which clarified that states could use lesser-of reimbursement policies, found that duals in states that maintained higher payments had greater likelihood of having outpatient visits.8 In more recent cross-sectional comparisons across states, reimbursement generosity was associated with higher likelihood of duals having office visits versus non-duals.2,9 Whether these differences in utilization are related to providers’ willingness to treat dual patients remains unknown, although qualitative reports suggest that duals have difficulty finding providers who will accept them, which leads to difficulty obtaining needed care.8,10 The impact of fees on provider participation could be influenced by other factors, including the local supply of providers relative to demand, fees for duals versus payments for patients with other insurance types, and the administrative or implementation barriers associated with receiving payments.11–13
The Affordable Care Act (ACA) included a primary care fee bump that raised Medicaid fees to that of Medicare in 2013–2014. This policy also increased payments to primary care physicians (PCPs) caring for duals in states with lesser-of reimbursement policies and low Medicaid-to-Medicare fee ratios to the full Medicare fee and serves as a natural experiment to examine the impact of eliminating payment differentials for duals on PCPs’ dual caseloads. Existing evidence on the impact of this fee bump on Medicaid-only enrollees is mixed, and no studies have focused on its impact on duals.14–16
In this study, we used Medicare data to examine the association between state reimbursement policies for duals, physicians’ Medicare panel compositions of duals and non-dual beneficiaries, and whether there were changes over time associated with the ACA fee bump. We hypothesized that PCPs in states with lower vs. full dual payments at baseline would have lower dual caseloads, and that dual caseloads would increase for PCPs in states with fee bumps vs. no change.
Methods
Data Sources and Study Population
The main data source for this study is all available years (2012–2017) of the Medicare Physician and Other Supplier Public Use Files (PUF), which are based on 100% final-action physician-supplier Part B non-institutional claim line items for the Traditional Medicare (TM) fee-for-service population.17 These files provide information at the provider-level for all providers who billed for at least ten TM beneficiaries during the year, including their National Provider Identification (NPI) number, and the number of and characteristics of their Medicare patients. These files also include each provider’s Medicare specialty code, gender, practice location, and the number of unique beneficiaries by duals and non-dual status.
These files are well-suited for studying physician behavior as they provide detailed information for nearly all providers who billed Medicare and the traits of their Medicare patients based on 100% claims files, whereas most requests for beneficiary-level Medicare data are restricted to smaller samples such as 5% or 20% samples or specific groups of beneficiaries. Comprehensive provider data is especially important for identifying which and how many physicians provide care to specific subpopulations, such as duals, who could comprise a small proportion of many physicians’ Medicare panels.
We focused on PCPs identified using the Medicare specialty code in the PUF and the primary taxonomy code in the NPI Registry (e.g., Internal Medicine, Family Practice, or General Practice, see Supplemental Digital Content eTable 1 for a detailed list of the codes included). We compared PCPs with a control group of specialist physicians comprised of three large specialties that were unaffected by the ACA fee bump: cardiologists, orthopedic surgeons, and general surgeons (“Specialists”), also based on Medicare specialty code and corresponding NPI primary taxonomy code. We chose these three large specialist groups because they had dual caseloads that were more comparable to PCPs at baseline compared with other specialists (e.g., psychiatrists, dermatologists). The Mass General Brigham Institutional Review Board approved this study.
Exposure: State dual reimbursement policies
We grouped physicians by the state dual reimbursement policies of their practice locations. We classified 28 states as having lower reimbursements for duals (i.e., Medicaid-to-Medicare fee ratios <90% in 2012 combined with a lesser-of dual reimbursement policy) with a temporary fee bump in 2013–2014 (Supplemental Digital Content eTable 2, which summarizes the relevant state Medicaid payment policies). We classified six states as having lower reimbursement for duals with extended fee bumps, meaning that they extended the fee bump using state funds after 2014. Lastly, we classified 16 states as having minimal differentials in reimbursement for duals throughout the study period because the state had Medicaid-to-Medicare fee ratios in 2012 of 90% or greater, or a dual reimbursement policy that paid providers the full Medicare coinsurance.
Outcome measure: dual caseload
We examined each physician’s dual caseload by year calculated as the proportion of a physician’s TM patients that were duals; in the PUF beneficiaries are classified as duals if they received full or partial Medicaid benefits for any month in a given calendar year. The ACA Medicaid expansion does not apply to those eligible for Medicare and nationally the proportion of Medicare beneficiaries who were duals was steady over the study period (19.7% of Medicare beneficiaries in 2012 and 19.5% in 2017). Based on this national average, we examined the likelihood that physicians had dual caseloads of at least 20%, and as a lower measure of participation in the dual program, caseloads of at least 10%. We focused on dichotomous measures of dual caseloads because CMS suppresses the exact number of dual and non-dual beneficiaries if either value is ten or fewer beneficiaries.17 Because data were more likely to be suppressed due to small numbers of duals, in our main analyses we assumed that providers with suppressed counts had ten dual beneficiaries when calculating caseloads. To check this assumption, we linked these NPIs with Medicare claims data for a 50% sample of dual beneficiaries; the mean number of duals with claims in 2012 for PCPs with suppressed data in the PUF file was 6.3 in 2012 and 5.8 in 2016. In sensitivity analyses, we conducted parallel analyses restricted to providers with non-suppressed data and examined dual caseload as a continuous outcome measure.
Analyses
To examine differences in the likelihood of physicians having dual caseloads of at least 10% or 20% in states with lower reimbursement for duals with temporary or extended fee bumps vs. minimal reimbursement differentials, we used linear probability models with physician random effects, separately for PCPs and specialists. We adjusted for other physician, market area, and state-level policy changes that could influence physicians’ likelihood of treating duals; we updated time-changing variables annually.
Physician-level traits include gender, subspecialty, and quartiles of TM panel size, medical school graduation year (1986–1995, 1996–2005, 2005+ vs. 1985 and earlier), hospital affiliations (0, 1 vs. 2+), and practice size (10–100, 100+ vs. <10); we included missing indicators for traits from the Physician Compare files and updated hospital affiliations and practice size annually. To characterize market area traits, we linked physicians to counties using their practice location ZIP code and adjusted for the annual county-level percentage of Medicare beneficiaries that were duals and Medicare Advantage penetration using CMS data,18–20 and the per capita number of PCPs or specialists (i.e., number of physicians in the PUF file per 1,000 TM beneficiaries). We used Rural-Urban Continuum (RUC) codes from the US Department of Agriculture to classify counties as metropolitan (codes 1–3) or non-metropolitan (4–9).21 Lastly, we included annual indicators for state policies concerning Medicaid or duals, including whether states expanded Medicaid and participated in a dual demonstration program (which moved duals from TM to capitated Medicare Advantage plans if they did not opt out).22 We included year indicators to control for secular trends, and clustered standard errors by state. We calculated the adjusted percentages of PCPs and specialists that had dual caseloads of at least 10% or 20% in each year with 95% confidence intervals (CI) by state group using the margins command in Stata v14.
To examine whether the fee bump was associated with changes in PCPs’ dual caseloads, we used a triple-difference approach to compare PCPs vs. specialists (unaffected by the fee bump) living in states with temporary or extended vs. no fee change in years during or after the fee bump (2013–2017) vs. before the fee bump (2012); we did not have data prior to 2012 to evaluate pre-policy trends. We used linear probability models with provider-level fixed effects to account for time invariant differences and adjusted for annually time-changing measures of the provider and market area traits described above. Using a simplified two state group, two time period illustration, our analytic model was as follows:
where i indexes individual providers; t indexes time; P is an indicator for physician specialty being PCP (vs. specialist); G is an indicator for state group (vs. states with minimal reimbursement differentials); T is an indicator for time period (vs. pre-policy year, 2012); ci is a physician fixed effect, and uit is a normally distributed error term. The main coefficient of interest is B7 (i.e., triple interaction between P, G, and T). In the actual models, we had three state groups and five time periods corresponding to each year 2012–2017.
Results
In 2012, there were 147,376 PCPs and 51,583 specialists that billed for at least ten TM beneficiaries (Figure 1); this grew by 8% for PCPs and 5% for specialists by 2017. The number of PCPs and specialists per 1,000 TM beneficiaries was constant over time (between 4.1–4.2 PCPs/1,000 and 1.4 specialists per 1,000). This trend was similar across the state groups classified by dual reimbursement policies (see Supplemental Digital Content eFigure 1, which shows the number of PCPs and Specialists per 1,000 TM beneficiaries over time by state group). The mean percentage of Medicare beneficiaries that were duals varied by state group but remained relatively stable over time (see Supplemental Digital Content eFigure 2, which shows the percentage of Medicare beneficiaries that are duals over time by state group). In 2012, 15.0% of PCPs and 7.4% of specialists had suppressed data on the number of duals and non-duals, meaning they treated fewer than 10 beneficiaries in either group. This grew to 17.3% (PCPs) and 8.4% (specialists) in 2017 (see Supplemental Digital Content eTable 3, which summarizes Medicare panel data for PCPs and specialists).
Figure 1.
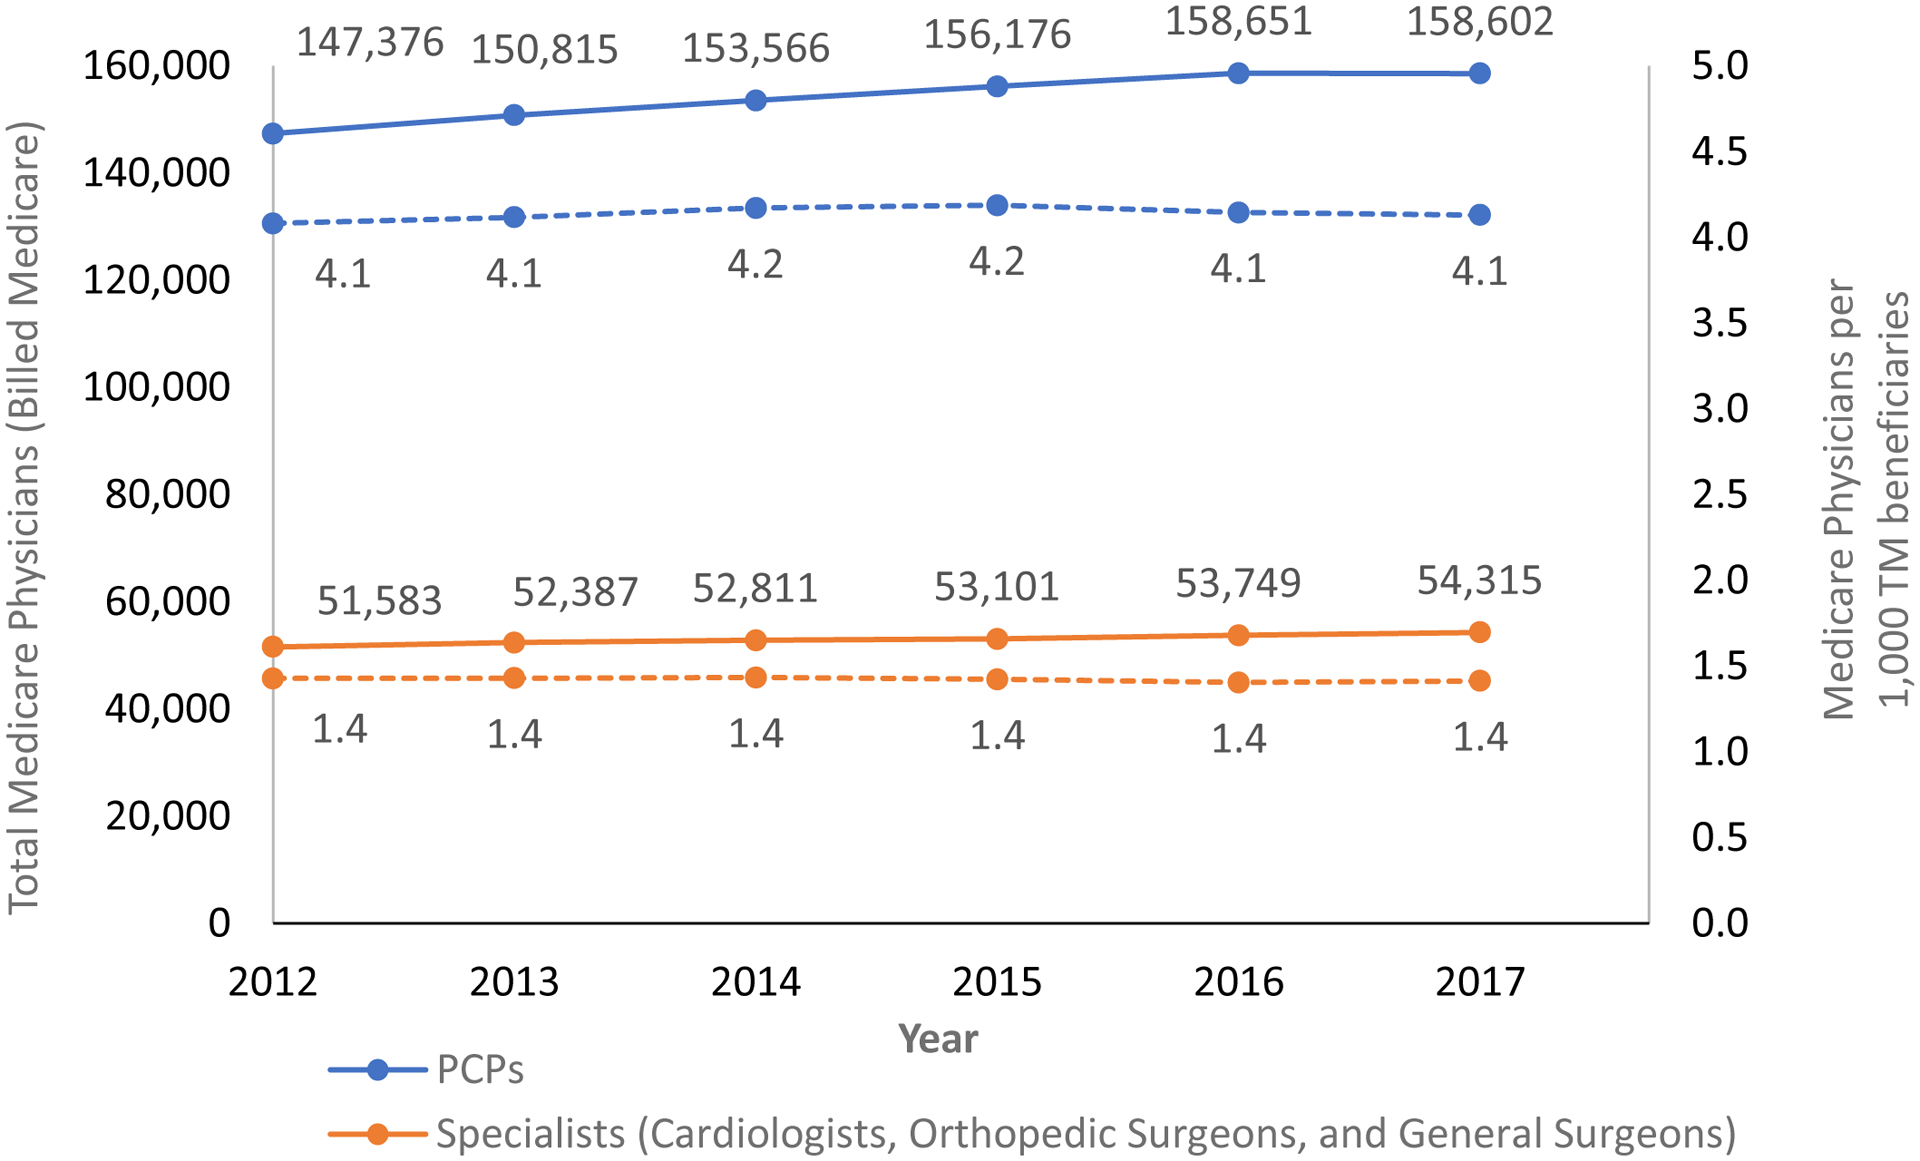
Number of Physicians that Billed Medicare Overall and Per 1,000 Traditional Medicare Beneficiaries by Specialty.
Note: Solid lines represent the total number of physicians in each group who billed Medicare per year for more than 10 unique beneficiaries; dotted lines represent the number of physicians who billed Medicare per year per 1,000 TM Medicare beneficiaries.
Pre-ACA dual caseloads
In 2012, 81% of PCPs and 88% of specialists had dual caseloads that were 10% or more of their TM patients (unadjusted, Table 1); 59% of PCPs and 55% of specialists had at least 20% duals. PCPs with dual caseloads of at least 10% were more likely to be female (37% vs. 30%), have graduated from medical school more recently (e.g., 30% vs. 19% between 1996–2005), be affiliated with larger practices (37% vs. 30% with practice size of 100+), and less likely to practice in metropolitan counties (85% vs. 95%, all p<0.001, Table 1).
Table 1:
Physician characteristics: overall and for those with dual caseloads above and below 10%
| Primary Care Physicians | Selected Specialists | |||||
|---|---|---|---|---|---|---|
| All | <10% duals | ≥10% duals | All | <10% duals | ≥10% duals | |
| N | 147,376 | 27,551 | 119,825 | 51,583 | 6,234 | 45,349 |
| Physician Gender: Female | 36% | 30% | 37% | 10% | 9% | 11% |
| Medical School Graduation Year | ||||||
| 1985 and earlier | 31% | 43% | 29% | 41% | 53% | 39% |
| 1986 to 1995 | 26% | 30% | 26% | 27% | 27% | 27% |
| 1996 to 2005 | 28% | 19% | 30% | 25% | 14% | 26% |
| After 2005 | 7% | 3% | 9% | 3% | 1% | 3% |
| Missing | 7% | 5% | 8% | 5% | 5% | 5% |
| Subspecialty | ||||||
| Family Practice | 51% | 49% | 51% | -- | -- | -- |
| Internal Medicine | 47% | 49% | 47% | -- | -- | -- |
| General Practice | 2% | 1% | 2% | -- | -- | -- |
| Cardiology | -- | -- | -- | 44% | 40% | 45% |
| Orthopedic Surgery | -- | -- | -- | 27% | 45% | 25% |
| General Surgery | -- | -- | -- | 28% | 15% | 30% |
| Hospital Affiliations a | ||||||
| 0 | 7% | 6% | 7% | 2% | 3% | 2% |
| 1 | 28% | 24% | 28% | 23% | 21% | 23% |
| 2+ | 58% | 65% | 57% | 71% | 71% | 70% |
| Practice Size a | ||||||
| <10 | 32% | 43% | 29% | 27% | 33% | 26% |
| 10 to 100 | 25% | 22% | 26% | 31% | 34% | 31% |
| 100+ | 36% | 30% | 37% | 37% | 28% | 39% |
| Physicians’ Medicare patient traits | ||||||
| Mean total TM beneficiaries (SD) | 308 (333) | 360 (389) | 296 (317) | 650 (722) | 644 (587) | 651 (738) |
| Mean percent duals (SD)b | 29.6 (21.2) | 5.9 (2.5) | 35.1 (19.9) | 25.9 (16.3) | 6.8 (2.4) | 28.5 (15.6) |
| Practice location county traits c | ||||||
| Metropolitan countyd | 87% | 95% | 85% | 90% | 97% | 89% |
| Mean % of beneficiaries in Medicare Advantage (SD) | 27.1 (14) | 25.9 (12.9) | 27.4 (14.2) | 26.9 (13.7) | 25.8 (12.7) | 27.0 (13.8) |
| Mean % of beneficiaries who are dual-eligible (SD) | 20.0 (8.5) | 17.2 (7) | 20.7 (8.7) | 20.5 (8.5) | 17.0 (7.4) | 21.0 (8.6) |
| State PCP dual payment policies | ||||||
| Lower dual reimbursement with temporary bump in 2013–2014 | 80% | 84% | 79% | 80% | 87% | 79% |
| Lower dual reimbursement with extended bump (2013–2017) | 6% | 6% | 6% | 6% | 4% | 7% |
| Minimal reimbursement differential (2012–2017) | 14% | 11% | 15% | 14% | 9% | 14% |
Notes: TM=Traditional Medicare; SD=standard deviation; p<0.001 for all differences between physicians with <10% vs. ≥10% duals except mean total TM beneficiaries for specialists (p = 0.1027); percentages may not sum to 100% due to rounding.
Percentages do not sum to 100% because of missing data; these characteristics were obtained from the Physician Compare files and have the same proportion missing as Medical School Graduation Year
Assumes those with suppressed data on the number of duals and non-duals have 10 dual patients
County linkages were missing for < 1% of providers; county-level measures are for providers with non-missing data only
Based on U.S. Department of Agriculture Rural-Urban Continuum Codes
Prior to the fee bump in 2012, physicians in states with lower reimbursement for duals (and temporary fee bumps in 2013–2014, 28 states) were less likely to have dual caseloads of 10% or greater (difference= −4.52 percentage points (pp), 95% CI [−6.80 to −2.25], Figure 2) and 20% or greater (see Supplemental Content eFigure 3) compared with PCPs in states with minimal reimbursement differentials (16 states), after adjusting for provider and area-level traits.
Figure 2. Adjusted Percentage of PCPs and Specialists with Dual Caseloads of at least 10%: 2012–2017.

Note: Percentages adjusted for provider gender, year of medical school graduation, number of hospital affiliations, practice size, subspecialty, TM panel size quartile, MA penetration by county, percent of Medicare enrollees in county who are duals, metro vs. non-metro county, state Medicaid expansion, state dual demonstration program; SEs clustered by state; physicians with suppressed dual/non-dual data were assumed to have 10 duals.
For all state groups, the proportion of PCPs and specialists with dual caseloads of at least 10% or 20% decreased over time. For example, in states with temporary fee increases the proportion of PCPs with at least 10% dual caseloads decreased from 83.1% [81.5% to 84.7%] in 2012 to 77.5% [75.3% to 79.6%] in 2017. Mean caseloads also decreased over time, although differences between states with higher vs. lower reimbursement were not significant (see Supplemental Digital Content eFigure 4, which shows mean dual caseloads overtime for PCPs and specialists).
Effects of the ACA PCP fee bump on dual caseloads
In triple difference models, we found modest, but significant increases in the likelihood that PCPs (eligible for fee bump) vs. specialists (ineligible for fee bump) had dual caseloads of at least 10% in most years of the fee bump and post-bump period (2014–2017) vs. pre-bump (2012) for physicians living in states with temporary or extended fee bumps vs. no change. For example, in 2014 vs. 2012 the proportion of PCPs vs. specialists who were dual providers living in states with temporary fee bumps increased by 0.77 pp [0.30–1.25] vs. states with minimal reimbursement differentials throughout (Table 2). Patterns were similar for PCPs in states with temporary and extended fee bumps, despite differences in the duration of the fee bump. However, there were no changes associated with the fee bump and having dual caseloads of at least 20% or changes in mean dual caseloads (see Supplemental Digital Content eTable 5, which includes model results for the sensitivity analyses).
Table 2.
Effects of the ACA PCP Fee Bump on PCPs’ Dual Caseloads: Triple Difference Estimates
| PCPs vs. Specialists in each year vs. 2012 | Change in likelihood of having dual caseload≥10% | Change in likelihood of having dual caseload≥20% | ||
|---|---|---|---|---|
| In states with temporary fee bumps (2013–2014) vs. no change | Difference (percentage points) |
95% CI | Difference (percentage points) |
95% CI |
| 2013 | 0.21 | (−0.40, 0.81) | 0.11 | (−1.08, 1.30) |
| 2014 | 0.77 | (0.30, 1.25) | 0.10 | (−1.27, 1.47) |
| 2015 | 0.78 | (0.14, 1.41) | −0.99 | (−3.48, 1.50) |
| 2016 | 0.86 | (−0.17, 1.88) | −1.83 | (−5.35, 1.68) |
| 2017 | 1.44 | (0.36, 2.52) | −1.10 | (−4.41, 2.22) |
| in states with extended fee bumps (2013–2017) vs. no change | Difference (percentage points) |
95% CI | Difference (percentage points) |
95% CI |
| 2013 | 0.51 | (−0.36, 1.39) | 0.14 | (−1.25, 1.53) |
| 2014 | 1.25 | (0.55, 1.94) | 1.18 | (−0.57, 2.94) |
| 2015 | 1.43 | (0.54, 2.32) | 0.15 | (−2.75, 3.04) |
| 2016 | 0.90 | (−0.18, 1.92) | −0.84 | (−4.79, 3.12) |
| 2017 | 2.30 | (0.94, 3.65) | −1.16 | (−5.67, 3.36) |
Notes: ACA = Patient Protection and Affordable Care Act; PCP = Primary care physician; CI = Confidence Interval. Linear regression models also adjusted for Medicare panel size quartile, providers’ county attributes (MA penetration, percent of Medicare enrollees who are duals, metro vs. non-metro area), state dual demonstration program, provider gender, medical school graduation year, group practice size, and number of hospital affiliations; models also include provider fixed effects and standard errors are clustered by state.
Discussion
We found that the per capita supply of PCPs that billed for TM beneficiaries was stable between 2012–2017, but about 1-in-5 PCPs had relatively small dual caseloads that comprised fewer than 10% of their Medicare patients. Prior to the ACA fee bumps in 2012, more generous reimbursement for duals at the state level was positively associated with PCPs having dual caseloads of at least 10% and physicians’ dual caseloads declined between 2012–2017, on average. The ACA PCP fee bump that increased PCPs’ reimbursement for duals was associated with small but significant increases in the proportion of PCPs with dual caseloads of at least 10%. But these associations were not consistently associated with the timing of the fee bump or other measures of dual caseload.
Our study adds to the limited body of evidence that examines the impact of payment differentials on access to care for dual vs. non-dual beneficiaries. Prior studies have focused on beneficiary utilization and found positive correlations between payment levels and use.9 Our findings complement these studies by examining the associations between provider payments and physicians’ dual caseloads, and suggest that differences in utilization could be mediated through physicians’ willingness to accept duals. Our study did not include measures of whether beneficiary access to physicians was adequate or whether those who continued to accept duals took up the slack. However, we did not find positive associations between the payment change and the proportion of providers with caseloads of 20% or more or continuous measures of dual caseload, which could reflect the possibility that dual providers were already at a ceiling in terms of their ability to accept new dual patients. These findings are consistent with a complementary beneficiary-level analysis that found declines in primary care physician visits for duals vs. non-duals over this time period.23 In combination with prior evidence on utilization and qualitative reports about duals having difficulty finding providers who will accept them, the temporal declines in physicians’ dual caseloads raise concerns about possible worsening access to care for duals. These trends could be exacerbated by increases in the number of states that cap dual reimbursement, which grew from 36 in 2004 to 42 in 2019.24
Similar to findings in the Medicaid program, we found that physicians with larger dual caseloads were more likely to be located in rural areas and live in states with higher fees for duals; dual caseloads were also lower, on average, for PCPs compared with the selected specialists included in this study.25 Many activities involved in managing and coordinating complex care that largely fall on primary care providers are not directly reimbursed under the fee-for-service system, which could exacerbate the impact of the payment differential within TM given the relative complexity of duals and potentially discourage physicians from accepting additional dual patients.26,27 Although CMS introduced new billing codes for transitional and chronic care management in 2013 and 2015, which could help address this gap, uptake of these codes has been limited and dual caseload trends declined even after the introduction of these codes.28,29
Findings on whether the ACA fee bump increased providers’ participation in Medicaid are mixed.14–16 We found inconsistent associations between the fee bump and PCPs’ dual caseloads. Contrary to our expectations, increases in dual caseloads were present in some years after 2014 in states that did not extend the fee increase during this time period, and the results were not robust to other dual caseload measures. There were numerous implementation delays and problems that could have blunted the effects of the fee bump in 2013.30 Medicaid and other ACA-related coverage expansions, such as Marketplace coverage, starting in 2014 could have also crowded-out PCP availability for duals if low-income patients seek care from similar physicians. However, if Medicaid expansion encouraged more providers to enroll as Medicaid providers, this could also ease administrative burdens for submitting cross-over Medicaid claims for dual patients. Prior studies have found that administrative burdens and payment delays are important predictors of physician participation in Medicaid.31 Efforts to reduce such burdens could increase providers’ willingness to accept duals, especially in states with more favorable reimbursement policies.12
This study was limited to physicians and beneficiaries participating in TM, though an increasing number of beneficiaries are participating in Medicare Advantage (MA) over time with larger increases among dual vs. non-dual beneficiaries (e.g., increases from 22% in 2012 to 35% and 27% to 32% in 2017, respectively).32 To account for this in our analyses, we adjusted for time-changing measures of county-level MA penetration among all beneficiaries (these data were not available specifically for duals), the proportion of Medicare beneficiaries that were duals, and whether states participated in dual demonstration programs. Whether there are differences in access to providers for duals vs. non-duals within MA is unknown. Although state Medicaid programs are also required to cover Medicaid cost-sharing for qualified duals in MA, the payment methodology between states, plans, and providers is variable and not well documented; it is possible that the generally lower cost-sharing requirements in MA could lessen dual vs. non-dual payment differentials.33
This analysis was limited to primary care physicians, although the supply of nurse practitioners (NPs) and physician assistants (PAs) is increasing rapidly, especially in low-income and rural areas.34 We focused on primary care physicians because of challenges identifying care provided by NPs and PAs in administrative claims (e.g., due to incident-to-billing). In addition, NPs and PAs were eligible for the fee bump only if working under the supervision of a primary care physician, thus visits with NPs and PAs affected by the fee bump could be more likely to be billed under a physicians’ identifier. However, the extent to which declines in dual caseloads among primary care physicians is accounted for by increases in care delivered by non-physician providers is an important area for future investigation.
There are other limitations. Additional years of pre-policy data before 2012 were not available to assess whether there were parallel trends in dual caseloads between PCPs and specialists and between the states with larger vs. smaller fee increases. We used summary measures of dual caseloads at the physician level that do not account for the amount of care each beneficiary received. The definition of duals in the Medicare PUF includes both full and partial benefit duals; among partial benefit duals, beneficiaries without cost-sharing assistance (e.g., Specified Low-income Beneficiaries) would not be subject to payment differentials, which could introduce noise into our estimates; they comprise about 15% of duals overall.35 Lastly, we cannot differentiate unique beneficiaries that visited multiple physicians.
Conclusion
In summary, we found that prior to most of the major ACA reforms, state reimbursement caps for dual-eligibles combined with low Medicaid payment rates were negatively associated with the proportion of duals on PCPs’ Medicare panels. The ACA fee bump did not have consistent effects on dual caseloads, and physicians’ dual caseloads declined between 2012–2017 raising concerns about potential worsening access to care for duals.
Supplementary Material
Acknowledgements:
We have not previously published this manuscript and it is not under consideration by another publication or electronic medium. An abstract with an earlier version of these findings was accepted for presentation at the 2020 ASHEcon (American Society of Health Economists) Annual Meeting, however the presentation was canceled due to COVID-19.
Funding: This study was funded by the Agency for Healthcare Research and Quality (1R01HS024725) and the National Institutes of Health (5R01MD010456). The funders had no role in the design and conduct of the study; collection, management, analysis, and interpretation of the data; preparation, review, or approval of the manuscript; and decision to submit the manuscript for publication.
Footnotes
Disclosures: Joseph P. Newhouse discloses that he was a director of Aetna until May 2018, held Aetna stock until November 2018, and currently owns stock in Novartis and Medtronic. There are no other relevant disclosures.
References
- 1.Congressional Budget Office. Dual-Eligible Beneficiaries of Medicare and Medicaid: Characteristics, Health Care Spending, and Evolving Policies. June2013. Available at: https://www.cbo.gov/sites/default/files/113th-congress-2013-2014/reports/44308_DualEligibles2.pdf.AccessedJuly 19, 2020.
- 2.Medicaid and CHIP Payment and Access Commission. Effects of Medicaid Coverage of Medicare Cost Sharing on Access to Care. March2015. Available at: https://www.macpac.gov/wp-content/uploads/2015/03/Effects-of-Medicaid-Coverage-of-Medicare-Cost-Sharing-on-Access-to-Care.pdf.AccessedJuly 19, 2020.
- 3.Kaiser Familty Foundation. Medicaid-to-Medicare Fee Index. 2016. Available at: https://www.kff.org/medicaid/state-indicator/medicaid-to-medicare-fee-index/?currentTimeframe=0&sortModel=%7B%22colId%22:%22Location%22,%22sort%22:%22asc%22%7D.AccessedJuly 19, 2020.
- 4.Berman S, Dolins J, Tang S-f, Yudkowsky B. Factors that influence the willingness of private primary care pediatricians to accept more Medicaid patients. Pediatrics 2002;110(2):239–248. [DOI] [PubMed] [Google Scholar]
- 5.Zuckerman S, McFeeters J, Cunningham P, Nichols L. Changes in medicaid physician fees, 1998–2003: implications for physician participation. Health Aff (Millwood) 2004;23:W4–374 – W4–384. [DOI] [PubMed] [Google Scholar]
- 6.Decker SL. In 2011 nearly one-third of physicians said they would not accept new Medicaid patients, but rising fees may help. Health Aff (Millwood) 2012;31(8):1673–1679. [DOI] [PMC free article] [PubMed] [Google Scholar]
- 7.Cohen JW, Cunningham PJ. Medicaid physician fee levels and children’s access to care. Health Aff (Millwood) 1995;14(1):255–262. [DOI] [PubMed] [Google Scholar]
- 8.Mitchell JB, Haber SG. State Payment Limitations on Medicare Cost-Sharing: Impacts on Dually Eligible Beneficiaries and Their Providers. July312003. https://web.archive.org/web/20060221045454/http://www.rti.org/pubs/statepaymentlimits.pdf.AccessedJuly 19, 2020. [DOI] [PubMed]
- 9.Centers for Medicare and Medicaid Services. Access to care issues among qualified Medicare beneficiaries (QMB). 2015. Available at: https://www.cms.gov/Medicare-Medicaid-Coordination/Medicare-and-Medicaid-Coordination/Medicare-Medicaid-Coordination-Office/Downloads/Access_to_Care_Issues_Among_Qualified_Medicare_Beneficiaries.pdf.AccessedJuly 19, 2020.
- 10.Burke G, Prindiville K. Improving the Qualified Medicare Benefit Program for Dual Eligibles. November2011. Available at: http://www.thescanfoundation.org/sites/default/files/nsclc_issue_brief_4_3.pdf.AccessedJuly 19, 2020.
- 11.Sloan F, Mitchell J, Cromwell J. Physician participation in state Medicaid programs. J Hum Resour. 1978;13Suppl:211–245. [PubMed] [Google Scholar]
- 12.Cunningham PJ, O’Malley AS. Do reimbursement delays discourage medicaid participation by physicians? Health Aff (Millwood). 2008;27:w17 – w28. [DOI] [PubMed] [Google Scholar]
- 13.Tollen L. Medicaid Primary Care Parity. Health Aff (Millwood). 2015. [Google Scholar]
- 14.Decker SL. No association found between the Medicaid primary care fee bump and physician-reported participation in Medicaid. Health Aff (Millwood). 2018;37(7):1092–1098. [DOI] [PubMed] [Google Scholar]
- 15.Mulcahy AW, Gracner T, Finegold K. Associations between the Patient Protection and Affordable Care Act Medicaid primary care payment increase and physician participation in Medicaid. JAMA Intern Med. 2018;178(8):1042–1048. [DOI] [PMC free article] [PubMed] [Google Scholar]
- 16.Polsky D, Richards M, Basseyn S, et al. Appointment availability after increases in Medicaid payments for primary care. N Engl J Med. 2015;372(6):537–545. [DOI] [PubMed] [Google Scholar]
- 17.Centers for Medicare and Medicaid Services: Office of Enterprise Data and Analytics. Medicare Fee-For-Service Provider Utilization & Payment Data Physician and Other Supplier Public Use FIle: A methodological Overview. 2019. Available at: https://www.cms.gov/Research-Statistics-Data-and-Systems/Statistics-Trends-and-Reports/Medicare-Provider-Charge-Data/Physician-and-Other-Supplier.AccessedSeptember 17, 2019.
- 18.U.S. Department of Housing and Urban Development: Office of Policy Development & Research. HUD-USPS Zip to County Crosswalk Files. 2019. Available at: https://www.huduser.gov/portal/datasets/usps_crosswalk.html.AccessedOctober 23, 2019.
- 19.Centers for Medicare and Medicaid Services. Medicare-Medicaid Dual Enrollment Snapshots - National, State, & County Annual Release 2007–2018. 2018.2019. Available at: https://www.cms.gov/Medicare-Medicaid-Coordination/Medicare-and-Medicaid-Coordination/Medicare-Medicaid-Coordination-Office/Analytics.AccessedNovember 15, 2019.
- 20.Federal Grant Funding. National Association of Community Health Centers. Policy Matters Web site. http://www.nachc.org/focus-areas/policy-matters/health-center-funding/federal-grant-funding/.Published2019. AccessedJune 13, 2019.
- 21.United States Department of Agriculture Economic Research Service. Rural-Urban Continuum Codes Documentation. October25, 2019. Available at: https://www.ers.usda.gov/data-products/rural-urban-continuum-codes/documentation/.AccessedJuly 19, 2020. [Google Scholar]
- 22.Grabowski DC, Joyce NR, McGuire TG, Frank RG. Passive Enrollment Of Dual-Eligible Beneficiaries Into Medicare And Medicaid Managed Care Has Not Met Expectations. Health Aff (Millwood). 2017;36(5):846–854. [DOI] [PMC free article] [PubMed] [Google Scholar]
- 23.Fung V, Price M, Hull P, Hsu J, Newhouse JP. Medicaid Crowd-Out for Dual-Eligible Beneficiaries Post-ACA: Did the Primary Care Fee Bump Help?Presented at AcademyHealth Annual Research Meeting; June2019; Washington, D.C. [Google Scholar]
- 24.Roberts ET, Nimgaonkar A, Aarons J, et al. New evidence of state variation in Medicaid payment policies for dual Medicare-Medicaid enrollees. Health Services Research. 2020;55(5):701–709. [DOI] [PMC free article] [PubMed] [Google Scholar]
- 25.Cunningham PJ, Nichols LM. The effects of Medicaid reimbursement on access to care of Medicaid enrollees: A community perspective. Med Care Res Rev. 2005;62(6):676–696. [DOI] [PubMed] [Google Scholar]
- 26.Farber J, Siu A, Bloom P. How much time do physicians spend providing care outside of office visits? Ann Intern Med. 2007;147(10):693–698. [DOI] [PubMed] [Google Scholar]
- 27.Hong CS, Abrams MK, Ferris TG. Toward increased adoption of complex care management. N Engl J Med. 2014;371:491–493. [DOI] [PubMed] [Google Scholar]
- 28.Agarwal SD, Barnett ML, Souza J, Landon BE. Medicare’s care management codes might not support primary care as expected. Health Aff (Millwood). 2020;39(5):828–836. [DOI] [PMC free article] [PubMed] [Google Scholar]
- 29.Gardner RL, Youssef R, Morphis B, DaCunha A, Pelland K, Cooper E. Use of chronic care management codes for medicare beneficiaries: a missed opportunity? J Gen Intern Med. 2018;33(11):1892–1898. [DOI] [PMC free article] [PubMed] [Google Scholar]
- 30.Medicaid and CHIP Payment and Access Commission. Chapter 8: An update on the Medicaid primary case payment increase. 2015. Available at: https://www.macpac.gov/wp-content/uploads/2015/03/An-Update-on-the-Medicaid-Primary-Care-Payment-Increase.pdf.AccessedJuly 19, 2020.
- 31.Gottlieb JD, Shapiro AH, Dunn A. The Complexity of Billing and Paying for Physician Care. Health Aff (Millwood). 2018;37(4):619–626. [DOI] [PubMed] [Google Scholar]
- 32.Centers for Medicare and Medicaid Services: Medicare-Medicaid Coordination Office. Data Analysis Brief: Managed Care Enrollment Trends among Dually Eligible and Medicare-only beneficiaries, 2006 through 2018. February2020. Available at: https://www.cms.gov/files/document/managedcareenrollmenttrendsdatabrief.pdf.AccessedJuly 17, 2020.
- 33.Center for Medicare Advocacy. Medicare Cost-Sharing for Dual Eligibles: Who Pays What for Whom? 2008. Available at: https://medicareadvocacy.org/medicare-cost-sharing-for-dual-eligibles-who-pays-what-for-whom/.AccessedJuly 19, 2020.
- 34.Xue Y, Smith JA, Spetz J. Primary Care Nurse Practitioners and Physicians in Low-Income and Rural Areas, 2010–2016. JAMA. 2019;321:4. [DOI] [PMC free article] [PubMed] [Google Scholar]
- 35.Centers for Medicare and Medicaid Services: Medicare-Medicaid Coordination Office. Data analysis brief: Medicare-Medicaid dual enrollment 2006 through 2018. 2019. Available at: https://www.cms.gov/Medicare-Medicaid-Coordination/Medicare-and-Medicaid-Coordination/Medicare-Medicaid-Coordination-Office/DataStatisticalResources/Downloads/MedicareMedicaidDualEnrollmentEverEnrolledTrendsDataBrief2006-2018.pdf.AccessedJuly 19,2020. [Google Scholar]
Associated Data
This section collects any data citations, data availability statements, or supplementary materials included in this article.