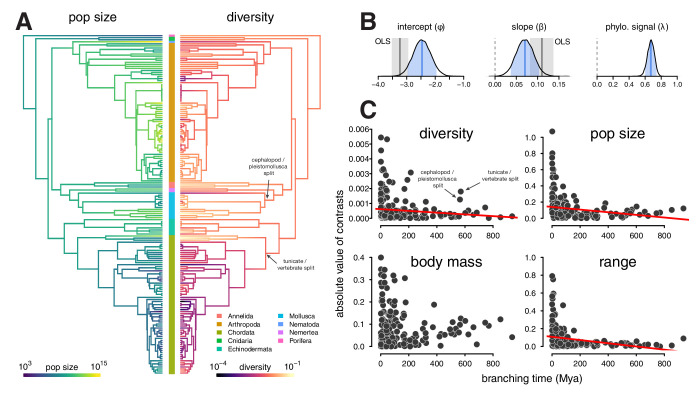
Figure 3. Phylogenetic comparative models of diversity and population size.
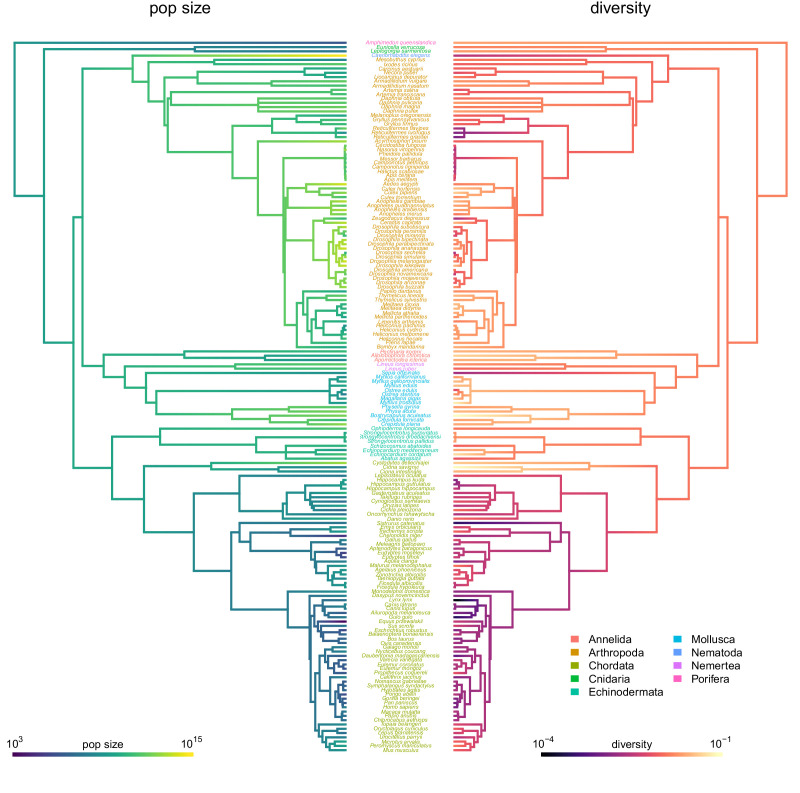
(A) The ancestral continuous trait estimates for the population size and diversity (differences per bp, log scaled) across the phylogeny of 166 taxa. The phyla of the tips are indicated by the color bar in the center. (B) The posterior distributions of the intercept, slope, and phylogenetic signal (λ, de Villemereuil and Nakagawa, 2014) of the phylogenetic mixed-effects model of diversity and population size (log scaled). Also shown are the 90% credible interval (light blue shading), posterior mean (blue line), OLS estimate (gray solid line), and bootstrap OLS confidence intervals (light gray shading). (C) The node-height tests of diversity, population size, and the two components of the population size estimates, body mass, and range (all traits on log scale before contrast was calculated). Each point shows the standardized phylogenetic independent contrast and branching time for a pair of lineages. Red lines are robust regression estimates (and are only shown for statistically significant relationships at the level). Note that some outlier pairs with very high phylogenetic independent contrasts were excluded (in all cases, these outliers were in the genus Drosophila).
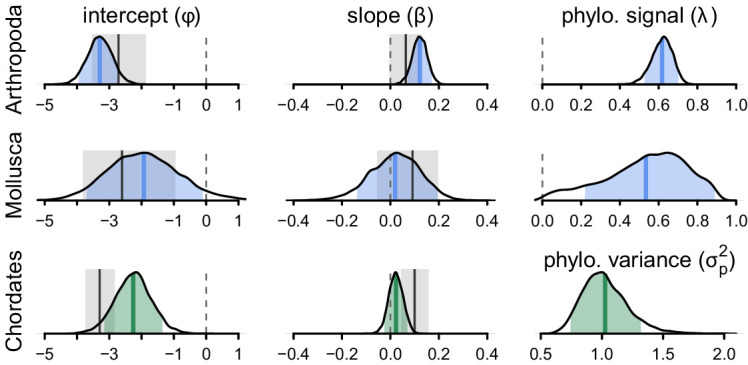
Figure 3—figure supplement 1. The posterior distributions for the parameters of the phylogenetic mixed-effects model of diversity and population size (this is analogous to Figure 3B) fit separately on chordates (), molluscs (), and arthropods ().


