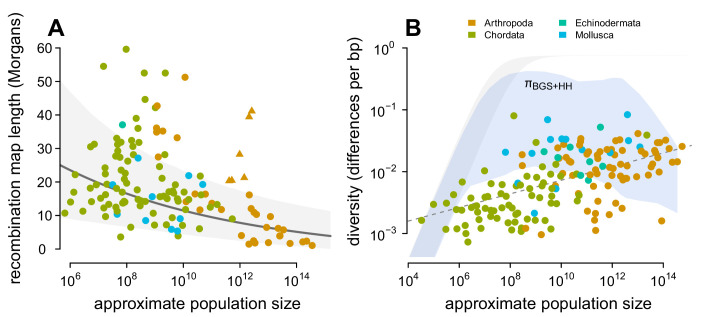
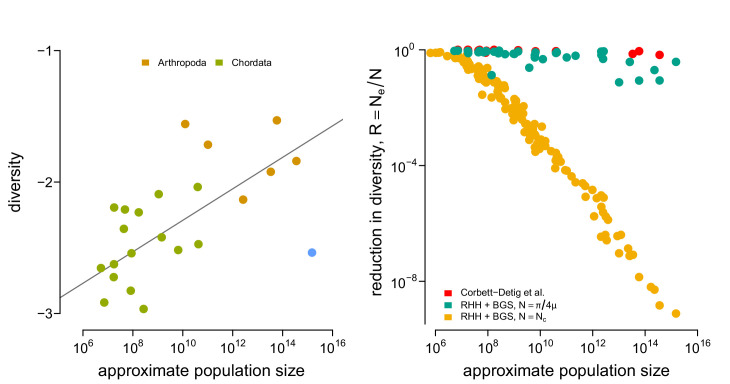
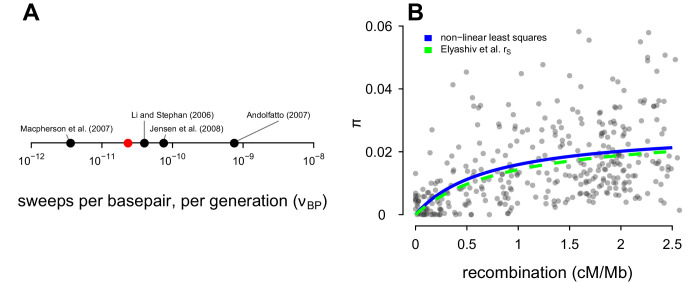
Figure 4. Predicting the impact of linked selection on diversity.
(A) The observed relationship between recombination map length () and census size () across 136 species with complete data and known phylogeny. Triangle points indicate six social taxa excluded from the model fitting since these have adaptively higher recombination map lengths (Wilfert et al., 2007). The dark gray line is the estimated relationship under a phylogenetic mixed-effects model, and the gray interval is the 95% posterior average. (B) Points indicate the observed π– relationship across taxa shown in Figure 2, and the blue ribbon is the range of predicted diversity were for –, and after accounting for the expected reduction in diversity due to background selection and recurrent hitchhiking under Drosophila melanogaster parameters. In both plots, point color indicates phylum.

